PILOT STUDY: Optical Leak Detection & Measurement - Flir Systems
PILOT STUDY: Optical Leak Detection & Measurement - Flir Systems
PILOT STUDY: Optical Leak Detection & Measurement - Flir Systems

Create successful ePaper yourself
Turn your PDF publications into a flip-book with our unique Google optimized e-Paper software.
<strong>PILOT</strong> <strong>STUDY</strong>:<br />
<strong>Optical</strong> <strong>Leak</strong> <strong>Detection</strong> & <strong>Measurement</strong><br />
Report Completed by:<br />
Terence Trefiak<br />
October 16, 2006
EXECUTIVE SUMMARY<br />
An <strong>Optical</strong> <strong>Leak</strong> <strong>Detection</strong> and <strong>Measurement</strong> Pilot Study was performed at 22<br />
CPC facilities from April-August 2006 by the HSE&SD Environmental<br />
Stewardship group. This innovative study represents a strong knowledge sharing<br />
opportunity both within the company and across the industry. The study objective<br />
was to test new technology to address the upcoming CAPP Best Management<br />
Practice (BMP) on Fugitive Emissions Management (referenced in the updated<br />
EUB Directive 60). The BMP will be released by the end of 2006 with<br />
implementation guidelines of one year. The study findings have been used to<br />
evaluate the possible benefits of using the technology to address a business unit<br />
wide application of a Fugitive Emission Management Plan for Canadian<br />
operations.<br />
The study identified 144 leaking components. Collectively, these leaks account<br />
58.26 mmcf/y and $358,012.10 USD/year in lost product. The methane leak<br />
sources contribute 21,420.7 tonnes/year CO2e to GHG emissions. It is estimated<br />
that 92% of the 144 fugitive sources are economical to repair. Implementing all<br />
economical repairs would result in a net present savings of $2,002,602.72 USD.<br />
# of<br />
Sources<br />
144<br />
<strong>Optical</strong> <strong>Leak</strong> <strong>Detection</strong> & <strong>Measurement</strong> Summary<br />
TOTAL OF ALL SOURCES TOTAL OF ALL ECONOMIC REPAIRS<br />
Total<br />
Yearly<br />
Rate<br />
(mcf/year)<br />
58258.1<br />
CO2e<br />
Emission<br />
Rate<br />
(tonnes/year)<br />
21,420.7<br />
Savings<br />
Potential<br />
(US$/year)<br />
$358,012.10<br />
Average<br />
Payback<br />
(years)<br />
0.37<br />
NPV (US$)<br />
$2,002,602.72<br />
i
TABLE OF CONTENTS<br />
EXECUTIVE SUMMARY………………………………………………………….i<br />
TABLE OF CONTENTS………………………………………………………..…ii<br />
1.0 INTRODUCTION………………………………………………………………1-4<br />
1.1 Scope…………………………………………………………………...1<br />
1.2 Background……………………………………………………………2-3<br />
1.3 <strong>Detection</strong> Technology………………………………………………..3<br />
1.4 <strong>Measurement</strong> Technology…………………………………………..4<br />
2.0 RESULTS……………………………………………………………………….4-5<br />
2.1 Source Summary……………………………………………………...4-5<br />
2.2 Facility Comparison…………………………………………………..5<br />
2.3 Economic Analysis……………………………………………………5<br />
2.4 Division-wide Projection……………………………………………..5<br />
3.0 RECOMMENDATIONS / CONCLUSIONS…..………………………………6<br />
4.0 REFERENCES………………………………………………………………….7<br />
5.0 ACKNOWLEDGMENTS……………………………………………………….7<br />
APPENDIX A – FACILITY COMPARISON GRAPHS………………………..…8-9<br />
APPENDIX B – METHODOLOGY…………………………………….…….......10-16<br />
LIST OF FIGURES<br />
Figure 1.0 Facility List……………………………………………………….…...1<br />
Figure 2.1 – Source Type………………………………………………………..4<br />
ii
1.0 INTRODUCTION<br />
1.1 Scope<br />
This study was initiated to evaluate new leak detection and measurement<br />
technologies and determine actual facility fugitive emission rates. The results of<br />
this study also help to evaluate the potential for a Canadian business unit<br />
application of the technology. The main drivers for this study are:<br />
– Increase production & reduce costs by recovering lost gas<br />
– CAPP Fugitive Emission Management BMP<br />
– Increase operations Health & Safety<br />
– Reduce GHG emissions / Carbon Credits<br />
– Part of CPC Energy Efficiency Program, Gas Star Program, and the<br />
Best-in-Class Initiative<br />
During the study, 22 facilities from various asset areas were assessed for fugitive<br />
emissions. This included 9 gas plants and 13 compressor stations (see Figure<br />
1.0 – Facility List). The fugitive sources were identified, tagged and measured.<br />
For each source, the repair costs were determined and a cost benefit analysis<br />
was performed to determine the economic feasibility of the repair. The field<br />
assessments were preformed by two engineers from the HSE Environmental<br />
Stewardship Team (Terence Trefiak and Roxanne Pettipas). For detailed<br />
methodology, see APPENDIX B - METHODOLOGY.<br />
Figure 1.0 Facility List<br />
GAS PLANTS<br />
NAME LOCATION<br />
Elmworth GP 1-8-71-11W6<br />
Morrin GP 8-11-31-21W4<br />
Ring Border GP C-81-I/94-H-9<br />
Alder Flats GP 10-9-45-8W5<br />
Viking GP 13-31-48-12W4<br />
South Ring GP C-81-I/94-H-10<br />
Connersville GP 9-32-25-15W4<br />
Vulcan GP 8-24-15-22W4<br />
Majorville GP 4-31-18-19W4<br />
COMPRESSOR STATIONS<br />
NAME LOCATION<br />
Sunchild CS 10-34-43-11W5<br />
Brazion CS A-39-F/93-P-4<br />
Boulder CS B-41-K/93-O-8<br />
Bullmoose CS D-83-G/93-O-8<br />
Brazeau CS1 6-11-45-13W5<br />
Brazeau CS2 4-28-45-13W5<br />
Brazeau CS3 7-30-45-12W5<br />
Ferrier CS1 4-13-41-09W5<br />
Ferrier CS2 13-2-40-9W5<br />
Ferrier CS3 13-1-40-8W5<br />
Nordegg CS1 7-26-44-12W5<br />
Nordegg CS2 6-22-44-12W5<br />
Nordegg CS3 10-25-44-13W5<br />
1
1.2 Background<br />
As part of its Energy Efficiency Program, ConocoPhillips is developing various<br />
projects and initiatives to conserve energy, recover natural gas, and increase<br />
production. These projects are also important because they reduce GHG<br />
emissions which have added health and safety, environmental and economic<br />
benefits. This report contains the results of a Gas Recovery Pilot Study based<br />
on the identification, measurement and repair of fugitive emissions from CPC<br />
facilities.<br />
In 2005, Burlington Resources purchased an infrared camera to study<br />
hydrocarbon leaks from gas processing facilites. The camera, GasfindIR, is an<br />
optical emission technology. It is an infrared video camera with<br />
hydrocarbon/VOC filter that provides visible images of hydrocarbon gas<br />
emissions in real-time. This application was applied to ConocoPhillips Canada<br />
including both heritage companies. ConocoPhillips Canada is the first upstream<br />
oil and gas company in Canada to use this technology for detecting and tracking<br />
fugitive emissions.<br />
Fugitive emissions are natural gas leaks that are emitted to the atmosphere from<br />
gas processing equipment. The source of these emissions can either be<br />
intentional (i.e. venting from tanks, controllers, comp. seals, stacks, etc.) or<br />
unintentional (i.e. equipment wear and tear / damage, improper or incomplete<br />
assembly of components, manufacturing defects, etc.) These emissions<br />
potentially cost industry millions of dollars in lost product and may pose safety<br />
risks to workers and the public. These fugitive emissions also account for a<br />
significant amount of the total inventory of greenhouse gases emitted by the Oil<br />
and Gas Industry.<br />
On average, natural gas processing plants lose between 0.05 to 0.5% of their<br />
total production to fugitive emissions (based on CPC emissions inventory).<br />
These emissions have traditionally been classified as shrinkage; however, up to<br />
96% of these emissions can be profitably prevented by identification and repair<br />
(Ref.1). Based on CPC production, fugitive gas loses may amount to between<br />
$2,000,000 and $20,000,000 USD per year in lost product (@ $5.50<br />
USD/mmbtu). This provides a significant opportunity to increase production<br />
through fugitive emission reduction. Fugitive emissions exist because leaks are<br />
invisible, unregulated and usually go unnoticed.<br />
Fugitive emissions (both intentional and unintentional) make up approximately<br />
84% of all methane emissions in the Canadian upstream oil and gas industry<br />
(Ref. 1.). Based on CPC emission inventories, fugitive emission account for<br />
2
about 25% of total GHG emissions. The reduction of these fugitives could have<br />
a significant impact on CPC’s total tonnage of GHG emitted.<br />
There are currently no regulations that apply specifically to the control of<br />
emissions from fugitive equipment leaks from upstream oil and gas facilities in<br />
Canada. However, CAPP (Canadian Association of Petroleum Producers) has<br />
released a Best Management Practice (BMP) titled Management of Fugitive<br />
Emissions at Upstream Oil and Gas Facilities. The BMP identifies the typical<br />
key sources of fugitive emissions at UOG facilities, presents strategies for<br />
achieving cost-effective reductions in these emissions and summarizes key<br />
considerations and constraints.<br />
An effective Fugitive Emission Management Plan should entail a leak<br />
assessment program in order to identify, quantify, and remediate fugitive<br />
emissions. Conventional leak assessment programs check individual process<br />
components using handheld detectors. It is generally estimated that the majority<br />
of fugitive emissions arise from a minority of leaking components. Conventional<br />
leak assessment programs are very time consuming, because every connection<br />
must be assessed individually. A typical plant can have up to 500,000 points that<br />
must be checked manually with a ‘‘Gas Sniffer’‘ placed directly on the leak, which<br />
is an expensive and time consuming process. Currently CPC does not have a<br />
company-wide formal consistent fugitive emission management plan.<br />
1.3 <strong>Detection</strong> Technology<br />
<strong>Optical</strong> emission detection is a new technology that has been developed to<br />
provide rapid, accurate and safe identification of fugitive emissions. This<br />
technology enables the technician to “see” emissions of hydrocarbon vapours<br />
such as methane that are normally invisible. The camera provides visible images<br />
of a gas emission leak in real-time against the facility background. The image<br />
facilitates precise identification of the origin of the leak, essential for repair<br />
activities, and qualitatively the magnitude of the leak based on plume size and<br />
density. The GasFindIR infrared video camera is the first commercial optical leak<br />
detection camera and is priced at $75,000.00 USD.<br />
The benefits of optical leak imaging include:<br />
• Cost-effectively scan hundreds of components simultaneously<br />
• Identify exact source of leaks in real-time with video record<br />
• Assessments performed without interruption of operations<br />
• Scan hard-to-reach components from a distance<br />
• Conduct aerial leak surveys over large areas<br />
3
1.4 <strong>Measurement</strong> Technology<br />
After a leak is detected, it is then measured to determine the size of the leak<br />
using a HiFlow Sampler. The <strong>Leak</strong> <strong>Detection</strong> technician will first determine a<br />
qualitative measurement by estimating the severity of the leak (low, medium,<br />
high). A quantitative measurement is then performed using a HiFlow Sampler.<br />
The HiFlow Sampler is the primary method used to measure emission rates from<br />
leaking equipment components. Compared to conventional<br />
concentration/correlation measurement estimation methods, the HiFlow Sampler<br />
offers a much higher accuracy of measurement which allows an objective costbenefit<br />
analysis of each repair opportunity. The uncertainties in the correlation<br />
estimations on an individual component basis are ± two orders of magnitude and<br />
the use of stratified emission factors is even less reliable. In comparison, the<br />
results of HiFlow Sampler contain certainties of only about ±10 to 15 percent.<br />
The HiFlow Sampler cost $14,000.00 USD.<br />
2.0 RESULTS<br />
2.1 Source Summary<br />
The study identified a total of 144 fugitive emission sources within the facilities.<br />
The leaks had an average size of 0.77 cfm with a total cumulative annually<br />
amount of 58.26 mmcf/y.<br />
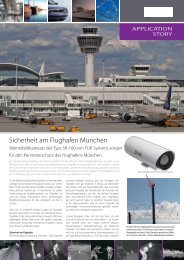
The graph below represents the distribution of leak source types (i.e. threaded<br />
connections, flanges, valves and vents) and total associated leak volumes.<br />
Figure 2.1 – Source Type<br />
Percentage of Total<br />
90%<br />
80%<br />
70%<br />
60%<br />
50%<br />
40%<br />
30%<br />
20%<br />
10%<br />
0%<br />
15%<br />
7%<br />
23%<br />
77%<br />
27%<br />
5%<br />
Flanges Vents Treaded<br />
Connections<br />
Sources<br />
Total # of<br />
Sources<br />
Total Volume of<br />
Sources<br />
35%<br />
11%<br />
Valves<br />
4
The majority of the sources were process gas (75%), followed by fuel gas (21%)<br />
and propane (4%). Most of the sources were found in Compressor Buildings<br />
(72%), followed by Process Buildings (20%). The remaining sources were<br />
located at outside piping (4%) and tanks (4%).<br />
The study results show that the largest sources were, compressor seal and<br />
controller vents, distance piece doors, fuel gas lines and regulators and vent<br />
stacks<br />
The leaks identified pose a moderate to high safety risk as they may contribute to<br />
higher levels of hydrocarbon within the facilities. These leaks may create levels<br />
that exceed 10% of the Lower Explosive Limit within the direct area of the leak<br />
(0-50 cm)<br />
2.2 Facility Comparison<br />
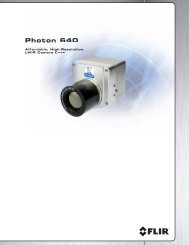
In this study, there was no evidence of a correlation between facility throughput<br />
and leak rate. There was, however, some correlation between facility age and<br />
leak rate (see APPENDIX A – FACILITY COMPARISON GRAPHS).<br />
2.3 Economic Analysis<br />
It is estimated that 92% (132) of the leaks are economical to repair resulting in a<br />
potential savings of $358,012.10 USD/year (@ $5.50 USD/mmbtu), a net present<br />
savings of $2,002,602.72 USD (@ 13% discount rate) and GHG emission<br />
reduction of 21,420.7 tonnes CO2e/year. The average payout period is 0.37<br />
years. Based on an average Carbon Credit value of $25 USD/tonne CO2e (from<br />
the draft corporate estimate on CO2 pricing), these methane leaks could be<br />
worth an additional $535,518.25 USD/year.<br />
2.4 Canadian Business Unit Projection<br />
An estimation of total economic benefit of a business unit wide fugitive<br />
assessment implementation has been developed using the results of the study.<br />
This estimation is based on the total number of gas plants and compressor<br />
stations currently owned by CPC (64 gas plants and 580 compressor stations).<br />
Note that this estimation could grow significantly by the addition of oil batteries<br />
and wellsites (which were not included in this study). From the study, the<br />
average potential yearly savings is $16,000.00 USD, and the average cost of the<br />
assessment and all repairs is $8,000.00 USD. This translates to a total gross<br />
estimated annual savings of $10,400,000.00 USD and a corresponding NPV of<br />
$58,000,000.00 USD.<br />
The recovered gas would equate to a yearly reduction of 630,000 tonnes CO2e,<br />
which represents a 67% reduction in total estimated fugitive GHG and a 19%<br />
reduction in total direct GHG emissions. This GHG reduction would have a<br />
carbon credit value of $15,750,000.00 USD.<br />
5
3.0 RECOMMENDATIONS / CONCLUSIONS<br />
From the results of this pilot study it is recommended that a business unit wide<br />
Fugitive Management Plan be implemented. This would entail the development<br />
of an assessment schedule to address each facility. The CAPP Fugitive<br />
Emission Management BMP suggests a four year implementation plan. The<br />
BMP bases facility priority on total throughput. Applying this practice to CPC<br />
would entail assessing an average of 150 facilities/year, which would incur<br />
approximately 70 assessment days/year. If a more aggressive program is<br />
determined to be preferential, it is feasible that the BMP schedule could be<br />
doubled to 140 assessment days/ year, which would complete all facilities in 2<br />
years. The resources for performing assessments are currently being evaluated and<br />
will be determined by the Environmental Stewardship group to address the proposed<br />
program.<br />
Following the initial assessments, a 2-year rotational maintenance schedule<br />
should be implemented. The facility assessments during the maintenance<br />
schedule should generally incur less time and cost due to reduced leak rates.<br />
The maintenance phase of the Fugitive Management Plan also includes the<br />
involvement of Facility Operators and Facility Design. Operations will be<br />
responsible to assess high priority components (identified in the BMP and from<br />
assessments) using a handheld TVA “Sniffer” and soap solution on an ongoing<br />
schedule. Maintenance schedules should include connection torque checks.<br />
The design of facilities should also be influenced by the use of equipment that<br />
reduce or eliminate fugitive sources (i.e. low-bleed pneumatics, vent and flare<br />
flow meters, vapour recovery units, etc.)<br />
Through industry studies, gas pipeline leaks have been identified as high<br />
contributors to fugitive emissions. <strong>Optical</strong> leak detection has successfully been<br />
used in pipeline assessments in the United States (Ref. 3) Therefore; it is<br />
recommended that a pipeline leak assessment pilot study be conducted to<br />
evaluate the benefits of adding pipeline surveys into the CPC Fugitive Emission<br />
Management Plan.<br />
The results of this study have identified that there are significant benefits to the<br />
use of optical emission detection and measurement with CPC. The<br />
implementation of a business unit wide Fugitive Emission Management Plan<br />
would help to reduce health and safety hazards, GHG emissions, costs (fuel gas<br />
and propane usage) and increase production. This innovative study represents a<br />
strong knowledge sharing opportunity both within the company and across the<br />
industry and ConocoPhillips Canada is willing to be a leader in addressing<br />
Fugitive Emissions.<br />
6
4.0 REFERENCES<br />
1. EPA Natural Gas Star Lessons Learned From Natural Gas STAR<br />
Partners: “DIRECTED INSPECTION AND MAINTENANCE AT GAS<br />
PROCESSING PLANTS AND BOOSTER STATIONS” October 2003<br />
2. John Squarek(Canadian Association of Petroleum Producers), Michael<br />
Layer (Environment Canada) and David Picard (Clearstone Engineering<br />
Ltd.) “DEVELOPMENT OF A BEST MANAGEMENT PRACTICE IN<br />
CANADA FOR CONTROLLING FUGITIVE EMISSIONS AT UPSTREAM<br />
OIL AND GAS FACILITIES”. Presentation. September 14-16, 2005.<br />
3. EPA Natural Gas Star “PARTNER UPDATE” Fall 2005.<br />
5.0 ACKNOWLEDGMENTS<br />
• Mike Frampton (CPC HSE VP and former Burlington EH&S Manager)<br />
inspired the research of the optical emission technology and supported the<br />
development of the pilot study.<br />
• Lloyd Visser (Manager Environment) has provided guidance and support<br />
to the study and has helped to promote company-wide implementation.<br />
• Roxanne Pettpas (CPC Air Emissions Coordinator) helped to schedule<br />
and perform the facility assessments. Without her help and valuable<br />
input, the study would have taken considerably longer to complete.<br />
• The following CPC Field Operations staff supported the fugitive<br />
assessments at their facilities and provided valuable assistance,<br />
knowledge sharing and guidance:<br />
- Dale Gobin - Terry Hoogenboom<br />
- Jim Pask - Ken Leschert<br />
- Ron Gamroth - Dale Luscombe<br />
- Brian Ewart - Sandy Warburton<br />
- Bill Sheets - Randy Heilman<br />
- Steve Wilton<br />
7
APPENDIX A<br />
FACILITY COMPARISON<br />
GRAPHS<br />
8
Graph #1 – Throughput vs. Potential Savings<br />
Throughput (mmcf/year)<br />
120000.00<br />
100000.00<br />
80000.00<br />
60000.00<br />
40000.00<br />
20000.00<br />
0.00<br />
Elmworth GP<br />
South Ring GP<br />
Ring Border GP<br />
Viking GP<br />
Facility<br />
Morrin GP<br />
Alder Flats GP<br />
Vulcan GP<br />
Majorville GP<br />
$-<br />
Connersville GP<br />
$60,000.00<br />
$50,000.00<br />
$40,000.00<br />
$30,000.00<br />
$20,000.00<br />
$10,000.00<br />
Graph #2 – Facility Age vs. Potential Savings<br />
Facility Age (years)<br />
50<br />
45<br />
40<br />
35<br />
30<br />
25<br />
20<br />
15<br />
10<br />
5<br />
0<br />
Vulcan GP<br />
Morrin GP<br />
Viking GP<br />
Connersville GP<br />
Facility<br />
Elmworth GP<br />
Majorville GP<br />
Alder Flats GP<br />
Ring Border GP<br />
$0.00<br />
South Ring GP<br />
$60,000.00<br />
$50,000.00<br />
$40,000.00<br />
$30,000.00<br />
$20,000.00<br />
$10,000.00<br />
Potential Savings (USD/year)<br />
Potential Savings (USD/year)<br />
9
APPENDIX B<br />
METHODOLOGY<br />
10
LEAK DETECTION & MEASUREMENT METHODOLOGY<br />
This section describes the methodology used by the assessment team to identify<br />
and measure fugitive emissions at upstream oil and gas facilities.<br />
1.0 EMISSION DETECTION & MEASUREMENT<br />
The main purpose of the site assessment includes the following:<br />
• screening of equipment components to detect leaks<br />
• measurement of emission rates from identified leaking equipment<br />
• cost-benefit analysis of the identified opportunities<br />
Please note that the term “leak” in this report refers to all fugitive<br />
hydrocarbon emissions that may be accidental (i.e. leaking connection) or<br />
intentional (i.e. vents). Whether accidental or intentional leaks, these<br />
assessments are meant to determine the size of emission and suggest<br />
possible solutions to recover product.<br />
1.1 Health Safety and Environment<br />
All work performed during <strong>Leak</strong> <strong>Detection</strong> Assessments follow all applicable:<br />
• Health Safety and Environmental Regulations<br />
• ConocoPhillips HSE Policies and Procedures<br />
• A customized set of Safe Operating Procedures<br />
Note: If at any point during the assessment a safety hazard is identified that may<br />
affect the health and safety of the <strong>Leak</strong> <strong>Detection</strong> Operators, the assessment is<br />
stopped, the Site Operator is informed and a hazard assessment is preformed.<br />
The leak detection assessment will only proceed after the hazards have been<br />
assessed and controlled.<br />
1.2 <strong>Detection</strong> Technology<br />
The assessments are performed using an optical emission technology known as<br />
the GasFindIR infrared video camera. <strong>Optical</strong> emission detection is a new<br />
technology that has been developed to provide rapid, accurate and safe<br />
identification of fugitive emissions. This technology enables the operator to “see”<br />
emissions of methane and volatile organic compounds (VOC’s) that are normally<br />
invisible. The camera provides visible images of a gas emission leak in real-time<br />
against the facility background. The image facilitates precise identification of the<br />
origin of the leak, essential for repair activities, and qualitatively the magnitude of<br />
the leak based on plume size and density.<br />
The benefits of optical leak imaging include:<br />
• Cost-effectively scan hundreds of components simultaneously<br />
• Identify exact source of leaks in real-time<br />
11
• Access directly with portable, battery-powered camera<br />
• Assessments performed without interruption of operations<br />
• Scan hard-to-reach components from a distance<br />
• Conduct aerial leak surveys over large areas<br />
1.3 <strong>Leak</strong> <strong>Detection</strong> Screening<br />
<strong>Leak</strong> detection screening is performed on all hydrocarbon systems (fuel gas, gas<br />
and light- liquid). The types of components surveyed include (but not limited to)<br />
flanged and threaded connections (i.e., connectors), valves, pressure-relief<br />
devices, open-ended lines, blow-down vents, instrument fittings, regulator and<br />
actuator diaphragms, compressor seals, engine and compressor crankcase<br />
vents, sump, drain tank vents and tank hatch seals.<br />
Prior to conducting the assessment, a facility map or site tour is obtained via the<br />
Site Operator. An assessment plan is then developed which determines the<br />
order at which each facility process will be assessed. The plan may be based on<br />
the priority of the process building/site or simply on the accessibility (layout) of<br />
each process.<br />
Each process building/site is scanned in two phases. The first phase is an<br />
exterior scan looking at external equipment. The second phase is an internal<br />
scan which inspects all equipment within the facility building. The scanning<br />
methodology follows a general path of scanning each piece of relevant<br />
equipment working form one end of the process to the other. Where applicable,<br />
each piece of equipment is scanned from at least two separate view points to<br />
increase the probability of spotting a leak. Generally, each piece of equipment is<br />
first scanned form a wide angle (a larger view point) and then a more detailed<br />
scan is performed at a more focused depth (smaller/ closer viewpoint). During<br />
the detailed scan, the camera operator will usually scan over the same area a<br />
number of times to ensure a high probability of leak detection.<br />
When a leak is detected, a video record is taken at an angel and range which<br />
optimizes the visibility of the leak. The video record is at a minimum of 10<br />
seconds in length. When applicable, after identification with the camera, a<br />
bubble test is performed on the detected leak to confirm the leak source. The<br />
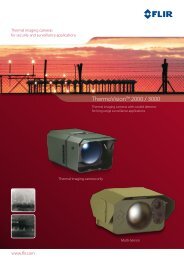
leak details are then recorded and the leak is then marked with a <strong>Leak</strong><br />
<strong>Detection</strong> ID Tag (See Figure 1.0). The tag is placed as close to the leak source<br />
as safely possible. In certain instances, the location or conditions of the<br />
equipment prevents a tag form being placed close to the leak source. In this<br />
case, the tag is placed in the nearest safe location. All tags are left in place to<br />
allow for follow-up action by facility personnel and may be removed by operations<br />
when the identified source is repaired.<br />
12
Figure 1.0 <strong>Leak</strong> <strong>Detection</strong> Tag<br />
Front:<br />
LEAK DETECTION ID TAG<br />
TAG ID#: 00100<br />
Date: Time: :<br />
Equipment<br />
Name / Type:<br />
<strong>Leak</strong> Source:<br />
<strong>Leak</strong> Rate cu. ft. / min.<br />
Back:<br />
CAUTION<br />
DO NOT REMOVE THIS LEAK ID TAG<br />
UNTIL EQUIPMENT IS REPAIRED AND<br />
REASSESSED WITH OPTICAL LEAK<br />
DETECTION<br />
NOTE: Upon repair of this leak contact<br />
Terence Trefiak @ (403) 233-3371<br />
1.4 <strong>Leak</strong>-Rate <strong>Measurement</strong>s<br />
1.4.1 HiFlow Sampler<br />
After a leak is detected it is then measured to determine the size of the leak in<br />
cubic feet per minute (cfm). The <strong>Leak</strong> <strong>Detection</strong> Operator will first determine a<br />
qualitative measurement by estimating the severity of the leak (low, medium,<br />
high). A quantitative measurement is then performed using a HiFlow Sampler.<br />
The HiFlow Sampler is the primary method used to measure emission rates from<br />
leaking equipment components. Compared to conventional<br />
concentration/correlation measurement estimation methods, the HiFlow offers a<br />
much higher accuracy of measurement which allows an objective cost-benefit<br />
analysis of each repair opportunity. The uncertainties in the correlation<br />
estimations on an individual component basis are ± two orders of magnitude and<br />
the use of stratified emission factors is even less reliable. In comparison, the<br />
results of HiFlow contain certainties of only about ±10 to 15 percent. The<br />
reliability and use of the HiFlow Sampler has been demonstrated in a number of<br />
studies.<br />
A dual-element hydrocarbon (methane) detector (i.e., catalytic-oxidation/thermal<br />
conductivity), inserted directly in the main sample line within the HiFlow,<br />
measures hydrocarbon concentrations in the captured air stream ranging from<br />
0.01 to 100 percent. In instances where the leaking hydrocarbons are not<br />
13
methane, the leak rate is estimated based on a visual qualitative estimate, the<br />
HiFlow rate, and correlations based on gas concentration (US EPA Method 21).<br />
A background sample-collection line and hydrocarbon detector allows the sample<br />
readings to be corrected for ambient gas concentrations, which is particularly<br />
important in buildings and confined areas. A vane anemometer, also inserted<br />
directly into the main sample line, monitors the mass flow rate of the sampled airhydrocarbon<br />
gas mixture. The sample and background hydrocarbon detectors in<br />
the HiFlow Sampler were calibrated to 100 percent methane and 2.5 percent<br />
methane-in-air to cover both ranges of the dual-element detector system. Zeroing<br />
of the detectors is performed using ambient air upwind of the facilities. The<br />
calibrations are performed prior to use of the HiFlow Sampler at the site, and<br />
then periodically during the measurement work to ensure that no significant drift<br />
had occurred. The HiFlow Sampler is also calibrated periodically by releasing<br />
known flow rates of methane into the sampler inlet and comparing the leak rate<br />
measured by the HiFlow .<br />
<strong>Leak</strong> rates are measured at two separate flow rates (high and low) to ensure that<br />
an accurate sample is taken. Generally, the higher leak rate of these two<br />
measurements will be used as the final leak rate number. The HiFlow Sampler<br />
data logs all saved leak rates, which are transferred to an electronic spreadsheet.<br />
The recorded leak rate may be lower than the actual leak rate due to inability to<br />
capture the leak. In these cases the actual leak rate is estimated based on the<br />
recorded rate and the leak video record. In addition, not all leak rates are saved<br />
to the HiFlow data logger, some leak rates are only recorded on hard copy.<br />
The HiFlow Sampler is intrinsically safe and is equipped with a grounding wire to<br />
dissipate any static charge that may accumulate as air passes through the<br />
sample collection line and instrument.<br />
Specific cases where the HiFlow Sampler is not used include any components<br />
leaking at rates above the upper limit of the unit (i.e. above about 14 m 3 /h or 500<br />
ft 3 /h) and equipment in inaccessible or unsafe locations. Alternative<br />
measurement techniques in which the HiFlow Sampler can not be used are<br />
discussed in the next section.<br />
1.4.2 Alternative <strong>Measurement</strong> Techniques<br />
When flow rates are encountered higer than the capabuility of the HiFlow<br />
Sampler, emission rates are measured using an appropriate flow-through<br />
measurement device (i.e., a precision rotary meter, diaphragm flow meter, or<br />
rotameter, depending on the flow rate)<br />
Each flow measurement is typically averaged over a 10 to 20 minute time<br />
interval, depending on the amount and steadiness of the flow. Flow velocities<br />
were measured using a hot-wire anemometer or thermal dispersion anemometer.<br />
The traverse points are selected in general accordance with US EPA Methods 1<br />
and 1A.<br />
14
When measuring flows from vents, a distinction is made between continuous and<br />
intermittent vent systems. Emissions from intermittent vents during inactive<br />
periods are defined as leakage. Emissions from continuous vent systems and<br />
intermittent vent systems during venting events are defined as venting emissions.<br />
1.5 Emission Control Guidelines<br />
There are currently no regulations that apply specifically to the control of<br />
emissions from fugitive equipment leaks from upstream oil and gas facilities in<br />
Canada. However, CAPP (Canadian Association of Petroleum Producers) has<br />
released a Best Management Practice (BMP) titled Management of Fugitive<br />
Emissions at Upstream Oil and Gas Facilities. The BMP identifies the typical<br />
key sources of fugitive emissions at UOG facilities, presents strategies for<br />
achieving cost-effective reductions in these emissions and summarizes key<br />
considerations and constraints.<br />
2.0 COST BENEFIT ANALYSIS<br />
Each fugitive equipment leak is identified and assessed on a source-by-source<br />
basis. It is assumed that any opportunities to economically repair or control a<br />
source will be implemented and that repairs will be done as soon as is practical,<br />
or scheduled for the next plant turnaround if a plant shutdown is required to<br />
perform the work.<br />
The information and assumptions regarding estimated repair cost and repair life,<br />
the value of the gas lost, and other financial considerations used in this analysis<br />
are summarized below.<br />
2.1 Repair Cost/Life Estimating<br />
The basic cost to repair or replace a leaking equipment component is estimated<br />
based on the type and size of the component, typical service billing rates and the<br />
estimated amount of materials/equipment required. When possible, the actual<br />
cost of repair is obtained by the Facility Operator.<br />
It is assumed that a leak, once repaired, will remain fixed for a finite period of<br />
time, and then will reoccur. The mean time between failures is dependent on the<br />
type, style and quality of the component, the demands of the specific application,<br />
component activity levels (e.g., number of valve operations) and individual<br />
maintenance practices at the site. In a formal leak detection and repair program,<br />
information on mean times between failures is tracked on an ongoing basis and<br />
is used to identify problem service applications and to evaluate the potential need<br />
for changes to component specifications and maintenance practices.<br />
15
2.2 Value of Natural Gas and Process Gas<br />
The value of natural gas and propane used is taken from corporate forecasting<br />
values. The 2006 value of gases is based on a forecast of $5.50/mmBTU. This<br />
gives a natural gas value of $5.58/mcf and a propane value of $13.68/mcf.<br />
When available, the actual cost of purchased propane is obtained from the<br />
Facility Operators.<br />
2.3 Financial Values and Assumptions<br />
2.3.1 Financial Discount Rate<br />
The discount rate and opportunity cost of equity in the gas industry is 13%.<br />
2.3.2 Net Present Value (NPV)<br />
The net present value of each target control option is the present value of<br />
benefits minus the present value of costs. The analysis period in each case is the<br />
expected life of the control measure (e.g., the average repair life or mean time<br />
between leak occurrences).<br />
2.3.3 Payout Period<br />
The payout period of each target control option is the number of periods (years)<br />
required to payout the repair costs based on annual payments equal to the value<br />
of the net benefit of repairs.<br />
2.3.4 Annual Value<br />
The annual value of each leak is expressed as the amount of gas, in one year,<br />
which would be conserved if the leak were to be repaired.<br />
2.3.5 CO2e Calculations<br />
The amount of CO2e is calculated by totaling the annual methane amount<br />
(tonnes) of the emissions and multiplying this number by the Global Warming<br />
Potential of CH4 of 21. The methane tonnage was calculated using an average<br />
methane concentration in natural gas of 92.54%. The value of carbon is set at<br />
$25 USD per tones CO2e.<br />
16