

energy performance analysis of adnan menderes international airport
energy performance analysis of adnan menderes international airport
energy performance analysis of adnan menderes international airport

Create successful ePaper yourself
Turn your PDF publications into a flip-book with our unique Google optimized e-Paper software.
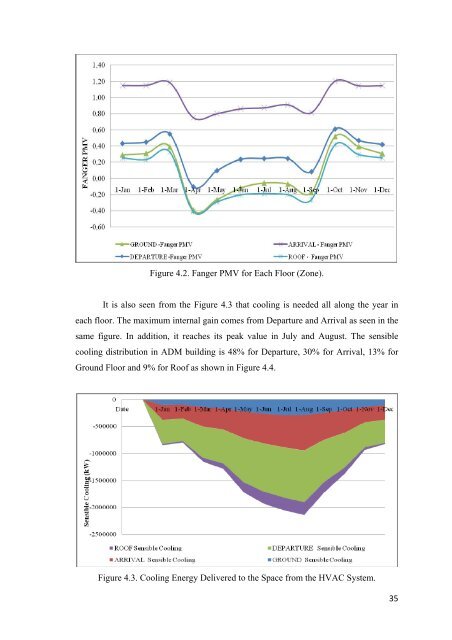
Figure 4.2. Fanger PMV for Each Floor (Zone).<br />
It is also seen from the Figure 4.3 that cooling is needed all along the year in<br />
each floor. The maximum internal gain comes from Departure and Arrival as seen in the<br />
same figure. In addition, it reaches its peak value in July and August. The sensible<br />
cooling distribution in ADM building is 48% for Departure, 30% for Arrival, 13% for<br />
Ground Floor and 9% for Ro<strong>of</strong> as shown in Figure 4.4.<br />
Figure 4.3. Cooling Energy Delivered to the Space from the HVAC System.<br />
35


