MERIS atmospheric water vapor correction model for Wide Swath ...
MERIS atmospheric water vapor correction model for Wide Swath ...
MERIS atmospheric water vapor correction model for Wide Swath ...

You also want an ePaper? Increase the reach of your titles
YUMPU automatically turns print PDFs into web optimized ePapers that Google loves.
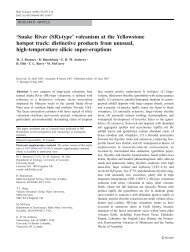
GRSL-00404-2011 <<br />
white crosses in Fig. 3(a)), 3-4 irregular fringes remain in the<br />
far field (mainly in the north part of the interferogram; Fig.<br />
3(b)). These residual phases are caused by the spatiotemporal<br />
variations of tropospheric <strong>water</strong> <strong>vapor</strong> distribution between the<br />
acquisitions, which are evident in the zenith path delay<br />
difference map (ZPDDM) derived from <strong>MERIS</strong> near IR <strong>water</strong><br />
<strong>vapor</strong> products (Fig. 4). After applying <strong>MERIS</strong> <strong>water</strong> <strong>vapor</strong><br />
<strong>correction</strong>, five parallel fringes (oriented approximately<br />
parallel to the track direction) can be observed in the far field<br />
(Fig. 3(c)). Note the grey strip in the right of the corrected<br />
interferogram is due to sub-swath 5 being outside the <strong>MERIS</strong><br />
coverage as previously mentioned. As shown in Fig. 3(d), the<br />
five parallel fringes disappeared after applying baseline<br />
refinement with 33 GCPs (indicated as white crosses in Fig.<br />
3(c)). Phase variation of the unwrapped WS interferogram in<br />
the far field (i.e. the area that did not undergo de<strong>for</strong>mation in<br />
the earthquake) decreased from 8.4 rad (equivalent to a LOS<br />
range change of 3.8 cm) without <strong>correction</strong> to 0.9 rad<br />
(equivalent to a LOS range change of 0.4 cm) after applying<br />
the <strong>MERIS</strong> <strong>water</strong> <strong>vapor</strong> <strong>correction</strong> <strong>model</strong>, implying that the<br />
unwrapped phase was much flatter after <strong>correction</strong>. Note that<br />
the reduction of the phase variation in the non-de<strong>for</strong>ming area<br />
can be representative of the per<strong>for</strong>mance of the <strong>MERIS</strong> <strong>water</strong><br />
Fig. 3. <strong>Wide</strong> swath Interferogram 030902-040608 in the radar coordinate<br />
system: (a) Original interferogram be<strong>for</strong>e baseline refinement; (b) Original<br />
interferogram after baseline refinement; (c) Interferogram with <strong>water</strong> <strong>vapor</strong><br />
<strong>correction</strong>; (d) <strong>water</strong> <strong>vapor</strong> corrected interferogram after baseline refinement.<br />
Note: (1) black crosses in (a) and (c) represent ground control points used in<br />
baseline refinement; (2) white rectangles in (a) and (c) denote the de<strong>for</strong>ming<br />
area due to the 2003 Bam earthquake.<br />
<strong>vapor</strong> <strong>correction</strong> <strong>model</strong> to the WS interferogram.<br />
In order to further validate the per<strong>for</strong>mance of our <strong>MERIS</strong><br />
<strong>correction</strong> <strong>model</strong>, a comparison was per<strong>for</strong>med between the<br />
corrected WS interferogram and the two-fault, variable-slip<br />
dislocation <strong>model</strong> of the 2003 Bam earthquake by Funning et<br />
al. [14]. Using IM interferograms from both ascending and<br />
descending tracks, Funning et al. [14] claimed that the<br />
de<strong>for</strong>mation pattern observed by InSAR can be best explained<br />
Fig. 4. (a) Zenith Wet Delays (ZWD) derived from <strong>MERIS</strong> near IR <strong>water</strong><br />
<strong>vapor</strong> products on 02 September 2003; (b) ZWD derived from <strong>MERIS</strong> near IR<br />
<strong>water</strong> <strong>vapor</strong> products on 08 June 2004; (c) ZPDDM = ZWD b - ZWD a . Note:<br />
(1) A conversion factor of 6.2 was employed to convert <strong>water</strong> <strong>vapor</strong> to ZWD,<br />
which can be calculated using surface temperature measurements obtained<br />
from radiosondes [3]; (2) Black rectangles denote the coverage of Fig. 3(c)<br />
and 3(d) and are identical to the coverage of the geocoded WS interferogram<br />
after <strong>water</strong> <strong>vapor</strong> <strong>correction</strong> as shown in Fig. 5(a).<br />
by slip on two subparallel faults: one blind strike-slip fault<br />
extending under the center of Bam and a second dipping<br />
64°W, striking parallel to, and east of, the main strike-slip<br />
fault. They showed the root mean squared (RMS) misfit of<br />
observed-to-<strong>model</strong>ed ground displacements was 1.3 cm in the<br />
near field with some residual fringes remaining due to<br />
Fig. 5. <strong>Wide</strong> <strong>Swath</strong> (WS) Interferograms superimposed on a SRTM DEM. (a)<br />
Corrected WS interferogram using <strong>MERIS</strong> <strong>correction</strong> <strong>model</strong>; (b) Modeled WS<br />
interferogram from the two fault variable slip <strong>model</strong> of the Bam earthquake by<br />
Funning et al. [13]; (c) residual interferogram. Note: Black rectangles denote<br />
the de<strong>for</strong>ming area due to the 2003 Bam earthquake.<br />
un<strong>model</strong>ed fault complexity.<br />
The <strong>water</strong> <strong>vapor</strong> corrected WS interferogram is shown in<br />
Fig. 5(a), the <strong>model</strong> WS interferogram in Fig. 5(b), and their<br />
residuals in Fig. 5(c). It is clear that the two-fault variable slip<br />
<strong>model</strong> by Funning et al. [14] can reproduce the main features<br />
of the WS interferogram. The misfit to the WS data in the near<br />
field is 1.1 cm, which is on the same order of that to the IM<br />
data (i.e. 1.3 cm) [14]. Note that the difference in the RMS<br />
misfit values obtained can be attributed to the different source<br />
of interferograms, and the sampling of the interferograms. On<br />
close inspection of the residual WS interferogram, it is found<br />
that the pattern of the remaining residual fringes is similar to<br />
that of the descending IM interferogram shown in [14, Fig.<br />
12(b)]. The RMS misfit of observed-to-<strong>model</strong>ed ground<br />
displacements to the whole corrected WS interferogram is 0.6<br />
cm. It is worth pointing out that the RMS misfit to the original<br />
WS interferogram (without <strong>water</strong> <strong>vapor</strong> <strong>correction</strong>) is 3.1 cm,<br />
suggesting a reduction of 2.5 cm due to tropospheric <strong>water</strong><br />
<strong>vapor</strong> effects in the WS interferogram in reference to the<br />
Funning’s variable-slip dislocation <strong>model</strong>.<br />
3