Group Interim Report January 1 to March 31, 2006 - Fraport AG
Group Interim Report January 1 to March 31, 2006 - Fraport AG
Group Interim Report January 1 to March 31, 2006 - Fraport AG

Create successful ePaper yourself
Turn your PDF publications into a flip-book with our unique Google optimized e-Paper software.
<strong>Interim</strong> <strong>Report</strong><br />
as at <strong>March</strong> <strong>31</strong>, <strong>2006</strong>
Contents<br />
2 Highlights and key figures<br />
3 Edi<strong>to</strong>rial<br />
4 The <strong>Fraport</strong> Share<br />
<strong>Interim</strong> <strong>Report</strong> as at <strong>March</strong> <strong>31</strong>, <strong>2006</strong><br />
4 Key figures and share price development<br />
5 Shareholder structure<br />
5 Dividend policy<br />
5 Inves<strong>to</strong>r Relations<br />
5 Employee investment plan<br />
6 Business development<br />
6 Development of air traffic<br />
7 Revenue and earnings<br />
8 Asset and financial situation<br />
8 Capital expenditure<br />
9 Cash flow statement<br />
10 Asset and capital structure<br />
11 Segment reporting<br />
11 Aviation<br />
12 Retail & Properties<br />
13 Ground Handling<br />
13 External Activities<br />
15 Employees<br />
15 Order situation<br />
16 Executive Board and organization<br />
16 Significant events after the balance sheet date<br />
17 Changes in risks and opportunities<br />
17 S<strong>to</strong>ck option plan<br />
17 Treasury shares<br />
17 Other financial commitments<br />
18 Outlook<br />
18 Airport expansion<br />
18 A380 maintenance facility<br />
18 FRA-North<br />
18 Business prospects<br />
19 Passenger numbers<br />
19 <strong>Group</strong> segments<br />
20 <strong>Group</strong> key figures for <strong>2006</strong><br />
20 Preview 2007<br />
21 <strong>Group</strong> <strong>Interim</strong> <strong>Report</strong> as at <strong>March</strong> <strong>31</strong>, <strong>2006</strong><br />
21 Consolidated income statement<br />
22 Consolidated balance sheet<br />
23 Consolidated cash flow statement<br />
24 Movements in consolidated shareholders’ equity<br />
25 Segment reporting<br />
26 Consolidated income statement, quarterly overview<br />
27 Notes<br />
27 Accounting policies<br />
28 Consolidated companies<br />
29 Explana<strong>to</strong>ry notes about selected balance sheet<br />
and income statement items<br />
30 Financial Calendar<br />
30 Contacts<br />
30 Imprint<br />
1
2 <strong>Interim</strong> <strong>Report</strong> as at <strong>March</strong> <strong>31</strong>. <strong>2006</strong><br />
Revenue<br />
€ million<br />
500<br />
400<br />
300<br />
200<br />
100<br />
30<br />
20<br />
10<br />
0<br />
0<br />
EBITDA<br />
€ million<br />
120<br />
90<br />
60<br />
30<br />
0<br />
480.9<br />
Q1 2005 Q1 <strong>2006</strong><br />
107.1<br />
<strong>Group</strong> profit<br />
€ million<br />
Q1 2005 Q1 <strong>2006</strong><br />
27.4<br />
487.4<br />
109.5<br />
27.5<br />
Q1 2005 Q1 <strong>2006</strong><br />
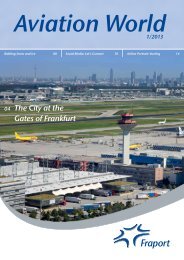
Highlights and key figures<br />
Despite a decrease in passenger numbers, business at the <strong>Fraport</strong> Consolidated <strong>Group</strong> grew in<br />
terms of revenue and EBITDA. We continue <strong>to</strong> hold on <strong>to</strong> the forecasts for the financial year and<br />
expect a further increase in revenue and EBITDA for this period.<br />
The <strong>Fraport</strong> share price continued its positive trend from 2005 in the first quarter of <strong>2006</strong> and<br />
reached a new all-time record price of € 66.77 on February 27, <strong>2006</strong>.<br />
The key data in relation <strong>to</strong> business development in the first three months of <strong>2006</strong> was as follows:<br />
•6.8% drop throughout the group mainly due <strong>to</strong> developments in Antalya, slight decrease in<br />
passenger numbers at Frankfurt Airport of 1.1% because of flight cancellations due <strong>to</strong> weather<br />
conditions and strike at other European airports as well as the shift of the Easter holidays.<br />
•9.8% increase in cargo volume.<br />
•<strong>Group</strong> revenue 1.4% above figures for the previous year with € 487.4 million.<br />
•2.2% 1 increase in EBITDA <strong>to</strong> € 109.5 million.<br />
•<strong>Group</strong> profit at the same level as previous year with € 27.5 million.<br />
•Earnings per share remained stable at € 0.30.<br />
Key figures<br />
€ million Q1 2005 Q1 <strong>2006</strong> Change 2005<br />
Revenue . . . . . . . . . . . . . . . . . . . . . . . . . . . . . . . . . . . . . . 480.9 . . . . . . . . . . 487.4 . . . . . . . . . . . . 1.4 . . . . . . . . 2,089.8<br />
EBITDA . . . . . . . . . . . . . . . . . . . . . . . . . . . . . . . . . . . . . . . 107.1 . . . . . . . . . . 109.5 . . . . . . . . . . . . 2.2 . . . . . . . . . . 547.5<br />
EBITDA margin . . . . . . . . . . . . . . . . . . . . . . . . . . . . . . . . 22.3% . . . . . . . . . 22.5% . . . . . . . . . . . . . – . . . . . . . . . 26.2%<br />
EBIT . . . . . . . . . . . . . . . . . . . . . . . . . . . . . . . . . . . . . . . . . . 56.8 . . . . . . . . . . . 54.7 . . . . . . . . . . – 3.7 . . . . . . . . . . <strong>31</strong>1.6<br />
EBT . . . . . . . . . . . . . . . . . . . . . . . . . . . . . . . . . . . . . . . . . . . 50.4 . . . . . . . . . . . 47.6 . . . . . . . . . . – 5.6 . . . . . . . . . . 290.4<br />
<strong>Group</strong> profit . . . . . . . . . . . . . . . . . . . . . . . . . . . . . . . . . . . . 27.4 . . . . . . . . . . . 27.5 . . . . . . . . . . . . 0.4 . . . . . . . . . . 161.5<br />
Earnings per share in € (basic) . . . . . . . . . . . . . . . . . . . . . 0.<strong>31</strong> . . . . . . . . . . . 0.30 . . . . . . . . . . – 3.2 . . . . . . . . . . . 1.78<br />
Shareholder’s equity 2 . . . . . . . . . . . . . . . . . . . . . . . . . . 2,071.2 . . . . . . . . 2,194.6 . . . . . . . . . . . . 6.0 . . . . . . . . . 2,157.9<br />
Total assets 2 . . . . . . . . . . . . . . . . . . . . . . . . . . . . . . . . . 3,729.6 . . . . . . . . 3,954.5 . . . . . . . . . . . . 6.0 . . . . . . . . 3,951.6<br />
Operating cash flow . . . . . . . . . . . . . . . . . . . . . . . . . . . . . 87.7 . . . . . . . . . . . 96.4 . . . . . . . . . . . . 9.9 . . . . . . . . . . 493.7<br />
Free cash flow . . . . . . . . . . . . . . . . . . . . . . . . . . . . . . . . . . 14.9 . . . . . . . . . . . 20.0 . . . . . . . . . . . 34.2 . . . . . . . . . . . 58.3<br />
Capital expenditures . . . . . . . . . . . . . . . . . . . . . . . . . . . . 144.3 . . . . . . . . . . . 97.3 . . . . . . . . . – 32.6 . . . . . . . . . . 682.4<br />
Average number of employees . . . . . . . . . . . . . . . . . . . 24,737 . . . . . . . . . 26,989 . . . . . . . . . . . . 9.1 . . . . . . . . . 25,781<br />
Since <strong>January</strong> 1, <strong>2006</strong>, other taxes are recorded in the operating result under other operating<br />
expenses. Accounting and the identification of the shares in consolidated trading partnerships<br />
was also changed (see notes). The figures for the previous year were adapted for the purpose of<br />
comparison.<br />
1 Since <strong>January</strong> 1, <strong>2006</strong>, other taxes are listed under other operating expenses. The figures for the previous year were adjusted<br />
for comparison purposes.<br />
2 On the record date.<br />
in %
Edi<strong>to</strong>rial<br />
Dear Sir or Madam,<br />
dear Shareholders,<br />
As we all know, <strong>2006</strong> will be a year of challenges for <strong>Fraport</strong>: the closure of the US Air Base will mean a loss<br />
of fees from military traffic, the new ground handling contract with Lufthansa means that we can expect<br />
less revenue, and we have <strong>to</strong> cope with the effects resulting from the change <strong>to</strong> the new cost-based usage<br />
fees. At the same time, we have <strong>to</strong> absorb the cost of the additional security requirements demanded by the<br />
EU. It was not possible <strong>to</strong> predict the difficult winter weather conditions, which led <strong>to</strong> an above-average<br />
number of flight cancellations and additional expenses on snow clearance and deicing.<br />
Nonetheless, we did well in the first quarter of the current business year. Despite the extra expenses, our<br />
profits are mostly at or slightly above the levels achieved in the previous year. This is an affirmation of the<br />
work we have done in the past, but, of course, is no reason for us <strong>to</strong> rest on our laurels.<br />
The air traffic industry is still undergoing a process of structural change and the established airlines need <strong>to</strong><br />
find a response <strong>to</strong> the attacks from low-cost airlines. The resulting demands on airports can be summarized<br />
in a single sentence: we need <strong>to</strong> offer higher process quality with less expensive cost structures. Frankfurt<br />
is in a special situation because we are already operating at virtually full capacity, which means that growth<br />
is limited on the one hand, while on the other hand we need <strong>to</strong> deal with greater complexity in order <strong>to</strong><br />
maintain punctuality and quality at a high level. At the same time we are preparing for Germany’s currently<br />
largest private business investment project, the expansion of Frankfurt Airport <strong>to</strong> include another runway<br />
and a third terminal.<br />
These challenges demand that we should make our business processes simpler, faster and less expensive.<br />
That is why we have introduced our latest efficiency program “Focus Competition“ <strong>to</strong> take a close look at<br />
important core activities. These include facility management and IT support in Frankfurt. For example, the<br />
industry standard is for object-based facility management, permitting much greater transparency in terms<br />
of performance and costs. Of course these revolutionary processes also require permanent openness <strong>to</strong><br />
change on the part of our company and all of our employees. That’s why one of the basic requirements is<br />
that management should be capable of communicating the various challenges and the competition facing<br />
<strong>Fraport</strong> and that we should continuously adjust <strong>to</strong> new market conditions, so as <strong>to</strong> strengthen the future of<br />
the company and guarantee job security.<br />
As part of this effort <strong>to</strong> secure the future, we have also made further significant progress in the first quarter<br />
of this year. The consultation stage of the process for approving the expansion of the airport is complete.<br />
The project <strong>to</strong> modernize FRA-North is in full swing: the plans for the new CD-link and the conversion of<br />
Terminal 2 are complete and the opening of the Shopping Avenue in Terminal 1 means that modernized,<br />
attractive retail areas have gone in<strong>to</strong> operation. Thus, Frankfurt continues <strong>to</strong> develop and, as the familiar<br />
saying goes: as long as you can see a builder’s crane somewhere around the airport, we are doing fine!<br />
Sincerely,<br />
Stefan Schulte,<br />
Member of the Executive Board, Finance and Construction<br />
<strong>Interim</strong> <strong>Report</strong> as at <strong>March</strong> <strong>31</strong>, <strong>2006</strong><br />
3
4 <strong>Interim</strong> <strong>Report</strong> as at <strong>March</strong> <strong>31</strong>, <strong>2006</strong><br />
The <strong>Fraport</strong> Share<br />
Key figures and share price development<br />
Key figures<br />
The <strong>Fraport</strong> share price continued its positive course from 2005 in<strong>to</strong> the first quarter of <strong>2006</strong> and<br />
reached a new all-time high of € 66.77 on February 27, <strong>2006</strong>. The closing price for <strong>Fraport</strong> shares on<br />
<strong>March</strong> <strong>31</strong>, <strong>2006</strong> was € 62.80.<br />
In the period under review the DAX rose by 9.5%, while the MDAX increased by 17.4%. Once again,<br />
the <strong>Fraport</strong> share did better than the comparable indices. They gained in value by around 40% since<br />
the start of the year and exceeded the DAX by 30.4 percentage points and the MDAX by 22.5 percentage<br />
points.<br />
Market capitalization at <strong>March</strong> <strong>31</strong> was at € 5,721 million. This corresponds <strong>to</strong> an increase in market<br />
capitalization of € 2,852 million since <strong>March</strong> <strong>31</strong>, 2005 and a doubling of shareholders investment.<br />
The liquidity of the shares also developed positively. While an average of 96,992 shares were traded<br />
per day in the previous year, the figure for the current review period was 274,756.<br />
Share Kursverlauf development der <strong>Fraport</strong>-Aktie of the im <strong>Fraport</strong> Vergleich share zu DAX compared und MDAX with the DAX and MDAX<br />
%<br />
160<br />
150<br />
140<br />
130<br />
120<br />
110<br />
100<br />
90<br />
Jan. 1, <strong>2006</strong> Mar. <strong>31</strong>, <strong>2006</strong><br />
<strong>Fraport</strong> <strong>AG</strong> DAX MDAX<br />
Q1 2005 Q1 <strong>2006</strong> 2005<br />
Capital s<strong>to</strong>ck (<strong>Group</strong> according <strong>to</strong> IFRS) . . . . € million . . . . . . . . . . .905.7 . . . . . . . . . . . . 910.9 . . . . . . . . . . . . 910.7<br />
Absolute share of capital s<strong>to</strong>ck . . . . . . . . . per share, € . . . . . . . . . . . .10.00 . . . . . . . . . . . . 10.00 . . . . . . . . . . . . 10.00<br />
Total number of shares . . . . . . . . . . . . . . . . . . . . . . . . . . . . . . . . 90,683,908 . . . . . . . . 91,201,180 . . . . . . . . 91,192,355<br />
Number of floating shares on record date1 . . . . . . . . . . . . . . . . 90,569,983 . . . . . . . . 91,091,452 . . . . . . . . 91,078,430<br />
Market capitalization 2 . . . . . . . . . . . . . . . . . . € million . . . . . . . . . . . 2,869 . . . . . . . . . . . . 5,721 . . . . . . . . . . . . 4,089<br />
Average trading volume per day . . . . . . . . . . . . . . . . . . . . . . . . . . . . 96,992 . . . . . . . . . . 274,756 . . . . . . . . . . 106,898<br />
Share price at end of period . . . . . . . . . . . . . . . . . . . € . . . . . . . . . . . <strong>31</strong>.68 . . . . . . . . . . . . 62.80 . . . . . . . . . . . . 44.90<br />
Highest price . . . . . . . . . . . . . . . . . . . . . . . . . . . . . . . € . . . . . . . . . . . 33.32 . . . . . . . . . . . . 66.77 . . . . . . . . . . . . 44.90<br />
Lowest price . . . . . . . . . . . . . . . . . . . . . . . . . . . . . . . . € . . . . . . . . . . . 29.59 . . . . . . . . . . . . 44.90 . . . . . . . . . . . . 29.59<br />
Earnings per share (basic) . . . . . . . . . . . . . . . . . . . . . € . . . . . . . . . . . . 0.<strong>31</strong> . . . . . . . . . . . . . 0.30 . . . . . . . . . . . . . 1.78<br />
Earnings per share (diluted) 3 . . . . . . . . . . . . . . . . . . € . . . . . . . . . . . . 0.30 . . . . . . . . . . . . . 0.30 . . . . . . . . . . . . . 1.75<br />
1 Total number of shares minus treasury shares.<br />
2 Share price at the end of the quarter, multiplied by the number of floating shares.<br />
3 Based on the weighted quarterly average of the floating shares.<br />
Source: Reuters
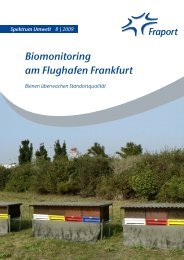
Shareholder structure<br />
The largest shareholders continue <strong>to</strong> be the State of Hesse and the Stadtwerke Frankfurt am Main.<br />
Deutsche Lufthansa <strong>AG</strong> obtained 5.0% of the voting rights at December <strong>31</strong>, 2005. Lufthansa increased<br />
its stake from around 5% at the end of 2005 <strong>to</strong> 9.1% by the end of the first quarter of <strong>2006</strong>.<br />
At the same time, Julius Bär issued a correction. Because of this notice, the officially registered<br />
stake held by Julius Bär dropped from 5.4% <strong>to</strong> 5.1%. In view of these changes, the free float dropped<br />
from <strong>31</strong>.0% <strong>to</strong> 27.2%.<br />
Dividend policy<br />
The Supervisory Board and Executive Board of <strong>Fraport</strong> <strong>AG</strong> will be proposing a dividend of 90 cent<br />
per share for the 2005 financial year <strong>to</strong> the Annual General Meeting, a 20 percent increase on the<br />
75 cent paid out last year.<br />
Inves<strong>to</strong>r Relations<br />
We aim <strong>to</strong> offer comprehensive, open and prompt information <strong>to</strong> achieve the greatest possible<br />
transparency for the capital market.<br />
All telephone conferences and presentations are transmitted live in the Internet and can then be<br />
provided as downloads, so that the latest information is available <strong>to</strong> all shareholder groups. Since<br />
<strong>March</strong> we also offer an electronic newsletter for shareholders in addition <strong>to</strong> our monthly publications.<br />
Interested parties can subscribe <strong>to</strong> the newsletter on our website (www.fraport.com).<br />
A wide range of information is available here under the “Inves<strong>to</strong>r Relations“ heading. As well as<br />
information about shares, it also contains up-<strong>to</strong>-date news, dates, events, information for the<br />
Annual General Meeting as well as financial and traffic figures.<br />
Employee investment plan<br />
Since the IPO in 2001, <strong>Fraport</strong> employees are entitled <strong>to</strong> subscribe <strong>Fraport</strong> shares as part of the<br />
“LEA“ performance and success-based payment program. The quota of participants last year<br />
s<strong>to</strong>od at 47.4%.<br />
<strong>Fraport</strong> <strong>AG</strong> buys back the shares for this program, making partial use of the authorized capital<br />
after a capital increase in return for the injection of cash, and will then be passed <strong>to</strong> the employees.<br />
As in previous years, employee shares will be issued in May <strong>2006</strong>, marking a further slight increase<br />
in s<strong>to</strong>ck capital.<br />
<strong>Interim</strong> <strong>Report</strong> as at <strong>March</strong> <strong>31</strong>, <strong>2006</strong><br />
9.1%<br />
20.3%<br />
Shareholder structure<br />
as at <strong>March</strong> <strong>31</strong>, <strong>2006</strong><br />
6.6%<br />
5.1%<br />
27.2%<br />
5<br />
Shareholder structure as <strong>March</strong> <strong>31</strong>, <strong>2006</strong><br />
<strong>31</strong>.7%<br />
State of Hesse<br />
Free float<br />
Stadtwerke Frankfurt am Main<br />
Holding GmbH<br />
Deutsche Lufthansa <strong>AG</strong><br />
Federal Republic of Germany<br />
(exchangeable note)<br />
Julius Bär Holding <strong>AG</strong>
6 <strong>Interim</strong> <strong>Report</strong> as at <strong>March</strong> <strong>31</strong>, <strong>2006</strong><br />
Business development<br />
Development of air traffic<br />
According <strong>to</strong> the preliminary figures from the Association of European Airlines, air traffic experienced<br />
marked growth worldwide in the first quarter of <strong>2006</strong>. Passenger numbers were 4.1%<br />
above the figures for the same period in the previous year. Seat kilometer capacity were 4.4%<br />
higher than in the same period last year, while seat kilometer sold were 4.7% higher.<br />
Airports Council International (ACI) announced a worldwide increase of passenger growth of<br />
4.5% as well as a gain in growth of 4.2% in cargo volume.<br />
The passenger fleet of our main cus<strong>to</strong>mer Deutsche Lufthansa achieved a 2.8% increase in passenger<br />
numbers in the first quarter of <strong>2006</strong>. The seat kilometer capacity were 3.1% higher than in the<br />
same period last year, while seat kilometer sold were up by 1.0%<br />
In the first quarter of <strong>2006</strong> 14.6 million passengers used the six airports of the <strong>Fraport</strong> <strong>Group</strong>,<br />
6.8% fewer than in the same period last year. Growth in Frankfurt-Hahn, Lima and Hanover could<br />
not compensate for the slight drop in numbers in Frankfurt, or, more significantly, for the slump in<br />
passenger numbers in Antalya due <strong>to</strong> the opening of a second, rival terminal. If it hadn’t been for<br />
the special situation in Antalya, the <strong>Group</strong>’s passenger numbers would have been slightly higher<br />
than in the previous year.<br />
Frankfurt, the most important airport of the <strong>Fraport</strong> <strong>Group</strong>, reached 11.2 million passengers in<br />
the period under review. For the first time since 2002 the first quarter came <strong>to</strong> a close with a drop<br />
in passenger numbers. Other negative effects were the fact that the Easter holidays fell in the<br />
second quarter this year and the unusually high number of flight cancellations due <strong>to</strong> weather<br />
conditions and strikes at other European airports. There would have been an increase without<br />
these fac<strong>to</strong>rs. Growth was mainly achieved with intercontinental flights <strong>to</strong> the Middle and Far<br />
East, as well as southern Africa. In Europe, which continued <strong>to</strong> witness an increase in traffic <strong>to</strong><br />
northern Europe, only eastern Europe experienced a slower rise. Traditional <strong>to</strong>urist destinations<br />
suffered a drop in volume, with the exception of the Canaries, which profited from a shift of traveling<br />
<strong>to</strong> Turkey. The number of passengers on internal flights within Germany also decreased, due<br />
mainly <strong>to</strong> three fac<strong>to</strong>rs: the shifting of short-distance flights out of Frankfurt <strong>to</strong> the German Railway’s<br />
high speed train network, the increased availability of direct flights at other German airports,<br />
in particular in the low-cost sec<strong>to</strong>r, and the number of flight cancellations due <strong>to</strong> weather<br />
conditions.<br />
In the first quarter of <strong>2006</strong>, passenger numbers at the terminal operated by us at Antalya Airport<br />
continued the downward trend from 2005 because of the unequal division of passengers between<br />
the competing terminals. A <strong>to</strong>tal of 152 thousand passengers were handled in the period under<br />
review, 87.7% less than in the previous year.<br />
Lima continued <strong>to</strong> witness solid growth in traffic. In the first three months of <strong>2006</strong>, passenger<br />
numbers rose by 3.6%. This was helped by the increase in international traffic by around 5%.<br />
There were two-digit increases in the number of European flights and in South American destinations,<br />
still an area of strong growth. Internal traffic also increased modestly.<br />
Passenger numbers in Frankfurt-Hahn rose in the first quarter of the year by 11.4%. This is mainly<br />
due <strong>to</strong> the range in the number of routes offered in the form of new destinations and increased<br />
frequency. Up <strong>to</strong> 38 destinations are now available with four airlines from Frankfurt-Hahn in the<br />
passenger sec<strong>to</strong>r alone.<br />
Cargo volume increased by 9.8% throughout the <strong>Group</strong> in comparison with the same period in<br />
the previous year, reaching 566,000 <strong>to</strong>nnes. This was due above all <strong>to</strong> the continuing freight boom<br />
at Frankfurt Airport, which began two years ago. The main cause for this was the growth in cargo
flights on Asian carriers, which has increased by around one third. The second-largest freight airport<br />
in the consolidated <strong>Group</strong> – Frankfurt-Hahn – also experienced positive growth. Lima was<br />
the third area where growth was created, both in terms of export and internal volume.<br />
The number of aircraft movements at the six airports in the <strong>Group</strong> was 2.1% lower than in the<br />
same period last year at 162,513. In Frankfurt, in addition <strong>to</strong> the unusually high number of flight<br />
cancellations, the scheduled discontinuation of military charter traffic after the withdrawal of the<br />
Air Base led <strong>to</strong> a slight decrease. If it hadn’t been for this effect, the volume of flights would have<br />
risen by approximately 1.5%. Developments in Antalya also had a negative influence on the<br />
<strong>Group</strong>’s outcome in terms of aircraft movements.<br />
The maximum take-off weights in Frankfurt in the period under review ran <strong>to</strong> 6.5 million <strong>to</strong>nnes<br />
and were therefore 1.1% lower than in the previous year. The drop, which measured almost 4 percentage<br />
points, could be traced back <strong>to</strong> the discontinuation in military charter flights because<br />
these used heavy aircraft. Thus, the share of “widebody“ aircraft was also 0.7 percentage points<br />
lower than in the previous year at 24.2%. The seat load fac<strong>to</strong>r rose by 0.3 percentage points <strong>to</strong><br />
68.4%.<br />
Traffic figures for <strong>Fraport</strong> <strong>Group</strong><br />
Revenue and earnings<br />
Despite the drop in passenger numbers, the <strong>Fraport</strong> <strong>Group</strong> recorded increases in revenue and<br />
EBITDA in the first quarter of <strong>2006</strong>.<br />
In comparison with the same period in the previous year, revenue in the first three months increased<br />
by 1.4% <strong>to</strong> € 487.4 million. Contrary effects were apparent here. Because of an expansion<br />
in business, we were able <strong>to</strong> increase revenue from security services. Revenue from retail and<br />
parking also showed a pleasing increase. In the area of airport fees, the drop due <strong>to</strong> the loss of<br />
military traffic was more than compensated for by the agreed price rise of 2.2% and the increase<br />
in security fees. The concessions on the fees for ground services were almost completely balanced<br />
by the increase in relevant traffic and the positive movement of revenue in the freight sec<strong>to</strong>r.<br />
A marked drop in revenue was evident in income from real estate because of the revenue based<br />
airport access fees, especially those charged <strong>to</strong> fuelling companies and the fact that electricity was<br />
no longer purchased by Lufthansa and the US Air Base.<br />
<strong>Interim</strong> <strong>Report</strong> as at <strong>March</strong> <strong>31</strong>, <strong>2006</strong><br />
Q1 Passengers 1 Cargo (airfreight + airmail in t) Movements<br />
<strong>2006</strong> Change <strong>2006</strong> Change <strong>2006</strong> Change<br />
<strong>to</strong> 2005 in % <strong>to</strong> 2005 in % <strong>to</strong> 2005 in %<br />
Frankfurt Main . . . . . . . . . . . . . . . . 11,217,241 . . . . . . . . . . – 1.1 497,572 . . . . . . . . . . . . 9.1 113,909 . . . . . . . . . . – 0.5<br />
Frankfurt-Hahn . . . . . . . . . . . . . . . . . . 701,984 . . . . . . . . . . . 11.4 25,644 . . . . . . . . . . . 36.3 8,782 . . . . . . . . . . . 16.1<br />
Hanover . . . . . . . . . . . . . . . . . . . . . . 1,077,034 . . . . . . . . . . . . 1.9 4,025 . . . . . . . . . . – 8.6 17,199 . . . . . . . . . . . . 2.7<br />
Saarbrücken . . . . . . . . . . . . . . . . . . . . . 62,009 . . . . . . . . . . – 9.3 1 . . . . . . . . . – 96.4 3,192 . . . . . . . . . . . 11.8<br />
Antalya 2 . . . . . . . . . . . . . . . . . . . . . . . 151,926 . . . . . . . . . – 87.7 n.a. . . . . . . . . . . . n.a. 1,364 . . . . . . . . . – 83.1<br />
Lima 3 . . . . . . . . . . . . . . . . . . . . . . . . 1,387,856 . . . . . . . . . . . . 3.6 38,498 . . . . . . . . . . . . 6.5 18,067 . . . . . . . . . . . 11.3<br />
<strong>Group</strong> . . . . . . . . . . . . . . . . . . . . . 14,598,050 . . . . . . . . . . – 6.8 565,740 . . . . . . . . . . . 9.8 162,513 . . . . . . . . . . – 2.1<br />
1 Commercial traffic only in + out + transit. Source: ACI<br />
2 International Terminal 1.<br />
3 Internal data provided by Lima.<br />
7
8 <strong>Interim</strong> <strong>Report</strong> as at <strong>March</strong> <strong>31</strong>, <strong>2006</strong><br />
Higher other operating income, mainly resulting from the release of provisions and accruals,<br />
mean that <strong>to</strong>tal revenue rose disproportionately by 2.6% <strong>to</strong> € 504.6 million.<br />
Operating expenses (non-staff costs and personnel expenses) increased in the period under review<br />
<strong>to</strong> € 395.1 million. At € 262.1 million, personnel expenses were 3.8% higher than the comparable<br />
figure for the previous year. The main contribu<strong>to</strong>r <strong>to</strong> the increase was ICTS Europe with a<br />
17.7% rise in staff numbers. Throughout the <strong>Group</strong>, <strong>Fraport</strong> employed an average of 26,989<br />
employees between <strong>January</strong> and <strong>March</strong>, 9.1% more than in the same period last year. The <strong>Group</strong><br />
personnel expenses as a percentage of revenue was at 53.8%, slightly above the figures for the<br />
previous year.<br />
In contrast, the non-staff cost ratio decreased slightly <strong>to</strong> 27.3% because the non-staff costs at<br />
rising revenue remained almost at the same level as last year with € 133.0 million. Non-staff costs<br />
cover cost of materials and other operating expenses. One of the keys <strong>to</strong> the increase in cost of<br />
materials by 9.9% <strong>to</strong> € 84.6 million was the heavy winter experienced at the beginning of the year<br />
and the outsourcing of the computer center on July 1, 2005. However, the outsourcing has no<br />
overall effect on earnings. Other operating expenses decreased by 12.2% <strong>to</strong> € 48.4 million, due<br />
in particular <strong>to</strong> the lower advisor costs in connection with the Manila project and lower specific<br />
allowances, as well as cost-cutting measures in Frankfurt-Hahn.<br />
EBITDA increased in the first three months of the current financial year by 2.2% <strong>to</strong> € 109.5 million.<br />
The EBITDA margin increased by 0.2 percentage points <strong>to</strong> 22.5%.<br />
Depreciation and amortization mainly increased due <strong>to</strong> shorter periods of useful lives because<br />
of planned demolition measures from € 50.3 million in the same quarter of the previous year <strong>to</strong><br />
€ 54.8 million.<br />
EBIT (operating profit) thus dropped by € 2.1 million <strong>to</strong> € 54.7 million.<br />
The financial result was € – 7.1 million, while the figure for the previous year was € – 6.4 million.<br />
The drop in results accounted for using the equity method and in income from investments mainly<br />
resulted from increased depreciation and amortization in Lima because of the new terminal and<br />
the omission of the dividend from Ineuropa Handling UTE. The other financial result rose because<br />
of the change in current profits and losses in long-term financing for Antalya. The lower interest<br />
result was due <strong>to</strong> the regrouping of investments in tax-optimized forms.<br />
The tax rate dropped from 45.6% <strong>to</strong> 42.2%, due above all <strong>to</strong> the tax-optimized investment strategy<br />
and the first crediting of corporation tax credit <strong>to</strong> dividends after the expiration of the mora<strong>to</strong>rium<br />
(change of corporation tax system in 2001). The <strong>Group</strong> result was € 27.5 million and the<br />
basic earnings per share remained at the same level as last year with € 0.30.<br />
Asset and financial situation<br />
Capital expenditures<br />
The <strong>Fraport</strong> <strong>Group</strong> invested a <strong>to</strong>tal of € 97.3 million in the first three months of the <strong>2006</strong> financial<br />
year. The figure in the same period last year was € 144.3 million. When adjusted <strong>to</strong> account for the<br />
special effects in the previous year of the purchase of the Mönchhof site and the increases in longterm<br />
money investments, the amount of investment in the first quarter of <strong>2006</strong> was higher than<br />
the comparable previous year’s value.
€ 66.6 million was invested in the Frankfurt site, compared with € 83.3 million in the same quarter<br />
last year. Here again the figures were higher than in the previous year once the special effect of the<br />
property purchase had been allowed for. Of this € 66.6 million, a <strong>to</strong>tal of € 36.1 million was spent<br />
on modernizing and partially expanding of the existing terminals, including the remodelling in<br />
preparation for the Airbus A380 and the upgrading of fire protection facilities.<br />
A <strong>to</strong>tal of € 10.8 million was invested in the planned expansion of Frankfurt Airport in the period<br />
under review, including the relocation of the US Air Base and the zoning procedure.<br />
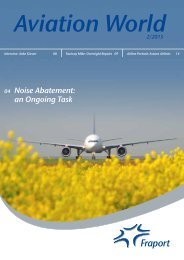
Cash flow statement<br />
Cash flow from operating activities in the first three months of the current financial year s<strong>to</strong>od at<br />
€ 96.4 million. This was an increase on the previous year of € 8.7 million. In the operational area<br />
there was a drop in receivables and liabilities based on the record date.<br />
There was a significant growth in the cash flow used in investing activities. At € 322.2 million,<br />
this exceeded the previous year’s figure by € 183.7 million. This was due <strong>to</strong> the short- and longterm<br />
investments made as part of asset management, amounting <strong>to</strong> € 225.0 million and € 20.8<br />
million respectively.<br />
At € – 2.9 million, the cash outflow used in financing activities was € 8.9 million less than in the<br />
previous year and resulted mainly from the change in financial debts.<br />
Cash and cash equivalents were reduced mainly due <strong>to</strong> money investments from € 621.3 million<br />
in the previous year’s quarter and € 574.2 million <strong>to</strong> December <strong>31</strong>, 2005 <strong>to</strong> € 345.5 million <strong>to</strong><br />
<strong>March</strong> <strong>31</strong>, <strong>2006</strong>.<br />
Change in cash and cash equivalents<br />
Data for Q1 2005 shown in brackets<br />
€ million<br />
740<br />
640<br />
540<br />
440<br />
340<br />
240<br />
140<br />
574.2<br />
(666.4)<br />
96.4<br />
(87.7)<br />
– 322.2<br />
(– 138.5)<br />
– 2.9<br />
(6.0)<br />
0<br />
(– 0.3)<br />
345.5<br />
(621.3)<br />
Cash & cash Cash flow Cash flow Cash flow Changes in Cash & cash<br />
equivalents from operating from investing from financing currency equivalents<br />
<strong>January</strong> 1, <strong>2006</strong> activities activities activities translation and<br />
consolidation<br />
<strong>March</strong> <strong>31</strong>, <strong>2006</strong><br />
<strong>Interim</strong> <strong>Report</strong> as at <strong>March</strong> <strong>31</strong>, <strong>2006</strong><br />
11%<br />
11%<br />
Capital expenditures:<br />
€ 97.3 million<br />
2% 1%<br />
6%<br />
32%<br />
9<br />
37%<br />
Terminal buildings<br />
Financial investments<br />
Expansion<br />
Other buildings/plant/<br />
infrastructure<br />
Aircraft movement<br />
Administration and IT<br />
Planning and miscellaneous<br />
Note: Because of the simplification<br />
of the investment categories in<br />
planning and reporting, the breakdown<br />
of capital expenditure is no<br />
longer the same as in the previous<br />
year.
10 <strong>Interim</strong> <strong>Report</strong> as at <strong>March</strong> <strong>31</strong>, <strong>2006</strong><br />
Asset and capital structure<br />
The <strong>to</strong>tal assets remained at the same level as on December <strong>31</strong>, 2005 at € 3,954.5 million. Noncurrent<br />
assets decreased slightly <strong>to</strong> € 3,085.4 million. Contrary effects applied here: on the one<br />
hand, additional investments in the modernization and expansion of the existing terminals and in<br />
developments at the Frankfurt site, as well as in long-term money investments, led <strong>to</strong> an increase.<br />
On the other hand, there are plans <strong>to</strong> sell the Belgian subsidiary TCR. This is the reason why the<br />
assets in the short-term sec<strong>to</strong>r were restructured.<br />
Current assets increased by 1.9% <strong>to</strong> € 869.1 million. The restructuring of the TCR property assets<br />
was offset by major decreases in trade accounts receivable. There was also a shift from cash and<br />
cash equivalents <strong>to</strong> other receivables and financial assets as part of strategic asset management.<br />
The equity ratio 1 on <strong>March</strong> <strong>31</strong>, <strong>2006</strong> s<strong>to</strong>od at 52.9%, almost stable in comparison with the balance<br />
sheet date for 2005.<br />
Non-current and current liabilities decreased by 1.9% <strong>to</strong> € 1,759.9 million. This mainly resulted<br />
from the significant reduction in trade accounts payable. The short- and long-term debts included<br />
largely balancing movements on the one hand due <strong>to</strong> the restructuring of TCR assets in the shortterm<br />
sec<strong>to</strong>r because of the planned sale and, on the other hand, the repayment of short-term<br />
loans and their replacement with long-term credits. Reductions in provisions for income tax were<br />
balanced against increases in other liabilities from tax and personnel.<br />
The net financial debt <strong>to</strong> <strong>March</strong> <strong>31</strong>, <strong>2006</strong> ran <strong>to</strong> € 379.1 million. On the 2005 balance sheet date<br />
financial debts exceeded cash and cash equivalents by € 188.3 million. This significant change<br />
resulted from the investment of cash and cash equivalents in short- and long-term securities. Thus,<br />
gearing increased from 9.1% <strong>to</strong> 17.9%.<br />
Balance sheet structure<br />
Assets <strong>March</strong> <strong>31</strong>, <strong>2006</strong><br />
Dec. <strong>31</strong>, 2005<br />
Liabilities <strong>March</strong> <strong>31</strong>, <strong>2006</strong><br />
and<br />
equity Dec. <strong>31</strong>, 2005<br />
Non-current assets Current assets<br />
78.0% 22.0%<br />
Shareholders’ equity Non-current Current<br />
liabilities liabilities<br />
1 Shareholders’ equity before minority interests and the proposed dividend.<br />
78.4% 21.6%<br />
55.5% 28.5% 16.0%<br />
54.6% 29.1% 16.3%
Segment reporting<br />
The business activities of the <strong>Fraport</strong> <strong>Group</strong> are divided in<strong>to</strong> four segments: “Aviation“, “Retail &<br />
Properties“, “Ground Handling“ and “External Activities“. The three strategic business areas of<br />
<strong>Fraport</strong> <strong>AG</strong>, “Ground Services“, “Traffic and Terminal Management, Airport Expansion, Security“<br />
and “Retail & Properties“ (see “Board and organization“) are clearly assigned <strong>to</strong> the segments.<br />
In addition, these segments include investments integrated in the business processes at the Frankfurt<br />
site. The internal service units “Information and telecommunications“ as well as “Real estate<br />
and facility management“ are part of the “Retail & Properties“ segment.<br />
All investments outside Frankfurt are assigned <strong>to</strong> the central “Global investments and management“<br />
unit of <strong>Fraport</strong> <strong>AG</strong> or are indicated in the “External Activities“ segment and are controlled<br />
centrally. This also applies <strong>to</strong> three companies located in Frankfurt that do not belong <strong>to</strong> the other<br />
segments by the nature of their business activities.<br />
The profit attributable <strong>to</strong> minority interests that are included in the investments accounted for<br />
using the equity method and profit from other investments are indicated in the financial result.<br />
Aviation accounted for the largest share of <strong>Group</strong> revenue with 33%. Ground Handling contributed<br />
30%, while the External Activities and Retail & Properties segments accounted for 18% and<br />
19% respectively. These values are largely unchanged in comparison with those from the previous<br />
year.<br />
The Retail & Properties segment continues <strong>to</strong> produce the highest results, with a contribution of<br />
around 68% <strong>to</strong> the <strong>Group</strong>’s EBITDA.<br />
Aviation<br />
The Aviation segment of the <strong>Group</strong> is responsible for flight and terminal operations as well as airport<br />
and aviation security at Frankfurt. It is also responsible for the planned expansion program.<br />
Aviation<br />
€ million Q1 2005 Q1 <strong>2006</strong> Change<br />
in %<br />
Revenue . . . . . . . . . . . 154.1 . . . . . . . 159.0 . . . . . . . . . . . . 3.2<br />
EBITDA . . . . . . . . . . . . 30.9 . . . . . . . . 26.7 . . . . . . . . . . – 13.6<br />
EBIT . . . . . . . . . . . . . . . 18.2 . . . . . . . . . 7.3 . . . . . . . . . . – 59.9<br />
Employees . . . . . . . . . 3,327 . . . . . . . 3,250 . . . . . . . . . . . – 2.3<br />
In the first three months of the <strong>2006</strong> financial year the Aviation segment achieved an increase in<br />
revenue of 3.2% in comparison with the same period in the previous year, reaching € 159.0 million.<br />
The drop in revenue arising from the decrease in passenger numbers was more than compensated<br />
for by the 2.2% price increase agreed with the airlines and by the rise in security fees<br />
for so-called critical parts and the requirement that passengers who have been checked in accordance<br />
with EU standards are kept physically separate from passengers who have not been<br />
screened in accordance with EU standards.<br />
<strong>Interim</strong> <strong>Report</strong> as at <strong>March</strong> <strong>31</strong>, <strong>2006</strong><br />
Aviation<br />
Retail & Properties<br />
Ground Handling<br />
External Activities<br />
11<br />
Shares of the segments<br />
in <strong>Group</strong> revenues (outer circle)<br />
Shares of the segments in <strong>Group</strong> revenues<br />
and (outer EBITDA circle) and (inner EBITDA circle) (inner circle)<br />
18% 33%<br />
7% 24%<br />
1%<br />
68%<br />
30% 19%
12 <strong>Interim</strong> <strong>Report</strong> as at <strong>March</strong> <strong>31</strong>, <strong>2006</strong><br />
Retail<br />
€ million<br />
30<br />
20<br />
10<br />
0<br />
€ 2.34<br />
per<br />
Passenger<br />
+ 9.5%<br />
26.4<br />
4.4<br />
6.0<br />
16.0<br />
Advertisment<br />
Services<br />
€ 2.58<br />
per<br />
Passenger<br />
28.9<br />
Q1 2005 Q1 <strong>2006</strong><br />
Shopping<br />
5.4<br />
6.7<br />
16.8<br />
At € 149.7 million, operating expenses were around 10% above the value of the previous year.<br />
Higher expenses resulted from extended security regulations, increased snow/ice clearance due <strong>to</strong><br />
the heavy winter conditions at the beginning of the year and internal charging for the areas used<br />
by the segment.<br />
The segment EBITDA was therefore 13.6% below the previous year’s value at € 26.7 million. Increased<br />
depreciation and amortization because of shorter useful lives due <strong>to</strong> planned demolition<br />
and additional assets caused EBIT <strong>to</strong> drop at a proportionately greater rate <strong>to</strong> € 7.3 million.<br />
Retail & Properties<br />
The business operations in the areas of retailing, parking facility management, property rental and<br />
marketing at the Frankfurt location as well as CargoCity South are combined in the Retail & Properties<br />
segment of the <strong>Group</strong>.<br />
Retail & Properties<br />
€ million Q1 2005 Q1 <strong>2006</strong> Change<br />
Segment revenue was slightly less than in the previous year at € 91.4 million. The marked increase<br />
in revenue from retail and parking could not entirely compensate for reductions in revenue from<br />
real estate due <strong>to</strong> the restructuring of contributions from oil companies and the discontinuation of<br />
electricity sales <strong>to</strong> Lufthansa and the US Air Base.<br />
In the period under review retail revenue per passenger rose in comparison with the previous year<br />
from € 2.34 <strong>to</strong> € 2.58. This resulted from concentrated sales promotion measures in the shopping<br />
sec<strong>to</strong>r and from increased earnings from advertising in new advertising formats and the increased<br />
utilization of standard advertising media.<br />
The charging of additional services, such as snow and ice clearance as well as other internal work<br />
capitalized and proceeds from disposal of non-current assets had a positive effect on overall revenue.<br />
Operating expenses mainly rose due <strong>to</strong> the outsourcing of the computer center.<br />
At € 74.6 million, EBITDA were 10.5% higher than in the previous year, while EBIT s<strong>to</strong>od at € 52.9<br />
million, an increase of 22.7%.<br />
in %<br />
Revenue . . . . . . . . . . . 92.5 . . . . . . . . 91.4 . . . . . . . . . . . –1.2<br />
EBITDA . . . . . . . . . . . . . 67.5 . . . . . . . . 74.6 . . . . . . . . . . . 10.5<br />
EBIT . . . . . . . . . . . . . . . 43.1 . . . . . . . . 52.9 . . . . . . . . . . . 22.7<br />
Employees . . . . . . . . . 2,955 . . . . . . . 2,866 . . . . . . . . . . . – 3.0
Ground Handling<br />
The Ground Handling segment includes such ground services as aircraft handling, passenger and<br />
cargo services, the infrastructure for the ground services and the investments involved in these<br />
operations at the Frankfurt location.<br />
Ground Handling<br />
€ million Q1 2005 Q1 <strong>2006</strong> Change<br />
in %<br />
Revenue . . . . . . . . . . . 147.3 . . . . . . . . 147.1 . . . . . . . . . . . – 0.1<br />
EBITDA . . . . . . . . . . . . 10.0 . . . . . . . . . 7.5 . . . . . . . . . . – 25.0<br />
EBIT . . . . . . . . . . . . . . . . 4.8 . . . . . . . . . 2.0 . . . . . . . . . . – 58.3<br />
Employees . . . . . . . . . 7,180 . . . . . . . 7,655 . . . . . . . . . . . . 6.6<br />
Revenue from the Ground Handling segment remained at previous year’s level at € 147.1 million.<br />
There was an impact from contrary effects. Main driver for revenue of ground handling fees are<br />
the Maximum Take-off Weights (MTOWs) resulting from the number and size of aircraft handled<br />
in Frankfurt. The MTOWs that are decisive for Ground Handling were increased leading <strong>to</strong> growth<br />
in revenue. Development of revenue in the cargo sec<strong>to</strong>r was very satisfac<strong>to</strong>ry. Revenue was reduced<br />
by price concessions in relation <strong>to</strong> the new Lufthansa handling contract as well as slight<br />
losses of market share of 0.6 percentage points <strong>to</strong> 87.6%.<br />
Despite an increase in staff numbers, it was possible <strong>to</strong> maintain the major cost item in Ground<br />
Handling, personnel expenses, at the same level as last year by optimizing personnel deployment.<br />
The slight increase in operating expenses in comparison with the previous year resulted from an<br />
increase in the materials used, higher maintenance costs and internal charging for the areas used<br />
by the segment.<br />
The segment EBITDA decreased by 25.0% <strong>to</strong> € 7.5 million, while EBIT dropped proportionately <strong>to</strong><br />
€ 2.0 million.<br />
External Activities<br />
The External Activities segment of the <strong>Group</strong> basically covers the investments that carry out their<br />
business operations outside Frankfurt or are not involved in the business processes at the Frankfurt<br />
location.<br />
External Activities<br />
€ million Q1 2005 Q1 <strong>2006</strong> Change<br />
in %<br />
Revenue . . . . . . . . . . . 87.0 . . . . . . . . 89.9 . . . . . . . . . . . . 3.3<br />
EBITDA . . . . . . . . . . . . – 1.3 . . . . . . . . . 0.7 . . . . . . . . . . . . . . –<br />
EBIT . . . . . . . . . . . . . . . – 9.3 . . . . . . . . – 7.5 . . . . . . . . . . . . . . –<br />
Employees . . . . . . . . 11,275 . . . . . . . 13,218 . . . . . . . . . . . . 17.2<br />
<strong>Interim</strong> <strong>Report</strong> as at <strong>March</strong> <strong>31</strong>, <strong>2006</strong><br />
13
14 <strong>Interim</strong> <strong>Report</strong> as at <strong>March</strong> <strong>31</strong>, <strong>2006</strong><br />
Segment revenue in the first quarter of <strong>2006</strong> rose by 3.3% <strong>to</strong> € 89.9 million. The reason for the<br />
comparatively weak growth in revenue was the negative impact due <strong>to</strong> the loss of revenue resulting<br />
from the opening of the second, rival terminal in Antalya in April 2005, leading <strong>to</strong> a decline of<br />
around € 3.3 million.<br />
In contrast, revenue from the <strong>Group</strong>’s airport in Frankfurt-Hahn increased thanks <strong>to</strong> growth in<br />
passenger numbers and cargo. ICTS Europe, which specializes in security services, also managed<br />
<strong>to</strong> increase its revenue significantly by growing its business in the Netherlands, France and the UK.<br />
The increase in the personnel expenses since last year mainly resulted from the expansion of ICTS<br />
business. Cost of materials expenses in the segment were lower overall than in the same period<br />
last year. Contrary effects were at work here: higher costs for ICTS were more than compensated<br />
for by lower advisor costs in connection with the Manila project and cost-cutting in Frankfurt-<br />
Hahn. EBITDA grew by € 2.0 million <strong>to</strong> € 0.7 million, while EBIT also developed proportionately<br />
at € – 7.5 million.<br />
The segment’s results do not include the results from investments and the results of investment<br />
accounted for using the equity method, which are shown separately in the financial results.<br />
The business figures for the key investments outside of Frankfurt before consolidation are shown<br />
below.<br />
The 100-percent subsidiary ICTS increased its revenue by 15.8% <strong>to</strong> € 88.5 million by expanding its<br />
business in the Netherlands, France and the UK and as a result of higher security regulations at<br />
Frankfurt Airport. Operating expenses rose as part of the development in revenue. At € 4.0 million,<br />
EBITDA s<strong>to</strong>od slightly below the level of the previous year.<br />
In Antalya the opening of a second international terminal led <strong>to</strong> a drop in passenger numbers of<br />
87.7%. Consequently, revenue fell by 81.9% <strong>to</strong> € 1.9 million. EBITDA s<strong>to</strong>od at € – 2.1 million in<br />
comparison with € 5.9 million in the previous year. Since Oc<strong>to</strong>ber 2005 the company has been<br />
fully consolidated, while in the first quarter of 2005 it was consolidated with a rate of 50%.<br />
The continuingly positive passenger and cargo volume in Frankfurt-Hahn led <strong>to</strong> a 15.7% increase<br />
in revenue <strong>to</strong> € 9.6 million in the first three months of <strong>2006</strong>. Operating expenses grew more slowly<br />
than revenue thanks <strong>to</strong> cost-cutting measures as well as decreased other taxes, so that the EBITDA<br />
improved from last year’s level of € – 5.2 million <strong>to</strong> € 2.2 million.<br />
Hannover-Langenhagen and Lima airports and their operating companies are accounted for using<br />
the equity method.<br />
Revenue in Hanover increased because of positive passenger growth and the introduction of a<br />
security charge, as well as the altered allocation of revenue from the 100 percent subsidiaries of<br />
Hannover-Langenhagen Airport by 13.9% <strong>to</strong> € 30.4 million. The latter and the strong onset of winter<br />
at the beginning of the financial year led <strong>to</strong> increased expenses, so that EBITDA fell by € 0.3 million<br />
<strong>to</strong> € 5.3 million.<br />
Revenue and results in Lima developed positively against the background of the increased volume<br />
of traffic. Revenue rose by 24.1% <strong>to</strong> € 19.6 million, while EBITDA exceeded the previous year’s figures<br />
by 32.4% with € 4.5 million. In addition <strong>to</strong> the positive development of traffic, the main reason<br />
for the rise in revenue and EBITDA was an increase in airport charges in <strong>2006</strong>.
Employees<br />
In the period under review the number of people employed by the <strong>Fraport</strong> <strong>Group</strong> rose by 9.1% <strong>to</strong><br />
an average of 26,989. In this period an average of 17,118 people were employed in Frankfurt, 7.7%<br />
more than in the previous year.<br />
In comparison with the employee figures published for the same quarter in the previous year, the<br />
calculation was changed <strong>to</strong> a segment-by-segment basis. Up until December <strong>31</strong>, 2005, temporary<br />
staff and students were assigned <strong>to</strong> the segments on a flat basis. Since <strong>January</strong> 1, <strong>2006</strong> they are<br />
recorded directly under the relevant areas. The resulting change in employee numbers in comparison<br />
with the same quarter in the previous year is shown in the table.<br />
Segment Q1 2005 Q1 2005 Q1 <strong>2006</strong> Change<br />
Accounting Accounting in %<br />
<strong>to</strong> 2005 from <strong>2006</strong><br />
Aviation . . . . . . . . . . . . . . . . . . 3,508 . . . . . . . . . . . 3,327 . . . . . . . . . . . 3,250 . . . . . . . . . . . . – 2.3<br />
Retail & Properties . . . . . . . . . . 3,035 . . . . . . . . . . . 2,955 . . . . . . . . . . . 2,866 . . . . . . . . . . . . – 3.0<br />
Ground Handling . . . . . . . . . . 6,918 . . . . . . . . . . . . 7,180 . . . . . . . . . . . 7,655 . . . . . . . . . . . . . 6.6<br />
External Activities . . . . . . . . . . 11,276 . . . . . . . . . . 11,275 . . . . . . . . . . 13,218 . . . . . . . . . . . . 17.2<br />
The increase in employee numbers in the <strong>Group</strong> mainly <strong>to</strong>ok place in the External Activities segment,<br />
where the number of employees grew significantly since the previous year. The reason for<br />
this was the expansion of the business of ICTS Europe, which specializes in security services. Due<br />
<strong>to</strong> training measures in preparation for the summer peak in flight traffic the employee numbers in<br />
the Ground Handling segment rose significantly in comparison with the previous year. The number<br />
of employees in the Retail & Properties segment fell because of the outsourcing of the computer<br />
center <strong>to</strong> July 1, 2005 and due <strong>to</strong> the decision <strong>to</strong> not replace any fluctuation of staff in Facility<br />
Management. Staff numbers in the Aviation segment fell as well.<br />
The figures quoted do not include 308 apprentices – 16 more than in the same period last year –<br />
or employees exempted from their normal duties <strong>to</strong> carry out special assignments. The number of<br />
employees in joint ventures corresponds <strong>to</strong> the interest held.<br />
Order situation<br />
Q1 2005 Q1 <strong>2006</strong> Change<br />
<strong>Fraport</strong> <strong>Group</strong> . . . . . . . . . . . . 24,737 . . . . . . . . . . 26,989 . . . . . . . . . . . . . . . . . 9.1<br />
of which in Frankfurt . . . . 15,896 . . . . . . . . . . 17,118 . . . . . . . . . . . . . . . . . 7.7<br />
Investments . . . . . . . . . . . . . 12,497 . . . . . . . . . . 14,982 . . . . . . . . . . . . . . . . 19.9<br />
of which ICTS . . . . . . . . . . 10,038 . . . . . . . . . . 11,816 . . . . . . . . . . . . . . . . . 17.7<br />
The summer flight schedule for <strong>2006</strong>, which is valid from <strong>March</strong> 26 <strong>to</strong> Oc<strong>to</strong>ber 28, <strong>2006</strong>, lists 129<br />
passenger-carrying airlines with 304 destinations in 112 countries. An average of 4,625 departures<br />
per week are expected, 2.1% more than in the 2005 summer flight schedule. Once again the<br />
growth is evident in intercontinental traffic.<br />
in %<br />
<strong>Interim</strong> <strong>Report</strong> as at <strong>March</strong> <strong>31</strong>, <strong>2006</strong><br />
15
16 <strong>Interim</strong> <strong>Report</strong> as at <strong>March</strong> <strong>31</strong>, <strong>2006</strong><br />
Executive Board and organization<br />
The main aim of the organizational structure at <strong>Fraport</strong> <strong>AG</strong> is <strong>to</strong> structure the business in an efficient<br />
way and <strong>to</strong> strengthen direct, operating management by the Board. Every member of the<br />
Executive Board bears responsibility for reporting for one segment of the <strong>Group</strong>. Allocation is<br />
shown in the following graphic.<br />
<strong>Fraport</strong> structure with effect from August 1, 2005*<br />
Dr Wilhelm Bender Prof Manfred Schölch Herbert Mai Dr Stefan Schulte<br />
Chairman Vice Chairman<br />
Ground Traffic and Terminal Retail &<br />
Services management, Airport Properties<br />
expansion, Security<br />
Marketing, strategy, Legal affairs Human resources Real estate and<br />
boards and commitees facility management<br />
Corporate Information<br />
communications and telecommunications<br />
Central purchasing,<br />
construction contracts Global investments<br />
and management<br />
Controlling, finance,<br />
accounting<br />
Ground Aviation Retail & External<br />
Handling Properties Activities<br />
* Excluding staff departments<br />
The Annual General Meeting of <strong>Fraport</strong> <strong>AG</strong> will decide on two new appointments <strong>to</strong> the Supervisory<br />
Board on May <strong>31</strong>, <strong>2006</strong>. In addition <strong>to</strong> former State Secretary Ralf Nagel, who retired on conclusion<br />
of the Supervisory Board meeting on <strong>March</strong> 27, <strong>2006</strong>, the representative of the German<br />
Ministry for Finance, the Assistant State Secretary Dr Jürgen Siewert will also withdraw from the<br />
twenty-strong committee at the end of the General Annual Meeting.<br />
Significant events after the balance sheet date<br />
On April 4, <strong>2006</strong> the Government of India and the Delhi International Airport Private Limited<br />
(DIAL) operating company signed a 30-year operation, management and development agreement.<br />
As the airport opera<strong>to</strong>r in this consortium, <strong>Fraport</strong> holds 10% of shares in DIAL. Airport operations<br />
in Delhi (IGIA Indira Gandhi International Airport) are <strong>to</strong> be taken over by July <strong>2006</strong> at the<br />
latest.<br />
On April 13, The Capital <strong>Group</strong> Companies, Inc., an American fund, announced that by buying<br />
5.1% of <strong>Fraport</strong> shares on April 6, <strong>2006</strong>, it had exceeded the 5% threshold above which shareholdings<br />
must be reported. This means that the free float portion is now at 22.1%.
At the end of April <strong>2006</strong>, we agreed with the Turkish airport authority DHMI that more airlines will<br />
be moved in<strong>to</strong> Terminal 1, which is operated by <strong>Fraport</strong>, starting from April 27, <strong>2006</strong>. A specially<br />
convened commission identified a capacity ratio of 40:60 (Terminal 1:Terminal 2) in <strong>March</strong> <strong>2006</strong>.<br />
DHMI has also stipulated that this ratio is <strong>to</strong> be maintained on a yearly basis and that more frequent<br />
adjustments in the allocation of airlines would be possible.<br />
Changes in risks and opportunities<br />
There were no significant changes <strong>to</strong> the risks and opportunities presented in the 2005 Annual<br />
<strong>Report</strong>. Details of the situation in relation <strong>to</strong> risks and opportunities as well as risk management<br />
at <strong>Fraport</strong> <strong>AG</strong> are contained on pages 64ff of the 2005 Annual <strong>Report</strong>.<br />
S<strong>to</strong>ck option plan<br />
A new s<strong>to</strong>ck option plan – the “<strong>Fraport</strong> Management S<strong>to</strong>ck Option Plan 2005“ (<strong>Fraport</strong> MSOP<br />
2005) was agreed at the Annual General Meeting of <strong>Fraport</strong> <strong>AG</strong> on June 1, 2005, replacing the<br />
old s<strong>to</strong>ck option plan. Among other things, the new s<strong>to</strong>ck option plan meets the requirements of<br />
the German Corporate Governance Code for the identification of variable remuneration of members<br />
of the Board of <strong>Fraport</strong> <strong>AG</strong>, members of executive management from investments and other<br />
selected managerial staff at <strong>Fraport</strong> <strong>AG</strong> and the investments.<br />
Overall, the number of share options issued through both s<strong>to</strong>ck option plans at <strong>March</strong> <strong>31</strong>, <strong>2006</strong><br />
s<strong>to</strong>od at 1,071,350. The current number of issued and still unused options under the 2001 s<strong>to</strong>ck<br />
option plan is 215,150. A <strong>to</strong>tal of 198,300 share options were issued for the <strong>Fraport</strong> MSOP 2005,<br />
of which 2,500 have expired and none of which could be exercised yet.<br />
Treasury shares<br />
<strong>Fraport</strong> <strong>AG</strong> held 109,728 of treasury shares on <strong>March</strong> <strong>31</strong>, <strong>2006</strong>. This is a decrease of 4,197 shares in<br />
comparison with the end of the 2005 financial year. These were issued as part of the compensation<br />
of the Executive Board.<br />
Other financial commitments<br />
There were no major changes in the other financial commitments by comparison with December<br />
<strong>31</strong>, 2005.<br />
<strong>Interim</strong> <strong>Report</strong> as at <strong>March</strong> <strong>31</strong>, <strong>2006</strong><br />
9.1%<br />
6.6%<br />
20.3%<br />
22.1%<br />
17<br />
Shareholder structure<br />
as at April 13, <strong>2006</strong><br />
Shareholder structure as at April 13, <strong>2006</strong><br />
5.1%<br />
5.1%<br />
<strong>31</strong>.7%<br />
State of Hesse<br />
Free float<br />
Stadtwerke Frankfurt am Main<br />
Holding GmbH<br />
Deutsche Lufthansa <strong>AG</strong><br />
Federal Republic of Germany<br />
(exchangeable note)<br />
Julius Bär Holding <strong>AG</strong><br />
The Capital <strong>Group</strong> Companies, Inc.
18 <strong>Interim</strong> <strong>Report</strong> as at <strong>March</strong> <strong>31</strong>, <strong>2006</strong><br />
Outlook<br />
Airport expansion<br />
The process of expanding Frankfurt Airport has taken another step forward. The hearing of the<br />
many objections <strong>to</strong> the project was concluded on <strong>March</strong> 27, <strong>2006</strong>. The Darmstadt District President<br />
is currently drawing up a report on the hearing. As a consequence of the hearing we are<br />
expecting a number of requirements and additions <strong>to</strong> the zoning application. These include the<br />
already requested revision of traffic forecasts and, consequently, the impact forecasts. These requirements<br />
are the typical result of a hearing and are therefore not unusual. According <strong>to</strong> current<br />
opinion, it will be possible <strong>to</strong> satisfy these requirements and still meet the target schedule.<br />
We expect the zoning decision for the expansion of the airport by the Hesse Ministry of Economics,<br />
Transportation and State Development in the second half of 2007.<br />
A380 maintenance facility<br />
The construction work involved in relocating the Okrifteler Straße in conjunction with the construction<br />
of the A380 hangar is proceeding according <strong>to</strong> plan, so that Lufthansa will be able <strong>to</strong><br />
complete the maintenance hangar in good time. This means that it will be possible <strong>to</strong> maintain<br />
the A380 as soon as Lufthansa starts <strong>to</strong> station it in Frankfurt. In the meantime, the complaints<br />
against the project, aiming <strong>to</strong> overturn the zoning decision and <strong>to</strong> prevent the construction of the<br />
hangar were finally rejected. Likewise, the European Commission has halted nature conservation<br />
inspections for compliance with wild bird and flora and fauna habitat guidelines for this project.<br />
FRA-North<br />
More detailed plans for the measures required in the existing passenger facilities have become<br />
available in recent months. Top priority goes <strong>to</strong> the upgrading of the A380 passenger check-in<br />
facilities, the implementation of the requirement that passengers who have been checked in<br />
accordance with EU standards are kept physically separate from passengers who have not been<br />
screened in accordance with EU standards and the optimizing of the retail areas and terminal<br />
capacities.<br />
The completion of the bridge structure at position E 4 in Terminal 2 means that the first A380 position<br />
will be available at the end of June <strong>2006</strong>, so that passengers will be able <strong>to</strong> board and disembark<br />
using three bridges.<br />
The reopening of the altered Shopping Avenue, one of the two central marketplaces in Terminal 1,<br />
marked an important step in retail development in <strong>January</strong>. The Shopping Boulevard is <strong>to</strong> reopen<br />
in May <strong>2006</strong>.<br />
Business prospects<br />
The economic outlook for <strong>2006</strong> remains positive at the end of the first quarter. It is expected that<br />
the first six months will be characterized by strong growth in the global economy, which will support<br />
German exports. The forecasts for growth in the various gross domestic products contained<br />
in the 2005 Annual <strong>Report</strong> have not changed.<br />
Growth in gross domestic product in %<br />
Germany . . . . . . . . . . . . . . . . . . . 1.7<br />
EU member states . . . . . . . . . . . . 2.3<br />
USA . . . . . . . . . . . . . . . . . . . . . . . 3.5<br />
Japan . . . . . . . . . . . . . . . . . . . . . . 2.5<br />
India . . . . . . . . . . . . . . . . . . . . . . . 7.3<br />
China . . . . . . . . . . . . . . . . . . . . . . 8.5
The world trade volume, a key indica<strong>to</strong>r for the development of airfreight, will increase by up <strong>to</strong><br />
8.5% in <strong>2006</strong> – roughly what was expected at the end of 2005.<br />
Against the background of business development in the first three months of <strong>2006</strong>, we are holding<br />
on <strong>to</strong> our forecast in the Annual <strong>Report</strong> for 2005.<br />
Passenger numbers<br />
Despite negative growth in the first quarter, we still expect an increase in passenger volume at<br />
Frankfurt Airport for <strong>2006</strong> as a whole. The flight plan conference showed continuing demand for<br />
slots and the summer season saw a slight increase in technical runway capacity. The disproportionate<br />
growth in intercontinental traffic is set <strong>to</strong> continue, something that is important for Frankfurt’s<br />
development as a hub for international air travel. Airfreight looks set <strong>to</strong> continue <strong>to</strong> develop<br />
positively.<br />
According <strong>to</strong> our estimates, the number of passengers handled by the whole <strong>Group</strong> should be<br />
greater than in the previous year. The negative base effect in Antalya came <strong>to</strong> an end with the winter<br />
schedule in <strong>March</strong> <strong>2006</strong> and we expect traffic <strong>to</strong> be divided more favorably, which should lead<br />
<strong>to</strong> growth. Furthermore, the end of the concession has been pushed back from July 2007 <strong>to</strong> September<br />
2007.<br />
Our airports in Frankfurt-Hahn and Hanover should benefit from growth in the low-cost market.<br />
From Oc<strong>to</strong>ber <strong>2006</strong> onwards, Ryanair will station two additional aircraft at Hahn and will offer<br />
nine new destinations. Because of increasing intercontinental traffic, we also expect passenger<br />
numbers <strong>to</strong> increase at our airport in Lima. Positive development in airfreight is also expected<br />
throughout the <strong>Group</strong>.<br />
<strong>Group</strong> segments<br />
We continue <strong>to</strong> hold on <strong>to</strong> the forecasts contained in the 2005 Annual <strong>Report</strong> for the development<br />
and results of the various <strong>Group</strong> segments.<br />
In the coming three quarters it is also expected that the Aviation segment will continue <strong>to</strong> more<br />
than compensate for the loss of revenue from military traffic through increases in traffic and the<br />
average rise in airport charges in Frankfurt and the additional security charges. However, the latter<br />
charges and the costs from additional security requirements that cannot be passed on in full <strong>to</strong> the<br />
airlines mean that the results in this segment will probably not be higher than last year.<br />
The contrary developments on the revenue side in the Retail & Properties segment – increases<br />
due <strong>to</strong> the expansion in retail business, fall-off due <strong>to</strong> the reduced sale of supply services – will<br />
continue. The planned demolition of several buildings means that the capital expenditure is set<br />
<strong>to</strong> increase, while revenue will drop off at the same time. In conjunction with a slight decrease in<br />
depreciation and amortization, we expect an overall segment result slightly above last year’s<br />
levels.<br />
Despite the positive development of the relevant traffic, it is expected that there will be a slight<br />
fall-off in revenue in the Ground Handling segment in comparison with the previous year due <strong>to</strong><br />
price concessions and slight losses of market share. The segment should achieve high results, but<br />
these will probably not equal the record margins achieved in the previous year.<br />
The key investments outside Frankfurt look set <strong>to</strong> develop positively in <strong>2006</strong>. Accordingly, we<br />
expect that the External Activities segment will increase in terms of revenue and segment results.<br />
<strong>Interim</strong> <strong>Report</strong> as at <strong>March</strong> <strong>31</strong>, <strong>2006</strong><br />
19
20 <strong>Interim</strong> <strong>Report</strong> as at <strong>March</strong> <strong>31</strong>, <strong>2006</strong><br />
<strong>Group</strong> key figures for <strong>2006</strong><br />
We are expecting <strong>Group</strong> revenue <strong>to</strong> increase in <strong>2006</strong>. Our response <strong>to</strong> the negative fac<strong>to</strong>rs outlined<br />
in the segment presentation is <strong>to</strong> maintain strict cost management.<br />
As part of the “WM 2005“ program, we should achieve the full target of at least € 150 million on<br />
EBITDA basis in <strong>2006</strong>. With the agreement of demand-based, flexible working hours in 2005, the<br />
second package of measures associated with the “We are making <strong>Fraport</strong> Fit“ project begun in<br />
2005 is now pending, relating <strong>to</strong> the collective agreement issues .<br />
In order <strong>to</strong> continue <strong>to</strong> ensure the competitiveness of <strong>Fraport</strong>, we aim <strong>to</strong> continue the tradition of<br />
successful efficiency programs with the new “Focus Competition“ project. Working in collaboration<br />
with corporate consultants Arthur D. Little and the participating specialist areas of Flight and<br />
Terminal Operations, IT and Facility Management, we aim <strong>to</strong> optimize the quality of internal structures<br />
and processes – in particular administration, deployment and planning activities. Initial results<br />
in relation <strong>to</strong> the scope of possible savings should be available by August of this year.<br />
The economy measures that have been arranged should compensate for the negative fac<strong>to</strong>rs<br />
outlined above <strong>to</strong> a large extent in <strong>2006</strong>, so that we are working on the assumption that <strong>to</strong>tal<br />
EBITDA will be increasing within the framework of a positive development in traffic. In view of the<br />
positive development of our minority investments, the profit for the year should increase even<br />
more strongly than EBITDA in <strong>2006</strong>.<br />
Preview 2007<br />
The relevant surveys of the industry assume that global air traffic will be increasing in the coming<br />
years, <strong>to</strong>o. This should also be the case at our <strong>Group</strong> airports, taking the capacity limitations at<br />
Frankfurt Airport in<strong>to</strong> account as well. As for Antalya, it should be mentioned that the existing concession<br />
contract will be expiring in mid-2007.<br />
The <strong>2006</strong> trends in the Aviation segment will be continuing; the existing contract about airport<br />
fees expires in <strong>2006</strong> and therefore needs <strong>to</strong> be concluded again for the period after this.<br />
The earnings margin in the Ground Handling segment should stabilize at a high level, i.e. the<br />
price concessions <strong>to</strong> cus<strong>to</strong>mers and the effects of the economy measures should roughly cancel<br />
each other out.<br />
Retail & Properties should benefit from a further increase in the retail space and retail revenue.<br />
Positive development is expected in external business from a current perspective. However, new<br />
investments and the increasing or decreasing of existing investments could have a major impact.<br />
Where the statements made in this document relate <strong>to</strong> the future rather than the past, these statements are based on a number<br />
of assumptions about future events and are subject <strong>to</strong> a number of uncertainties and other fac<strong>to</strong>rs, many of which are outside<br />
the control of <strong>Fraport</strong> <strong>AG</strong> Frankfurt Airport Services Worldwide and could have the effect that the actual results differ<br />
materially from the statements.These fac<strong>to</strong>rs include not only but among other things the competitive environment in liberalized<br />
markets, regula<strong>to</strong>ry changes, the success of the business operations as well as considerably less favorable general economic<br />
conditions on the markets in which <strong>Fraport</strong> <strong>AG</strong> Frankfurt Airport Services Worldwide and its investments operate.<br />
Readers are cautioned not <strong>to</strong> rely <strong>to</strong> an inappropriately large extent on these statements about the future.
<strong>Group</strong> <strong>Interim</strong> <strong>Report</strong><br />
as at <strong>March</strong> <strong>31</strong>, <strong>2006</strong><br />
Consolidated income statement<br />
€ million Q1 2005 Q1 <strong>2006</strong><br />
Revenue . . . . . . . . . . . . . . . . . . . . . . . . . . . . . . . . . . . . . . . . . . . . . . . . . . . . . 480.9 . . . . . . . . . . . . . 487.4<br />
Change in work-in-process . . . . . . . . . . . . . . . . . . . . . . . . . . . . . . . . . . . . . . . . . . . 0.0 . . . . . . . . . . . . . . . 0.0<br />
Other internal work capitalized . . . . . . . . . . . . . . . . . . . . . . . . . . . . . . . . . . . . . . . 4.1 . . . . . . . . . . . . . . . . 4.1<br />
Other operating income . . . . . . . . . . . . . . . . . . . . . . . . . . . . . . . . . . . . . . . . . . . . . 6.6 . . . . . . . . . . . . . . . 13.1<br />
Total revenue . . . . . . . . . . . . . . . . . . . . . . . . . . . . . . . . . . . . . . . . . . . . . . . . . 491.6 . . . . . . . . . . . . . 504.6<br />
Cost of materials . . . . . . . . . . . . . . . . . . . . . . . . . . . . . . . . . . . . . . . . . . . . . . . . . – 77.0 . . . . . . . . . . . . . – 84.6<br />
Personnel expenses . . . . . . . . . . . . . . . . . . . . . . . . . . . . . . . . . . . . . . . . . . . . . – 252.4 . . . . . . . . . . . . – 262.1<br />
Other operating expenses . . . . . . . . . . . . . . . . . . . . . . . . . . . . . . . . . . . . . . . . . – 55.1 . . . . . . . . . . . . . – 48.4<br />
EBITDA . . . . . . . . . . . . . . . . . . . . . . . . . . . . . . . . . . . . . . . . . . . . . . . . . . . . . . 107.1 . . . . . . . . . . . . . 109.5<br />
Depreciation and amortization of tangible<br />
and intangible non-current assets and investment property . . . . . . . . . . . . . . – 50.3 . . . . . . . . . . . . . – 54.8<br />
EBIT/Operating profit . . . . . . . . . . . . . . . . . . . . . . . . . . . . . . . . . . . . . . . . . . . 56.8 . . . . . . . . . . . . . . 54.7<br />
Interest result . . . . . . . . . . . . . . . . . . . . . . . . . . . . . . . . . . . . . . . . . . . . . . . . . . . . – 5.8 . . . . . . . . . . . . . . – 7.3<br />
Share of the profit or loss of investments<br />
accounted for using the equity method . . . . . . . . . . . . . . . . . . . . . . . . . . . . . . 0.2 . . . . . . . . . . . . . . – 1.3<br />
Income from investments . . . . . . . . . . . . . . . . . . . . . . . . . . . . . . . . . . . . . . . . . . . . 1.7 . . . . . . . . . . . . . . . 0.0<br />
Write-downs of financial assets . . . . . . . . . . . . . . . . . . . . . . . . . . . . . . . . . . . . . . . 0.0 . . . . . . . . . . . . . . . 0.0<br />
Other financial result . . . . . . . . . . . . . . . . . . . . . . . . . . . . . . . . . . . . . . . . . . . . . . – 2.5 . . . . . . . . . . . . . . . . 1.5<br />
Financial result . . . . . . . . . . . . . . . . . . . . . . . . . . . . . . . . . . . . . . . . . . . . . . . . – 6.4 . . . . . . . . . . . . . . – 7.1<br />
EBT/Result from ordinary operations . . . . . . . . . . . . . . . . . . . . . . . . . . . . . . . 50.4 . . . . . . . . . . . . . . 47.6<br />
Taxes on income . . . . . . . . . . . . . . . . . . . . . . . . . . . . . . . . . . . . . . . . . . . . . . . . . – 23.0 . . . . . . . . . . . . . – 20.1<br />
<strong>Group</strong> profit . . . . . . . . . . . . . . . . . . . . . . . . . . . . . . . . . . . . . . . . . . . . . . . . . . . 27.4 . . . . . . . . . . . . . . 27.5<br />
Profit attributable <strong>to</strong> equity holders of <strong>Fraport</strong> <strong>AG</strong> . . . . . . . . . . . . . . . . . . . . . . . 27.7 . . . . . . . . . . . . . . . 27.7<br />
Profit or loss attributable <strong>to</strong> minority interests . . . . . . . . . . . . . . . . . . . . . . . . . . – 0.3 . . . . . . . . . . . . . . . 0.2<br />
Earnings per € 10 share in € (basic) . . . . . . . . . . . . . . . . . . . . . . . . . . . . . . . . 0.<strong>31</strong> . . . . . . . . . . . . . . 0.30<br />
Earnings per € 10 share in € (diluted) . . . . . . . . . . . . . . . . . . . . . . . . . . . . . . . 0.30 . . . . . . . . . . . . . . 0.30<br />
The identification of other taxes and the balancing and identification of shares in consolidated trading partnerships were changed<br />
(see notes). The figures from the previous year were adjusted for comparison purposes.<br />
<strong>Interim</strong> <strong>Report</strong> as at <strong>March</strong> <strong>31</strong>, <strong>2006</strong><br />
21
22 <strong>Interim</strong> <strong>Report</strong> as at <strong>March</strong> <strong>31</strong>, <strong>2006</strong><br />
Consolidated balance sheet<br />
Assets<br />
Balance at Balance at<br />
€ million Dec. <strong>31</strong>,2005 Mar. <strong>31</strong>, <strong>2006</strong><br />
Non-current assets<br />
Goodwill . . . . . . . . . . . . . . . . . . . . . . . . . . . . . . . . . . . . . . . . . . . . . . . . . . . . . . . . . . . . . . 108.3 . . . . . . . . . . . . . . . . 107.3<br />
Other intangible assets . . . . . . . . . . . . . . . . . . . . . . . . . . . . . . . . . . . . . . . . . . . . . . . . . . . . 50.2 . . . . . . . . . . . . . . . . . 47.9<br />
Property, plant and equipment . . . . . . . . . . . . . . . . . . . . . . . . . . . . . . . . . . . . . . . . . . . 2,587.3 . . . . . . . . . . . . . . 2,567.6<br />
Investment property . . . . . . . . . . . . . . . . . . . . . . . . . . . . . . . . . . . . . . . . . . . . . . . . . . . . . . 37.4 . . . . . . . . . . . . . . . . . 37.4<br />
Investments accounted for using the equity method . . . . . . . . . . . . . . . . . . . . . . . . . . . . . 53.6 . . . . . . . . . . . . . . . . . 52.5<br />
Other financial assets . . . . . . . . . . . . . . . . . . . . . . . . . . . . . . . . . . . . . . . . . . . . . . . . . . . . 209.5 . . . . . . . . . . . . . . . . 228.1<br />
Other receivables and other assets . . . . . . . . . . . . . . . . . . . . . . . . . . . . . . . . . . . . . . . . . . . 33.2 . . . . . . . . . . . . . . . . . 26.8<br />
Deferred tax assets . . . . . . . . . . . . . . . . . . . . . . . . . . . . . . . . . . . . . . . . . . . . . . . . . . . . . . . . 19.3 . . . . . . . . . . . . . . . . . 17.8<br />
3,098.8 . . . . . . . . . . . . . 3,085.4<br />
Current assets<br />
Inven<strong>to</strong>ries . . . . . . . . . . . . . . . . . . . . . . . . . . . . . . . . . . . . . . . . . . . . . . . . . . . . . . . . . . . . . . 14.4 . . . . . . . . . . . . . . . . . 11.9<br />
Trade accounts receivable . . . . . . . . . . . . . . . . . . . . . . . . . . . . . . . . . . . . . . . . . . . . . . . . . 190.0 . . . . . . . . . . . . . . . . 159.6<br />
Other receivables and other assets . . . . . . . . . . . . . . . . . . . . . . . . . . . . . . . . . . . . . . . . . . . 71.5 . . . . . . . . . . . . . . . . 306.7<br />
Cash an cash equivalents . . . . . . . . . . . . . . . . . . . . . . . . . . . . . . . . . . . . . . . . . . . . . . . . . . 574.2 . . . . . . . . . . . . . . . . 345.5<br />
Non-current assets held for sale . . . . . . . . . . . . . . . . . . . . . . . . . . . . . . . . . . . . . . . . . . . . . . 2.7 . . . . . . . . . . . . . . . . . 45.4<br />
852.8 . . . . . . . . . . . . . . . 869.1<br />
3,951.6 . . . . . . . . . . . . . 3,954.5<br />
Liabilities & Equity<br />
Balance at Balance at<br />
€ million Dec. <strong>31</strong>,2005 Mar. <strong>31</strong>, <strong>2006</strong><br />
Shareholders’ equity<br />
Issued capital . . . . . . . . . . . . . . . . . . . . . . . . . . . . . . . . . . . . . . . . . . . . . . . . . . . . . . . . . . . 910.7 . . . . . . . . . . . . . . . . 910.9<br />
Capital reserves . . . . . . . . . . . . . . . . . . . . . . . . . . . . . . . . . . . . . . . . . . . . . . . . . . . . . . . . . 550.5 . . . . . . . . . . . . . . . . 551.0<br />
Revenue reserves . . . . . . . . . . . . . . . . . . . . . . . . . . . . . . . . . . . . . . . . . . . . . . . . . . . . . . . . 599.2 . . . . . . . . . . . . . . . 603.3<br />
<strong>Group</strong> retained earnings . . . . . . . . . . . . . . . . . . . . . . . . . . . . . . . . . . . . . . . . . . . . . . . . . . .82.1 . . . . . . . . . . . . . . . . . 82.1<br />
<strong>Group</strong> result Jan. 1 – Mar. <strong>31</strong>, <strong>2006</strong> . . . . . . . . . . . . . . . . . . . . . . . . . . . . . . . . . . . . . . . . . . . . . – . . . . . . . . . . . . . . . . . 27.7<br />
Issued capital and reserve attributable <strong>to</strong> equity holders of <strong>Fraport</strong> <strong>AG</strong> . . . . . . . . . . . . 2,142.5 . . . . . . . . . . . . . . 2,175.0<br />
Minority interests, presented within equity(net) . . . . . . . . . . . . . . . . . . . . . . . . . . . . . . . . 15.4 . . . . . . . . . . . . . . . . . 19.6<br />
2,157.9 . . . . . . . . . . . . . . 2,194.6<br />
Non-current liabilities<br />
Financial liabilities . . . . . . . . . . . . . . . . . . . . . . . . . . . . . . . . . . . . . . . . . . . . . . . . . . . . . . . 622.4 . . . . . . . . . . . . . . . . 616.3<br />
Other liabilities . . . . . . . . . . . . . . . . . . . . . . . . . . . . . . . . . . . . . . . . . . . . . . . . . . . . . . . . . . 115.4 . . . . . . . . . . . . . . . . 106.4<br />
Deferred tax liabilities . . . . . . . . . . . . . . . . . . . . . . . . . . . . . . . . . . . . . . . . . . . . . . . . . . . . 112.2 . . . . . . . . . . . . . . . . 116.2<br />
Provisions for pensions and similar obligations . . . . . . . . . . . . . . . . . . . . . . . . . . . . . . . . . 21.4 . . . . . . . . . . . . . . . . . 21.3<br />
Provisions for income taxes . . . . . . . . . . . . . . . . . . . . . . . . . . . . . . . . . . . . . . . . . . . . . . . . 167.0 . . . . . . . . . . . . . . . . 159.0<br />
Other provisions and accruals . . . . . . . . . . . . . . . . . . . . . . . . . . . . . . . . . . . . . . . . . . . . . . 112.1 . . . . . . . . . . . . . . . . 108.1<br />
1,150.5 . . . . . . . . . . . . . . 1,127.3<br />
Current liabilities<br />
Financial liabilities . . . . . . . . . . . . . . . . . . . . . . . . . . . . . . . . . . . . . . . . . . . . . . . . . . . . . . . 140.1 . . . . . . . . . . . . . . . . 108.3<br />
Trade accounts payable . . . . . . . . . . . . . . . . . . . . . . . . . . . . . . . . . . . . . . . . . . . . . . . . . . . 173.3 . . . . . . . . . . . . . . . . 123.0<br />
Other liabilities . . . . . . . . . . . . . . . . . . . . . . . . . . . . . . . . . . . . . . . . . . . . . . . . . . . . . . . . . . 105.1 . . . . . . . . . . . . . . . . 145.1<br />
Provisions for income taxes . . . . . . . . . . . . . . . . . . . . . . . . . . . . . . . . . . . . . . . . . . . . . . . . . 18.5 . . . . . . . . . . . . . . . . . 14.3<br />
Other provisions . . . . . . . . . . . . . . . . . . . . . . . . . . . . . . . . . . . . . . . . . . . . . . . . . . . . . . . . 206.2 . . . . . . . . . . . . . . . . 207.1<br />
643.2 . . . . . . . . . . . . . . . 597.8<br />
Liabilities associated with the assets held for sale . . . . . . . . . . . . . . . . . . . . . . . . . . . . . . . . . . . . . . . . . . . . . . . . . . . 34.8<br />
643.2 . . . . . . . . . . . . . . . 632.6<br />
3,951.6 . . . . . . . . . . . . . 3,954.5<br />
The identification of other taxes and the balancing and identification of shares in consolidated trading partnerships were changed<br />
(see notes). The figures from the previous year were adjusted for comparison purposes.
Consolidated cash flow statement<br />
€ million Q1 2005 Q1 <strong>2006</strong> 2005<br />
Profit attributable <strong>to</strong> equity holders of <strong>Fraport</strong> <strong>AG</strong> . . . . . . . . . . . . . . . . . . . . . 27.7 . . . . . . . . . 27.7 . . . . . . . . 161.2<br />
Taxes on income . . . . . . . . . . . . . . . . . . . . . . . . . . . . . . . . . . . . . . . . . . . . . . . . . . 23.0 . . . . . . . . . . 20.1 . . . . . . . . . 123.9<br />
Profit attributable <strong>to</strong> minority interests . . . . . . . . . . . . . . . . . . . . . . . . . . . . . . . . – 0.1 . . . . . . . . . . 0.2 . . . . . . . . . . 0.3<br />
Adjustments for:<br />
Depreciation/write-ups (non-current assets) . . . . . . . . . . . . . . . . . . . . . . . 50.3 . . . . . . . . . 54.8 . . . . . . . . . 241.3<br />
Interest results . . . . . . . . . . . . . . . . . . . . . . . . . . . . . . . . . . . . . . . . . . . . . . . . 5.8 . . . . . . . . . . . 7.3 . . . . . . . . . . 23.1<br />
Income from investments . . . . . . . . . . . . . . . . . . . . . . . . . . . . . . . . . . . . . . – 1.7 . . . . . . . . . . 0.0 . . . . . . . . . – 6.3<br />
Gains/losses from disposals of non-current assets . . . . . . . . . . . . . . . . . . . – 0.1 . . . . . . . . . . . 1.1 . . . . . . . . . . 4.7<br />
Unrealized foreign currency results . . . . . . . . . . . . . . . . . . . . . . . . . . . . . . . 2.7 . . . . . . . . . . –1.0 . . . . . . . . . . 8.0<br />
Changes in investments accounted for using the equity method . . . . . . . . . . . – 0.2 . . . . . . . . . . 2.7 . . . . . . . . . – 6.7<br />
Changes in inven<strong>to</strong>ries . . . . . . . . . . . . . . . . . . . . . . . . . . . . . . . . . . . . . . . . . . . . – 0.4 . . . . . . . . . . 2.5 . . . . . . . . . – 2.3<br />
Changes in receivables and other assets . . . . . . . . . . . . . . . . . . . . . . . . . . . . . . – 36.4 . . . . . . . . . 30.8 . . . . . . . . – 12.1<br />
Changes in provisions . . . . . . . . . . . . . . . . . . . . . . . . . . . . . . . . . . . . . . . . . . . . . . 19.9 . . . . . . . . . – 1.8 . . . . . . . . . . 51.5<br />
Changes in liabilities . . . . . . . . . . . . . . . . . . . . . . . . . . . . . . . . . . . . . . . . . . . . . . 33.3 . . . . . . . . . – 6.7 . . . . . . . . . 66.9<br />
(w/o financial liabilities and provisions)<br />
Restructuring for assets groups held for sale . . . . . . . . . . . . . . . . . . . . . . . . . . . . . . . – . . . . . . . . . – 4.3 . . . . . . . . . . . . –<br />
(including liabilities)<br />
Operational activities . . . . . . . . . . . . . . . . . . . . . . . . . . . . . . . . . . . . . . . . . . . . . . 123.8 . . . . . . . . . 133.4 . . . . . . . . . 653.5<br />
Financial activities<br />
Interest paid . . . . . . . . . . . . . . . . . . . . . . . . . . . . . . . . . . . . . . . . . . . . . . . . – 9.7 . . . . . . . . – 10.4 . . . . . . . . – 40.1<br />
Interest received . . . . . . . . . . . . . . . . . . . . . . . . . . . . . . . . . . . . . . . . . . . . . . 3.9 . . . . . . . . . . . 3.1 . . . . . . . . . . 17.0<br />
Dividends received . . . . . . . . . . . . . . . . . . . . . . . . . . . . . . . . . . . . . . . . . . . . 1.7 . . . . . . . . . . . 0.0 . . . . . . . . . . . 6.3<br />
Taxes on income paid . . . . . . . . . . . . . . . . . . . . . . . . . . . . . . . . . . . . . . . . . . . . – 32.0 . . . . . . . . – 29.7 . . . . . . . – 143.0<br />
Cash flow from operating activities . . . . . . . . . . . . . . . . . . . . . . . . . . . . . . . . . 87.7 . . . . . . . . . 96.4 . . . . . . . . 493.7<br />
Capital expenditure for intangible assets . . . . . . . . . . . . . . . . . . . . . . . . . . . . . . – 3.4 . . . . . . . . . – 0.6 . . . . . . . . . – 9.3<br />
Capital expenditure for property, plant and equipment . . . . . . . . . . . . . . . . . – 69.4 . . . . . . . . – 75.8 . . . . . . . – 426.1<br />
Capital expenditure for investment accounted for using the equity method . . . . . – . . . . . . . . . . . . – . . . . . . . . . . . . –<br />
Investment property . . . . . . . . . . . . . . . . . . . . . . . . . . . . . . . . . . . . . . . . . . . . . – 20.7 . . . . . . . . . . . . – . . . . . . . . – 32.8<br />
Changes in consolidation . . . . . . . . . . . . . . . . . . . . . . . . . . . . . . . . . . . . . . . . . . . . . – . . . . . . . . . . . . – . . . . . . . . – 11.4<br />
Acquisition of subsidiaries . . . . . . . . . . . . . . . . . . . . . . . . . . . . . . . . . . . . . . . . . . . . . – . . . . . . . . . . . . – . . . . . . . . . – 2.5<br />
Disposal of subsidiaries . . . . . . . . . . . . . . . . . . . . . . . . . . . . . . . . . . . . . . . . . . . . . . . – . . . . . . . . . . . . – . . . . . . . . . . 0.8<br />
Other financial investments (long-term) . . . . . . . . . . . . . . . . . . . . . . . . . . . . . – 50.0 . . . . . . . . – 20.8 . . . . . . . – 191.7<br />
Other financial investments (short-term) . . . . . . . . . . . . . . . . . . . . . . . . . . . . . . . . . – . . . . . . . – 225.0 . . . . . . . . . . . . –<br />
Proceeds from disposal of non-current assets . . . . . . . . . . . . . . . . . . . . . . . . . . . . 5.0 . . . . . . . . . . . . – . . . . . . . . . 32.0<br />
Cash flow used in investing activities . . . . . . . . . . . . . . . . . . . . . . . . . . . . – 138.5 . . . . . . – 322.2 . . . . . . . – 618.2<br />
Dividends paid <strong>to</strong> shareholders of <strong>Fraport</strong> <strong>AG</strong> . . . . . . . . . . . . . . . . . . . . . . . . . . – 0.6 . . . . . . . . . – 0.0 . . . . . . . . – 67.9<br />
Dividends paid <strong>to</strong> minority shareholders . . . . . . . . . . . . . . . . . . . . . . . . . . . . . . . . . – . . . . . . . . . . . . – . . . . . . . . . .– 1.2<br />
Capital increase . . . . . . . . . . . . . . . . . . . . . . . . . . . . . . . . . . . . . . . . . . . . . . . . . . . . 1.2 . . . . . . . . . . 4.2 . . . . . . . . . 20.8<br />
Change in financial liabilities . . . . . . . . . . . . . . . . . . . . . . . . . . . . . . . . . . . . . . . . . 5.4 . . . . . . . . . – 7.1 . . . . . . . . . 94.5<br />
Cash inflow/outflow used in financing activities . . . . . . . . . . . . . . . . . . . . . . . 6.0 . . . . . . . . . – 2.9 . . . . . . . . . 46.2<br />
Changes in consolidation . . . . . . . . . . . . . . . . . . . . . . . . . . . . . . . . . . . . . . . . . . . . . – . . . . . . . . . . . . – . . . . . . . . – 11.4<br />
Foreign currency translation effect on cash and cash equivalents . . . . . . . . . . . – 0.3 . . . . . . . . . . 0.0 . . . . . . . . . – 2.5<br />
Change in cash and cash equivalents . . . . . . . . . . . . . . . . . . . . . . . . . . . . . . – 45.1 . . . . . . – 228.7 . . . . . . . – 92.2<br />
Cash and cash equivalents at Jan. 1 . . . . . . . . . . . . . . . . . . . . . . . . . . . . . . . . . . 666.4 . . . . . . . . . 574.2 . . . . . . . . 666.4<br />
Cash and cash equivalents at Mar. <strong>31</strong> resp. Dec. <strong>31</strong> . . . . . . . . . . . . . . . . . . . 621.3 . . . . . . . . 345.5 . . . . . . . . 574.2<br />
The identification of other taxes and the balancing and identification of shares in consolidated trading partnerships were changed<br />
(see notes). The figures from the previous year were adjusted for comparison purposes.<br />
<strong>Interim</strong> <strong>Report</strong> as at <strong>March</strong> <strong>31</strong>, <strong>2006</strong><br />
23
24 <strong>Interim</strong> <strong>Report</strong> as at <strong>March</strong> <strong>31</strong>, <strong>2006</strong><br />
Movements in consolidated shareholders’ equity<br />
Revenue reserves<br />
–––––––––––––––––––––––––––––––––––––––––––––––<br />
Issued Capital Legal Revenue Foreign Revaluation <strong>Group</strong> Profit Profit Total<br />
capital reserves reserves reserves currency reserves retained attributable <strong>to</strong> attributable <strong>to</strong><br />
reserves earnings equity holders minority<br />
€ million of <strong>Fraport</strong> <strong>AG</strong> interests<br />
Balance at Jan. 1, 2005 . . . . . . 905.1 . . . . . . . 539.3 . . . . . . . . 36.5 . . . . . . . 499.7 . . . . . . . . – 14.6 . . . . . . . . . – 3.2 . . . . . . . . 68.0 . . . . . . . . 2,030.8 . . . . . . . . . 10.8 . . . . . . 2,041.6<br />
Foreign currency<br />
translation differences . . . . . . . . – . . . . . . . . . . . – . . . . . . . . . . . – . . . . . . . . . . – . . . . . . . . . . .3.3 . . . . . . . . . . . . – . . . . . . . . . . . – . . . . . . . . . . . .3.3 . . . . . . . . . . . . – . . . . . . . . . . 3.3<br />
Fair value of financial assets<br />
held for sale . . . . . . . . . . . . . . . . – . . . . . . . . . . . – . . . . . . . . . . . – . . . . . . . . . . – . . . . . . . . . . . – . . . . . . . . . – 0.2 . . . . . . . . . . . – . . . . . . . . . . . – 0.2 . . . . . . . . . . . . – . . . . . . . . . – 0.2<br />
Fair value changes<br />
of derivatives . . . . . . . . . . . . . . . – . . . . . . . . . . . – . . . . . . . . . . . – . . . . . . . . . . – . . . . . . . . . . . – . . . . . . . . . – 0.5 . . . . . . . . . . . – . . . . . . . . . . . – 0.5 . . . . . . . . . . . . – . . . . . . . . . – 0.5<br />
Net gain(+)/Net costs (–)<br />
directly included in equity . . . 0.0 . . . . . . . . . . 0.0 . . . . . . . . . . 0.0 . . . . . . . . . . 0.0 . . . . . . . . . . . 3.3 . . . . . . . . . – 0.7 . . . . . . . . . . 0.0 . . . . . . . . . . . . 2.6 . . . . . . . . . . . 0.0 . . . . . . . . . . . 2.6<br />
Capital increase<br />
against deposits . . . . . . . . . . . 0.5 . . . . . . . . . . 0.7 . . . . . . . . . . . – . . . . . . . . . . . – . . . . . . . . . . . – . . . . . . . . . . . – . . . . . . . . . . . – . . . . . . . . . . . . 1.2 . . . . . . . . . . . . – . . . . . . . . . . 1.2<br />
Transfer of treasury shares . . . . . . 0.1 . . . . . . . . . . 0.1 . . . . . . . . . . . – . . . . . . . . . . . – . . . . . . . . . . . – . . . . . . . . . . . . – . . . . . . . . . . . – . . . . . . . . . . . . 0.2 . . . . . . . . . . . . – . . . . . . . . . . . 0.2<br />
Distribution . . . . . . . . . . . . . . . . . . . – . . . . . . . . . . . – . . . . . . . . . . . – . . . . . . . . . . . – . . . . . . . . . . . – . . . . . . . . . . . – . . . . . . . . . . .– . . . . . . . . . . . . 0.0 . . . . . . . . . – 0.6 . . . . . . . . . – 0.6<br />
<strong>Group</strong> profit<br />
Jan. 1 – Mar. <strong>31</strong>, 2005 . . . . . . . . . – . . . . . . . . . . . – . . . . . . . . . . . – . . . . . . . . . . . . . . . . . . . . . . . . – . . . . . . . . . . . . – . . . . . . . . . 27.7 . . . . . . . . . . . . 27.7 . . . . . . . . . – 0.3 . . . . . . . . . . 27.4<br />
Share options . . . . . . . . . . . . . . . . . – . . . . . . . . . .0.2 . . . . . . . . . . . – . . . . . . . . . . . . . . . . . . . . . . . . – . . . . . . . . . . . – . . . . . . . . . . . – . . . . . . . . . . . . 0.2 . . . . . . . . . . . . – . . . . . . . . . . 0.2<br />
Consolidation activity/<br />
other changes . . . . . . . . . . . . . . – . . . . . . . . . . . – . . . . . . . . . . . – . . . . . . . . . . . . . . . . . . . . . . . . – . . . . . . . . . – 0.7 . . . . . . . . . . . – . . . . . . . . . . . – 0.7 . . . . . . . . . – 0.7 . . . . . . . . . – 1.4<br />
Balance at Mar. <strong>31</strong>, 2005 . . . . 905.7 . . . . . . . 540.3 . . . . . . . . 36.5 . . . . . . . 499.7 . . . . . . . . – 11.3 . . . . . . . . . – 4.6 . . . . . . . . 95.7 . . . . . . . . 2,062.0 . . . . . . . . . . 9.2 . . . . . . . 2,071.2<br />
Balance at Jan. 1, <strong>2006</strong> . . . . . . 910.7 . . . . . . . 550.5 . . . . . . . . 36.5 . . . . . . . 577.8 . . . . . . . . . – 7.8 . . . . . . . . . – 7.3 . . . . . . . . 82.1 . . . . . . . . 2,142.5 . . . . . . . . . 15.4 . . . . . . . 2,157.9<br />
Foreign currency<br />
translation differences . . . . . . . . – . . . . . . . . . . . – . . . . . . . . . . . – . . . . . . . . . . – . . . . . . . . . – 1.2 . . . . . . . . . . . . – . . . . . . . . . . . – . . . . . . . . . . . – 1.2 . . . . . . . . . . . . – . . . . . . . . . – 1.2<br />
Fair value of financial assets<br />
held for sale . . . . . . . . . . . . . . . . – . . . . . . . . . . . – . . . . . . . . . . . – . . . . . . . . . . – . . . . . . . . . . . – . . . . . . . . . . 0.1 . . . . . . . . . . . – . . . . . . . . . . . . 0.1 . . . . . . . . . . . . – . . . . . . . . . . 0.1<br />
Fair value changes<br />
of derivatives . . . . . . . . . . . . . . . – . . . . . . . . . . . – . . . . . . . . . . . – . . . . . . . . . . – . . . . . . . . . . . – . . . . . . . . . . 5.4 . . . . . . . . . . . . . . . . . . . . . . . . . . 5.4 . . . . . . . . . . . 0.4 . . . . . . . . . . . 5.8<br />
Net gain(+)/Net costs (–)<br />
directly included in equity . . . 0.0 . . . . . . . . . . 0.0 . . . . . . . . . . 0.0 . . . . . . . . . . 0.0 . . . . . . . . . – 1.2 . . . . . . . . . . . 5.5 . . . . . . . . . . 0.0 . . . . . . . . . . . . 4.3 . . . . . . . . . . . 0.4 . . . . . . . . . . . 4.7<br />
Capital increase<br />
Frankfurt-Hahn Airport . . . . . . . – . . . . . . . . . . . – . . . . . . . . . . . – . . . . . . . . . . – . . . . . . . . . . . – . . . . . . . . . . . – . . . . . . . . . . . – . . . . . . . . . . . . 0.0 . . . . . . . . . . . 4.0 . . . . . . . . . . . 4.0<br />
Issue of shares for employee<br />
investment plan . . . . . . . . . . . . . – . . . . . . . . . . . – . . . . . . . . . . . – . . . . . . . . . . – . . . . . . . . . . . – . . . . . . . . . . . – . . . . . . . . . . . – . . . . . . . . . . . . 0.0 . . . . . . . . . . . . – . . . . . . . . . . 0.0<br />
Transfer of treasury shares . . . . . . 0.1 . . . . . . . . . . 0.1 . . . . . . . . . . . – . . . . . . . . . . . – . . . . . . . . . . . – . . . . . . . . . . . – . . . . . . . . . . . – . . . . . . . . . . . . 0.2 . . . . . . . . . . . . – . . . . . . . . . . 0.2<br />
Management s<strong>to</strong>ck option plan . . . . . . . . . . . . . . . . – . . . . . . . . . . . – . . . . . . . . . . – . . . . . . . . . . . – . . . . . . . . . . . – . . . . . . . . . . . – . . . . . . . . . . . . 0.0 . . . . . . . . . . . . – . . . . . . . . . . 0.0<br />
– Capital increase for<br />
exercise of options . . . . . . . . 0.1 . . . . . . . . . . 0.1 . . . . . . . . . . . – . . . . . . . . . . – . . . . . . . . . . . – . . . . . . . . . . . – . . . . . . . . . . . – . . . . . . . . . . . . 0.2 . . . . . . . . . . . . – . . . . . . . . . . 0.2<br />
– Value of performed services . . – . . . . . . . . . 0.3 . . . . . . . . . . . – . . . . . . . . . . – . . . . . . . . . . . – . . . . . . . . . . . – . . . . . . . . . . . – . . . . . . . . . . . . 0.3 . . . . . . . . . . . . – . . . . . . . . . . 0.3<br />
Distribution . . . . . . . . . . . . . . . . . . . – . . . . . . . . . . . – . . . . . . . . . . . – . . . . . . . . . . . – . . . . . . . . . . . – . . . . . . . . . . . – . . . . . . . . . . . . . . . . . . . . . . . . . 0.0 . . . . . . . . . . . . . . . . . . . . . . . . . 0.0<br />
<strong>Group</strong> profit<br />
Jan. 1 – Mar. <strong>31</strong>, <strong>2006</strong> . . . . . . . . . – . . . . . . . . . . . – . . . . . . . . . . . – . . . . . . . . . . . . . . . . . . . . . . . . – . . . . . . . . . . . – . . . . . . . . . 27.7 . . . . . . . . . . . . 27.7 . . . . . . . . . – 0.2 . . . . . . . . . . 27.5<br />
Consolidation activity/<br />
other changes . . . . . . . . . . . . . . – . . . . . . . . . . . – . . . . . . . . . . . – . . . . . . . . – 0.2 . . . . . . . . . . . . – . . . . . . . . . . . – . . . . . . . . . . . – . . . . . . . . . . . – 0.2 . . . . . . . . . . . . – . . . . . . . . . – 0.2<br />
Balance at Mar. <strong>31</strong>, <strong>2006</strong> . . . . 910.9 . . . . . . . 551.0 . . . . . . . . 36.5 . . . . . . . 577.6 . . . . . . . . . – 9.0 . . . . . . . . . – 1.8 . . . . . . . 109.8 . . . . . . . . 2,175.0 . . . . . . . . . 19.6 . . . . . . . 2,194.6<br />
The identification of other taxes and the balancing and identification of shares in consolidated trading partnerships were changed<br />
(see notes). The figures from the previous year were adjusted for comparison purposes.
Segment reporting<br />
€ million Q1 Aviation Retail & Ground External <strong>Group</strong><br />
Properties Handling Activities<br />
Revenue . . . . . . . . . . . <strong>2006</strong> . . . . . . 159.0 . . . . . . . . . . . . 91.4 . . . . . . . . . . . . 147.1 . . . . . . . . . . . 89.9 . . . . . . . . 487.4<br />
2005 . . . . . . 154.1 . . . . . . . . . . . . 92.5 . . . . . . . . . . . . 147.3 . . . . . . . . . . . 87.0 . . . . . . . 480.9<br />
Personnel expenses . . <strong>2006</strong> . . . . . . . 44.2 . . . . . . . . . . . . 40.2 . . . . . . . . . . . . . 87.7 . . . . . . . . . . . 90.0 . . . . . . . 262.1<br />
2005 . . . . . . . 45.4 . . . . . . . . . . . . 41.5 . . . . . . . . . . . . . 87.8 . . . . . . . . . . . 77.7 . . . . . . . 252.4<br />
EBITDA . . . . . . . . . . . <strong>2006</strong> . . . . . . . 26.7 . . . . . . . . . . . . 74.6 . . . . . . . . . . . . . . 7.5 . . . . . . . . . . . . 0.7 . . . . . . . 109.5<br />
2005 . . . . . . . 30.9 . . . . . . . . . . . . . 67.5 . . . . . . . . . . . . . 10.0 . . . . . . . . . . . – 1.3 . . . . . . . . 107.1<br />
Depreciation and<br />
amortization . . . . <strong>2006</strong> . . . . . . . 19.4 . . . . . . . . . . . . 21.7 . . . . . . . . . . . . . . 5.5 . . . . . . . . . . . . 8.2 . . . . . . . . 54.8<br />
2005 . . . . . . . 12.7 . . . . . . . . . . . . 24.4 . . . . . . . . . . . . . . 5.2 . . . . . . . . . . . . 8.0 . . . . . . . . 50.3<br />
EBIT . . . . . . . . . . . . . . <strong>2006</strong> . . . . . . . . 7.3 . . . . . . . . . . . . 52.9 . . . . . . . . . . . . . . 2.0 . . . . . . . . . . . – 7.5 . . . . . . . . 54.7<br />
2005 . . . . . . . 18.2 . . . . . . . . . . . . 43.4 . . . . . . . . . . . . . . 4.8 . . . . . . . . . . – 9.3 . . . . . . . . 56.8<br />
The identification of other taxes and the balancing and identification of shares in consolidated trading partnerships were changed<br />
(see notes). The figures from the previous year were adjusted for comparison purposes.<br />
<strong>Interim</strong> <strong>Report</strong> as at <strong>March</strong> <strong>31</strong>, <strong>2006</strong><br />
25
26 <strong>Interim</strong> <strong>Report</strong> as at <strong>March</strong> <strong>31</strong>, <strong>2006</strong><br />
Consolidated income statement, quarterly overview<br />
€ million Q1 2005 Q2 2005 Q3 2005 Q4 2005 Q1 <strong>2006</strong><br />
Revenue . . . . . . . . . . . . . . . . . . . . . . . . . . . . 480.9 . . . . . . . . . . . . . . . . 521.4 . . . . . . . . . . . . . . . . 560.3 . . . . . . . . . . . . . . . . 527.2 . . . . . . . . . . . . . . . . . 487.4<br />
Change in work-in process . . . . . . . . . . . . . . . . . 0.0 . . . . . . . . . . . . . . . . . . . 0.0 . . . . . . . . . . . . . . . . . . . 0.0 . . . . . . . . . . . . . . . . . . . 0.1. . . . . . . . . . . . . . . . . . . . 0.0<br />
Other internal work capitalized . . . . . . . . . . . . . 4.1 . . . . . . . . . . . . . . . . . . . 4.6 . . . . . . . . . . . . . . . . . . . 5.6 . . . . . . . . . . . . . . . . . . . 6.3. . . . . . . . . . . . . . . . . . . . 4.1<br />
Other operating income . . . . . . . . . . . . . . . . . . . 6.6 . . . . . . . . . . . . . . . . . . . 7.0 . . . . . . . . . . . . . . . . . . . 4.3 . . . . . . . . . . . . . . . . . . 13.3 . . . . . . . . . . . . . . . . . . . 13.1<br />
Total revenue . . . . . . . . . . . . . . . . . . . . . . . . 491.6 . . . . . . . . . . . . . . . . 533.0 . . . . . . . . . . . . . . . . 570.2 . . . . . . . . . . . . . . . . 546.9. . . . . . . . . . . . . . . . . 504.6<br />
Cost of materials . . . . . . . . . . . . . . . . . . . . . . . – 77.0 . . . . . . . . . . . . . . . . . – 75.9 . . . . . . . . . . . . . . . . . – 82.6 . . . . . . . . . . . . . . . . . – 98.1 . . . . . . . . . . . . . . . . . – 84.6<br />
Personnel expenses . . . . . . . . . . . . . . . . . . . – 252.4 . . . . . . . . . . . . . . . . – 260.0 . . . . . . . . . . . . . . . . – 254.0 . . . . . . . . . . . . . . . . – 266.1 . . . . . . . . . . . . . . . . – 262.1<br />
Other operating expenses . . . . . . . . . . . . . . . – 55.1 . . . . . . . . . . . . . . . . . – 46.7 . . . . . . . . . . . . . . . . . – 52.3 . . . . . . . . . . . . . . . . . – 79.0 . . . . . . . . . . . . . . . . . – 48.4<br />
EBITDA . . . . . . . . . . . . . . . . . . . . . . . . . . . . . 107.1 . . . . . . . . . . . . . . . . 150.4 . . . . . . . . . . . . . . . . 181.3 . . . . . . . . . . . . . . . . 103.7 . . . . . . . . . . . . . . . . 109.5<br />
Depreciation and amortization<br />
of tangible and intangible non-current<br />
assets and investment property . . . . . . . . – 50.3 . . . . . . . . . . . . . . . . . – 55.3 . . . . . . . . . . . . . . . . . – 64.8 . . . . . . . . . . . . . . . . . – 65.5 . . . . . . . . . . . . . . . . . – 54.8<br />
EBIT/Operating profit . . . . . . . . . . . . . . . . . . 56.8 . . . . . . . . . . . . . . . . . 95.1 . . . . . . . . . . . . . . . . . 116.5 . . . . . . . . . . . . . . . . . 38.2. . . . . . . . . . . . . . . . . . 54.7<br />
Interest result . . . . . . . . . . . . . . . . . . . . . . . . . . – 5.8 . . . . . . . . . . . . . . . . . . – 6.8 . . . . . . . . . . . . . . . . . . – 8.3 . . . . . . . . . . . . . . . . . . – 2.2 . . . . . . . . . . . . . . . . . . – 7.3<br />
Share of the profit/loss of investments<br />
accounted for using the equity method . . . . 0.2 . . . . . . . . . . . . . . . . . . . 2.0 . . . . . . . . . . . . . . . . . . . 2.7 . . . . . . . . . . . . . . . . . . . 3.3 . . . . . . . . . . . . . . . . . . – 1.3<br />
Income from investments . . . . . . . . . . . . . . . . . . 1.7 . . . . . . . . . . . . . . . . . . . 1.0 . . . . . . . . . . . . . . . . . . . 2.9 . . . . . . . . . . . . . . . . . . . 0.7. . . . . . . . . . . . . . . . . . . . 0.0<br />
Write-downs of financial assets . . . . . . . . . . . . . 0.0 . . . . . . . . . . . . . . . . . . – 1.1 . . . . . . . . . . . . . . . . . . – 0.2 . . . . . . . . . . . . . . . . . . . 0.0. . . . . . . . . . . . . . . . . . . . 0.0<br />
Other financial results . . . . . . . . . . . . . . . . . . . – 2.5 . . . . . . . . . . . . . . . . . . – 8.2 . . . . . . . . . . . . . . . . . . . 1.2 . . . . . . . . . . . . . . . . . . – 1.8. . . . . . . . . . . . . . . . . . . . 1.5<br />
Financial result . . . . . . . . . . . . . . . . . . . . . . . – 6.4 . . . . . . . . . . . . . . . . – 13.1 . . . . . . . . . . . . . . . . . – 1.7 . . . . . . . . . . . . . . . . . . 0.0. . . . . . . . . . . . . . . . . . – 7.1<br />
EBT/Result from ordinary operations . . . . . . 50.4 . . . . . . . . . . . . . . . . . 82.0 . . . . . . . . . . . . . . . . . 114.8 . . . . . . . . . . . . . . . . . 38.2 . . . . . . . . . . . . . . . . . . 47.6<br />
Taxes on income . . . . . . . . . . . . . . . . . . . . . . . – 23.0 . . . . . . . . . . . . . . . . . – 36.8 . . . . . . . . . . . . . . . . . – 52.1 . . . . . . . . . . . . . . . . . – 12.0 . . . . . . . . . . . . . . . . . – 20.1<br />
<strong>Group</strong> profit . . . . . . . . . . . . . . . . . . . . . . . . . . 27.4 . . . . . . . . . . . . . . . . . 45.2 . . . . . . . . . . . . . . . . . 62.7 . . . . . . . . . . . . . . . . . 26.2 . . . . . . . . . . . . . . . . . . 27.5<br />
Profit attributable<br />
<strong>to</strong> equity holders of <strong>Fraport</strong> <strong>AG</strong> . . . . . . . . . . 27.7 . . . . . . . . . . . . . . . . . . 45.1 . . . . . . . . . . . . . . . . . . 62.1 . . . . . . . . . . . . . . . . . . 26.3 . . . . . . . . . . . . . . . . . . . 27.7<br />
Profit attributable<br />
<strong>to</strong> minority shareholders . . . . . . . . . . . . . . . – 0.3 . . . . . . . . . . . . . . . . . . . 0.1 . . . . . . . . . . . . . . . . . . . 0.6 . . . . . . . . . . . . . . . . . . – 0.1 . . . . . . . . . . . . . . . . . . – 0.2<br />
The identification of other taxes and the balancing and identification of shares in consolidated trading partnerships were changed<br />
(see notes). The figures from the previous year were adjusted for comparison purposes.
Notes<br />
Accounting policies<br />
Since <strong>January</strong> 1, <strong>2006</strong>, other taxes are included in the other operating expenses within the operating<br />
result. In the first quarter of <strong>2006</strong> other taxes amounted <strong>to</strong> € 1.7 million, compared <strong>to</strong> € 3.1<br />
million in the previous year. The figures from the previous year have been adjusted for comparison<br />
purposes. The effects of the change of presenting other taxes are recognized in the operating<br />
result. The EBIT and EBITDA key figures are shown in the following overview:<br />
Q1 2005 Q1 2005 Q1 <strong>2006</strong><br />
€ million adjusted<br />
Other operating expenses . . . . . . . . . . . . . . . . . . . 52.0 . . . . . . . . . . . 55.1 . . . . . . . . . . . 48.4<br />
EBITDA . . . . . . . . . . . . . . . . . . . . . . . . . . . . . . . . . 110.2 . . . . . . . . . . 107.1 . . . . . . . . . . 109.5<br />
EBIT . . . . . . . . . . . . . . . . . . . . . . . . . . . . . . . . . . . . . 59.9 . . . . . . . . . . . 56.8 . . . . . . . . . . . 54.7<br />
Result from ordinary operations . . . . . . . . . . . . . . 53.7 . . . . . . . . . . . 50.4 . . . . . . . . . . . 47.6<br />
In line with IFRIC 2, the recognition and presentation of shares in consolidated partnerships were<br />
changed in the <strong>Fraport</strong> <strong>Group</strong> Financial Statements as of December <strong>31</strong>, 2005. Because of the<br />
change of showing minority interests in shareholders’ equity, the relevant amounts in the <strong>Group</strong><br />
<strong>Interim</strong> <strong>Report</strong> as of <strong>March</strong> <strong>31</strong>, 2005 were apportioned <strong>to</strong> liabilities in the case of the minority interests<br />
in shareholders’ capital of € 1.7 million and <strong>to</strong> the financial result in the case of the minority<br />
interests in the results of € 0.2 million.<br />
Because of the plan <strong>to</strong> sell shares <strong>to</strong> TCR, the consolidated assets and liabilities were presented in<br />
accordance with IFRS 5 and shown under the “Non-current assets held for sale“ and the “Liabilities<br />
directly associated with non-current assets classified as held for sale“.<br />
This <strong>Interim</strong> <strong>Report</strong> as of <strong>March</strong> <strong>31</strong>, <strong>2006</strong> for the <strong>Fraport</strong> <strong>Group</strong> was produced in accordance with<br />
IAS 34 which is in compliance with the International Financial <strong>Report</strong>ing Standards (IFRS) published<br />
by the International Accounting Standards Board (IASB) and their interpretation by the<br />
International Financial <strong>Report</strong>ing Interpretations Committee (IFRIC). All official bulletins of the<br />
IASB with manda<strong>to</strong>ry application from <strong>January</strong> 1 onwards have been taken in<strong>to</strong> account. Changes<br />
are indicated below.<br />
IFRIC 4 “Determining whether an Arrangement contains a Lease“ was published on December 2,<br />
2004. It defines conditions under which a contractual agreement, such as service and outsourcing<br />
agreements, shall be treated as leases in accordance with IAS 17. IFRIC 4 applies <strong>to</strong> financial years<br />
beginning on or after <strong>January</strong> 1, <strong>2006</strong>. The application of the interpretations has no significant<br />
effect on the assets, liabilities and result of the <strong>Fraport</strong> <strong>Group</strong>.<br />
IFRIC 5 “Rights <strong>to</strong> interests arising from Decommissioning, Res<strong>to</strong>ration and Environmental Rehabilitation<br />
Funds“ was published on December 16, 2005. IFRIC 5 deals with the accounting of interests<br />
in funds in which the businesses responsible for decommissioning or rehabilitation accumulate<br />
assets in order <strong>to</strong> finance subsequent expenditure from the fund. IFRIC 5 applies <strong>to</strong> financial<br />
years beginning on or after <strong>January</strong> 1, <strong>2006</strong>. The application of the interpretations has no significant<br />
effect on the situation of the <strong>Fraport</strong> <strong>Group</strong> in relation <strong>to</strong> assets, finances and results.<br />
The revision of IAS 19 was published on December 16, 2004. A further method of accounting was<br />
introduced which deals with the recognition of actuarial gains and losses. Actuarial gains and<br />
losses can now be included in equity immediately without affecting net income. Actuarial gains<br />
and losses are immediately recognized as expense in the <strong>Fraport</strong> <strong>Group</strong> in accordance with the<br />
method of accounting set out in IAS 19.92 in conjunction with IAS 19.93.<br />
<strong>Interim</strong> <strong>Report</strong> as at <strong>March</strong> <strong>31</strong>, <strong>2006</strong><br />
27
28 <strong>Interim</strong> <strong>Report</strong> as at <strong>March</strong> <strong>31</strong>, <strong>2006</strong><br />
The IASB published IFRS 7 “Financial Instruments; Disclosures“ on August 18, 2005. IFRS 7 replaces<br />
IAS 30 and parts of IAS 32 and redefines disclosure requirements for financial instruments.<br />
The standard should be applied by businesses from all sec<strong>to</strong>rs, where the extent of reporting<br />
required depends on the intensity of use of financial instruments and its contribution <strong>to</strong> risk. IFRS<br />
7 applies <strong>to</strong> financial years beginning on or after <strong>January</strong> 1, <strong>2006</strong>, although earlier application is<br />
encouraged. We have not yet applied IFRS 7.<br />
IASB published the following changes <strong>to</strong> IAS 39: “Currency risk for internal transactions within a<br />
consolidated <strong>Group</strong>“ on April 14, 2005, “Fair Value Option“ on June 16, 2005 and “Financial Guarantees“<br />
on August 18, 2005. The changes from August 18, 2005 relate <strong>to</strong> IAS 39 and IFRS 4 and<br />
require that liabilities as part of financial guarantees should be recognized as liability in the financial<br />
statements of the company with the liability. The changes <strong>to</strong> IAS 39 apply <strong>to</strong> financial years<br />
beginning on or after <strong>January</strong> 1, <strong>2006</strong>. The application of the revised standard will have no significant<br />
impact on the assets, liabilities and result of the <strong>Fraport</strong> <strong>Group</strong>.<br />
The IFRIC published interpretation IFRIC 8 “Area of application of IFRS 2“ on <strong>January</strong> 12, <strong>2006</strong>.<br />
IFRIC 8 clarifies that IFRS 2 shall be applied <strong>to</strong> agreements in which an entity makes share-based<br />
payments for apparently nil or an inadequate consideration. IFRIC applies <strong>to</strong> financial years beginning<br />
on or after May 1, <strong>2006</strong>. The application of IFRIC 8 will have no significant impact on the<br />
assets, liabilities and result of the <strong>Fraport</strong> <strong>Group</strong>.<br />
IFRIC 9 “Re-assessment of Embedded Derivatives“ was published on <strong>March</strong> 1, <strong>2006</strong>. IAS 39<br />
“Financial Instruments: Recognition and Measurement“ requires that a business should check<br />
whether a contract contains an embedded derivative that should be separated from the main<br />
contract and recognized as a separate derivative.<br />
IFRIC 9 looks at the question of whether, according <strong>to</strong> IAS 39, such a measurement is only necessary<br />
if the company becomes a party in the structured contract or for the whole term of the contract.<br />
IFRIC 9 applies <strong>to</strong> financial years beginning on or after <strong>January</strong> 1, <strong>2006</strong>. The application of IFRIC 9<br />
will have no significant impact on the assets, liabilities and result of the <strong>Fraport</strong> <strong>Group</strong>.<br />
With effect from <strong>January</strong> 1, <strong>2006</strong>, the principles of accounting in hyperinflationary economies<br />
(IAS 29) no longer apply <strong>to</strong> Antalya, our company in Turkey. The criteria for classifying Turkey as a<br />
hyperinflationary economy no longer apply in the financial year. The currency conversion for the<br />
interim financial statement of Antalya is carried out in accordance with IAS 21, i.e. in line with the<br />
concept of functional currency. This did not have any major impact on assets or earnings.<br />
This interim report also meets the requirements of German Accounting Standard DRS 6 for the<br />
production of interim reports approved by the German Standards Council (DSR) and published<br />
by the German Ministry for Justice (BMJ) on February 13, 2001.<br />
Consolidated companies<br />
There have been no changes <strong>to</strong> the consolidated companies belonging <strong>to</strong> the <strong>Fraport</strong> consolidated<br />
<strong>Group</strong> since December <strong>31</strong>, 2005.
Explana<strong>to</strong>ry notes about selected balance sheet<br />
and income statement items<br />
Interest results<br />
€ million Q1 2005 Q1 <strong>2006</strong><br />
Interest income . . . . . . . . . . . . . . . . . . . . . . . . . . . . . . . 3.9 . . . . . . . . . . 3.1<br />
Interest expenses . . . . . . . . . . . . . . . . . . . . . . . . . . . . – 9.7 . . . . . . . – 10.4<br />
Share of profit/loss of investments<br />
accounted for using the equity method<br />
– 5.8 . . . . . . . . – 7.3<br />
€ million Q1 2005 Q1 <strong>2006</strong><br />
Flughafen Hannover-Langenhagen GmbH . . . . . . . . – 0.7 . . . . . . . . – 0.6<br />
LAP Lima Airport Partners S. R. L. . . . . . . . . . . . . . . . . . 0.6 . . . . . . . . . . 0.0<br />
ACF Airmail Center Frankfurt GmbH . . . . . . . . . . . . . . . 0.0 . . . . . . . . . . 0.0<br />
ASG Airport Service Gesellschaft mbH . . . . . . . . . . . . . 0.3 . . . . . . . . . . 0.1<br />
Portway-Handling de Portugal S. A. . . . . . . . . . . . . . . . 0.0 . . . . . . . . . . 0.0<br />
Grundstücksgesellschaft<br />
Gateway Gardens GmbH . . . . . . . . . . . . . . . . . . . . . 0.0 . . . . . . . . – 0.7<br />
Tradeport Hong Kong Ltd. . . . . . . . . . . . . . . . . . . . . . . . 0.0 . . . . . . . . – 0.1<br />
Frankfurt am Main, May 10, <strong>2006</strong><br />
<strong>Fraport</strong> <strong>AG</strong><br />
Frankfurt Airport Services Worldwide<br />
The Executive Board<br />
0.2 . . . . . . . . – 1.3<br />
Dr Bender Prof Schölch Mai Dr Schulte<br />
Income from investments<br />
<strong>Interim</strong> <strong>Report</strong> as at <strong>March</strong> <strong>31</strong>, <strong>2006</strong><br />
29<br />
€ million Q1 2005 Q1 <strong>2006</strong><br />
Ineuropa Handling UTE . . . . . . . . . . . . . . . . . . . . . . . . 1.7 . . . . . . . . . . 0.0<br />
Other financial results<br />
1.7 . . . . . . . . . 0.0<br />
€ million Q1 2005 Q1 <strong>2006</strong><br />
Income<br />
Income from securities and loans . . . . . . . . . . . . . . . . . 0.6 . . . . . . . . . . 1.5<br />
Foreign currency gains . . . . . . . . . . . . . . . . . . . . . . . . . 0.0 . . . . . . . . . . 1.3<br />
Valuation of derivatives . . . . . . . . . . . . . . . . . . . . . . . . . 0,0 . . . . . . . . . . 0.6<br />
0.6 . . . . . . . . . 3.4<br />
Expenses<br />
Foreign currency losses . . . . . . . . . . . . . . . . . . . . . . . . – 2.6 . . . . . . . . . – 0.3<br />
Valuation of derivatives . . . . . . . . . . . . . . . . . . . . . . . . – 0.3 . . . . . . . . . . 0.0<br />
Minority shareholders’ share of GCS . . . . . . . . . . . . . – 0.2 . . . . . . . . . – 0.2<br />
Fair valuation for securities of financial assets . . . . . . . . 0.0 . . . . . . . . . – 1.4<br />
– 3,1 . . . . . . . . – 1.9<br />
– 2.5 . . . . . . . . . . 1.5
30 <strong>Interim</strong> <strong>Report</strong> as at <strong>March</strong> <strong>31</strong>, <strong>2006</strong><br />
Financial Calendar<br />
May <strong>31</strong>, <strong>2006</strong> . . . . . . . . . . . Annual General Meeting<br />
August 8, <strong>2006</strong> . . . . . . . . . . <strong>Interim</strong> report 2nd quarter <strong>2006</strong><br />
November 7, <strong>2006</strong> . . . . . . . <strong>Interim</strong> report 3rd quarter <strong>2006</strong><br />
Contacts<br />
<strong>Fraport</strong> <strong>AG</strong><br />
Frankfurt Airport Services Worldwide<br />
60547 Frankfurt am Main<br />
Germany<br />
Telephone: 01805 3724636 or 01805-FRAINFO<br />
From outside Germany: +49 69 690-0<br />
Internet: www.fraport.com<br />
Inves<strong>to</strong>r Relations<br />
Telephone : +49 69 690-74842<br />
Fax: +49 69 690-74843<br />
E-Mail: inves<strong>to</strong>r.relations@fraport.de<br />
Imprint<br />
Published by: <strong>Fraport</strong> <strong>AG</strong> Frankfurt Airport Services Worldwide.<br />
Content: Inves<strong>to</strong>r Relations (VFI).<br />
Layout and production: Corporate Communications (UKM-IK).<br />
(5/06/0,25)