DOCUMENTATION OF LAND USE INDICATORS ... - GaBi Software
DOCUMENTATION OF LAND USE INDICATORS ... - GaBi Software
DOCUMENTATION OF LAND USE INDICATORS ... - GaBi Software

Create successful ePaper yourself
Turn your PDF publications into a flip-book with our unique Google optimized e-Paper software.
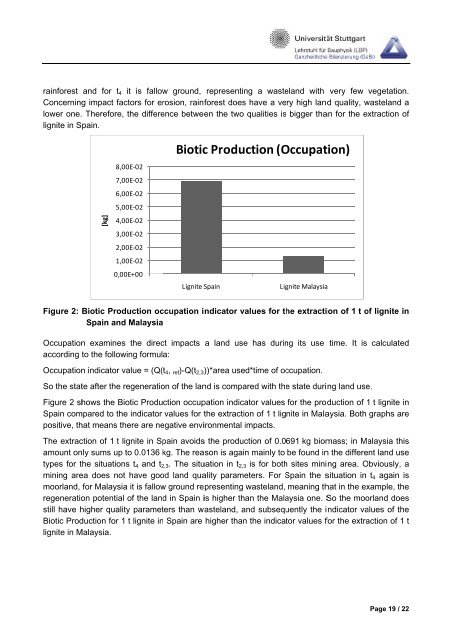
ainforest and for t4 it is fallow w ground, representin ng a waste eland with very few vegetation. .<br />
Concerningg<br />
impact faactors<br />
for er rosion, rainfforest<br />
does s have a ve ery high land<br />
quality, wasteland w a<br />
lower one. Therefore, , the differe ence betweeen<br />
the two qualities is s bigger thaan<br />
for the extraction<br />
off<br />
lignite in Spain.<br />
[kg]<br />
8,000E‐02<br />
7,000E‐02<br />
6,000E‐02<br />
5,000E‐02<br />
4,000E‐02<br />
3,000E‐02<br />
2,000E‐02<br />
1,000E‐02<br />
0,000E+00<br />
Bioticc<br />
Production<br />
(OOccupattion)<br />
Lignite SSpain<br />
Liggnite<br />
Malaysiaa<br />
Figure 2: Biotic Prodduction<br />
oc ccupation indicator<br />
va alues for the<br />
extractiion<br />
of 1 t of o lignite inn<br />
Spain andd<br />
Malaysia<br />
Occupationn<br />
examiness<br />
the direc ct impacts a land use e has durin ng its use<br />
according to the followwing<br />
formula a:<br />
time. It is<br />
Occupationn<br />
indicator vvalue<br />
= (Q(t t4, ref)-Q(t2,3))*area<br />
used*time<br />
of oc ccupation.<br />
So the statte<br />
after the regeneratio on of the lannd<br />
is compa ared with the<br />
state during<br />
land use e.<br />
calculatedd<br />
Figure 2 shhows<br />
the BBiotic<br />
Production<br />
occuppation<br />
indica ator values for the production<br />
of 1 t lignite inn<br />
Spain commpared<br />
to thhe<br />
indicator values for tthe<br />
extraction<br />
of 1 t lignite<br />
in Malaaysia.<br />
Both graphs aree<br />
positive, thhat<br />
means there<br />
are ne egative enviironmental<br />
impacts. i<br />
The extracction<br />
of 1 t lignite in Sp pain avoidss<br />
the produc ction of 0.0691<br />
kg biommass;<br />
in Malaysia<br />
thiss<br />
amount onnly<br />
sums up to 0.0136 kg. k The reaason<br />
is again<br />
mainly to be found inn<br />
the differe ent land usee<br />
types for tthe<br />
situationns<br />
t4 and t2 2,3. The situuation<br />
in t2,3 3 is for both h sites miniing<br />
area. Obviously, O a<br />
mining areea<br />
does noot<br />
have goo od land quaality<br />
parame eters. For Spain S the ssituation<br />
in t4 again iss<br />
moorland, for Malaysia<br />
it is fallow w ground representing<br />
wasteland, meaning thhat<br />
in the ex xample, thee<br />
regeneratioon<br />
potential<br />
of the land d in Spain iis<br />
higher than<br />
the Mala aysia one. SSo<br />
the moo orland doess<br />
still have hhigher<br />
qualiity<br />
paramet ters than wasteland,<br />
and a subsequ uently the iindicator<br />
va alues of thee<br />
Biotic Prodduction<br />
for 1 t lignite in Spain are higher than n the indicator<br />
values ffor<br />
the extra action of 1 t<br />
lignite in MMalaysia.<br />
Page 19 / 222