FY 2008 Annual Report of Achievements - Gallaudet University
FY 2008 Annual Report of Achievements - Gallaudet University FY 2008 Annual Report of Achievements - Gallaudet University
124 Table 41. Number of KDES Students Receiving Support Services by Race/Ethnicity, AY 2007-2008 Traditionally underserved racial/ethnic groups All traditionally underserved African Asian/ Other & All Caucasian racial/ethnic American or Pacific multi-ethnic/ students students group students black Hispanic Islander racial groups Support services (N=127) (N=54) (N=73) (N=48) (N=16) (N=5) (N=4) No support services 13 8 5 3 0 0 2 1 or more support services 114 46 68 45 16 5 2 Oral interpreting 0 0 0 0 0 0 0 Sign interpreting 0 0 0 0 0 0 0 Cued language transliteration 0 0 0 0 0 0 0 Sign language transliteration 0 0 0 0 0 0 0 Tutoring 3 0 3 2 1 0 0 Vision services/orientation and mobility 3 0 3 1 0 1 1 Special deaf/blind interpreting services 0 0 0 0 0 0 0 Speech training/therapy 101 44 57 38 14 4 1 Oral/aural therapy 5 3 2 0 1 1 0 Notetaking 0 0 0 0 0 0 0 Communication Access Realtime Translation (CART) 0 0 0 0 0 0 0 Audiological services 40 22 18 13 2 3 0 Counseling 32 8 24 15 7 1 1 Itinerant teacher services 0 0 0 0 0 0 0 Classroom aide services 4 1 3 3 0 0 0 C-Print 0 0 0 0 0 0 0 TypeWell 0 0 0 0 0 0 0 OT/PT 26 7 19 15 1 1 2 Adaptive PE 0 0 0 0 0 0 0 Other support services 57 15 42 29 9 3 1 Extended school year (ESY) 56 15 41 29 9 2 1 ASL instruction 6 0 6 4 0 2 0 Additional services 1 1 0 1 1 0 0 0 1Includes play therapy.
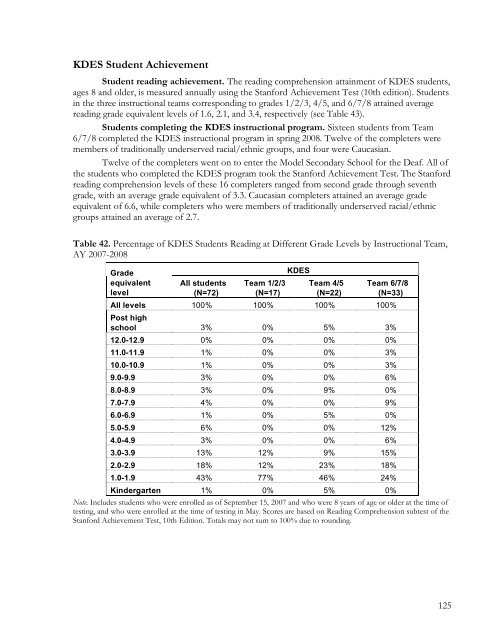
KDES Student Achievement Student reading achievement. The reading comprehension attainment of KDES students, ages 8 and older, is measured annually using the Stanford Achievement Test (10th edition). Students in the three instructional teams corresponding to grades 1/2/3, 4/5, and 6/7/8 attained average reading grade equivalent levels of 1.6, 2.1, and 3.4, respectively (see Table 43). Students completing the KDES instructional program. Sixteen students from Team 6/7/8 completed the KDES instructional program in spring 2008. Twelve of the completers were members of traditionally underserved racial/ethnic groups, and four were Caucasian. Twelve of the completers went on to enter the Model Secondary School for the Deaf. All of the students who completed the KDES program took the Stanford Achievement Test. The Stanford reading comprehension levels of these 16 completers ranged from second grade through seventh grade, with an average grade equivalent of 3.3. Caucasian completers attained an average grade equivalent of 6.6, while completers who were members of traditionally underserved racial/ethnic groups attained an average of 2.7. Table 42. Percentage of KDES Students Reading at Different Grade Levels by Instructional Team, AY 2007-2008 Grade equivalent level All students (N=72) Team 1/2/3 (N=17) KDES Team 4/5 (N=22) Team 6/7/8 (N=33) All levels 100% 100% 100% 100% Post high school 3% 0% 5% 3% 12.0-12.9 0% 0% 0% 0% 11.0-11.9 1% 0% 0% 3% 10.0-10.9 1% 0% 0% 3% 9.0-9.9 3% 0% 0% 6% 8.0-8.9 3% 0% 9% 0% 7.0-7.9 4% 0% 0% 9% 6.0-6.9 1% 0% 5% 0% 5.0-5.9 6% 0% 0% 12% 4.0-4.9 3% 0% 0% 6% 3.0-3.9 13% 12% 9% 15% 2.0-2.9 18% 12% 23% 18% 1.0-1.9 43% 77% 46% 24% Kindergarten 1% 0% 5% 0% Note. Includes students who were enrolled as of September 15, 2007 and who were 8 years of age or older at the time of testing, and who were enrolled at the time of testing in May. Scores are based on Reading Comprehension subtest of the Stanford Achievement Test, 10th Edition. Totals may not sum to 100% due to rounding. 125
- Page 82 and 83: 74 Table 11. FY 2008 Awards: Report
- Page 84 and 85: 76 Table 12. FY 2008 Proposals: Rep
- Page 86 and 87: 78 Table 12. FY 2008 Proposals: Rep
- Page 88 and 89: professionals who are interested in
- Page 90 and 91: to post assignments and participate
- Page 92 and 93: its effect on language acquisition,
- Page 94 and 95: • Culver City, Calif. Quest condu
- Page 96 and 97: History 1857 Amos Kendall establish
- Page 98 and 99: conference. More than 300 people re
- Page 100 and 101: 92 Government Performance and Resul
- Page 102 and 103: 94 Survey sample for measures 3.4,
- Page 104 and 105: 15. A Lifetime of Learning and Earn
- Page 106 and 107: The numbers reflected in tables 22-
- Page 108 and 109: Clerc Center Catalog. The Clerc Cen
- Page 110 and 111: Publications The Clerc Center produ
- Page 112 and 113: Art Exhibition. Yes, I Can!, a body
- Page 114 and 115: 106 Table 24. FY 2008 Training and
- Page 116 and 117: 108 Table 27. FY 2008 Training and
- Page 118 and 119: 110 Table 30. FY 2008 Clerc Center
- Page 120 and 121: KDES Initiatives Literacy initiativ
- Page 122 and 123: other teams, parents, and individua
- Page 124 and 125: 116 KDES Student Characteristics, R
- Page 126 and 127: Traditionally underserved racial/et
- Page 128 and 129: Table 37. Number of KDES Students W
- Page 130 and 131: Table 39. Number of KDES Students R
- Page 134 and 135: Table 43. Number of KDES Students R
- Page 136 and 137: Table 45. Percentage of MSSD Studen
- Page 138 and 139: Languages spoken in the homes of MS
- Page 140 and 141: Table 51. Percentage of MSSD Studen
- Page 142 and 143: 134 Table 53. Percentage of MSSD St
- Page 144 and 145: MSSD Student Outcomes Student readi
- Page 146 and 147: Reading achievement of graduates. A
- Page 148 and 149: Table 59. Percentage of MSSD Gradua
- Page 150 and 151: 142 Division of Administration and
- Page 153 and 154: Table of Contents UNIVERSITY RESEAR
- Page 155 and 156: AN AUTOMATIC FITTING ALGORITHM FOR
- Page 157 and 158: DRINKING AMONG DEAF AND HARD OF HEA
- Page 159 and 160: University Research Projects The Hi
- Page 161 and 162: Arnos, K.S. (2008, March). Genetics
- Page 163 and 164: Research Stipends to Support Senior
- Page 165 and 166: Chemistry and Physics District of C
- Page 167 and 168: time (new documentation/updated pro
- Page 169 and 170: Communication Studies Families Who
- Page 171 and 172: Strauss, K.P., & Harkins, J. (2007,
- Page 173 and 174: achieved; three of the children als
- Page 175 and 176: The central focus of the ongoing an
- Page 177 and 178: Mertens, D.M. (2008, July). Transfo
- Page 179 and 180: ICARE Schools: A Research Study of
- Page 181 and 182: FY 2007-2008 product(s): Gerner de
KDES Student Achievement<br />
Student reading achievement. The reading comprehension attainment <strong>of</strong> KDES students,<br />
ages 8 and older, is measured annually using the Stanford Achievement Test (10th edition). Students<br />
in the three instructional teams corresponding to grades 1/2/3, 4/5, and 6/7/8 attained average<br />
reading grade equivalent levels <strong>of</strong> 1.6, 2.1, and 3.4, respectively (see Table 43).<br />
Students completing the KDES instructional program. Sixteen students from Team<br />
6/7/8 completed the KDES instructional program in spring <strong>2008</strong>. Twelve <strong>of</strong> the completers were<br />
members <strong>of</strong> traditionally underserved racial/ethnic groups, and four were Caucasian.<br />
Twelve <strong>of</strong> the completers went on to enter the Model Secondary School for the Deaf. All <strong>of</strong><br />
the students who completed the KDES program took the Stanford Achievement Test. The Stanford<br />
reading comprehension levels <strong>of</strong> these 16 completers ranged from second grade through seventh<br />
grade, with an average grade equivalent <strong>of</strong> 3.3. Caucasian completers attained an average grade<br />
equivalent <strong>of</strong> 6.6, while completers who were members <strong>of</strong> traditionally underserved racial/ethnic<br />
groups attained an average <strong>of</strong> 2.7.<br />
Table 42. Percentage <strong>of</strong> KDES Students Reading at Different Grade Levels by Instructional Team,<br />
AY 2007-<strong>2008</strong><br />
Grade<br />
equivalent<br />
level<br />
All students<br />
(N=72)<br />
Team 1/2/3<br />
(N=17)<br />
KDES<br />
Team 4/5<br />
(N=22)<br />
Team 6/7/8<br />
(N=33)<br />
All levels 100% 100% 100% 100%<br />
Post high<br />
school 3% 0% 5% 3%<br />
12.0-12.9 0% 0% 0% 0%<br />
11.0-11.9 1% 0% 0% 3%<br />
10.0-10.9 1% 0% 0% 3%<br />
9.0-9.9 3% 0% 0% 6%<br />
8.0-8.9 3% 0% 9% 0%<br />
7.0-7.9 4% 0% 0% 9%<br />
6.0-6.9 1% 0% 5% 0%<br />
5.0-5.9 6% 0% 0% 12%<br />
4.0-4.9 3% 0% 0% 6%<br />
3.0-3.9 13% 12% 9% 15%<br />
2.0-2.9 18% 12% 23% 18%<br />
1.0-1.9 43% 77% 46% 24%<br />
Kindergarten 1% 0% 5% 0%<br />
Note. Includes students who were enrolled as <strong>of</strong> September 15, 2007 and who were 8 years <strong>of</strong> age or older at the time <strong>of</strong><br />
testing, and who were enrolled at the time <strong>of</strong> testing in May. Scores are based on Reading Comprehension subtest <strong>of</strong> the<br />
Stanford Achievement Test, 10th Edition. Totals may not sum to 100% due to rounding.<br />
125


