FY 2008 Annual Report of Achievements - Gallaudet University
FY 2008 Annual Report of Achievements - Gallaudet University FY 2008 Annual Report of Achievements - Gallaudet University
Table 39. Number of KDES Students Receiving Support Services by Instructional Team, AY 2007-2008 Support services 122 GRI Annual Survey 1 (N=36,727) All students (N=127) ECE Team (N=53) KDES Team 1/2/3 (N=19) Team 4/5 (N=22) Team 6/7/8 (N=33) No support services 2,989 13 3 3 2 5 1 or more support services 33,738 114 50 16 20 28 Oral interpreting 311 0 0 0 0 0 Sign interpreting 8,640 0 0 0 0 0 Cued language transliteration 110 0 0 0 0 0 Sign language transliteration NA 0 0 0 0 0 Tutoring 3,520 3 0 2 1 0 Vision services/orientation and mobility 477 3 2 0 1 0 Special deaf/blind interpreting services NA 0 0 0 0 0 Speech training/therapy 21,102 101 48 14 19 20 Oral/aural therapy NA 5 5 0 0 0 Notetaking 1,644 0 0 0 0 0 Communication Access Realtime Translation (CART) NA 0 0 0 0 0 Audiological services 8,484 40 39 0 1 0 Counseling 3,690 32 2 7 7 16 Itinerant teacher services 14,235 0 0 0 0 0 Classroom aide services 7,436 4 2 1 1 0 C-Print 314 0 0 0 0 0 TypeWell NA 0 0 0 0 0 OT/PT 3,577 26 14 2 7 3 Adaptive PE 1,707 0 0 0 0 0 Other support services 4,690 57 31 8 11 7 Extended school year (ESY) NA 56 30 8 11 7 ASL instruction NA 6 6 0 0 0 Additional services 2 NA 1 1 0 0 0 1From Regional and national summary report of data from the 2006-2007 Annual Survey of Deaf and Hard of Hearing Children and Youth, by Gallaudet Research Institute, 2007, Washington, DC: Gallaudet University. 2Includes play therapy.
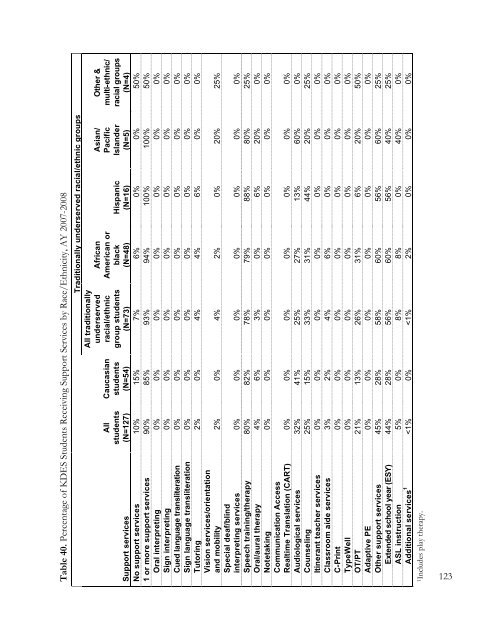
Table 40. Percentage of KDES Students Receiving Support Services by Race/Ethnicity, AY 2007-2008 Traditionally underserved racial/ethnic groups All traditionally underserved African Asian/ Other & All Caucasian racial/ethnic American or Pacific multi-ethnic/ students students group students black Hispanic Islander racial groups Support services (N=127) (N=54) (N=73) (N=48) (N=16) (N=5) (N=4) No support services 10% 15% 7% 6% 0% 0% 50% 1 or more support services 90% 85% 93% 94% 100% 100% 50% Oral interpreting 0% 0% 0% 0% 0% 0% 0% Sign interpreting 0% 0% 0% 0% 0% 0% 0% Cued language transliteration 0% 0% 0% 0% 0% 0% 0% Sign language transliteration 0% 0% 0% 0% 0% 0% 0% Tutoring 2% 0% 4% 4% 6% 0% 0% Vision services/orientation and mobility 2% 0% 4% 2% 0% 20% 25% Special deaf/blind interpreting services 0% 0% 0% 0% 0% 0% 0% Speech training/therapy 80% 82% 78% 79% 88% 80% 25% Oral/aural therapy 4% 6% 3% 0% 6% 20% 0% Notetaking 0% 0% 0% 0% 0% 0% 0% Communication Access Realtime Translation (CART) 0% 0% 0% 0% 0% 0% 0% Audiological services 32% 41% 25% 27% 13% 60% 0% Counseling 25% 15% 33% 31% 44% 20% 25% Itinerant teacher services 0% 0% 0% 0% 0% 0% 0% Classroom aide services 3% 2% 4% 6% 0% 0% 0% C-Print 0% 0% 0% 0% 0% 0% 0% TypeWell 0% 0% 0% 0% 0% 0% 0% OT/PT 21% 13% 26% 31% 6% 20% 50% Adaptive PE 0% 0% 0% 0% 0% 0% 0% Other support services 45% 28% 58% 60% 56% 60% 25% Extended school year (ESY) 44% 28% 56% 60% 56% 40% 25% ASL instruction 5% 0% 8% 8% 0% 40% 0% Additional services 1
- Page 80 and 81: Figure 37. Research at Gallaudet, 2
- Page 82 and 83: 74 Table 11. FY 2008 Awards: Report
- Page 84 and 85: 76 Table 12. FY 2008 Proposals: Rep
- Page 86 and 87: 78 Table 12. FY 2008 Proposals: Rep
- Page 88 and 89: professionals who are interested in
- Page 90 and 91: to post assignments and participate
- Page 92 and 93: its effect on language acquisition,
- Page 94 and 95: • Culver City, Calif. Quest condu
- Page 96 and 97: History 1857 Amos Kendall establish
- Page 98 and 99: conference. More than 300 people re
- Page 100 and 101: 92 Government Performance and Resul
- Page 102 and 103: 94 Survey sample for measures 3.4,
- Page 104 and 105: 15. A Lifetime of Learning and Earn
- Page 106 and 107: The numbers reflected in tables 22-
- Page 108 and 109: Clerc Center Catalog. The Clerc Cen
- Page 110 and 111: Publications The Clerc Center produ
- Page 112 and 113: Art Exhibition. Yes, I Can!, a body
- Page 114 and 115: 106 Table 24. FY 2008 Training and
- Page 116 and 117: 108 Table 27. FY 2008 Training and
- Page 118 and 119: 110 Table 30. FY 2008 Clerc Center
- Page 120 and 121: KDES Initiatives Literacy initiativ
- Page 122 and 123: other teams, parents, and individua
- Page 124 and 125: 116 KDES Student Characteristics, R
- Page 126 and 127: Traditionally underserved racial/et
- Page 128 and 129: Table 37. Number of KDES Students W
- Page 132 and 133: 124 Table 41. Number of KDES Studen
- Page 134 and 135: Table 43. Number of KDES Students R
- Page 136 and 137: Table 45. Percentage of MSSD Studen
- Page 138 and 139: Languages spoken in the homes of MS
- Page 140 and 141: Table 51. Percentage of MSSD Studen
- Page 142 and 143: 134 Table 53. Percentage of MSSD St
- Page 144 and 145: MSSD Student Outcomes Student readi
- Page 146 and 147: Reading achievement of graduates. A
- Page 148 and 149: Table 59. Percentage of MSSD Gradua
- Page 150 and 151: 142 Division of Administration and
- Page 153 and 154: Table of Contents UNIVERSITY RESEAR
- Page 155 and 156: AN AUTOMATIC FITTING ALGORITHM FOR
- Page 157 and 158: DRINKING AMONG DEAF AND HARD OF HEA
- Page 159 and 160: University Research Projects The Hi
- Page 161 and 162: Arnos, K.S. (2008, March). Genetics
- Page 163 and 164: Research Stipends to Support Senior
- Page 165 and 166: Chemistry and Physics District of C
- Page 167 and 168: time (new documentation/updated pro
- Page 169 and 170: Communication Studies Families Who
- Page 171 and 172: Strauss, K.P., & Harkins, J. (2007,
- Page 173 and 174: achieved; three of the children als
- Page 175 and 176: The central focus of the ongoing an
- Page 177 and 178: Mertens, D.M. (2008, July). Transfo
- Page 179 and 180: ICARE Schools: A Research Study of
Table 40. Percentage <strong>of</strong> KDES Students Receiving Support Services by Race/Ethnicity, AY 2007-<strong>2008</strong><br />
Traditionally underserved racial/ethnic groups<br />
All traditionally<br />
underserved African<br />
Asian/ Other &<br />
All Caucasian racial/ethnic American or<br />
Pacific multi-ethnic/<br />
students students group students black Hispanic Islander racial groups<br />
Support services<br />
(N=127) (N=54) (N=73) (N=48) (N=16) (N=5) (N=4)<br />
No support services 10% 15% 7% 6% 0% 0% 50%<br />
1 or more support services 90% 85% 93% 94% 100% 100% 50%<br />
Oral interpreting 0% 0% 0% 0% 0% 0% 0%<br />
Sign interpreting 0% 0% 0% 0% 0% 0% 0%<br />
Cued language transliteration 0% 0% 0% 0% 0% 0% 0%<br />
Sign language transliteration 0% 0% 0% 0% 0% 0% 0%<br />
Tutoring 2% 0% 4% 4% 6% 0% 0%<br />
Vision services/orientation<br />
and mobility 2% 0% 4% 2% 0% 20% 25%<br />
Special deaf/blind<br />
interpreting services 0% 0% 0% 0% 0% 0% 0%<br />
Speech training/therapy 80% 82% 78% 79% 88% 80% 25%<br />
Oral/aural therapy 4% 6% 3% 0% 6% 20% 0%<br />
Notetaking 0% 0% 0% 0% 0% 0% 0%<br />
Communication Access<br />
Realtime Translation (CART) 0% 0% 0% 0% 0% 0% 0%<br />
Audiological services 32% 41% 25% 27% 13% 60% 0%<br />
Counseling 25% 15% 33% 31% 44% 20% 25%<br />
Itinerant teacher services 0% 0% 0% 0% 0% 0% 0%<br />
Classroom aide services 3% 2% 4% 6% 0% 0% 0%<br />
C-Print 0% 0% 0% 0% 0% 0% 0%<br />
TypeWell 0% 0% 0% 0% 0% 0% 0%<br />
OT/PT 21% 13% 26% 31% 6% 20% 50%<br />
Adaptive PE 0% 0% 0% 0% 0% 0% 0%<br />
Other support services 45% 28% 58% 60% 56% 60% 25%<br />
Extended school year (ESY) 44% 28% 56% 60% 56% 40% 25%<br />
ASL instruction 5% 0% 8% 8% 0% 40% 0%<br />
Additional services 1


