Section 2 - FTSE
Section 2 - FTSE
Section 2 - FTSE

Create successful ePaper yourself
Turn your PDF publications into a flip-book with our unique Google optimized e-Paper software.
With operating income that now tops $1.3bn, up<br />
27% on 2005, National Bank of Kuwait (NBK) is<br />
easily the country’s largest bank and boasts the<br />
highest rating of any bank in the Middle East. While<br />
NBK has an extensive international network, its<br />
strategic imperative over the immediate term is<br />
driven more by regional considerations. The<br />
regional investment climate remains buoyant, in<br />
spite of no small degree of volatility in the region’s<br />
equity markets and local consumer credit growth<br />
remains strong. These factors have so far played to<br />
the bank’s strengths. How long can the good times<br />
last though and just how far can NBK go? Francesca<br />
Carnevale reports from Kuwait City.<br />
UNLOCKING<br />
NBK’s<br />
LONG TERM<br />
GROWTH<br />
THE CRISP AUTUMN night in Kuwait City is<br />
illuminated by a stream of limousines heading to the<br />
Arab Fund for Economic and Social Development<br />
building, an architectural marvel that showcases the<br />
growing artistic and financial sophistication of the Gulf<br />
Cooperation Council (GCC) countries in general and of<br />
Kuwait in particular. The limo occupants are invitees to a<br />
special seminar, arranged by NBK on “Leveraging the GCC<br />
Boom: A View Towards Asia,” and where the headline<br />
speaker is no less than the ex-premier and now Minister<br />
Mentor of Singapore, Lee Kwan Yew.<br />
The seminar is significant for a number of reasons. The<br />
GCC is awash with investment money looking for a profitable<br />
home. Two, more of that money is heading eastwards rather<br />
than its traditional route to the western economies of North<br />
America and Europe — as much (it has to be said) for political<br />
<strong>FTSE</strong> GLOBAL MARKETS • JANUARY/FEBRUARY 2007<br />
Ibrahim Dabdoub, NBK’s chief executive officer.<br />
Photograph kindly supplied by NBK, December 2006.<br />
COVER STORY: NBK<br />
49
COVER STORY: NBK<br />
50<br />
reasons as financial ones. Three, the Singapore growth model<br />
carries resonance in a region (or even a country) that sits bang<br />
at the crossroads between the ‘new’economies of the east and<br />
the ‘old’ economies of the west. Individually all the GCC<br />
countries have aspirations to be an entrepôt for trade and<br />
financial flows between the old world and the new.<br />
Kuwait, like all other GCC countries is swept up in a<br />
cultural, religious, and political maelstrom, with all the<br />
contradictions that might suggest. Each country is rapidly<br />
having to absorb a heady cocktail of new technology,<br />
changing consumer tastes, new financing and investment<br />
products (both Islamic and non-Islamic), a population<br />
profile that is skewed towards the under 25s, a rising and<br />
increasingly affluent middle class, and a rapidly expanding<br />
range of opportunities in which to invest the region’s<br />
abundant petro-dollars. Naturally, that is also counterbalanced<br />
by a (some say transient) resurgence of traditional<br />
politico-religious values and practices that sometimes sit<br />
askance with the modern push and tug of change. NBK’s<br />
story lies firmly in its<br />
apparent ability to look<br />
above the parapet and make<br />
sense of the interweaving<br />
streams in the broader<br />
region, leveraging them to<br />
best effect.<br />
At the seminar, Lee Kwan<br />
Yew, outlined what he saw as<br />
some of the pre-requisites<br />
that underpin sustainable<br />
economic growth. In the<br />
dinner table talk that<br />
followed the seminar, it was<br />
clear that attendees had clearly understood the significance<br />
of the event. What was discussed was not so much Lee<br />
Kwan Yew’s paean to western economic and political<br />
values, but the fact that NBK was presenting such a<br />
seminar and such a topic. The bank was clearly laying out<br />
its credentials as a regional thought leader and positioning<br />
itself as a natural partner for key GCC businessmen<br />
looking to leverage Asia’s growth story. Most importantly,<br />
NBK was clearly displaying its growing confidence.<br />
While established international players might take that sort<br />
of thing for granted, for a bank in the Middle East, it is a thing<br />
of moment. Two days later, in a private interview, Ibrahim<br />
Dabdoub, NBK’s chief executive officer hints at the extent of<br />
the wholesale change in thinking and approach this has<br />
required. “I once asked Jamie Dimon, JP Morgan’s chief<br />
executive, whether size inevitably results in bureaucracy. He<br />
said he is sure it does. It is something we took to heart and<br />
therefore have given our people leeway to make decisions. We<br />
have people in place now whose job is just to manage change.<br />
Frankly, it has not been easy because we have always lived in<br />
a command/control environment. But we are doing it —<br />
even if sometimes we do it more slowly than we might like.”<br />
Dabdoub has run NBK since 1983, having joined the<br />
back in 1961. He worked up the corporate ladder, heading<br />
“We do a lot of market<br />
segmentation analysis and product<br />
testing, which has helped us develop a<br />
range of products that have a high<br />
take up,” says Dabdoub.”<br />
the bank’s credit operations in 1969 and then being<br />
promoted to deputy CEO soon after. Although naturally<br />
reticent, Dabdoub has the easy frankness of a man with a<br />
successful track record. It’s a natural consequence of a<br />
period of uninterrupted growth, concedes Isam Al-Sager,<br />
NBK’s deputy chief executive officer. Even so, “The good<br />
thing about NBK is that it is a well-diversified operation,<br />
with most departments in the bank contributing directly to<br />
the bottom line,”he says.<br />
Dabdoub’s latter-day management style is collegiate, in line<br />
with his avowed aim to decentralise decision-making.<br />
Dabdoub has a three line strategy to ensure that it works to<br />
best advantage. The first is “to encourage communication and<br />
the free flow of ideas between management. Our focus is on<br />
our people. We have a first class team and we actively foster a<br />
collegiate approach, that encourages the discussion of<br />
strategy. The flow of information at NBK is first class. Given<br />
our size, it is probably much easier than it is, at a larger<br />
operation. On Sundays, Tuesdays and Thursdays we have<br />
informal management<br />
session, which are<br />
supplemented by other<br />
meetings and the senior<br />
management team is in<br />
constant touch throughout<br />
the day.”<br />
The second is careful<br />
market analysis, “We do a<br />
lot of market segmentation<br />
analysis and product<br />
testing, which has helped<br />
us develop a range of<br />
products that have a high<br />
take up,” says Dabdoub. Third, is a heavy investment<br />
programme in staff training and the bank’s technology<br />
infrastructure. In October, LogicaCMG secured a $27m<br />
contract to modernise NBK’s core banking applications.<br />
LogicaCMG will manage the replacement of NBK’s current<br />
bank branch teller and core banking systems and build a<br />
service orientated architecture (SOA) platform. Phase one<br />
of the contract has already been completed with<br />
LogicaCMG undertaking a business study which led to the<br />
production of a transformation roadmap for the bank. “It<br />
involved the full technical and business architecture plans<br />
that will help us to position ourselves to leverage our<br />
expansion strategy. It is a major transformation program<br />
that will provide us with a platform to operate on a larger<br />
scale, in a more open and competitive environment, and<br />
keep in step with the evolution of banking practices and<br />
converging technologies,”explains Dabdoub.<br />
“Once the implementation of the plans is complete,<br />
NBK will benefit from streamlined processes, new branch<br />
functionality, enhancements to other bank functions<br />
including banking operations, retail and corporate banking<br />
and the ability to offer more flexible products, pricing and<br />
services which can be delivered more quickly to market,”<br />
explains Adel Abdul Wahab Al-Majed, group general<br />
JANUARY/FEBRUARY 2007 • <strong>FTSE</strong> GLOBAL MARKETS
Adel Abdul Wahab Al-Majed, group general<br />
manager, consumer banking. Photograph<br />
kindly supplied by NBK, December 2006.<br />
manager, consumer banking. “The bank will also achieve<br />
greater efficiency and scalability through the introduction<br />
of straight through processing and improved management<br />
control and compliance,” adds Salah Al Fulaij, group<br />
general manager, investment services and treasury group.<br />
“It adds up to a significant change in the corporate culture,<br />
so that we can handle the booming markets in which we<br />
work and make the best of it. Things are changing so<br />
rapidly here and the old command and control systems<br />
cannot accommodate the requirements of today’s markets.<br />
I am pleased with what we are achieving,”adds Dabdoub.<br />
Dabdoub has much to be pleased about. NBK’s bottom<br />
line is on a rising trajectory. Recently issued performance<br />
figures for the first nine months of 2006 show the bank<br />
enjoyed a record net profit of $657m, up 22% on<br />
comparable year on year figures. NBK’s total assets stood<br />
at $24.2bn at the end of September, with shareholders’<br />
equity of $2.8bn. Return on assets and return on equity also<br />
rose to 3.85% and 38.7% respectively, demonstrating the<br />
bank’s robust earnings power. NBK’s earnings power has<br />
earned it the highest credit ratings in the Middle East from<br />
Moody’s, Standard & Poor’s and Fitch Ratings. The rating<br />
agencies have praised the depth and stability of NBK’s<br />
management and the clarity of the bank’s growth strategy.<br />
This year NBK expects the net profit to hit $900m.<br />
But there are also other considerations. The ratio of nonperforming<br />
loans to total loans at NBK dropped to 1.4% in<br />
2005, which rank among the lowest worldwide, with<br />
provisions against bad loans at 224% of their value,<br />
confirming the bank’s prudent credit culture. Most recently,<br />
NBK embarked on a capital increase programme, at the<br />
end of October that will see the bank’s capital increase by<br />
10%. The subscription was sold down to shareholders<br />
through NBK’s branches across Kuwait, with a reportedly<br />
high demand for shares.<br />
NBK now has the largest domestic network in Kuwait with<br />
60 branches and one of the largest international networks<br />
among Arab banks. It is clear that NBK is breaking out of a<br />
confined national and GCC banking model. Although the<br />
bank’s international growth strategy was conceived in the<br />
<strong>FTSE</strong> GLOBAL MARKETS • JANUARY/FEBRUARY 2007<br />
Shaikha Khaled Al-Bahar, group general<br />
manager, corporate banking. Photograph<br />
kindly supplied by NBK, December 2006.<br />
Randa Azzar, chief economist, NBK.<br />
Photograph kindly supplied by NBK,<br />
December 2006.<br />
mid-1990s and it has most notably gathered pace over the<br />
last three to four five years. During this time the bank has<br />
made a concerted play in the GCC countries and begun to<br />
work out into the wider Middle East and North Africa<br />
(MENA) region and beyond that into Turkey and selected<br />
markets in East, such as Vietnam and China (specifically<br />
Shanghai).“Our expansion is not worldwide,”concedes Isam<br />
Al-Sager, deputy chief executive officer,“because we have a<br />
high level of customer focus, we are in some markets not on<br />
a competitive basis, to win market share, but on a supporting<br />
basis, to help our customers. Our major expansion is in the<br />
Middle East,”he adds.<br />
In 2004, NBK bought 20% of International Bank of Qatar<br />
(formerly Grindlays Qatar Bank) together with full<br />
management control. The same year, NBK opened a new<br />
branch in Amman, Jordan, and a tenth branch in Lebanon.<br />
The following year, NBK extended its branch network in<br />
Kuwait and opened a representative office in China, also<br />
kicking off operations in Iraq through the newly acquired<br />
Credit Bank of Iraq. In May 2006, the bank opened its first<br />
branch in Saudi Arabia.“NBK’S focus was and is to expand<br />
in markets with strong prospects and where we can leverage<br />
our fundamental strengths,”explains Dabdoub. NBK is now<br />
looking to buy an Egyptian bank next year and also has its<br />
eyes on pushing into the UAE and Turkey as well.<br />
The turn of the century revitalised NBK. Since then, NBK<br />
has shown it has effectively learned to leverage the dynamics<br />
between the old and the new. Shaikha Khaled Al-Bahar,<br />
group general manager, corporate banking explains the<br />
synergy between the bank’s strategy and its customer focus:<br />
“Our business is defined by our clients. Our relationship<br />
with some of the strongest international players in the<br />
region, which make up the bulk of our corporate banking<br />
clients, nowadays want us to provide more creative and<br />
complex services. Part of that is helping them list overseas,<br />
in New York or buy real estate in the growing markets of<br />
India and China. I’ve told our clients again and again,<br />
because we have a comprehensive product range, we have<br />
the strength to underwrite their transactions. It puts us on a<br />
different plane to other banks in the region.”<br />
51
COVER STORY: NBK<br />
52<br />
That depth in service<br />
provision, according to Al-<br />
Majed, group general manager<br />
of consumer banking, has been<br />
developed through NBK’s<br />
ability and determination to<br />
respond positively to a number<br />
of tipping points. For one,<br />
competition spurred the bank’s<br />
push for growth, explains Al-<br />
Majed. “Up to five years ago,<br />
we were working in a protected<br />
market. Over those same five<br />
years competition has begun to<br />
accelerate under the<br />
assumption that the market is<br />
opening up. So, NBK began to<br />
improve its service offering,”he<br />
explains. Expectations of the<br />
bank are high, he concedes,<br />
particularly in Kuwait itself,<br />
which provides a benchmark<br />
for its regional service offering. “A high proportion of<br />
Kuwaitis travel and deal with international banks and<br />
therefore have ample opportunity to benchmark service<br />
quality. I would say we are innovative and have a head<br />
start on most offerings in our regional market. However,<br />
many of these services can be duplicated within a three to<br />
six month timeframe. So we are kept on our toes.<br />
Sustaining good service and innovative service on a<br />
consistent basis is difficult, but I would reasonably claim<br />
it for the bank.”<br />
Al Fulaij explains that another tipping point was the creation<br />
and separation of NBK Capital from the main bank. Like many<br />
regional institutions NBK had investment banking, asset<br />
management and treasury services firmly embedded in its<br />
operations. It now operates as a commercial bank and has a<br />
defined investment bank, NBK Capital. While NBK Capital<br />
sources and manages specialist private equity funds of its own,<br />
the bulk of the group’s asset management business is still<br />
retained within the main bank. NBK Capital is managed as a<br />
separate business by CEO George Nasra, who has adopted a<br />
parallel growth strategy to<br />
that of the main bank. It’s<br />
latest fund, which has<br />
garnered commitments<br />
worth $200m to date will<br />
focus on private equity<br />
investments in the GCC,<br />
Levant, Egypt and Turkey. In<br />
September 2006, the<br />
investment bank opened a<br />
new office in Turkey,<br />
appointing Ahmet<br />
Tartaroglu as country<br />
manager. “The move is very<br />
much in line with the<br />
Rebased (30 Nov 2003=100)<br />
200<br />
180<br />
160<br />
140<br />
120<br />
100<br />
80<br />
60<br />
Nov-03<br />
George Nasra, ceo NBK Capital. It’s latest fund, which<br />
has garnered commitments worth $200m to date will<br />
focus on private equity investments in the GCC, Levant,<br />
Egypt and Turkey. Photograph kindly supplied by NBK,<br />
December 2006.<br />
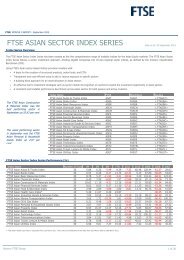
NBK Successfully Builds on a Booming Local Market:<br />
3 Year Performance of the National Bank of Kuwait<br />
(Kuwait Dinar)<br />
May-04<br />
Nov-04<br />
May-05<br />
group’s ongoing expansion across<br />
the Gulf and the Middle East,”<br />
explains Nasra. The new Turkish<br />
operation builds on a year in<br />
which NBK has opened<br />
operations in Kuwait, Beirut in<br />
May, and in the Dubai<br />
International Financial Centre<br />
in February.<br />
A third tipping point,<br />
according to Al Fulaij, was the<br />
reorientation of the bank’s<br />
regional focus. “We had held<br />
back,”admits Falajj,“intentionally<br />
avoiding the regional markets<br />
until we felt they offered<br />
appropriate depth.” NBK’s<br />
caution was perhaps well<br />
grounded: memories of market<br />
shakedowns in 1982 and 1997<br />
were still strong. Dabdoub<br />
maintains the bank is pleased<br />
with the strong results coming from the new markets in<br />
Qatar and Jordan “alongside our established network in<br />
major financial centres. Our international network has long<br />
played an important role in supporting NBK’s businesses<br />
from treasury, trade finance and corporate banking to<br />
private banking and wealth management.”<br />
Dabdoub agrees that the bank has enjoyed prevailing<br />
winds that support its growth strategy to date. “The<br />
operating environment has, on the whole, remained very<br />
positive for banking services, as all indicators pointed to<br />
a continuation of momentum built in 2005, boosting<br />
NBK’s business at all levels. Kuwait and the region<br />
continued to enjoy solid economic growth, high business<br />
confidence, and strong consumer spending and<br />
investment, fuelling demand for credit. NBK’s interest<br />
margins benefited from the rise in interest rates, and its<br />
sound management of liabilities.”<br />
“We leveraged our solid franchise and fundamental<br />
strengths to capitalise on the favourable business<br />
environment by expanding our client base in all of our<br />
Nov-05<br />
May-06<br />
Nov-06<br />
Source: <strong>FTSE</strong> Group. Data as at December 2006<br />
markets,” agrees NBK’s<br />
chief economist, Randa<br />
Azzar. As a result, we<br />
were able to generate<br />
balanced growth across<br />
business lines and<br />
regions,”she adds.<br />
Dabdoub believes the<br />
success of the bank over<br />
the medium term will<br />
depend on whether NBK<br />
continues to leverage the<br />
opportunities on its own<br />
doorstep and among its<br />
nearest neighbourhood.<br />
JANUARY/FEBRUARY 2007 • <strong>FTSE</strong> GLOBAL MARKETS
<strong>FTSE</strong> GLOBAL MARKETS • JANUARY/FEBRUARY 2007<br />
Having dashed the hopes of baldheaded men, Sharer continues to differentiate Amgen from big pharma<br />
companies.“We are a science-based company, not a marketing-based company. Marketing is very<br />
important, but fundamentally we are a science-based company. It is a little bit involved to make the<br />
difference between biotech and big pharma, but for those of<br />
us who live it, It is quite apparent.”Photograph<br />
kindly supplied by Istockphotos.com,<br />
December 2006.<br />
AMGEN’S<br />
MOLECULAR STRATEGY<br />
Approaching middle age, biotechnology giant Amgen faces a raft of potential problems ranging<br />
from patent infringement, and changes in the way that Medicare buys drugs, to complacency. Save<br />
your sympathy. The firm’s revenues will rise probably 50% in only the next four years, and are<br />
expected to rise to $21bn. Moreover, profits will follow suit. The corporate strategy: “remain<br />
hungry, nimble and focused on serving patients,” looks likely to outmaneouvre all-comers. Art<br />
Detman reports from California.<br />
IT IS AFTER nine o’clock on a glorious fall morning —<br />
warm and cloudless — at the headquarters of Amgen Inc.<br />
in Thousand Oaks, a distant suburb northwest of Los<br />
Angeles. A steady stream of cars pours into the company<br />
parking lot. Employees, contractors, vendors and visitors —<br />
they continue to arrive even though all of the thousands of<br />
spaces in the vast lot are taken. Not to worry. A young man<br />
directs traffic to aisles where his colleagues hand out claim<br />
tickets. The vehicles will remain parked in the aisles until their<br />
drivers return. At the world’s largest biotechnology company,<br />
nestled in the coastal hills of Southern California, valet<br />
parking has prevented a systemic collapse.<br />
Already at his desk in one of 43 buildings in the complex<br />
is Kevin W Sharer, an aeronautical engineer and former US<br />
Navy officer who became chief executive officer (CEO) in<br />
January of 2001. Since then the company has added well<br />
over $10bn in revenues, to an expected $14.1bn or so for<br />
2006 — an average annual compounded growth rate of<br />
more than 25%. Net profits have kept pace, rising from<br />
$1.1bn in 2000 to a projected $4.5bn last year. Some analysts<br />
forecast revenues of $21bn and earnings of $7bn by 2010.“It<br />
is kind of interesting for me to be the CEO of the largest<br />
company of its kind in the world in a technology that did<br />
not exist when I graduated from college,”says Sharer, who<br />
graduated from the US Naval Academy in 1970.<br />
Amgen will be only 27 years old in April, having been<br />
founded in 1980 as Applied Molecular Genetics by<br />
professors from the University of California at Los Angeles.<br />
In company lore, the founders “just drove out here where<br />
the houses were cheap and land was cheap and said,‘Okay,<br />
this is it,’ The story may be apocryphal,” says Sharer,<br />
“although I am pretty sure it is true.”<br />
One thing for certain is that the remote Thousand Oaks<br />
location is entirely a historical accident. Amgen’s 194 acres<br />
there are virtually built out, and for some years the company<br />
has been expanding elsewhere and now has operations in<br />
CORPORATE PROFILE: AMGEN<br />
53
CORPORATE PROFILE: AMGEN<br />
54<br />
nine US states and 30 countries. Like the big pharmaceutical<br />
companies, such as Pfizer, Merck and so forth, Amgen is in<br />
the business of creating medicines to cure or ameliorate<br />
human illness. But Sharer is quick to point out the<br />
differences in product, strategy and culture. “A<br />
pharmaceutical company’s technology is basically<br />
carbohydrate pills,” he says. “These pills are just chemical<br />
compounds made through normal chemical processes, and<br />
they can be swallowed and digested and have their effect.<br />
Our products are completely structurally different. They are<br />
large molecules and mostly they are proteins and antibodies.<br />
Take, for example, our earliest product, for the treatment of<br />
anemia, Epogen. This molecule comprises 165 amino acids,<br />
which are natural substances, that are in a chain in a specific<br />
sequence. On this chain hang some big sugar molecules.”<br />
Because the body’s digestive system would break down<br />
this elaborate construction, Epogen and most other biotech<br />
medicines must be injected. What’s more, Sharer says,“the<br />
molecule is so exquisitely matched to the biology of the<br />
body that a change in one amino acid will almost always<br />
render the molecule not workable and perhaps even<br />
dangerous.” In contrast, substitution in the world of<br />
traditional drugs is common. “You can get around the<br />
patent by changing one of the compounds in the small<br />
molecule,”Sharer says. “That’s why there are seven or eight<br />
statins on the market now. Everybody’s got a statin.”<br />
As Sharer notes with some satisfaction, in the world of<br />
large-molecule biotech drugs, there is much less flexibility in<br />
the ingredients and their arrangement. In terms of patent<br />
protection,“This makes biotech a more defensible business.”<br />
The intangible differences appear every bit as important.<br />
What Sharers — and apparently all of Amgen’s 16,500<br />
employees — want to avoid is becoming a “big pharma”,<br />
which by their definition is a large, slow-moving, traditionbound<br />
drug company focused more on marketing than<br />
innovation.“The fact that we are 26 years old and based in<br />
Southern California instead of being a 100-year-old-plus<br />
company based in New Jersey means there are vast cultural<br />
differences,”says Sharer. “I hope that we are more nimble,<br />
that we can recognise an opportunity quicker and make a<br />
decision faster. We certainly are not perfect by any stretch of<br />
the imagination, but I have been told by people who came<br />
from those companies that there is just more energy, more<br />
enthusiasm, more speed, and more ambition here.”<br />
Another difference, Sharer says, is Amgen’s product<br />
focus.“We have a much different research and development<br />
strategy. Our strategy is to develop innovative medicine for<br />
grievous illnesses. That means we’re not going to have a<br />
product to treat male pattern baldness; there’s a need there,<br />
and I am sure somebody can make a lot of money from that.<br />
However, we are going to focus on serious illnesses. I am<br />
not saying that the pharmaceutical companies are all<br />
chasing non-serious illnesses; they are not. They are<br />
certainly in the cardiovascular space, the cancer space,<br />
trying to do that too. But we are there exclusively.”<br />
Having dashed the hopes of baldheaded men, Sharer<br />
continues to differentiate Amgen from big pharma<br />
companies. “We are a science-based company, not a<br />
marketing-based company. Marketing is very important, but<br />
fundamentally we are a science-based company. It is a little<br />
bit involved to make the difference between biotech and big<br />
pharma, but for those of us who live it, It is quite apparent.”<br />
Amgen has only ten products that are both governmentapproved<br />
and sold commercially, and five of these account for<br />
90% or more of its sales. Amgen’s first product was Epogen,<br />
created in 1983 when an Amgen scientist cloned the gene for<br />
human erythropoietin — EPO, for short — and produced<br />
recombinant EPO, later patented and named Epogen. This<br />
became the first of Amgen’s family of billion-dollar drugs.<br />
Later a similar protein, Aranesp, was introduced. Both<br />
are used to support people undergoing chemotherapy for<br />
cancer or dialysis because of chronic kidney disease. Often<br />
in these instances the patients aren’t just a little tired, they<br />
are virtually bedridden with exhaustion. “These drugs<br />
restore the red blood cells,” says Sharer. “They make a<br />
dramatic difference in the lives of dialysis patients. And<br />
they make it possible for people with cancer to actually live<br />
with the disease; they can get chemotherapy and still have<br />
a quality of life.”<br />
Together, Epogen and Aranesp sales grew about 18% in<br />
2006, to more than $6.7bn. Neulasta and Neupogen are<br />
both proteins that reduce the risk of chemotherapy-related<br />
infections in cancer patients. Annual sales are about<br />
$3.5bn. Amgen’s fifth principal product is Enbrel, a protein<br />
used to treat rheumatoid arthritis and psoriasis. It<br />
generates about $2.6bn annually.“Enbrel has not done as<br />
well this year as we hoped,”Sharer admits. “This is due to<br />
the fact that one of its markets, moderate to severe<br />
psoriasis, has not grown much at all.”<br />
Sharer finds this puzzling — after all, the overall<br />
population is growing — and suspects that many psoriasis<br />
sufferers simply don’t know about the drug. A direct-toconsumer<br />
advertising campaign had to be pulled because<br />
of objections from the Food and Drug Administration. The<br />
company is now negotiating with the FDA regarding a<br />
new series of advertisements. “It is possible that many<br />
psoriasis patients need to be communicated to so they will<br />
go to a doctor’s office,”says Sharer.“The kind of psoriasis<br />
we’re talking about is not just a little something on your<br />
elbow. It is nearly full-body coverage. Essentially, you<br />
cannot go outside. You don’t have a life. But about threefourths<br />
of the psoriasis patients who take Enbrel find it<br />
just makes it disappear.”<br />
Two new products are Sensipar, a small molecule developed<br />
in conjunction with NPS Pharmaceuticals that is used to treat<br />
a thyroid condition caused by chronic kidney disease, and<br />
Vectibix, an antibody designed to shrink or eliminate<br />
colorectal cancer tumors. While Sensipar’s potential is<br />
relatively modest — Eric Schmidt of Cowen and Company<br />
believes it will take more than four years before sales reach<br />
$1bn — Vectibix holds the promise of being a blockbuster (as<br />
drugs with multibillion annual sales are known in the<br />
industry). Schmidt believes Vectibix will capture 60-70% of the<br />
anti-EGFR market in colorectal cancer in three or four years<br />
JANUARY/FEBRUARY 2007 • <strong>FTSE</strong> GLOBAL MARKETS
Kevin W Sharer, chief executive officer of Amgen. Amgen will be only 27 years old in April, having been founded in 1980 as Applied Molecular Genetics by<br />
professors from the University of California at Los Angeles. In company lore, the founders “just drove out here where the houses were cheap and land was cheap and<br />
said,‘Okay, this is it,’ The story may be apocryphal,”says Sharer,“although I am pretty sure it is true.”Photograph kindly supplied by Amgen December 2006.<br />
and over time gain acceptance in all of the same markets as<br />
the current dominant therapy, Erbitux, a product of ImClone<br />
Systems and Bristol-Myers Squibb.Vectibix received approval<br />
in September and since then, says Sharer,“There was a very<br />
substantial uptake. We are doing well against Erbitux, and we<br />
hope and expect that this will continue.”<br />
Amgen’s next potential blockbuster is Denosumab, which<br />
Sharer says has the potential to score big in two different<br />
markets: postmenopausal osteoporosis and bone cancer<br />
caused by the metastasising of other cancers. “When a<br />
cancer metastasises,” he explains, “it often migrates to the<br />
bone. That causes enormous pain and weakens the bone. It<br />
is a horrendous side effect, if you will. Our early and midstage<br />
tests give us a great deal of hope that Denosumab will<br />
greatly reduce the tendency of cancer to migrate to the bone,<br />
which would be a huge benefit to patients. We will know the<br />
results of the current clinical trials in 2008. We are investing<br />
on the order of $500m a year on this product alone.”<br />
It is likely, then, that Amgen could have invested $1bn in<br />
Denosumab by the time its final clinical trials are complete —<br />
but before it is approved for general use. Just how risky this is<br />
for drug companies was dramatically illustrated in December,<br />
when the world’s largest pharmaceutical company, Pfizer,<br />
abruptly halted a clinical trial of an experimental drug intended<br />
to treat heart disease after it was discovered that it apparently<br />
caused an increase in deaths and heart problems. What had<br />
promised to become the world’s largest-selling drug suddenly<br />
became a write-off of almost $1bn. On the next trading day,<br />
investors frantically sold Pfizer shares, driving down the price<br />
11%. In a day, more than $21bn in market value vanished.<br />
Meanwhile, Amgen has about a dozen drugs in phase one<br />
<strong>FTSE</strong> GLOBAL MARKETS • JANUARY/FEBRUARY 2007<br />
of development. Most are intended to treat cancer or cancerrelated<br />
illness. Two are to treat pain, one is for asthma,<br />
another for obesity, and a third for Type 2 diabetes. In<br />
addition, five new drugs — including Denosumab — are in<br />
phase two or phase three of development, and several<br />
approved drugs are being tested for new applications. For<br />
example, Aranesp, the anemia therapy, is being investigated<br />
to treat cardiovascular disease in patients with chronic<br />
kidney disease and Type 2 diabetes.<br />
Last year Amgen’s research and development budget<br />
was about $3bn, an attention-getting 22% of revenues and<br />
perhaps the highest ratio among all large biotech and<br />
pharma companies. Sharer expects R&D spending will<br />
increase this year by double digits.“Our basic policy is to<br />
spend as much as we can possibly afford,” he says. “Our<br />
products will eventually go off patent; we have to be ready<br />
for that. So now is the time to invest and do our best.”<br />
Of course, even drugs with patent protection can be<br />
challenged. Right now Amgen is battling Roche, the huge<br />
Swiss-based company, over its CERA drug, which Sharer<br />
says violates the patent on Epogen, which treats anemia in<br />
patients who are on dialysis. Amgen has 100% of this<br />
market, which it serves by selling to companies that<br />
operate chains of dialysis treatment centers. They in turn<br />
are allowed by Medicare a 6% markup on the average<br />
selling price of Epogen.<br />
Amgen won the right to sue Roche, and the trial is<br />
expected to begin late this year.“Our plan is to beat Roche,”<br />
Sharer says.“We are very confident in our patent position.”<br />
Among analysts who follow Amgen — they all are MDs or<br />
PhDs in molecular biology — opinions range widely. Michael<br />
55
CORPORATE PROFILE: AMGEN<br />
56<br />
Aberman, a physician and<br />
analyst at Credit Suisse, gives<br />
Roche an 80% chance of<br />
winning. Another physician,<br />
Mark Schoenebaum of Bear,<br />
Stearns, takes the opposite<br />
view. “I am increasingly<br />
comfortable with the idea that<br />
Roche’s CERA probably<br />
infringes Amgen’s patents,”<br />
he says.<br />
Cowen and Company’s Eric<br />
Schmidt, a Ph.D., isn’t sure<br />
either way. “This is a tough<br />
call,” he says. “We’ve gotten<br />
[sic] advice from a lot of legal experts, and everything<br />
indicates this is going to be a close one. But I am not sure that<br />
the impact of CERA coming to the US market, should Roche<br />
get around Amgen’s patents, is of that much consequence. It<br />
would still have to compete in the marketplace, and that is<br />
going to be a significant hurdle for CERA. It doesn’t have any<br />
advantages over the Amgen products, which are entrenched<br />
and have been on the market anywhere from five to fifteen<br />
years. That’s where CERA is going to fall short, and that is<br />
why I think it really does not matter much to Amgen whether<br />
or not CERA is marketed here.”<br />
Indeed, Amgen has already locked up some major dialysis<br />
chains with exclusive long-term contracts. And Roche can’t<br />
tempt the others with a lower price because the government’s<br />
reimbursement is based on a percentage of the cost. Dialysis<br />
centers have no incentive to buy a lower-cost product. If<br />
Schmidt’s analysis is correct, then the CERA problem is<br />
mostly an illusion, despite the very real concerns of many on<br />
Wall Street. Another illusionary problem may have to do with<br />
Medicare and the new Congress, both houses of which will be<br />
controlled by Democrats. Right now Medicare — unlike the<br />
Department of Veterans Affairs — cannot negotiate with drug<br />
companies over prices. Many Democrats have favored<br />
changing this, something virtually all drug company CEOs (at<br />
biotechs and pharmas alike) oppose.<br />
Sharer, who is chairman of the board of the Pharmaceutical<br />
Research and Manufacturers of America, a trade association,<br />
is among them. “The government today gets very good<br />
prices,”he says. “The government has essentially outsourced<br />
the negotiation of prices to many, many private plans, and<br />
these private plans have real bargaining leverage. When you<br />
read the newspapers, you get the idea that under the current<br />
system the government just pays list price and is, if you will,<br />
a dumb buyer. That’s not remotely true. The government<br />
pays negotiated prices that are quite aggressive.”<br />
Since the election in November, talk about empowering<br />
Medicare to negotiate prices has quieted down. Bear,<br />
Stearns’Schoenebaum believes there “will be a drumbeat of<br />
negative headlines, but the probability of any real policy<br />
changes ahead of the 2008 presidential election is small.<br />
Besides, Bush would veto it.”<br />
And even if a presidential veto were overridden — after<br />
Because the body’s digestive system<br />
would break down this elaborate<br />
construction, Epogen and most other<br />
biotech medicines must be injected.<br />
What is more, Sharer says, “the<br />
molecule is so exquisitely matched to<br />
the biology of the body that a change<br />
in one amino acid will almost always<br />
render the molecule not workable and<br />
perhaps even dangerous.”<br />
all, all House seats and a<br />
third of Senate seats will<br />
face voters in 2008 — the<br />
outcome might be<br />
immaterial for Amgen.<br />
“The company’s products<br />
are almost all unique,” says<br />
Schmidt of Cowen. “And if<br />
any legislation were passed,<br />
we’d have to see if it even<br />
pertains to biologics. All the<br />
discussions I have seen<br />
focus on small-molecule<br />
pills, and that would have<br />
not impact on Amgen.”<br />
Ironically, then, the two concerns that seem to affect<br />
Amgen’s stock price right now (Roche’s CERA and changes<br />
in Medicare) could well be non-issues. While some analysts<br />
are neutral on the stock, others — among them Schmidt,<br />
Albert Rauch of AG Edwards and Elise Wang of Citigroup<br />
among them — have issued buy ratings. Amgen stock has<br />
moved up nicely since dipping below 31 in 2002, and now<br />
trades at around 70, which gives the company a market<br />
capitalisation of $85bn. (Like electronic high-techs, biotechs<br />
were caught up in the bubble of 2000; Amgen’s stock topped<br />
80, fueled by a price/earnings ratio that approached 70.)<br />
Sharer is confident in the capacity of biotech to eventually<br />
conquer human illnesses. “There is no disease that is<br />
theoretically beyond the reach of biotechnology,” he says.<br />
But he cautions against excessive optimism.”We know less<br />
about biology than the man in the street thinks. People read<br />
about sequencing the human genome and think that we<br />
must know all about human biology. The human genome<br />
is a wonderful advance, but it is just a parts list for the body.<br />
The secret is how those parts interact and how they go<br />
wrong. The goal of biotechnology is to understand the<br />
fundamental biology and then develop products that can<br />
interact with the biology in safe and effective ways.”<br />
In conquering diseases such as cancer, ALS, diabetes and<br />
Alzheimer’s disease, patience is a required virtue. “Fifty<br />
years is only two and one-half product development<br />
cycles,”Sharer notes.“That’s frustrating, but that is the way<br />
science is. I think we will get there, but it is going to take<br />
a while.”<br />
Sharer expects that, on this long road to overcoming<br />
human disease, Amgen will remain at the forefront<br />
provided it remains true to its basic principles. “We’re<br />
proud of our success and enthusiastic about the future,”he<br />
says.“But any successful enterprise contains, at the time of<br />
its success, the seeds of its potential future troubles.<br />
Nobody is immune from that, and there’s no silver bullet<br />
answer to avoid it. But the first thing to do is recognise that<br />
the possibility exists, and be alert to that potential.”As he<br />
told shareholders in last year’s annual report: “We are<br />
absolutely determined to avoid the pitfalls of growth and<br />
success and remain hungry, nimble and focused on serving<br />
patients. Our best is yet to come.”<br />
JANUARY/FEBRUARY 2007 • <strong>FTSE</strong> GLOBAL MARKETS
TRANSITION MANAGEMENT<br />
Roundtable<br />
THE FUTURE OF GERMAN<br />
TRANSITION MANAGEMENT<br />
ATTENDING<br />
Left to right back row:<br />
ED PENNINGS, managing director, head of sales and client relations, State Street Transition Management<br />
HOLGER KNAUER, manager, Universal Investment<br />
PETER DOMBECK, director, manager selection, Feri Institutional Advisors<br />
GARY SPREADBURY, vice president, transition management, Morgan Stanley<br />
Left to right front row:<br />
CHRISTOPH KESY, portfolio management, E.ON Energie AG<br />
ALEXANDRA THIELE, senior manager, master kags, ACTIVEST [Now PIONEER INVESTMENTS]<br />
KARIN RUSSELL-WIEDERKEHR, director, transition management, germany, Credit Suisse<br />
FRANCESCA CARNEVALE, editor, <strong>FTSE</strong> Global Markets<br />
<strong>FTSE</strong> GLOBAL MARKETS • JANUARY/FEBRUARY 2007<br />
Supported by:<br />
57
TRANSITION MANAGEMENT ROUNDTABLE<br />
58<br />
NEW BUSINESS, NEW CHALLENGES<br />
FRANCESCA CARNEVALE, EDITOR, <strong>FTSE</strong> GLOBAL<br />
MARKETS: Ed, can you start please and describe the key<br />
opportunities and drivers for growth in transition<br />
management in Germany?<br />
ED PENNINGS, MANAGING DIRECTOR, HEAD OF SALES<br />
AND CLIENT RELATIONS, STATE STREET TRANSITION<br />
MANAGEMENT: There have been a number of<br />
developments: companies are funding their pension funds,<br />
funding their liabilities and this trend continues. The<br />
Kapitalanlagegesellschaften (KAG) investment law has<br />
changed which has been an incredible business driver and<br />
made things a lot simpler. It has been good for transition<br />
management and good for investors as well. Also, there is a<br />
greater awareness of transition management and that is<br />
helping all of us.<br />
HOLGER KNAUER, DEPUTY HEAD OF INSTITUTIONAL<br />
SALES AND RELATIONSHIP MANAGEMENT, UNIVERSAL<br />
INVESTMENT: I would add that beneficial owners are likely<br />
to change their asset manager faster these days. They no<br />
longer have the patience to accept poor investment results<br />
and therefore they change managers more frequently. In<br />
turn, that is providing more transition opportunities.<br />
GARY SPREADBURY, VICE PRESIDENT, TRANSITION<br />
MANAGEMENT, MORGAN STANLEY: A lot of that growth<br />
has come from increased awareness and a greater<br />
understanding of how the transition manager can help.<br />
There are definitely instances where a transition manager<br />
does not necessarily add value and it is being able to work<br />
out whether he can pick value out of the process or not.<br />
What you highlighted Holger, is right. There is absolutely<br />
no reason today why a fund should have any exposure to<br />
underperforming managers any longer than is necessary.<br />
You should use the transition process to make that change<br />
quickly and in a structured and efficient fashion.<br />
PETER DOMBECK, DIRECTOR, MANAGER SELECTION,<br />
FERI INSTITUTIONAL ADVISORS: Nowadays you find<br />
yourself dealing with more complex and complicated asset<br />
classes and more core-satellite fund structures. People are<br />
aware that you need more transition specialists, particularly<br />
if you are moving from one or two managers to three, four,<br />
or five different managers with very specialised investment<br />
approaches. Beneficial owners recognise that you need<br />
someone who can handle complex transitions, is<br />
experienced and who will make the shortfall of your<br />
performance as small as possible.<br />
KARIN RUSSELL-WIEDERKEHR, DIRECTOR,<br />
TRANSITION MANAGEMENT, GERMANY, CREDIT<br />
SUISSE: I agree. Transitions have become more complex<br />
and it is vital to have someone specialised for the job. In<br />
the German market some of the peculiarities are regulatory<br />
in nature; others are operationally driven due to the<br />
existence of KAGs. It starts with the regulatory counterpart<br />
for a transition being the KAG and not the beneficial<br />
owner, which is very different from other markets.<br />
Additionally, each KAG has its own operational models<br />
and different levels of technology. Other complexities<br />
unique to Germany include the handling of withholding<br />
tax claims, capital gains and book value transfers, which<br />
can be challenging but are extremely important.<br />
CHRISTOPH KESY, PORTFOLIO MANAGEMENT, E.ON<br />
ENERGIE AG: The typical German relationship banking<br />
model broke apart—at least this is the case for many<br />
companies. Investors are more knowledgeable these days<br />
and performance more transparent, particularly as the<br />
market has moved from balanced portfolios to core-satellite<br />
structures and from a multiple KAG structure to the<br />
centralised Master-KAG. Now we have liability driven or<br />
alternative investment approaches, and a much higher rate<br />
of portfolio turnover than in the past. Investors nowadays<br />
also accept transactions costs as an important performance<br />
factor of the overall portfolio. Following on from that, they<br />
want assistance from a decent transition manager.<br />
KARIN: Transition services and its benefits are well<br />
understood in Germany. Wherever we go consultants<br />
have already primed clients about when or when not to<br />
use a transition manager. Not every restructure requires<br />
the support of a specialist transition manager. Do you<br />
agree Peter?<br />
PETER: I agree with Karin that it is not always the case<br />
that a transition is suitable—particularly when there are<br />
only small changes in a portfolio that can be easily moved<br />
out. However, in complex asset restructurings, you get a<br />
much better result if you have a suitable transition<br />
manager. Consultants are an important influence in this<br />
regard, definitely.<br />
HOLGER: There is another important consideration. While<br />
investors and KAGs are happy to work together with a<br />
range of transition managers, if we have a big restructuring,<br />
involving various asset managers, we are now happy to<br />
have just one transition manager who is in control of the<br />
entire project. It means somebody is taking care that the<br />
whole process is carefully controlled, and we are reassured<br />
that the wishes of the investor are met. In these instances,<br />
we are also assured that execution is in the precise format<br />
we need and therefore we can take care that any new<br />
managers are able to start their mandate by a due date.<br />
Moreover, we know precisely when we can begin to<br />
measure the performance of a new manager and there are<br />
no excuses about late starting periods and costs associated<br />
with the starting period.<br />
PETER: Yes, investors are very keen on this. It has also been<br />
an educative process for consultants, if you like, as well.<br />
There shouldn’t be any black holes or any reasons at the<br />
outset for missing performance targets.<br />
CHOOSING TRANSITION MANAGERS<br />
FRANCESCA: Looking around this table, none of the<br />
transition managers is German. How do you know that<br />
these transition managers can deliver for you? Do they<br />
know your market well enough? Does it matter that none<br />
are German?<br />
JANUARY/FEBRUARY 2007 • <strong>FTSE</strong> GLOBAL MARKETS
CHRISTOPH: We feel comfortable to have someone in a<br />
transition management team that has a good knowledge of<br />
the German markets, of the master KAGs and local custody<br />
structure. We think it is very important. Project<br />
management competences are also key.<br />
GARY: The KAG question is interesting. With the<br />
consolidation of the market, and the master-KAGs coming<br />
into play, people are reducing the number of KAGs they are<br />
using. Subsequently, we have found that the transition<br />
manager has had to deliver an awful lot of value<br />
coordinating KAGs. It is all very well the legal entity being<br />
one KAG here and one KAG over there, but if they are not<br />
talking to each other, then you will encounter serious<br />
issues. Unquestionably, the possibility and potential for<br />
the transition manager to project manage that whole<br />
space, is significant and you cannot really undervalue the<br />
importance of it. Even though a fund may know that there<br />
will not be a complete restructuring, or a series of fund<br />
manager changes, changing the KAG structure can be a<br />
risky process if it is not handled properly.<br />
ED: The trend towards outsourcing, rather than advisory<br />
agreements, which used to be more prevalent in the past,<br />
also gives a lot more freedom and responsibility to the<br />
transition manager. It is a role that is, in fact,<br />
complimentary to what the KAG does. It acts as a sort of<br />
fiduciary role for the underlying investor and the work that<br />
the transition manager does fits very well into that space. I<br />
want to build on Christoph’s point. I would not want to say<br />
that relationship banking is falling apart, but it certainly is<br />
crumbling and you see a trend towards a model of best of<br />
breed service providers. For transition managers to be<br />
successful in this environment they have to have<br />
experience of the German model.<br />
GARY: It’s interesting that you talk about experience within<br />
transition managers. There is a core skill set within perhaps<br />
three or four houses, that have a unique understanding of<br />
the German investment industry and that are not<br />
necessarily working for domestic providers. The global<br />
provision of transition management in Germany does give<br />
you a very good illustration of why and who has the inhouse<br />
expertise.<br />
FRANCESCA: Alexandra, does that give you comfort?<br />
ALEXANDRA THIELE, SENIOR MANAGER, MASTER<br />
KAGs, ACTIVEST [NOW PIONEER INVESTMENTS]:<br />
Obviously, it is important that a transition manager has the<br />
right experience, but I also think it is important that the<br />
KAGs are good at their work. It is vital for the KAG to ask<br />
the right questions, thereby avoiding problems in the later<br />
stages of a transition. Although we all speak English, it is<br />
easier sometimes if you can explain your concerns in your<br />
own language. So, a knowledge of the German language,<br />
direct experience of the market; someone who knows what<br />
kind of issues or problems they will face in transition in the<br />
German market and who you can speak to directly is vital.<br />
KARIN: Language skills are particularly important when<br />
you are transitioning for local authorities and domestic<br />
Vorsorgeeinrichtungen. I speak from experience. When I<br />
<strong>FTSE</strong> GLOBAL MARKETS • JANUARY/FEBRUARY 2007<br />
ED PENNINGS, managing director, head of sales and client relations,<br />
State Street Transition Management<br />
have to deal in unfamiliar territory, I prefer to speak in my<br />
mother tongue and that has proven to be important for<br />
German clients too. It does not matter where a transition<br />
manager is located, where the person sits, or whether the<br />
person works for an American international financial<br />
conglomerate or a German institution. It is really down to<br />
the individual’s skills.<br />
CHRISTOPH: As an investor, we look for operational<br />
excellence when we undertake our transition manager<br />
selection. It is not important where the effective trading is<br />
done, if it is done in London or Frankfurt or elsewhere. It is<br />
absolutely crucial to the process to have one relationship<br />
person as a link, who knows everyone’s roles in detail.<br />
More often than not, it turns out to be the key factor in a<br />
transition. Fluent German is absolutely crucial to exploit<br />
the German market opportunities for a transition manager.<br />
BUYSIDE/SELLSIDE/AGENCY/PRINCIPAL?<br />
FRANCESCA: It cannot be that I turn up, speak German,<br />
communicate well and know the German market and that<br />
means I win business. There has to be more. Is a transition<br />
manager’s project management ability, trading ability, or<br />
capability in fixed income, for instance, a factor as well?<br />
CHRISTOPH: It is a mixture of many factors. As I mentioned<br />
before we look for operational excellence. Each large<br />
transition has its moments where afterwards you say, we<br />
were really lucky to complete the transition successfully, due<br />
to technical restrictions, the breakdown of SWIFT<br />
59
TRANSITION MANAGEMENT ROUNDTABLE<br />
60<br />
communication, or other operational events. To avoid bad<br />
surprises you need a clear definition of responsibilities – a<br />
transition manager must be willing to take full responsibility<br />
for the process and define up front its responsibilities vis à vie<br />
the KAG, the custodian, and of course, the customer. I also<br />
think that transition management is moving from being pure<br />
execution business, doing a series of trades over a minimised<br />
period of days, to more of an advisory business. This involves<br />
the terms of risk management, exposure risk management,<br />
managing the trade-off between potential opportunity cost<br />
and market impact; coming up with hedging proposals,<br />
showing the cost of a hedge, so<br />
that you can weigh the trade off<br />
between risk taking and the cost<br />
of the hedge.Then of course, the<br />
basis of the service has to be<br />
excellent execution capabilities<br />
and access to sufficient liquidity<br />
sources in the markets. Last but<br />
not least, two final points:<br />
quality people and transparency,<br />
transparency, transparency.<br />
HOLGER: What is important<br />
for the KAG is proper<br />
execution. If you have a good<br />
broker who is failing one, two<br />
or three trades or they were not<br />
communicated in the approved<br />
format, you can do it manually.<br />
However, think, if you get 500<br />
or 1000 trades and they do not<br />
fit in your system, you will not<br />
be able to get the transition<br />
finished by the agreed date.You<br />
also have to think of the<br />
additional risk of failed trades<br />
and claims. This really could<br />
hurt you. Operational strengths are important. Operational<br />
strengths must also encompass the ability to create a<br />
process that brings together all parties in an effective way,<br />
even with the various custodians that are also involved.<br />
FRANCESCA: Have you ever had a failed transition, or where<br />
your transition manager hasn’t delivered to your satisfaction?<br />
HOLGER: In the past, we have had to expand a transition<br />
period as some of the trades were not executed or not all<br />
the trades had been settled in time. The investor was<br />
exposed to the risk that their portfolios were not really<br />
managed for that period by the target manager.<br />
FRANCESCA: At the tail end of a transition, you can be left<br />
with some very difficult assets that you somehow you have<br />
to trade away. Do you give undertakings to your clients that<br />
you will complete a transition, whatever it takes?<br />
GARY: It can be an unnecessary conversation to have<br />
right at the start of a process. To say that by day three, for<br />
example, we will be able to complete on this whole<br />
portfolio without consideration being given during the<br />
actual implementation is rather cavalier in approach.<br />
Certainly you have to be able to identify the parts of the<br />
portfolio that are going to take longer to trade and<br />
whether you are going to treat them differently, and<br />
whether you need to look at alternative strategies for<br />
exiting them. You also have to find out whether the<br />
customer is prepared to pay a premium or a discount to<br />
complete that portion of the portfolio. A fund has to be<br />
aware of the options available and the transition<br />
manager must offer all the options that make sense when<br />
dealing with a broad mix of assets: be it fixed income,<br />
equity, or even how you interact with the FX part of the<br />
process and provide options<br />
perhaps to ensure that the<br />
client’s assets are moving<br />
across in a systematic and<br />
structured fashion and avoid<br />
unnecessary cost.<br />
KARIN: Most transition<br />
managers have tools that<br />
enable them to identify<br />
potential problems, not only on<br />
the trading side, but<br />
operationally as well. Before<br />
the implementation of a<br />
transition we conduct detailed<br />
pre-transition analysis. We have<br />
sophisticated systems that help<br />
us identify liquidity constraints<br />
or any difficult securities to<br />
trade, which could affect the<br />
cost of the restructure. This<br />
technology enables us to define<br />
the right trading strategy for<br />
each of the asset classes. They<br />
also help us in working out any<br />
HOLGER KNAUER, manager, Universal Investment<br />
potential hedging requirements<br />
to reduce costs. Our tools and<br />
our analysis form part of our transition management<br />
agreement. Furthermore, during the implementation of a<br />
transition we now have smart trading systems that help us<br />
control and minimise costs and risks. We work with<br />
algorithms, such as Portfolio Hedging Device (PHD), that<br />
help us trade in a smart way.<br />
ED: You should be aware of illiquid tails in the planning<br />
stage. It can take a little bit longer, but at least, you can<br />
make appropriate arrangements. If you do start making<br />
undertakings, it is a very slippery slope. As soon as you<br />
start giving undertakings, guaranteeing any sort of<br />
benchmark or timeframe the conflicts of interest grow<br />
significantly. As long as there is communication and you<br />
plan it properly, everyone should be able to trade these<br />
stocks and everyone should be able to access multiple<br />
liquidity sources. It could be through crossing, agency<br />
trading, arranged principal bids, or alternative trading<br />
strategies, using hedging strategies to get you exposure to<br />
the desired asset class, which allows you to take a little bit<br />
longer to get out of the underlying position.<br />
JANUARY/FEBRUARY 2007 • <strong>FTSE</strong> GLOBAL MARKETS
EXPLICIT VERSUS IMPLICIT COSTS<br />
FRANCESCA: When you choose a transition manager, how<br />
much is cost on your mind?<br />
GARY: Just so that we are clear, explicit costs?<br />
FRANCESCA: Explicit costs<br />
PETER: Cost is a factor, for sure, because explicit costs are<br />
easier to compare. Definitely it should not be the sole factor<br />
in deciding on a transition manager. If you then talk to the<br />
client and explain the significance of the implicit costs, such<br />
as the costs of worst execution or perhaps the cost of failed<br />
project management, then everybody will agree that explicit<br />
costs are significant, but not the only decisive factor.<br />
KARIN: We encourage potential users of transition<br />
management services to look at the people and the<br />
experience that they have in project management and the<br />
types of assets they are looking to restructure. Furthermore,<br />
it is important to look at global market access, technology<br />
and language skills. Most of all, when you are selecting a<br />
transition manager, it is important to go and visit the<br />
operation, meet the people that are dealing with your<br />
project and experience the systems they will employ.<br />
PETER: It is not important whether you are number one in<br />
the league tables, number five can probably be as good as<br />
number one in most cases if you don’t have a really large<br />
major transition. I agree with Karin, that soft skills are as<br />
important as hard skills. Moreover, transparency as we first<br />
GARY SPREADBURY, vice president, transition management,<br />
Morgan Stanley<br />
<strong>FTSE</strong> GLOBAL MARKETS • JANUARY/FEBRUARY 2007<br />
noted. That is absolutely key for us.<br />
GARY: You have to be able to understand what that explicit<br />
cost represents. Providers who offer their services for zero or<br />
even enhancing exits are not necessarily being transparent<br />
and clear on how they are being paid for the process. Our<br />
approach is to be transparent from the start: i.e. this is how<br />
much it is going to cost you; this is what you are paying for.<br />
The fund can then begin to start looking at other parts of the<br />
equation: the implicit costs, then very clear comparisons<br />
between one provider and another can start to be formulated.<br />
CHRISTOPH: When you do a portfolio trade, say €200m of a<br />
European large cap equity portfolio, brokers offer you zero<br />
commission for a bloc trade, with a guaranteed market close.<br />
That is zero explicit cost, but is it a bad benchmark? Yes, a<br />
terribly bad benchmark, because first the broker can influence<br />
the benchmark and secondly, the impact of what is going to<br />
happen in the market in a closed auction is going to outweigh<br />
your explicit costs by a multiple. Therefore implementation<br />
shortfall is a good benchmark, because it is the only one which<br />
the manager, or the broker, cannot influence. Even so,<br />
implementation shortfall is not sufficient, because there is a<br />
component that is not covered: risk. Implementation shortfall<br />
is only a target. At the end of a transition we all hope for a<br />
good total result. But is it the consequence of high risk taking<br />
and luck? Or, is it the desired result of a proper shaping of the<br />
implementation shortfall distribution up front? That is what<br />
you want to see in the process.<br />
ED: Christoph mentioned luck. This is where it comes down<br />
to looking at the experience and track record of the manager.<br />
What did the transition manager say to the client in terms of<br />
estimating implementation shortfall cost and what did he<br />
actually deliver? Clients are more sophisticated and now ask<br />
for correlation numbers between pre-trade estimates and<br />
actual post-trade results.This is actually a very useful measure<br />
to include when analysing transition managers. Furthermore,<br />
any sort of guarantee of a benchmark implies a principal<br />
trading strategy. I am not saying that there is anything wrong<br />
with principal trading, because I don’t think there is. However,<br />
when it combines with a transition management mandate, it<br />
does present serious problems. Christoph is right to ask, how<br />
do we measure the right benchmark? It is all about how you<br />
use the benchmark. Do you trade before it is set, do you trade<br />
into it, or do you actually use it as a clean, un-conflicted<br />
reference point to measure yourself, after the benchmark is<br />
set? Nevertheless, there are explicit costs, implicit costs and<br />
hidden costs, and clients should ask more questions about<br />
them. Any benchmark guarantee implies a hidden cost,<br />
because after all nobody does this as a charity.<br />
HOLGER: You are right. However, in practice in the past, if<br />
investors were choosing a transition manager for the first<br />
time, the focus was entirely on costs. Once the transition<br />
manager provides a full breakdown of the costs in a transition,<br />
then the investor begins to understand (sometimes for the<br />
first time) the various factors that combined to make up the<br />
costs and the benefit and/or the losses of the transition. It is a<br />
process of education and to be fair, transition managers have<br />
also spent time educating clients. Of course we also take up<br />
61
TRANSITION MANAGEMENT ROUNDTABLE<br />
62<br />
PETER DOMBECK, director, manager selection, Feri Institutional Advisors<br />
these points and warn clients of potential pitfalls. However,<br />
not all transition managers are equally transparent.We are not<br />
always in a position to say this will be cheapest and/or best<br />
transition manager, because everyone’s offers look quite<br />
different and it is difficult to compare them.<br />
GARY: Any providers’ pre-transition analytics should be<br />
powerful enough to highlight risks before you go into the<br />
trade. Just as an example, we worked on a portfolio which had<br />
an extremely high weighting in commodity related stocks. The<br />
commodity sector weighting was way beyond the benchmark.<br />
This was in April/May time as commodity stocks were reaching<br />
a peak. Volatility kicked in and the client made an active<br />
decision, based on our analytics, not to transition during that<br />
month. We could actually have just implemented and gone<br />
back to them and said to them, look we said it would be bad,<br />
it was bad. However, our process allowed them to make an<br />
informed decision and deal with the risks accordingly.<br />
HOLGER: We have a good benchmark for the trading<br />
period: implementation shortfall and volatility<br />
implementation shortfall. What worries an institutional<br />
investor though is what happens from the moment where<br />
you dismantle your portfolio and the first trade takes place.<br />
That is the most interesting question and it is up to the<br />
transition manager to come up with a reliable solution.<br />
TO PRE-HEDGE OR NOT?<br />
KARIN: I know we are going to talk about the T-Charter<br />
later, but I think this is the right time to touch on the subject.<br />
The T-Charter is a set of 10 principles that guide and protect<br />
clients when transitioning and provides protection again<br />
poor and questionable practices. One of the principles is to<br />
disclose pre-hedging transactions and the performance<br />
impact of pre-hedging activity in the implementation report.<br />
When you have a transition manager, you choose him<br />
because you trust him implicitly. You will have confidence<br />
that he will not pre-hedge for his own gain. In fact, nothing<br />
should happen before trading starts that could adversely<br />
influence the ultimate result of the transition.<br />
FRANCESCA: Alexandra, does it matter if your transition<br />
manager pre-hedges as long as the portfolio that arrives with<br />
your destination manager has the value that you wanted?<br />
ALEXANDRA: It depends on who has selected the transition<br />
manager. We always talk to our clients and ensure that if they<br />
have chosen a transition manager that they provide us with the<br />
model on which they made their decision and we then analyse<br />
where any costs might be. I am not very happy if a transition<br />
manager is involved in pre-hedging, because they have acted<br />
for their own book. I don’t think it is the right way to go about<br />
things. If the client says,“I’m okay with this,”it is his decision<br />
and we have to accept it. However, if we had chosen a<br />
transition manager, and he pre-hedged, it would be the first<br />
and last transition that he did for us. It comes back to costs.<br />
There has actually been very little constructive discussion and<br />
debate about the true costs of transitions in recent years. I think<br />
that is because at one time the market really did not<br />
understand the difference between implicit and explicit costs.<br />
That is no longer the case and the market is learning fast.<br />
PETER: In the first place we would probably ask why a<br />
manager would like to opt out of best execution. Moreover,<br />
we would like to hear a very, very, good explanation for<br />
that. Usually, we would say that I wouldn’t advise any<br />
client to opt out of best execution and to say that prehedging<br />
is OK. I can’t imagine a case where we would be<br />
comfortable with it.<br />
HOLGER: As a KAG, we have a contract with the transition<br />
manager. We undertake all means to ensure best execution.<br />
We have that explicitly stated in the contract, that we require<br />
best execution for the portfolio. If we see something that<br />
contradicts this clause that would be a breach of this contract<br />
ED: What is pre-hedging? It sounds pretty warm and<br />
fuzzy. However, really it is front-running. So let us just call<br />
it what it is. I do not see any reason for anyone ever to prehedge.<br />
Pre-hedging pretty much guarantees a nondisclosed<br />
profit for the transition manager and renders any<br />
benchmark irrelevant.<br />
GARY: The key thing to understand is that pre-hedging and<br />
front running are often referred to as one and the same thing;<br />
but in certain circumstances they are different. Morgan Stanley<br />
does not pre-hedge — FSA rules prohibit it. But, as an example,<br />
one could argue that if you were looking to build a portfolio of<br />
highly illiquid stocks that you are going to benchmark at the<br />
end of the month and start performance at precisely that point,<br />
one could rationally work with a house to provide capital to<br />
help you passively build that portfolio beforehand and then, at<br />
the benchmark point, you gain the immediacy of entry into the<br />
portfolio. The house has executed a wholly transparent basis<br />
with you beforehand and you can understand what the real<br />
cost is. Transparency is the key message here.<br />
CHRISTOPH: Don’t misunderstand me, I am not promoting<br />
front-running, but I see this topic less dogmatically. It is a<br />
question of transparency up front. If a transition manager<br />
JANUARY/FEBRUARY 2007 • <strong>FTSE</strong> GLOBAL MARKETS
comes up with the exclusive pre-hedging proposal to cover<br />
the illiquid parts of the portfolio, or the high-alpha part,<br />
because best execution as the KAG and the market<br />
understands it, asking three different brokers to trade out<br />
your portfolio, will produce serious market impact, then I<br />
would say, let’s discuss the point. It is not front-running<br />
anymore, if the customer agrees to it. So let’s discuss it and<br />
compare it to the ideas of the other candidates who are<br />
pitching for the mandate and let’s find out what is best for<br />
our portfolio. So, it is probably an exotic view …<br />
KARIN: It doesn’t really matter what the client and the<br />
transition manager decide as the right way of trading, as<br />
long as it reflects the interests of the client and it is a<br />
transparent solution. This ensures that there is not going to<br />
be an accusation of mis-selling, or the client<br />
misunderstanding that he contracted into, or opted out of<br />
best execution. If a client wants to opt out of and waive his<br />
right to best execution and this is defined in the trading<br />
strategy then I am in agreement with Christoph. However,<br />
at Credit Suisse we do not pre-hedge.<br />
CHRISTOPH: In most of the small cap portfolios which have<br />
become attractive in a satellite-core environment and also<br />
are still attractive for alpha generation, you will find stocks<br />
where market impact neutral trading, based on the average<br />
daily volume, takes you 20/40/60 trading days. And it must<br />
be allowed that for these very illiquid parts of your portfolio,<br />
maybe 2% or 3%, you have to think of more creative ways to<br />
trade it. Asking the company to do a share buyback<br />
programme for example, or it might be pre-hedging, but in<br />
accordance with the investor, or other creative solutions.<br />
MEASURING A SUCCESSFUL TRANSITION?<br />
ALEXANDRA: As a KAG it is always important that the<br />
operative things work really well and that we don’t have<br />
failed trades. If I understand the model of the transition<br />
manager and I see what has happened and I can<br />
understand the whole process, I am satisfied.<br />
PETER: It involves a timetable that is suitable for the<br />
transition and that the whole transition starts and ends at<br />
the time horizons within the schedule discussed and agreed<br />
on beforehand. That’s one important factor. Another, surely,<br />
is implementation shortfall. Although it can always happen<br />
that you are off by about one or two basis points. OK, that<br />
is natural, but it should be in the normal range and the third<br />
point is probably the project management capabilities of the<br />
manager. There is always something going wrong in a very<br />
large transition and if you have someone you can call up or<br />
you can have a daily conference call including the KAG and<br />
the custodians, it is fine.You must always have someone you<br />
can talk to if something is going wrong and you see that<br />
after an hour, or sometimes after a day, the problem is<br />
solved. That is perfect.<br />
ALEXANDRA: If we have a problem or we need to change<br />
to some process or something it is important that the<br />
consultant, or the transition manager can say either that it<br />
is not a serious problem, or that they can fix the problem.<br />
<strong>FTSE</strong> GLOBAL MARKETS • JANUARY/FEBRUARY 2007<br />
There are always problems in transitions. It is vital that you<br />
communicate often and directly about the problem and<br />
show how it will be solved. That makes everyone feel a lot<br />
better about the transition.<br />
HOLGER: I know the day when the new managers should<br />
start their business. That is the first time when I get hard<br />
feedback. Is everything settled, for example? Moreover, can<br />
he start managing the full portfolio on that day or not? If<br />
he can, then it is good, it worked, we are on schedule. Then<br />
we get information from the transition manager via the<br />
transition report. In addition we and the client have the<br />
opportunity to look at the details of the transition very<br />
closely and look into the explicit and implicit costs, and<br />
compare the execution with the original proposal. That’s<br />
when we have a full view of the transition and can decide<br />
whether it was really a perfect transition, or if there were<br />
some surprises he/we did not think of.<br />
CHRISTOPH: After every completed transition we don’t<br />
always know what we feel. If the post-trade analysis looks<br />
brilliant, obviously it was a good transition. But of course, in<br />
evaluating the quality of a transition, the most important<br />
quantitative fact is: what does the pre-trade analysis show?<br />
And is the realisation, the result, compared to the ex-ante<br />
analysis within a reasonable low amount of standard<br />
deviations? You can’t tell me that unfortunately there is a six<br />
standard deviation outcome and then that the ex-ante was<br />
not wrong. Then I would like to add some soft factors that<br />
give an investor a good feeling afterwards, that’s<br />
communication, information updates at every stage and of<br />
course a positive feedback from all three parties involved,<br />
the KAG, the custodian and the transition manager. If this<br />
matches then a lot speaks for a good transition, at least from<br />
an operational point of view. Another soft factor is, whether<br />
the transition manager created an extra value in the process.<br />
For example, a target portfolio manager’s wish list of an<br />
index tracking portfolio may show some very illiquid<br />
government bonds. Then it is the time for the transition<br />
manager to alternatively suggest more liquid government<br />
bonds with comparable risk return characteristics. We must<br />
realise the target portfolio manager is in a very convenient<br />
situation. He gets the portfolio of his preferred choice<br />
delivered by the transition manager and therefore he<br />
doesn’t have to care about transaction costs. This is<br />
obviously a conflict of interest as well and I see it as one of<br />
the tasks of the transition manager, to point this out.<br />
GARY: Christoph’s point is absolutely right. We have<br />
instances where we have had bond portfolios, modelled<br />
portfolios given to us, because the manager knows that we<br />
are going to go away and do all of the work, trying to find<br />
an issue that is 90% held and locked up. It may take two<br />
weeks to do it. The bond manager gets the bond, he is<br />
happy, but in reality he has delayed the portfolio coming<br />
across to him for a period while we are out there looking<br />
for the bond. Some managers do need to be policed a little<br />
bit. We have to make sure that manager knows that is not<br />
just a free rein to get a perfect portfolio and without all the<br />
attendant costs of achieving that portfolio.<br />
63
TRANSITION MANAGEMENT ROUNDTABLE<br />
64<br />
THE T-CHARTER AND ITS EFFECTS<br />
FRANCESCA: The T-Charter has been a strong talking<br />
point, particularly in the UK market, and all the transition<br />
managers around this table have been active participants in<br />
the discussions to determine a workable code of practice<br />
for transition managers. What are your expectations of it?<br />
ALEXANDRA: It is a great idea. It will bring clarity and more<br />
transparency as transition managers have to provide more<br />
detail about the way they plan and execute transitions.You<br />
are no longer looking at a black box when they speak to you<br />
about how they want to do it. I also look to it to make it<br />
easier for us to compare the different offers, as Holger said.<br />
I hope that the T-Charter will become better known and<br />
that the big transition managers will sign up to it.<br />
PETER: Self regulation is always very welcome. The T-Charter<br />
should not be the bible of transition management, but rather<br />
it should provide minimum standards. We feel any transition<br />
manager should explain why he didn’t sign up and give us<br />
the reasons what made him opt out. If these explanations<br />
aren’t clear we would definitely say that this is a definite key<br />
disadvantage in the competition for new business. If a<br />
transition manager doesn’t have very good reasons and<br />
doesn’t explain which specific points encouraged him to opt<br />
out I would say, if we can’t understand it, we would say that<br />
we would feel more comfortable with a transition manager<br />
who agrees with the T-Charter. However, as I pointed out<br />
before, it is probably a minimum standard. There are<br />
questions beyond the T-Charter that you have to ask, but I<br />
would say that it is the benchmark for the future.<br />
GARY: It is absolutely the right way to view it. If someone<br />
is not really prepared to sign up to a standard that is there<br />
to provide a level of integrity, to provide the client with a<br />
degree of comfort that their transition manager is<br />
operating with best practice, then you have to absolutely<br />
understand why they are not signing. There is no question<br />
about that. However, one risk of the T-Charter is that you<br />
get a polarisation of providers and then you go almost full<br />
circle. I am not necessarily convinced this will happen, but<br />
it is a risk. Understanding a transition management team<br />
and their strengths and what the business model is, is part<br />
of the asset owner’s obligation to the fund. They must visit<br />
the team and see how they ring fence their transition<br />
business. Therefore, on the one hand you can understand<br />
why some people will and some people won’t sign up to it.<br />
You have to use that knowledge in conjunction with other<br />
things.You cannot just rely on it alone. It becomes part of<br />
the investor’s tool box, if you like.<br />
CHRISTOPH: To me it is a sign of a maturing industry. It<br />
seems to get to a high volume, low margin business now<br />
and it is in line with the spirit of MIFID. Asking your active<br />
managers for composite performance numbers is a<br />
comparable issue. The managers need good reasons for<br />
not doing that. I also see this completely in line with selfregulation<br />
or external regulation in the field of brokerage<br />
performance measurement over the last few years and of<br />
course, we appreciate greater transparency very much.<br />
ED: It is a good initiative and it could not go fast enough in<br />
our opinion. As a firm we are very supportive of the highest<br />
possible minimum standards and that for any sort of best<br />
practice code to be meaningful and successful. You know<br />
you can’t please everyone and the success of the T-Charter<br />
depends where the debate is going hereon out. If you<br />
accommodate everyone’s business model you may as well<br />
not do it. If you do come up with a best practice, an<br />
industry best practice, it has to be of a level that you can go<br />
out with and that you are comfortable with so that it does<br />
not just give credibility to anyone that is only willing to sign<br />
up to a watered down version. We have seen people<br />
disappearing from the panel. They have their reasons and I<br />
am sure that you will be looking to find out what those<br />
reasons are. I can only guess. It is important that there are<br />
minimum standards that make us proud of being in a<br />
business with unquestionable integrity.<br />
KARIN: I believe the T-Charter helps clients differentiate<br />
between transition managers. Christoph is echoing the<br />
views of the market and his comments reflect the feedback<br />
we are getting that self-regulation is a good thing. The BVI,<br />
DVFA and the German CFA are associations in Germany<br />
that are supportive of the T-Charter. You are right though<br />
Ed, it has not been implemented as fast as we had hoped.<br />
Linklaters, the law firm hired to transform the T-Charter<br />
from a practitioners draft into a legal format, have now<br />
delivered a legally revised draft of the code. It will now be<br />
distributed to all transition managers, investors and<br />
interested parties. True, some institutions will not be part<br />
of the T-Charter. Surely though, the good thing is that<br />
everyone has the chance to be part of it.<br />
FRANCESCA: Given that there is a flight to quality these<br />
days do you need the T-Charter?<br />
GARY: We have talked to clients who have used other<br />
transition managers and it’s almost as if they don’t like<br />
talking about transition management because it has been<br />
such a painful experience for them. This is why the T-<br />
Charter will be a worthwhile standard. It will actually<br />
provide benchmarks for providers. If they cannot show a<br />
minimum competency then straightaway you can move on.<br />
Even people who sign up to it will very quickly go out of<br />
business if they cannot deliver that quality.<br />
KARIN: The T-Charter reinforces transparency and<br />
disclosure. Providers are all still different, even though they<br />
are becoming more alike. They still apply different business<br />
models. The T-Charter does not favour one institution over<br />
another. It doesn’t matter how you do your business, or what<br />
your model is, as long as you disclose what you do and how<br />
you do it. In that way, the T-Charter will rule out poor<br />
practices and it gives clients and consultants a clearer insight<br />
into how we do our business.<br />
ED: Signing off on the T-Charter is a good thing and we all<br />
here support it, as long as the standards are at a level that<br />
are sufficient. What I am not convinced of is that once you<br />
sign up, that everyone is similar. Every one is not similar. At<br />
the end of the day it comes down to experience and track<br />
record, the access to liquidity, project management skills<br />
JANUARY/FEBRUARY 2007 • <strong>FTSE</strong> GLOBAL MARKETS
CHRISTOPH KESY, portfolio management, E.ON Energie AG<br />
and transparency. Anyone who puts an extra desk in his or<br />
her trading room and says we are now a transition manager<br />
may not necessarily be equipped for the task. There are<br />
different business models and that will probably always be<br />
the case and it is healthy, as it helps define choice.<br />
FRANCESCA: Are you aware of the differences in offerings<br />
between transition managers, subtle or otherwise? Or, at<br />
the least, the differences between the three houses around<br />
this table?<br />
CHRISTOPH: We know which competitors are strong in<br />
fixed income or equity, and those which are more agency or<br />
principal focused. Then we start talking to other investors<br />
and get references and share experiences, which I think is<br />
a very important thing to do. Of course, we all know a bit<br />
about agency theory and we can make up our minds how<br />
the business model relates to these strengths and<br />
weaknesses. Personally, I am a fan of letting consultants,<br />
but also direct service providers like transition managers,<br />
do some homework and give them a case study. Let’s get<br />
away from the marketing slides. They are of no interest. I<br />
say, give transition managers some homework and let<br />
them show their experience in detail. This sort of thing will<br />
help sort out the differences between them.<br />
FRANCESCA: Are you typical, or are you particularly<br />
demanding?<br />
CHRISTOPH: In the field of transition management we are,<br />
I think, particularly demanding. That derives from our<br />
individual background of academic transition management<br />
research of course. I don’t think it represents the standard<br />
of the average investor.<br />
<strong>FTSE</strong> GLOBAL MARKETS • JANUARY/FEBRUARY 2007<br />
KARIN RUSSELL-WIEDERKEHR, director, transition management,<br />
Germany, Credit Suisse<br />
FRANCESCA: Holger, are you equally as demanding?<br />
HOLGER: We are, but our role is different. We interface with<br />
the customer and we have to inform if he is not familiar with<br />
transition management. Therefore, we have to be in a<br />
position to give the client advice on which he can choose the<br />
right transition manager for his project. We are required to<br />
provide an overview and detail and understanding about all<br />
our transition managers and their operational strengths.<br />
That ability to provide an accurate picture is as important to<br />
us as the transition itself.<br />
KARIN: Some 80% of a transition manager’s time is spent in<br />
the planning stage and finding out about each firm’s processes<br />
and nuances, such as the reconciliation process of a KAG and<br />
the custodian. Different firms have different processes. The<br />
majority of my time is spent speaking with all parties involved,<br />
defining processes and adding discipline to the reorganisation<br />
initiative. Implementation makes up the other 20% and can be<br />
the easier part of a transition.<br />
THE KAG STRUCTURE<br />
GARY: You have to have a lot more structure in the German<br />
market because you have to work within the investment<br />
guidelines particular to the German investment law, not just<br />
with this point here or this point there from start to finish<br />
when you take control of those assets you have to be fully<br />
compliant and the only way you can do that is by spending<br />
the time with the involved parties. So I think that in ensuring<br />
that the portfolio is ready for transition, you are definitely<br />
doing more work in the German market than you are doing<br />
65
TRANSITION MANAGEMENT ROUNDTABLE<br />
66<br />
in any other markets. From our point of view, we like the<br />
KAG structure, we think it makes a lot of sense, because we<br />
know that there is somebody that is looking after the client’s<br />
assets and we can have objective discussions with them. The<br />
KAG is there to act in the client’s best interests and help the<br />
client select the most appropriate person for the job.<br />
KARIN: I would like to add one point Gary. In my<br />
experience, the biggest concern of a German client is the<br />
possibility of having an asset management gap.<br />
GARY: I agree<br />
KARIN: The beautiful thing in Germany is that you have<br />
three parties that ensure there is no gap: the KAG, the<br />
consultant and the transition manager.<br />
PETER: I agree. At any time during the whole process there<br />
has to be someone responsible for the portfolio. That is<br />
absolutely important for any client and for us as<br />
consultants as well.<br />
ED: It’s key. Actually, any transition manager should take<br />
full responsibility for the portfolio and this goes back to the<br />
outsourcing agreements that we are signing now with<br />
KAGs for having that accountability. If something does go<br />
wrong and again I come back to this fiduciary care term, it<br />
is important for the transition manager to take that<br />
opportunity and take responsibility and provide that<br />
accountability.<br />
PETER: Increasingly project management capabilities are<br />
important and that the transition manager adheres to an<br />
agreed timescale.<br />
GARY: We have a very strong view of minimising the time<br />
we are in control of portfolios. If you have active portfolios<br />
within the transition environment and you don’t have<br />
robust operational procedures and you can’t settle all those<br />
positions on T+3 every day after the point at which the<br />
portfolio should have been handed over increases risk.That<br />
is because your active portfolio is potentially changing from<br />
an investment managers point of view. If you have an<br />
investment manager that is highly active, with a 7% or 8%<br />
tracking error and he is turning over a significant portion of<br />
the portfolio, by the time you give it to him a week later, he<br />
is going to have to revamp it all in any case. And in that inbetween<br />
period, does anybody account for the cost? The<br />
target manager is now over there and you are sitting here.<br />
So again, you have got another transition to do or the<br />
manager has and no one really accounts for that<br />
performance measurement.<br />
KARIN: If a significant proportion of a wish list is unsettled,<br />
a target manager may not be able to carry out his duties.<br />
Of course, most custodians have access to borrowing and<br />
lending facilities. This means that the matter could be<br />
resolved through a lending/borrowing programme to make<br />
the portfolio fully available on the handover date.<br />
HOLGER: Looking back, having done the first transitions<br />
in Germany with Universal Investments eight years ago, at<br />
that time there were only very few participants in the<br />
market. Then the main focus was on how to get a complex<br />
transition project done. It also involved foreign asset<br />
managers. This was a big change in the KAG world. Of<br />
course the approach has changed somewhat over those<br />
eight years. Now our main focus is achieving best<br />
performance for the investor. That change has involved a<br />
much closer relationship with transition managers. We sit<br />
through their presentations and every time we meet them,<br />
we asked more pertinent questions and we learnt more<br />
about their business. Our side of the business has also<br />
changed. Now many more people within the company are<br />
involved in the process, although we centralise<br />
communication through specific people in our relationship<br />
team. It all means we are better placed to act as advisor,<br />
intermediary and communicator with the client and the<br />
transition manager and it is done more effectively.<br />
ED: Those are good points. We find that KAGs are not so<br />
much gatekeepers, but facilitators. Actually, it is often more<br />
difficult in the UK where you have consultants that are<br />
much more powerful in deciding for the clients. KAGs are<br />
particularly concerned that all goes well from an<br />
operational perspective, in addition to the cost aspect, and<br />
rightly so. This is what the transition manager is<br />
responsible for: operational risk and portfolio risk. There<br />
has to be a balance between the two to make sure that you<br />
have the right party that you deal with. You can’t just look<br />
at things in isolation.<br />
AVOIDING EXECUTION DRIFT<br />
FRANCESCA: It would be useful to highlight your<br />
thoughts on what are the most important risks that you<br />
think should be mitigated in transitions and from the<br />
client side, what particular assurances you look for from<br />
your transition manager. So Ed, if you don’t mind starting<br />
this process …<br />
ED: Managing execution drift goes back to defining your<br />
execution strategy. For us, execution strategy is driven by a<br />
risk management strategy for which a framework is set in<br />
the planning stage. Obviously things can somewhat drift<br />
away from you. Things can take a bit longer and a<br />
transition manager needs to have ways to manage those<br />
risks. One could think of alternative trading strategies, such<br />
as hedging with derivatives and forwards, ETFs, EFPs etc,<br />
can be useful in mitigating these risks. Obviously you need<br />
to take account of investment guidelines and make sure<br />
that the client understands what you are trying to do and<br />
that goes back to communications. Having the tools to<br />
implement the trading strategy is absolutely key, however,<br />
the risk management framework sets that trading strategy.<br />
GARY: Taking advantage of crossing opportunities is what<br />
you have to do, you have to make sure that the cross<br />
benefits the transition portfolio and you are not just<br />
crossing purely because you can cross. There are many<br />
instances where you can cross too much of a portfolio<br />
presenting liquidity problems: that is, you cross the liquid<br />
part of the portfolio, you can’t neutralise that cash<br />
exposure, so you have to be able to do it in the context of<br />
trading less liquid positions quickly. Ed talked about<br />
developing an execution strategy, and if you do that and<br />
JANUARY/FEBRUARY 2007 • <strong>FTSE</strong> GLOBAL MARKETS
you go into a blind cross you can completely destroy that<br />
strategy — as soon as you come out of it, you have to react,<br />
you have to change the strategy. It is about being able to<br />
use those opportunities intelligently.<br />
ED: But of course, there are various definitions of crosses<br />
and crossing is one of the sources of liquidity that a<br />
transition manager has or doesn’t have. Some do not have<br />
that opportunity. At State Street, we operate a regulated<br />
crossing pool. We have done a lot of research on the<br />
benefits of crossing and basically what came out of it is that<br />
average execution costs are about 80% cheaper, so clearly<br />
there is a benefit in it. I totally agree with not postponing a<br />
transition just because of a crossing opportunity. If it is<br />
there, then you should take advantage of it. And there are<br />
very effective ways to manage the risks that come with it.<br />
Do you want to wait two weeks for a crossing opportunity?<br />
Probably not. Although in certain instances where you<br />
know you have one client that is selling out of a particularly<br />
difficult portfolio, a small cap or emerging market portfolio<br />
for example, and another client is buying into that<br />
structure, you may well want to wait two weeks.<br />
FRANCESCA: Peter, from the gist of this, it seems that there<br />
is pressure on transition managers to come up to the bar,<br />
greater communication, greater preparation, pre-transition<br />
management, adding value wherever possible, demanding<br />
KAGs, and demanding consultants …<br />
PETER: It’s been pointed out that we also have to do our<br />
homework. Five or six years ago transition management<br />
was not an important issue for us, but that is not the case<br />
now, and consultants are now giving advice on selecting<br />
transition managers. Not only that, we also help bring<br />
together all the different elements in a transition (the KAG,<br />
the client and the transition manager) and add value. While<br />
there are some people out there that are well enough<br />
educated about transition management; there are also<br />
people out there who are not educated well enough or<br />
sophisticated enough to deal with these three different<br />
organisations, taking part in a transition.<br />
FRANCESCA: As a key client, you have increasingly<br />
sophisticated transition managers, you have increasingly<br />
sophisticated consultants, and do you feel that your<br />
portfolios and portfolio transitions reflect this?<br />
CHRISTOPH: Developments in the market and responses<br />
or steps taken by large investors over the few last years,<br />
including greater use of advisors and transition managers,<br />
foreign asset managers, and adopting core-satellite<br />
strategies, etc., have had a remarkably positive effect on the<br />
overall return of the portfolio. Although active returns are<br />
not always what you wish in every single asset class. But the<br />
trend is going in the right direction. You are also getting<br />
away from using one single consultant for every piece of the<br />
business: for manager selection, ALM, transition manager<br />
selection, and the like. I would definitely recommend that<br />
you use a consultant. It is not that consultants know for sure<br />
who is the best transition manager, the topic is too young<br />
and the best academic brains are already working for the<br />
brokers or the buy-side. Consultants are excellent sparring<br />
<strong>FTSE</strong> GLOBAL MARKETS • JANUARY/FEBRUARY 2007<br />
ALEXANDRA THIELE, senior manager, master KAGs, ACTIVEST<br />
[Now PIONEER INVESTMENTS]<br />
partners — all these guys are smart — but they should not<br />
prevent you from thinking yourself.<br />
PETER: We highly recommend that the clients do not only<br />
rely on our recommendations but also ask their own<br />
questions and to be critical about the responses. We would<br />
really appreciate the opportunity to be a kind of sparring<br />
partner for a client, definitely.<br />
RESPONSIBILITY & TRANSPARENCY<br />
ALEXANDRA: Communication is paramount. It is also<br />
very, important that the transition manager has people<br />
who speak German, and know German laws. From our<br />
side, the KAG is someone who sits on top of the process is<br />
a key contact point for the client, the consultant, and the<br />
transition manager. So it is imperative that all these<br />
elements are brought together and work well together and<br />
that everyone sees and reacts to problems before they<br />
become too serious, and really, that is where experience<br />
counts in the market. And if something happens, that’s life.<br />
It is important that you can talk openly and honestly with<br />
all parties and understand what was good, what worked<br />
well in a transition and what did not work, so that next<br />
time we can avoid potential problems. Or, we can all agree,<br />
that is was a beautiful transition, nothing went wrong and<br />
we are all happy. That, of course, is the best outcome.<br />
GARY: I agree, you have got to take that standpoint and<br />
what is important is that the transition manager has to take<br />
responsibility. If something has gone wrong, they have got<br />
67
TRANSITION MANAGEMENT ROUNDTABLE<br />
68<br />
The German transition management roundtable, held in Frankfurt, November 2006.<br />
to be the first person to highlight that to the client, to the<br />
KAG straightaway. The next step from there is the<br />
resolution of that problem and ensures that ultimately the<br />
client is not impacted by that. If there was a problem, work<br />
out why it occurred and make sure that the fund, which is<br />
not responsible, is made good. There’s nothing contentious<br />
there and everybody should really agree with that.<br />
CHRISTOPH: Basically all of the big houses seem to have a<br />
strong product. It is an art to find the right one for a specific<br />
transition profile. You must ask incisive questions, get an<br />
impression of the capabilities and the sophistication of the<br />
risk analysis process, and also of the risk management and<br />
trading processes involved, and then decide on your<br />
transition manager. However, the time is now past, where<br />
the an investor can make a really, really bad choice.<br />
KARIN: We have spoken about increased sophistication,<br />
which is apparent at every level in the German market.<br />
Furthermore, there is internal political pressure on the<br />
funds, as well as performance pressure, which have<br />
resulted in greater emphasis on transparency. I am not<br />
referring to transparency on how performance is calculated<br />
and measured, but instead real time execution<br />
transparency. Clients look to play a part in the<br />
implementation process. I experienced this recently with a<br />
transition involving a regional fund in Germany, where the<br />
client logged on to our internet site to watch trading taking<br />
place real-time. They followed the event so intently that<br />
they contacted us on completion to comment that we had<br />
only traded 99.8% of their transition and were searching<br />
for an explanation for what had happened with the<br />
remaining 0.2%. The residual represented odd lots, which<br />
had been dealt with off-exchange. However, this is a clear<br />
example of the increased sophistication, political and<br />
performance pressure which is compelling clients towards<br />
greater transparency. I think it is something to watch.<br />
HOLGER: With the benefit of experience of many, many<br />
transitions over the years and having a kind of standardised<br />
communication platform, being the SWIFT format, we find<br />
we have a good working platform nowadays with many<br />
transition managers. So really I think we now have the<br />
chance to look forward at some recent developments,<br />
meaning derivatives, foreign exchange forwards, which are<br />
not always dealt with via these platforms and look at the<br />
significance of these changes, particularly their influence<br />
on the planning stages of a transition. I think things are<br />
constantly changes and these are some of the newer<br />
considerations for KAGs to focus on.<br />
ED: Communication. Alexandra made that point quite<br />
clearly and rightly so. A transition manager should have at<br />
least the technical capability, at least quite clearly, both on<br />
the trading side and operational side. If you don’t have that<br />
then you probably should not be in the business.<br />
Experience, track record also counts. Every transition is<br />
different, but at the end of the day, whether you have a<br />
fixed income, equity transition or a balanced transition, the<br />
process, the steps are similar. Moreover, if you have done<br />
enough of them, you know potentially what can go wrong.<br />
Again, you need to know before a problem actually<br />
happens that it can happen, so that you can do something<br />
to pre-empt it. Finally, but certainly not least, transparency<br />
and accountability are vital. If something does not go the<br />
way it should, you need to be able to stick your hand up<br />
and say,“Let us try to resolve this quickly.”<br />
FRANCESCA: Can I get a consultant’s perspective as a final<br />
sign off?<br />
PETER: As Christoph mentioned earlier, transition<br />
management will become a mature industry. With the T-<br />
Charter, which will be a minimum standard, but at least a<br />
benchmark, people can at least orient themselves on.<br />
Additionally, Germany is obviously not a mature market; it<br />
is a growth market for transition management, because<br />
more consultants and practitioners are developing a deeper<br />
awareness of the value created by a successful transition.<br />
This consciousness paired with understanding the key<br />
capabilities a transition manager must have can help them<br />
decide on a transition manager if they need one.<br />
JANUARY/FEBRUARY 2007 • <strong>FTSE</strong> GLOBAL MARKETS
A door was opened in 2004 by a US court<br />
decision holding that Visa and MasterCard’s<br />
exclusionary rules violated antitrust laws. The<br />
ruling appears to give American Express Co., a<br />
financial services powerhouse itself, and<br />
Discover, a unit of the Wall Street firm Morgan<br />
Stanley, a nice boost in the lucrative card<br />
business. What does it signify for the credit<br />
card market over the long term? Bill<br />
Stoneman goes in search of answers.<br />
The most interesting development to watch, observers say, will be the<br />
response to public ownership at MasterCard, and at Visa when it takes<br />
the plunge. Until now, both organisations have been managed for the<br />
convenience of the banks that owned them, industry consultants and<br />
stock analysts say, rather than as truly competitive entities.That is likely<br />
to change.“There’s something about a free enterprise, being on your<br />
own, that’s going to force these guys to think about satisfying<br />
public owners,”says Duncan MacDonald, former general<br />
counsel of Citigroup Inc.’s Europe and North<br />
America card businesses. Photograph by<br />
Scott Rothstein, kindly supplied by<br />
Dreamstime.com,<br />
December 2006.<br />
<strong>FTSE</strong> GLOBAL MARKETS • JANUARY/FEBRUARY 2007<br />
ABANK OF AMERICA American Express card would<br />
not have been possible or conceivable a little more than<br />
two years ago. Visa and MasterCard association rules<br />
flatly prohibited Bank of America (BofA) and the rest of their<br />
members from issuing cards bearing the logo of an interloper<br />
to the bank world, such as American Express. Today, however,<br />
BofA and Citigroup, the two largest banks in the United States,<br />
are both issuing American Express cards. In addition, HSBC<br />
Group, a like-sized bank based in the United Kingdom, has<br />
similarly teamed up with Discover Financial Services, another<br />
outsider to the Visa-MasterCard circle, to issue Discover credit<br />
and debit cards in the US.“It radically changed the industry<br />
and opened up huge opportunities for us,” says Roger<br />
Hochschild, Discover’s president and chief operating officer.<br />
Only time will tell if Hochschild is right. Discover and<br />
American Express both gained US market share in the first<br />
half of 2006, according to the Nilson Report, a card industry<br />
newsletter. Only however, by fairly small increments.<br />
Nonetheless, the move by American Express and Discover<br />
onto turf they had been excluded from does reflect big<br />
changes rolling across the card business landscape, which<br />
has long been led by two look-alike bank-owned clubs.<br />
Most importantly, perhaps, those same banks sold a<br />
controlling stake in one organisation, MasterCard<br />
Worldwide, which is based outside of New York, in May<br />
2006. In addition, the very same institutions are now<br />
preparing to repeat the process with San Francisco-based<br />
Visa. Neither bank issuance of American Express and<br />
Discover cards, nor public stock offerings by MasterCard<br />
and Visa necessarily change the overall balance in the<br />
payments world. It remains greatly profitable for credit<br />
issuers, funded primarily by companies selling everything<br />
from pet supplies to neckties. Both, however, introduce a<br />
host of new variables to businesses that provide payment<br />
services and other businesses that depend on those<br />
services. Moreover, they hold implications for investors and<br />
consumers as well.<br />
Among those variables is the possible impact on a wideranging<br />
dispute over the “interchange fee”. These are fees<br />
that merchants pay to banks in order to accept card<br />
payments. Others are the level of interest among mobile<br />
phone carriers in playing a role in payments, how well<br />
American Express and Discover capitalise on their new<br />
ability to make deals with banks and the extent to which<br />
working for public shareholders lights a fire under<br />
MasterCard and Visa managers.<br />
SECTOR PROFILE: MASTERCARD / VISA<br />
69
SECTOR PROFILE: MASTERCARD / VISA<br />
70<br />
MasterCard President & chief executive officer Robert Selander, center left, and New York Stock Exchange CEO John Thain, center right, applaud<br />
as MasterCard’s stock begins trading in its initial public offering, Thursday May 25th, 2006. In one of the biggest IPOs of the year in the US,<br />
MasterCard Inc. shares surged in their stock market debut even though the world’s No. 2 credit-card brand originally priced below expectations.<br />
Photograph by Richard Drew, supplied by EMPICs/Associated Press, December 2006.<br />
At about 50 years old, the card payment industry is the<br />
most reliably profitable segment of the banking business.<br />
Its great success is due largely to the willingness of large US<br />
banks to invest heavily in the two associations, rather than<br />
build networks on their own, explains David Robertson,<br />
publisher of the Nilson Report. That enabled the creation of<br />
an efficient system with near ubiquitous acceptance and<br />
name recognition in the US by the end of the 1970s and<br />
widespread acceptance and name recognition around the<br />
world by the end of the 1980s.<br />
MasterCard and Visa do not issue cards or take credit risk<br />
themselves. Rather, they created the brands that consumers<br />
recognise and they set rules that enable financial<br />
transactions to occur. Banks that issue cards get three<br />
separate streams of revenue — annual fees paid by<br />
cardholders; interchange fees (which have raised the ire of<br />
merchants over the past decade) and most importantly,<br />
interest paid on outstanding balances. In the US, growth<br />
has shifted from credit cards to debit cards.<br />
Merchants alleged in a series of lawsuits in the US that<br />
banks and the two big card associations illegally conspired<br />
to set unreasonably high interchange fees. Those fees<br />
amount to a weighted average of 2.19% of purchase price<br />
to accept Visa and MasterCard credit card payments and<br />
1.75% for Visa and MasterCard debit payments, according<br />
to the Nilson Report. Credit card payments reflect an<br />
extension of credit by a card issuer, while debit payments<br />
draw directly from a consumer’s checking account.<br />
Though neither MasterCard nor Visa says so explicitly,<br />
market observers generally believe that the completed<br />
public share offering and plans for Visa’s pending offering<br />
were driven at least in part by desire to cap any liability<br />
resulting from any lawsuits brought by merchants against<br />
them and their shareholders. The thinking is that even if<br />
merchants convince a court that the banks and the card<br />
networks conspired to set unreasonably high fees, it would<br />
be tougher to make the case that the conspiracy continued<br />
after the banks had sold their controlling positions in the<br />
organisations and left their management boards.<br />
American Express and Discover, at least until they started<br />
making deals with banks, were closed-loop systems, in<br />
which they issued cards and credit at the same time that<br />
they created the brands that consumers see when the shop.<br />
MasterCard, perhaps unsurprisingly, has taken steps to<br />
build warmer relations with merchants.“At the suggestion<br />
of the merchants, MasterCard Worldwide has posted<br />
comprehensive information about its US interchange rates<br />
on its Web site,” says Chris McWilton, MasterCard’s chief<br />
financial officer in an e-mail exchange.“We were the first<br />
company in the payments industry to make a commitment<br />
to this important step.”<br />
Industry observers say MasterCard will probably seek<br />
out marketing agreements with big merchants, such as one<br />
announced last summer with Home Depot, in which<br />
JANUARY/FEBRUARY 2007 • <strong>FTSE</strong> GLOBAL MARKETS
consumers are entered<br />
into a drawing for a<br />
$100,000 kitchen<br />
makeover when they<br />
make payments for a<br />
purchase at the home<br />
supply store with a<br />
MasterCard card.<br />
None of that, however,<br />
necessarily changes the<br />
interchange dynamics.<br />
Even without controlling<br />
ownership and seats on MasterCard and Visa boards, banks<br />
may still call the shots on interchange fees. That is because<br />
they can promote either brand to consumers and could<br />
easily shift transaction volume to the card network that<br />
produces the most revenue for them. The networks, by<br />
contrast, do not really need to compete for the favour of<br />
merchants. Merchants meantime are loathe to tell<br />
customers that they accept one of the main global card<br />
brands, but not the other.<br />
While the outcome of complex antitrust litigation is<br />
probably impossible to know, Nilson Report data shows<br />
that a great deal is at stake. US merchants paid $25.13bn to<br />
accept MasterCard and Visa credit card payments in 2005<br />
and $9.76bn to accept debit card payments with cards<br />
bearing the two big brand names. Most of those payments<br />
find their way to the card issuers; the networks take a small<br />
share of the total.<br />
Even if merchants are unsuccessful in their litigation,<br />
political pressure could well force down fees on debit card<br />
payments, says Nilson Report’s Robertson. Credit card<br />
acceptance probably helps merchants sell more than they<br />
otherwise would, Robertson adds, as consumers spend more<br />
than the money they have on hand. Debit card payments,<br />
however, simply substitute for cash, since the consumer has<br />
to have the funds available in order to use the card, he<br />
explains. As a result, merchants are not as enamoured of<br />
debit card payments. However, since consumer usage of<br />
debit cards is growing rapidly, any cut in fees could be costly<br />
to banks. “It is a staggering amount of money,” Robertson<br />
says.“If it were cut in half that would hurt.”<br />
Predicting a political solution to the dispute is risky<br />
business. However, Craig Wildfang, the lead attorney for the<br />
merchants and a partner with Robins, Kaplan, Miller & Ciresi<br />
LLP in Minneapolis says that lawmakers and regulators<br />
should note that the Reserve Bank of Australia ordered Visa<br />
and MasterCard to roll back interchange fees from about<br />
0.95% of a purchase transaction to 0.55% in 2003. When it<br />
was implemented, he adds, card issuers were not suggesting<br />
they had second thoughts about the business.<br />
“The networks said disaster would happen,” Wildfang<br />
explains, but it has not. After the possibility that banks will<br />
lose interchange fee income, another threat to the status<br />
quo comes from mobile phone operators, though observers<br />
say this may be a couple of years away. Logic suggests<br />
enabling mobile phones to serve as payments devices,<br />
<strong>FTSE</strong> GLOBAL MARKETS • JANUARY/FEBRUARY 2007<br />
Industry observers say MasterCard will<br />
probably seek out marketing agreements<br />
with big merchants, such as one announced<br />
last summer with Home Depot, in which<br />
consumers are entered into a drawing for a<br />
$100,000 kitchen makeover when they<br />
make payments for a purchase at the home<br />
supply store with a MasterCard card.<br />
possibly a contact-less device, card industry analysts say.<br />
“We go out with our mobile phones more frequently than<br />
we go out with our wallets,”Robertson says.<br />
Phone companies ought be interested as well, adds Bruce<br />
Cundiff, an analyst with Javelin Strategy & Research, a<br />
financial technology research firm in Pleasanton, Calif.<br />
“Mobile phone carriers are always looking at ways to get<br />
stickiness in their subscribers,” he says. Bank-owned<br />
MasterCard and Visa would never would have allowed<br />
Verizon Wireless or any of its counterparts to issue credit and<br />
use their brands, just as they did not allow American Express<br />
and Discover into the game until they were told that they<br />
had to. However, as public companies, they ought to have<br />
bigger interest in new revenue sources, observers note.“They<br />
are no longer constrained to viewing their world strictly as a<br />
bank world,”says Eric Grover, principal of Intrepid Ventures,<br />
a payments consulting firm in Menlo Park, California.<br />
Issuing credit and accepting attendant risk, of course,<br />
would be a huge leap for phone companies and so perhaps<br />
they would choose only to enable transactions in<br />
partnership with a bank issuer. That would not divert as<br />
much revenue from the incumbent bankcard issuers.<br />
One likely result of the changing landscape is increased<br />
market share for American Express and Discover. To be sure,<br />
they are far behind the big networks that banks created.Visa<br />
had 42.2% of the credit card purchase volume in the first six<br />
months of 2006 in the US, the largest card market in the<br />
world, according to the Nilson Report. It was followed by<br />
MasterCard, which had 29% of the market, American<br />
Express, with 23.2%, and Discover, with 5.6%. American<br />
Express’s share rose from 22.5% a year earlier and Discover’s<br />
share rose from 5.3%. The share gains, the newsletter says,<br />
could be attributed to banks that also issue MasterCard and<br />
Visa cards beginning to issue theirs as well.<br />
Compared with the global scope of the three larger<br />
brands, Discover is mainly a US card. It is moving, however,<br />
to build acceptance in other parts of the world. It began<br />
implementation in November of a reciprocal agreement<br />
with China Union Pay, under which its cards will be accepted<br />
in China and certain China Union Pay cards may be used in<br />
the US. In August this year, it also announced a similar<br />
agreement with JCB, the largest card issuer in Japan but has<br />
not said when the necessary supporting systems will be up<br />
and running. In addition, it has struck deals with marketing<br />
companies to sign up merchants in Latin America.<br />
71
SECTOR PROFILE: MASTERCARD / VISA<br />
72<br />
It is not clear yet that merchants have a big stake in the<br />
likely gains by American Express and Discover.Their cost to<br />
accept American Express payments is a bit higher than to<br />
accept MasterCard and Visa cards. Their cost to accept<br />
Discover payments is a bit lower. Banks, however,<br />
presumably share some of their card revenue with<br />
American Express and Discover when they issue cards<br />
carrying those brands.<br />
The most interesting development to watch, observers say,<br />
will be the response to public ownership at MasterCard and<br />
at Visa when it takes the plunge. Until now, both<br />
organisations have been managed for the convenience of the<br />
banks that owned them, industry consultants and stock<br />
analysts say, rather than as truly competitive entities. That is<br />
likely to change.“There’s something about a free enterprise,<br />
being on your own, that is going to force these guys to think<br />
about satisfying public owners,” says Duncan MacDonald,<br />
former general counsel of Citigroup Inc.’s Europe and North<br />
America card businesses.<br />
MasterCard and Visa likely will face pressure to do more to<br />
differentiate themselves in the eyes of banks that issue their<br />
cards, even if differentiation among consumers and<br />
merchants is nearly impossible. “You have got to wonder<br />
why some financial institutions would go with Visa,<br />
MasterCard and American Express,” says Nilson Report’s<br />
Robertson. He explains that a bank might seek a better deal<br />
from either Visa or MasterCard by delivering all of its<br />
mainstream consumer volume to one network and then<br />
issue American Express cards to its high-end customer base.<br />
The organisations might compete on the basis of the<br />
cost and efficiency of their networks and the effectiveness<br />
of anti-fraud tools they each offer. If American Express and<br />
Discover pick up significant market share or if they are<br />
forced to cut interchange fees, MasterCard and Visa could<br />
be forced to come up with new sources of revenue. In<br />
addition to working with mobile phone carriers, the card<br />
groups could move more aggressively into related<br />
businesses, such as transaction processing, observers says.<br />
MasterCard intends to do exactly that, says McWilton, the<br />
chief financial officer, as well as continue to work to expand<br />
acceptance into new merchant categories.<br />
“MasterCard is expanding acceptance in electronic<br />
commerce environments, fast food restaurants,<br />
convenience stores, and in public sector payments,<br />
including taxes, fees, fines and tolls,” McWilton says. If<br />
there is an alternative to the basic model, however, that<br />
merchants fork over to card issuers a slice of the payments<br />
that customers make to them, McWilton offers no<br />
suggestion of what it would be.<br />
A number of observers say they see little sign of a more<br />
aggressive management at MasterCard since it sold shares<br />
worth $2.4bn last May. Maybe it is not an urgent or<br />
pressing issue. MasterCard stock more than doubled its<br />
initial public offering price of $37 by November to about<br />
$94. Without tinkering with its business model at all,<br />
MasterCard will see handsome growth in card payments<br />
outside of the US for many years to come, says Anurag<br />
Rana, a stock analyst with Key Bank Capital Markets.<br />
Don’t work in the dark,<br />
who knows what you might find<br />
Emerging Markets Report provides a comprehensive<br />
overview of the principal deals, trends, opportunities<br />
and challenges in fast-developing markets. For more<br />
information on how to order your individual copy of<br />
Emerging Markets Report please contact:<br />
Paul Spendiff<br />
Tel:44 [0] 20 7680 5153<br />
Fax:44 [0] 20 7680 5155<br />
Email:paul.spendiff@berlinguer.com<br />
JANUARY/FEBRUARY 2007 • <strong>FTSE</strong> GLOBAL MARKETS
Trends come and go and even the relatively staid world of fund administration is not immune from<br />
the shifting winds of fashion. It was only a few years ago, that “lift-outs” of the back office function<br />
was the talk of the town. Today however, ‘component’ outsourcing looks to be all the rage. Instead<br />
of a blanket approach to outsourcing, fund managers are increasingly adopting a modular<br />
methodology, contracting out only selected products and services. Lynn Strongin Dodds reports.<br />
THE RISE OF<br />
COMPONENT<br />
OUTSOURCING<br />
JAMES HOCKLEY, A principal in the operations practice at<br />
Investit, a UK-based investment management consultancy,<br />
notes,“There is a recognition that the days of the big end to<br />
end lift-out are coming to an end. One of the reasons is that in<br />
some of the deals, there have been problems with the<br />
migration from the client’s legacy platform to the provider’s<br />
dedicated outsourcing core platform. What we are now seeing<br />
is that clients are looking more to outsource components of<br />
their fund administration operations. This is not to say that<br />
they will use 57 different providers, but will use a core group of<br />
no more than three or four for most of their needs and then a<br />
handful of specialists for their alternative assets.”<br />
The theory behind the lift-out operation was for an<br />
administrator to garner a significant number of deals from<br />
household name asset managers and run them on its global<br />
platform in order to churn out economies of scale for all<br />
concerned.The reality was that out of the 30 or so outsourcing<br />
deals struck over the past four years, only a handful actually<br />
transferred over, according to Hockley. In other words, it was<br />
not proving cost effective for anyone and the custodians<br />
baulked at having to run and maintain multiple systems.<br />
These issues were the main reasons behind the<br />
unravelling of three major high profile deals in 2005.<br />
Although Bank of New York still caters to the custody and<br />
administration needs of Merrill Lynch Investment<br />
<strong>FTSE</strong> GLOBAL MARKETS • JANUARY/FEBRUARY 2007<br />
Management’s, now rechristened BlackRock’s, assets, the<br />
fund manager decided against a full blown outsourcing<br />
deal, allegedly because the fund manager was reluctant to<br />
move to Bank of New York’s SmartSource platform.<br />
Schroders Investment Management also surprised the<br />
markets with its decision to end its five-year back-office<br />
outsourcing contract with JP Morgan Worldwide Securities<br />
Services, while F&C Asset Management pulled the plug on<br />
the Mellon Financial deal; reportedly because the parties<br />
could not agree terms, particularly over the price.<br />
The breakdown of these deals as well as changing market<br />
conditions has led asset management groups to re-evaluate<br />
their outsourcing intentions. They are opting for a much<br />
more granular approach and have broken down the different<br />
functions embedded within their middle and back office to<br />
see where costs can be saved and value added. As Sebastian<br />
Danloy, of Société Générale Securities Services, notes,“UK<br />
asset managers had looked at outsourcing because they<br />
thought it would make their lives easier. However, the<br />
providers were not able to leverage off the infrastructure that<br />
they had and some of the deals fell apart. Today, asset<br />
managers are looking at their offering on a product by<br />
product basis and opting for a more best of breed approach.”<br />
Tom Abraham, managing director and global head of<br />
strategic solutions for the global transaction services<br />
FUND ADMINISTRATION<br />
73
FUND ADMINISTRATION<br />
74<br />
Charlie Helmstetter, director, international<br />
head of product specialists at Mellon<br />
Financial Corporation, notes,“We are<br />
definitely seeing a blurring between the<br />
requirements of the pure alternative players<br />
such as hedge and private equity funds and<br />
the run of the mill equity fund investors.<br />
Photograph kindly supplied by Mellon<br />
Financial Corporation, December 2006.<br />
division at Citigroup, concurs, adding, “We are definitely<br />
seeing more component based arrangements. It is in a way,<br />
a much more sophisticated form of supply chain<br />
management where fund managers are focusing more on<br />
how, where and with whom to buy their services. The<br />
challenge for the providers is how to connect and integrate<br />
all the pieces together in order to be that best provider.”<br />
This is not an easy task as the days of the plain vanilla<br />
funds are long gone. Equities and bonds are just one of<br />
many investment vehicles on the menu. Today, an asset<br />
manager is likely to have an ever increasing complex and<br />
intricate array of products that typically include a family of<br />
alternatives. Hedge funds and private equity are now<br />
almost mainstream; with commodities, currencies and<br />
emerging market bonds being increasingly added to the<br />
mix over the past year.<br />
This is not even mentioning the explosion of the use of<br />
derivatives thanks to the introduction of UCITs III as well<br />
as the increasing popularity of liability driven investing<br />
strategies. They are now integral tools in a traditional<br />
manager’s investment box used for either hedging or as<br />
part of an absolute return strategy.<br />
The goal for the fund administrator, of course, is to<br />
ensure that they are offering top of the range, state of the<br />
art services and products in as many of the functions as<br />
possible. Flexibility is the key word. The bread and butter<br />
core custody and fund accounting services are a must but<br />
players must today also offer price calculations, risk as well<br />
as transition management and performance measurement,<br />
just to name a few, for the thornier alternative asset classes.<br />
Real time information is also on the agenda although all<br />
admit it will be some time before that becomes a reality.<br />
In order to meet these more demanding requirements,<br />
James Hockley, a principal in the operations<br />
practice at Investit, a UK-based investment<br />
management consultancy, notes,“There is a<br />
recognition that the days of the big end to end<br />
lift-out are coming to an end. One of the<br />
reasons is that in some of the deals, there<br />
have been problems with the migration from<br />
the client’s legacy platform to the provider’s<br />
dedicated outsourcing core platform. What we<br />
are now seeing is that clients are looking<br />
more to outsource components of their fund<br />
administration operations. Photograph kindly<br />
supplied by Investit, December 2006.<br />
Stephen Turner, head of BNP Paribas’ Securities<br />
Services’ global fund services products in the<br />
UK, says,“We try to use the organisation in its<br />
entirety and look to see how we can harness the<br />
skills of the investment bank and fund<br />
management group to enhance the performance<br />
of our fund administration capabilities,<br />
particularly in the area of structured products.<br />
We were able to lift out the performance<br />
measurement and analytics group from asset<br />
management to create the Investment Reporting<br />
and Performance team, and now we are looking<br />
at opportunities around analysis of OTC and<br />
derivative pricing.”Photograph kindly supplied<br />
by BNP Paribas, December 2006.<br />
full service providers have taken a leaf out of their clients’<br />
pages and are creating core and satellite packages. Susan<br />
Ebenston, senior vice president of JP Morgan Worldwide<br />
Securities Services, explains,“The need to create a portfolio<br />
with different instrument types is driving the complexity of<br />
the business and as a result, fund administrators need to<br />
reflect their client’s operations. We have created what we<br />
call a hub and spoke approach. There is the hub of our<br />
administration capabilities which we have been doing for<br />
many years – custody, fund accounting, transfer agency, etc<br />
– and around that we have created the spokes for<br />
derivatives, hedge funds, property, private equity, etc.”<br />
Although custom made has become the buzzword in the<br />
industry, many players still have a set, albeit, expanding,<br />
range of products that are configured to meet a client’s<br />
specific needs. Fearghal Woods, director of business<br />
development, at Bank of Ireland Securities Services, says<br />
“Although a lot of the business is commoditised, it is rare,<br />
for example, to get two clients who want the same report<br />
or to distribute information to their customers in the same<br />
way. An insurance company, for example, has different<br />
requirements than a mainstream asset manager. In all<br />
cases, the boundaries are being pushed out even further<br />
and our job is not just to roll out solutions but to integrate<br />
the different individual requirements on one platform.”<br />
Jeremy Hester, senior vice president in Global Fund<br />
Services business development at Northern Trust, notes,“It is<br />
essential that you have an efficient core processing<br />
architecture that provides clients with as much information<br />
as possible but also offers the flexibility to tailor services and<br />
deliver solutions such as, for example, in delivering analytics<br />
using a fund manager’s own liability driven investment<br />
benchmark. It is important to be able leverage the<br />
JANUARY/FEBRUARY 2007 • <strong>FTSE</strong> GLOBAL MARKETS
Susan Ebenston, senior vice president of JP<br />
Morgan Worldwide Securities Services,<br />
explains,“The need to create a portfolio with<br />
different instrument types is driving the<br />
complexity of the business and as a result, fund<br />
administrators need to reflect their client’s<br />
operations. We have created what we call a<br />
hub and spoke approach. There is the hub of<br />
our administration capabilities which we have<br />
been doing for many years – custody, fund<br />
accounting, transfer agency, etc - and around<br />
that we have created the spokes for derivatives,<br />
hedge funds, property, private equity, etc.”<br />
Photograph kindly supplied by JP Morgan,<br />
December 2006.<br />
capabilities you have and be able to redefine them to support<br />
a client’s specific needs instead of having too many products<br />
on offer, that are delivered in an un-integrated fashion. The<br />
ability to do that is where you can add value for clients and<br />
provide the basis for cost efficiencies for both the client and<br />
yourselves. If you do not have that kind of service and<br />
system flexibility then the proposition becomes less<br />
attractive and the business will go elsewhere.”<br />
Despite the cost and time, providers are more than willing<br />
to assist clients moving into new and unchartered territories<br />
if they believe there are benefits to be reaped and the service<br />
can be eventually rolled out for others. For example,<br />
Northern Trust was more than willing to lend Unilever, the<br />
multinational consumer goods company, a helping hand in<br />
launching a fully tax-transparent cross border pension<br />
pooling vehicle, at the beginning of 2006.The pooling vehicle,<br />
which is called Univest, was set up in the form of a<br />
Luxembourg-domiciled Fonds Commun de Placement<br />
(FCP) and the US-based house is providing the custody and<br />
fund administration services. Now that the prototype is in<br />
place, Northern Trust can leverage off its experience to other<br />
clients wanting to go down the pooling path.<br />
Bank of Ireland Securities Services, on the other hand,<br />
developed a separate products development group in late<br />
2005, which works with clients to design new solutions for<br />
their structured products.“Take a client who has a private<br />
equity structure. We do not just tick a box but will create<br />
additional capabilities that it can use,”notes Woods.<br />
Meanwhile, BNP Paribas Securities Services taps into the<br />
expertise of its investment bank and asset management<br />
groups. Stephen Turner, head of the group’s global fund<br />
services products in the UK, says, “We try to use the<br />
organisation in its entirety and look to see how we can<br />
<strong>FTSE</strong> GLOBAL MARKETS • JANUARY/FEBRUARY 2007<br />
Jeremy Hester, senior vice president in Global<br />
Fund Services business development at<br />
Northern Trust, notes,“It is essential that you<br />
have an efficient core processing architecture<br />
that provides clients with as much information<br />
as possible but also offers the flexibility to tailor<br />
services and deliver solutions such as, for<br />
example, in delivering analytics using a fund<br />
manager’s own liability driven investment<br />
benchmark. Photograph kindly supplied by<br />
Northern Trust, December 2006.<br />
Brian Coughlin, IBT’s managing director for<br />
US and European operations,“First, providers<br />
need to be in an environment where they are<br />
doing automated reconciliation and exception<br />
identification on a daily basis. Particularly<br />
with these types of securities transactions and<br />
positions, you’re just not going to be fully<br />
aware of your potential risk exposure if you<br />
can’t reconcile in a timely fashion.”<br />
Photograph kindly supplied by Investors<br />
Bank & Trust, December 2006.<br />
harness the skills of the investment bank and fund<br />
management group to enhance the performance of our<br />
fund administration capabilities, particularly in the area of<br />
structured products. We were able to lift out the<br />
performance measurement and analytics group from asset<br />
management to create the Investment Reporting and<br />
Performance team, and now we are looking at opportunities<br />
around analysis of OTC and derivative pricing.”<br />
If the fund administrator cannot create its own specialist<br />
offering, it will buy the expertise.This has certainly been the<br />
case in the hedge fund arena, which has seen an uptick in<br />
demand for services ranging from daily net asset valuations<br />
and pricing of over-the-counter derivatives to daily risk<br />
reporting and weekly subscriptions and redemptions.<br />
The past two years has seen a swirl of activity with JP<br />
Morgan adding the middle and back office operations of<br />
US hedge fund group Paloma Partners to its 2004 purchase<br />
of Tranaut and State Street entering the fray with its<br />
International Fund Services purchase. Other notable<br />
mentions include HSBC buying Bank of Bermuda,<br />
Citigroup taking over Forum Financial, Northern Trust<br />
acquiring Baring Fund Services and Mellon Financial<br />
Corporation buying DPM, which was one of the few<br />
remaining independent hedge fund administration firms.<br />
The irony, perhaps, is that these specialist services are no<br />
longer limited to the confines of the pure hedge fund<br />
players. The boundaries are converging and it is difficult to<br />
find a long only fund manager who has not already jumped<br />
on the hedge fund bandwagon or contemplating such a<br />
move. As Ebenston, points out, “We created JP Morgan<br />
Hedge Fund Services specifically to cater to hedge funds<br />
but now we are extending it to traditional fund managers<br />
as they are launching hedge funds.” The firm recently won<br />
75
FUND ADMINISTRATION<br />
76<br />
a mandate from Henderson Global Investors, an asset<br />
manager with more than $126bn in assets under<br />
management, to tend to its middle- and back-office<br />
services for its hedge funds.<br />
Charlie Helmstetter, director, international head of<br />
product specialists at Mellon Financial Corporation, notes,<br />
“We are definitely seeing a blurring between the<br />
requirements of the pure alternative players such as hedge<br />
and private equity funds and the run of the mill equity fund<br />
investors. There has been a significant increase in demand<br />
from long short players for the same types of services that<br />
the hedge funds require, such as collateral management<br />
and independent pricing of OTC derivatives. This not only<br />
requires a fund administrator to invest in the technology<br />
but also the intellectual capital.”<br />
Offshore services are a further consideration in this regard.<br />
Susan Clark, managing director of Fund Administration for<br />
RBS International in Jersey notes that: “Over the past few<br />
years we have noticed a definite shift in the requirements<br />
THE ARCHEUS CASE:<br />
BLAMING THE MESSENGER<br />
Two years ago, Gary Kilberg and Peter Hirsch,<br />
operators of New York-based hedge fund Archeus<br />
Capital, presided over a mountain of assets totalling<br />
$3bn. Their focus on convertible-bond market<br />
arbitrage was seemingly unshakeable. That was then.<br />
Within months, the strategy began to falter.<br />
Redemptions soon piled up and before the year was<br />
out Archeus was in the midst of an irreversible freefall.<br />
By the autumn of 2006, the haemorrhage had<br />
reduced assets to less than $700m, forcing Archeus<br />
to finally throw in the towel. Dave Simons reports.<br />
Archeus showed a year-to-date return of less than 2%<br />
at the time of closing. In a two-page farewell letter to<br />
investors, chief executive officers Kilberg and Hirsch chose<br />
not to focus on the fund’s poor performance, but instead<br />
cited “negative sentiment” that had resulted from their<br />
third-party administrator’s “failure to properly maintain the<br />
books and records of our funds.” That, coupled with an<br />
inability to properly re-reconcile the funds’ records in the<br />
months following the revelation, had “led to a series of<br />
investor withdrawals from which we have not been able to<br />
recover,” according to management.<br />
The allegation that less than precise accounting was<br />
somehow to blame for the demise of the once-powerful<br />
Archeus—the second major hedge-fund death of 2006—<br />
has, understandably, received mixed reviews around the<br />
industry. For its part, Archeus’ administrator, GlobeOp<br />
Financial Services, has stayed out of the fray. In an<br />
interview with newsletter FINalternatives a GlobeOp<br />
spokeswoman said that the company “totally disagrees<br />
offshore with regard to outsourcing arrangements, with<br />
“insourcing” often being the preferred route. For historic<br />
plain vanilla funds it was possible to operate on an<br />
outsourced basis where a “factory processing” model could<br />
prevail. In recent times, with increasingly innovative and, as<br />
a result, more complex structures being created, that model<br />
is no longer sustainable.<br />
The emphasis and focus has changed with the<br />
administrator performing a more significant role in fund<br />
structuring from the outset of a project and transitioning<br />
from inception to launch, and ensuring a high level of<br />
customer service is attained and sustained.“We have found<br />
it to be more efficient and cost effective all-round to<br />
perform the functions offshore as a “one stop shop”and, to<br />
this end, we have worked to up-skill [sic] both resources<br />
and technology to meet client and market demands. This<br />
has resulted in a more flexible, tailored approach with<br />
customer service standards within our own control and the<br />
ability to create centres of excellence,”adds Clark.<br />
with the allegations.” She added, “While it is easy to point<br />
fingers at third parties, investors typically liquidate based<br />
on fund performance results.” While some commentators<br />
have suggested that Archeus might even take legal action,<br />
proving liability could be an uphill battle, note experts.<br />
The Archeus hubbub comes at a time when the<br />
outsourcing of administrative functions has reached a<br />
fever pitch—particularly among hedge funds. Faced with<br />
an increasingly diverse investment climate and lacking<br />
sufficient in-house resources, fund managers find it<br />
advantageous to outsource rather than build<br />
infrastructure. At the same time, the evolving market for<br />
outsourcing compels providers to constantly sharpen their<br />
skill sets and include innovative services such as daily<br />
accounting and derivatives processing and reporting. The<br />
recent introduction of Moody’s Investors Service<br />
Operations Quality (OQ) hedge-fund rating system<br />
underscores the need for transparency with regard to such<br />
critical functions as valuation process, accounting controls<br />
and regulatory compliance.<br />
“While we cannot offer an opinion as to who is at fault in<br />
this situation, it certainly does keep quality and riskmanagement<br />
front and center when folks are making this<br />
type of a decision,” says Rob Mancuso, senior vice<br />
president of Boston-based Investors Bank & Trust (IBT),<br />
which provides fund administration services. “The more<br />
incidences of big hedge funds collapsing, the more<br />
government may get involved, which adds yet another level<br />
of oversight and compliance.”<br />
Adds Brian Coughlin, IBT’s managing director for US<br />
and European operations, “First, providers need to be in<br />
JANUARY/FEBRUARY 2007 • <strong>FTSE</strong> GLOBAL MARKETS
Against this background of increasing sophistication<br />
and customisation, one question looming overhead is the<br />
cost of supplying these niche products. There is no doubt<br />
that clients have become more demanding but are fund<br />
administrators confident enough to charge the<br />
appropriate price for their services, particularly on their<br />
higher value end range. The consensus seems to be yes.<br />
One reason is that in today’s relatively buoyant markets,<br />
cost is not as big a factor. The dark, bleak days of 2000 and<br />
2001 seem like a long time ago and memories are short,<br />
particularly when times are good and markets are on a<br />
relative roll.<br />
As Hockley puts it,“Three to four years ago, economic and<br />
market conditions were much more of a factor. There was a<br />
big focus on cost reduction but now fund managers are more<br />
profitable and there is a realisation that the cost of<br />
administering an OTC derivative, say, is ten fold more than,<br />
for example, a straightforward equity trade, and the cost has<br />
to be passed through.”<br />
an environment where they are doing automated reconciliation<br />
and exception identification on a daily basis. Particularly with<br />
these types of securities transactions and positions, you’re just<br />
not going to be fully aware of your potential risk exposure if you<br />
can’t reconcile in a timely fashion. The longer it’s out there,<br />
combined with the volatility of the markets, you’re just setting<br />
the fund and its potential investors up for a big fall.”<br />
Of equal importance, says Coughlin, is a solid understanding<br />
of risk management and regulatory processes. “Firms like ours<br />
that have been heavily involved in the regulated 40Act world<br />
can leverage off of that knowledge, as opposed to the offshore<br />
type of administrator who has a more relaxed set of<br />
regulations, and therefore is not completely customer-tuned to<br />
this kind of scrutiny and pressure.” IBT has been a strong<br />
proponent of increasing independence in transparency, says<br />
Coughlin, “and to that end we’ve created a modelling solution<br />
for OTC instruments so that we are able to actually remove the<br />
hedge-fund manager from the pricing decisions associated with<br />
the instruments, which helps us maintain a proper level of<br />
independence.”<br />
If in fact the independent body is at least partially to blame<br />
in the case of Archeus, how does one go about restoring<br />
investor confidence? For starters, by encouraging openness<br />
and ease of communications, says Coughlin. “Because it is not<br />
only about what the investment manager may be doing to<br />
achieve targeted results—investors also want to know who<br />
they’re hiring, what kind of quality control is in place behindthe-scenes,<br />
and so forth. It’s important that investors know<br />
that they’re welcome to come in and take a look at the<br />
process procedures and controls at a moment’s notice…they<br />
should be able to kick the tires when they feel like it.”<br />
<strong>FTSE</strong> GLOBAL MARKETS • JANUARY/FEBRUARY 2007<br />
Another factor is that fund administrators are no longer<br />
willing to give away services for a song. Developing top of<br />
the line products for alternative assets has a higher price<br />
tag than for example a mainstream equity fund, and they<br />
want to be reimbursed for their efforts. Investment<br />
managers, on the other hand, have also realised that the<br />
firms boasting the lowest prices may not have the best<br />
wares under their showcase.<br />
Mark Kerns, executive vice president of fund manager<br />
services, Europe, at Bank of New York notes,“I think there has<br />
been a real change when it comes to price.There is much more<br />
emphasis on the relationship between the fund administrator<br />
and client, and the price today better reflects the level of overall<br />
activity and types of services that the fund administrator<br />
provides.”Woods echoes these sentiments, adding,“In terms of<br />
putting a deal together, it has become a much more<br />
consultative process between the fund administrator and the<br />
asset manager. The client needs to fully understand what is<br />
being provided and how much it will cost.”<br />
Rob Mancuso, senior vice president of Boston-based<br />
Investors Bank & Trust (IBT), which provides fund<br />
administration services says,“The more incidences of big<br />
hedge funds collapsing, the more government may get<br />
involved, which adds yet another level of oversight and<br />
compliance.” Photograph kindly supplied by Investors Bank<br />
& Trust, December 2006.<br />
77
SOCIALLY RESPONSIBLE INVESTMENTS<br />
78<br />
Responsible<br />
& Profitable<br />
It used to be that investing with a conscience<br />
meant sacrificing returns for the sake of the<br />
planet. However, growing concerns over issues<br />
ranging from global warming to corporate<br />
accountability have helped raise the profile of<br />
socially conscious investment platforms, making<br />
responsible stock picking a potentially promising<br />
endeavor. From Boston, Dave Simons reports.<br />
THE OLD NOTION that it is cheaper to run a business<br />
without worrying about the raw sewage running into<br />
the nearby water supply was not lost on Al Gore,<br />
presidential candidate turned environmental crusader. In<br />
his eye-opening documentary about the impact of global<br />
warming, An Inconvenient Truth, Gore, quoting Upton<br />
Sinclair, affirmed that “you can’t make somebody<br />
understand something if their salary depends upon them<br />
not understanding it.”<br />
However, as Gore himself observes, that attitude is<br />
rapidly changing, as mainstream business begins to see the<br />
long-term profitability of adopting more environmentally<br />
sound operating practices. Last summer, California’s<br />
Republican governor Arnold Schwarzenegger announced<br />
that his state would launch a broad initiative aimed at<br />
trimming greenhouse-gas emissions by 25% over the next<br />
15 years. Spearheaded by eco-minded chief executive<br />
officer (CEO) Jeff Immelt, General Electric has said it will<br />
increase research and development (R&D) investments in<br />
renewable technologies to $1.5bn by 2010, with the added<br />
goal of doubling revenues from clean technologies to<br />
nearly $20bn over the next three years. Even Wal-Mart, that<br />
favorite punching bag for the political left, has retrofitted its<br />
freight trucks with an alt-power converter that cuts fuel<br />
usage by 90% when idling.<br />
Underscoring the trend is a report from Merrill Lynch coauthored<br />
with the non-profit World Resources Institute<br />
Green City. Underscoring the trend is a report from Merrill Lynch<br />
co-authored with the non-profit World Resources Institute (WRI),<br />
which links the demand for eco-friendly solutions with an increase in<br />
compatible investment opportunities. In a world of finite resources,<br />
higher consumer expectations are stimulating a technology race to<br />
meet them, according to the report, which will in turn “present a<br />
compelling investment opportunity for investors worldwide.”<br />
(WRI), which links the demand for eco-friendly solutions<br />
with an increase in compatible investment opportunities.<br />
In a world of finite resources, higher consumer<br />
expectations are stimulating a technology race to meet<br />
them, according to the report, which will in turn “present a<br />
compelling investment opportunity for investors<br />
worldwide.” Typical of such opportunities is a newly<br />
announced partnership between Fortis Investments and<br />
environmental research firm Trucost Plc, which identifies<br />
cost-saving environmental benefits generated by certain<br />
companies, allowing investors to capitalise through Fortissponsored<br />
sustainability funds.<br />
Indeed, the push for green alternatives — from energy to<br />
whole foods to paper-conserving electronic<br />
communications — has helped raise the profile of so-called<br />
socially responsible investment (SRI) products. Unlike<br />
conventional fund managers, SRI stewards “screen” their<br />
stock selections using a variety of social and environmental<br />
factors, hold a company’s feet to the fire through active<br />
shareholder engagement, and ultimately drop a company<br />
altogether if standards fail to be met.<br />
In addition to green or clean causes, SRI fund managers<br />
are continually on the lookout for companies that actively<br />
encourage workplace diversity or promote the equitable<br />
treatment of workers at overseas factories. However, they<br />
traditionally avoid “vice” or “sin” commodities, such as<br />
tobacco, alcohol and weaponry, SRIs have no qualms with<br />
technology and have championed industry giants such as<br />
Microsoft and Yahoo. Thanks to SRIs’ emphasis on<br />
corporate governance, socially conscious investors were<br />
largely shielded from the fallout surrounding Enron,<br />
WorldCom and other accounting-related scandals of the<br />
past several years.<br />
“Responsible investment covers a range of issues and<br />
investment management approaches,” says Will Oulton,<br />
head of the responsible investment unit for London’s <strong>FTSE</strong><br />
JANUARY/FEBRUARY 2007 • <strong>FTSE</strong> GLOBAL MARKETS
Group and an architect of the <strong>FTSE</strong>4Good Index Series.<br />
“Our index selection criteria are based on a model of<br />
corporate best practice and cover environmental impact,<br />
human rights, countering bribery, supply chain labor<br />
standards and stakeholder relations,”he says.<br />
The idea of influencing corporate policy through<br />
personal investment has been enormously enticing to a<br />
cross-section of investors, as evidenced by the sizeable<br />
increase in SRI fund flows. Since 1995, SRI-based assets<br />
have risen from $639bn to over $2trn, and currently<br />
represent more than 10% of all assets under management.<br />
SRI fund choices have more than quadrupled during the<br />
same period.<br />
Not that all of this social consciousness necessarily comes<br />
with a cost. With one-year returns in the 25% range, the<br />
industry’s preeminent SRIs, the New Alternatives Fund<br />
(NALFX) and Parnassus Fund (PARNX), have managed to<br />
achieve that perfect marriage of above-average profitability<br />
and investment responsibility. Others, such as the Aquinas<br />
Value Fund (AQEIX), Citizens Value Fund (CVALX) and<br />
Vanguard <strong>FTSE</strong> Social Index Fund (VFTSX) have posted solid<br />
gains while maintaining a stringent set of investment criteria.<br />
Green and growing<br />
One of the more notable high-flyers of late is Bostonbased<br />
Winslow Green Growth Fund (WGGFX), which<br />
seeks capital appreciation through environmentally<br />
responsible investing in small-capitalisation companies.<br />
Launched in 2001 by Jack Robinson, founder and<br />
president of Winslow Management Company, the fund<br />
currently totals $190m in assets and sports a five-year<br />
return of 15.10% (as of October 31st 2006), some six points<br />
ahead of the benchmark Russell 2000 through the same<br />
period. For his achievements, Robinson recently netted first<br />
place in the aggressive-growth category in Barron’s-Value<br />
Line 2006 Annual Fund Manager’s Survey.<br />
Robinson disputes the notion that SRI managers are<br />
somehow limited by their selection of “correct”<br />
companies. “There are a number of factors that really<br />
allow us to be casting into a pond that has more fish and<br />
bigger fish,” says Robinson. “For instance, during the<br />
screening process you are addressing potential<br />
environmental problems that, in the long run, could wind<br />
up becoming real financial problems as well. So you are<br />
screening in companies that are incorporating the<br />
environment into their overall thinking and strategy, and<br />
by definition should be able to reduce their costs and<br />
enhance their revenues. At the same time, you are also<br />
including within your universe companies that should not<br />
have governance problems, with the idea that you are<br />
ending up with companies that are better managed than<br />
the ones you are screening out.”<br />
Among Robinson’s rotating roster of holdings—which<br />
includes tech firms such as VA Software and Sonic<br />
Solutions, to green-energy producer Zoltek—a few heavy<br />
hitters have emerged, including Whole Foods, a leading<br />
retailer of natural-foods products that has reached nearly<br />
<strong>FTSE</strong> GLOBAL MARKETS • JANUARY/FEBRUARY 2007<br />
Will Oulton, head of the responsible investment unit for London’s <strong>FTSE</strong><br />
Group and an architect of the <strong>FTSE</strong>4Good Index Series.“Our index<br />
selection criteria are based on a model of corporate best practice and cover<br />
environmental impact, human rights, countering bribery, supply chain<br />
labor standards and stakeholder relations,”he says. Photograph kindly<br />
supplied by <strong>FTSE</strong> Group, December 2006.<br />
large-cap proportions. “It is sort of the Holy Grail of the<br />
green investment universe,”says Robinson.“The company<br />
has a very dynamic and decentralised management that is<br />
really driving it forward—it is not a top-down type of<br />
management. We continue to own it, recognizing that the<br />
returns of the next 10 years probably will not be quite as<br />
large as they were over the previous 10 years. But the story<br />
is still very compelling for a host of reasons, not only<br />
because it has worked so well for us, but to also remind us<br />
of what it is we need to be looking for in other companies.”<br />
Challenging times<br />
Because their social screens prevent them from rotating<br />
into whichever sector happens to be heating up at the<br />
moment, SRI managers often have to work twice as hard<br />
once the going gets tough. Such has been the case for Amy<br />
Domini, founder and CEO of Boston-based Domini Social<br />
Investments and the acknowledged “first lady of social<br />
investing.”In 1990, Domini and partners Peter Kinder and<br />
Steve Lydenberg established the Domini 400 Social Index<br />
(the first index based on social-screening factors), a<br />
companion Domini Social Equity Fund (DSEFX) a year<br />
later, then rode the 1990s bull for all it was worth.“It was a<br />
perfect market for indexing, and social screens put us right<br />
in the sweet spot of the market for many of those years.<br />
And then the inverse happened.”<br />
79
SOCIALLY RESPONSIBLE INVESTMENTS<br />
80<br />
Heavily invested in tech stocks<br />
when the downturn began in<br />
early 2000, Domini has spent the<br />
past six years “facing a headwind”<br />
while her non-SRI competitors<br />
exploited big gains in oil and<br />
weaponry. Though the fund<br />
currently maintains a respectable<br />
year to date return of 9.56% (as of<br />
November 22nd 2006), early last<br />
year Domini — who Time<br />
magazine named one of the 100<br />
most influential people in the<br />
world in 2005—decided to move<br />
away from indexing in favour of<br />
an actively managed strategy.<br />
Wellington Management, the<br />
company that helped Domini’s<br />
newly launched European Social<br />
Equity Fund to a robust 1-year<br />
gain of 42.64%, will serve as<br />
DSEFX’s steward.<br />
“For the first four years I was<br />
willing to ignore the trend,” says<br />
Domini,“because I have absolute<br />
confidence that over the march of<br />
history the application of social<br />
criteria, universe to universe, is an enhancement.<br />
Nevertheless, at a certain point you start to think, ‘Don’t I<br />
owe it to the majesty of social investing to try and win in any<br />
kind of market that’s presented to me?’ With an index-toindex<br />
plan, you can always find a better stock, but because<br />
you’re weighted by the market capitalization, it’s sometimes<br />
hard to structurally adjust for the better companies.”<br />
By combining her company’s leadership with<br />
Wellington’s quantitative approach to delivering the active<br />
portfolio, Domini is confident that she is hit on the right<br />
formula for her geographically distinct brand of funds.<br />
“Even though the Wellington track record is brief, the<br />
work arrangement and information exchange has been<br />
excellent. It was obvious that the same model could work<br />
for the Social Equity Fund<br />
as well.”<br />
While societal changes<br />
have prompted some SRI<br />
proponents to call for a<br />
review of certain social<br />
screens, Domini is not<br />
about to alter her core<br />
beliefs just yet. “Alcohol,<br />
tobacco and gambling<br />
are highly addictive, they<br />
destroy the addicted<br />
person as well as that<br />
person’s family, and as<br />
such, I’m not sure that<br />
those kinds of products<br />
Amy Domini, founder and CEO of Bostonbased<br />
Domini Social Investments and the<br />
acknowledged “first lady of social investing.”In<br />
1990, Domini and partners Peter Kinder and<br />
Steve Lydenberg established the Domini 400<br />
Social Index (the first index based on socialscreening<br />
factors); a companion Domini Social<br />
Equity Fund (DSEFX) a year later, then rode<br />
the 1990s bull for all it was worth.“It was a<br />
perfect market for indexing, and social screens<br />
put us right in the sweet spot of the market for<br />
many of those years. And then the inverse<br />
happened,”she says. Photograph kindly supplied<br />
by Domini Social Investments, December 2006.<br />
5 Year Performance of <strong>FTSE</strong> Korea Index vs. <strong>FTSE</strong> World<br />
Index in USD terms<br />
Index level rebased (30 Nov 2001=100)<br />
160<br />
140<br />
120<br />
100<br />
80<br />
60<br />
40<br />
20<br />
0<br />
Nov-01<br />
May-02<br />
Nov-02<br />
May-03<br />
<strong>FTSE</strong>4Good Europe (EUR)<br />
Nov--03<br />
should be distributed in unfettered<br />
capitalism without more restrictive<br />
mechanisms involved. In the case of<br />
nuclear power, we ask, do you want<br />
raw materials distributed as broadly<br />
and as cheaply as possible? As such, we<br />
think that our screens are important in<br />
order to make a statement about the<br />
proper function of capitalism in this<br />
world. So at the end of the day, I don’t<br />
think you are going see these screens<br />
changing all that much.”<br />
Sticking with it<br />
The notion of commitment has been an<br />
integral part of the SRI story, with<br />
investors showing a willingness to stick<br />
with their funds, even during periods of<br />
pronounced volatility. “While some<br />
might climb into an SRI because it is hot<br />
and dump it when it is not,” says<br />
Robinson, “for the most part, Winslow’s<br />
shareholders are individuals and<br />
corporations who are committed to the<br />
environment, understand the philosophy<br />
and rationale and therefore won’t jump<br />
ship just because we’ve had a down<br />
quarter. This is exactly the kind of investor we want.”<br />
With baby boomers accounting for the lion’s share of<br />
pension investments today, managers such as <strong>FTSE</strong>’s<br />
Oulton view the SRI as a modern extension of the old<br />
social consciousness of the past. “SRI investors have a<br />
values set which is reflected in their investment choices,”<br />
says Oulton.“All things being equal, these values issues are<br />
as important to SRI investors as the short term investment<br />
performance of their funds.”<br />
“The way you use your investment capital is the<br />
perfect mandate to start living your life in a way that is<br />
‘green,’” adds Robinson. “Rather than ignoring these<br />
issues or having negative feelings about them, more and<br />
more people are looking for positive solutions, and one<br />
May-04<br />
Nov-04<br />
May-05<br />
<strong>FTSE</strong>4Good Global (USD)<br />
Nov-05<br />
May-06<br />
Nov-06<br />
<strong>FTSE</strong>4Good UK (GBP) <strong>FTSE</strong>4Good US (USD)<br />
Source: <strong>FTSE</strong> Group. Data as at December 2006<br />
of those solutions is<br />
through your own<br />
portfolio.” From Domini’s<br />
vantage point, the<br />
underlying message from<br />
shareholders is still very<br />
positive. “Through our<br />
surveys, we keep hearing<br />
how people love the idea<br />
that they can make a<br />
difference in the world<br />
and at the same time be a<br />
financial steward for their<br />
family’s future. I think it is<br />
a really elegant solution,”<br />
she maintains.<br />
JANUARY/FEBRUARY 2007 • <strong>FTSE</strong> GLOBAL MARKETS
ALPHA GENERATION IS what active managers get<br />
paid for. Before 1964, long-only investors who<br />
outperformed a market index in absolute terms<br />
would have imagined themselves to be successful. Stanford<br />
University professor William F. Sharpe amply<br />
demonstrated in various papers issued between 1962 to<br />
1994, that the performance of an active manager should be<br />
measured on a risk-adjusted basis by differentiating policy<br />
return from active return. These days active asset managers<br />
know they are judged, not only on the quantity but also on<br />
the quality of alpha they are able to deliver. That is because<br />
investors will no longer allow managers use beta<br />
management to leverage the systematic risk exposure of<br />
their portfolios.This situation has led to the growth of coresatellite<br />
management, by which part of the portfolio is<br />
managed passively while the remaining is invested in<br />
satellite strategies.<br />
Skill is what matters for generating positive alpha. Even<br />
so, empirical surveys suggest that, on average, active<br />
managers are not skilled at generating returns above their<br />
respective benchmarks. In fact, around two-thirds are<br />
unsuccessful in generating a positive alpha. As in all zerosum<br />
games, what is lost by some is gained by the others<br />
and therefore only talented active managers can durably<br />
add value in an inefficient market.<br />
The Capital Asset Pricing Model (CAPM) framework<br />
implies that, at equilibrium, uncorrelated assets have no<br />
particular value in portfolio construction. Specific risk<br />
associated with individual assets can be diversified out and<br />
only systematic risk will be rewarded. Contrary to the<br />
Efficient Markets Hypothesis (EMH), empirical evidence<br />
<strong>FTSE</strong> GLOBAL MARKETS • JANUARY/FEBRUARY 2007<br />
ETFs:<br />
Marketing gimmick<br />
or a new paradigm?<br />
Since the introduction of the first exchange-traded fund more than<br />
15 years ago, the ETF market has recorded double-digit annual<br />
growth and now represents more than $400bn of assets under<br />
management on a global basis. Increasingly, institutional and<br />
individual investors realise that ETFs offer cheap and convenient<br />
access to a variety of investment styles, sectors, countries and asset<br />
classes, allowing the construction of both simple and more<br />
sophisticated investment strategies. Yannick Daniel, head of<br />
quantitative research at Société Générale explains how ETFs can add<br />
value in a core-satellite portfolio construction process by offering<br />
not only a pure beta return on the core side, but also an alternative<br />
for generating alpha in the satellites.<br />
shows that financial markets are not perfectly efficient,<br />
therefore generating alphas is possible. Market participants<br />
have different risk preferences, time horizons, skills and<br />
cognitive processing capabilities. Individuals also react to<br />
market information differently, for instance different<br />
individuals may buy or sell a security given the same piece<br />
of news hence creating market inefficiencies.<br />
Because alpha is not homogeneously distributed among<br />
market participants, it can be thought of as the inefficient<br />
component of the market; whereas beta represents the<br />
efficient component. Skills of active managers differ,<br />
thereby creating opportunities for talented managers. Only<br />
luck and skill play a role in beating the index, but ultimately<br />
skill is the key to generating alpha over the long term.<br />
Measuring the talent of an active manager<br />
To assess the real talent of a manager, one needs to<br />
differentiate skill from luck when looking at the<br />
manager’s past performance. One interesting metric for<br />
this is the Information Ratio (IR). IR measures the amount<br />
of active return generated per unit of active risk, making<br />
it possible to compare managers despite different active<br />
risk budgets. The ratio can be used to measure the<br />
statistical level of confidence that the alpha generated by<br />
the manager was due to skill and not simple luck. There is<br />
indeed a direct link between the level of information ratio<br />
and its level of confidence:<br />
t–statistic = IRx√n<br />
n= the number of years over which the alpha and the tracking<br />
error have been observed<br />
GENERATING ALPHA WITH ETFs<br />
81
GENERATING ALPHA WITH ETFs<br />
82<br />
This relationship is represented graphically in the chart<br />
below for IRs between 0.2 and 1.2<br />
The level of confidence in information ratios<br />
120%<br />
100%<br />
80%<br />
60%<br />
40%<br />
20%<br />
0%<br />
1 2 3 4 5 6 7 8 9 10 11 12 13 14 15 16 17 18 19 20<br />
IR=0.2 IR=0.5 IR=0.7 IR=0.9 IR=1.2<br />
The higher the information ratio, the higher the confidence the alpha generated is a<br />
consequence of talent and not simple luck and the shorter the time horizon required<br />
to evaluate the manager’s talent.<br />
Source : Société Générale Equity Research paper, Portfolio Engineering, Spring 2006.<br />
Portable alpha strategies can be more than a marketing<br />
gimmick. Portable alpha strategies allow for the separation of<br />
market (or beta) returns from investment strategies that add<br />
value (or alpha) to a portfolio. They are known as portable<br />
alpha because they can be tranposed to any existing strategy<br />
irrespective of the underlying systematic risk exposure.<br />
Removing the policy risk of a long-only strategy is<br />
called alpha purification. The main objective of such<br />
purification is to retain the added-value of the strategy<br />
and combine it with other pure alphas and/or another<br />
systematic risk layer. As a result, most portable alpha<br />
strategies are built on “purified alphas”derived from longonly<br />
strategies. The purification process requires<br />
separating alpha from beta using derivative instruments<br />
or a short position on ETFs.<br />
ETFs have become popular instruments for core-satellite<br />
management. ETFs are already widely used by institutional<br />
investors as perfect vehicles for managing the core. By<br />
making it possible to acquire beta exposure cheaply and<br />
quickly, ETFs allow investors to create efficient portfolios<br />
for managing policy risk. ETFs can also be used in the<br />
satellites to remove the systematic exposure from a long<br />
strategy and create a portable alpha component. To achieve<br />
this, portfolio managers need to know which beta exposure<br />
provides the best hedge against systematic risk, or in other<br />
words, versus which equity index the portfolio exhibits the<br />
lowest tracking error and the highest correlation.<br />
To illustrate this point, we could take the example of the<br />
following long-only strategy that exhibit a non constant<br />
beta over a given observation period. Regressing the<br />
returns of the strategy against a set of European indices, its<br />
returns’ variance is mostly explained by the DJ Stoxx 600<br />
index, having the highest coefficient of determination (rsquared).<br />
Once the best hedge is identified, we can<br />
neutralise the beta exposure by taking a short position in a<br />
DJ Stoxx ETF and get the following rolling beta.<br />
3-Y rolling betas<br />
1.6<br />
1.4<br />
1.2<br />
1.0<br />
0.8<br />
0.6<br />
0.4<br />
0.2<br />
0.0<br />
-0.2<br />
Apr-93<br />
Apr-94<br />
Apr-95<br />
Apr-96<br />
Apr-97<br />
Apr-98<br />
Apr-99<br />
Apr-00<br />
Apr-01<br />
The synthetic position exhibits a low beta to the<br />
European market, thus making it a portable alpha vehicle<br />
that could be used with another beta exposure, for example<br />
a long position in an ETF on the <strong>FTSE</strong> 100 index.<br />
Using ETFs in the alpha generation process<br />
Alpha can be extracted from many sources. The most<br />
common alpha bets undertaken by investment managers are<br />
stock selection, sector/style rotation and tactical asset<br />
allocation strategies. At the stock picking level, the use of<br />
ETFs is clear. Suppose for example that a portfolio manager<br />
wants to play the European telecom sector but thinks that<br />
Deutsche Telekom is not attractive at the moment and does<br />
not want to be exposed to the specific risk on this stock. The<br />
traditional – and expensive – way to play this strategy is to<br />
buy all the sector constituents but Deutsche Telekom. The<br />
alternative is to buy an ETF tracking the telecommunications<br />
sector and take a short position in Deutsche Telekom.<br />
This simple example could be duplicated with more<br />
sophisticated strategies but the advantage of ETFs versus<br />
futures in this case is quite clear. When sectors are<br />
involved, ETFs represent a better alternative than futures<br />
for which the liquidity is very low. We observed a bid/ask<br />
spread of more than 30 basis points (bps) for future<br />
contracts on the DJ STOXX Telecom while the<br />
corresponding average bid/ask spread for the ETFs tracking<br />
the same index was around 10 bps.<br />
Academic research has demonstrated that sectors benefit<br />
differently from the phases of the economic cycle and their<br />
prices do not follow the same patterns over time. A strategy<br />
based on dynamic sector allocation may therefore generate<br />
a positive alpha. We observe however, limited application of<br />
this insight in portfolio management. There are two main<br />
reasons for this: first the difficulty to identify ex-ante the<br />
rotation criteria to follow for switching amongst sectors, and<br />
second the fact that such a strategy can only be<br />
implemented with a pure exposure to the sector. Managing<br />
a sector allocation through direct positions in individual<br />
stocks is not optimal because of the presence of implied<br />
stock selection bets. Only a detailed performance<br />
attribution analysis allows separating allocation from<br />
selection alpha embedded in the total alpha of the portfolio.<br />
Apr-02<br />
Long strategy Long strategy + short position in ETF DJ STOXX<br />
Source: SG Equity Research<br />
Apr-03<br />
Apr-04<br />
Apr-05<br />
Apr-06<br />
JANUARY/FEBRUARY 2007 • <strong>FTSE</strong> GLOBAL MARKETS
Performance of sector allocation =<br />
∑ [(Wpi - Wbi) x (Rbi -Rb)]<br />
Wpi = weight of the sector in the portfolio,<br />
Wbi = weight of the sector in the benchmark,<br />
Rbi = sector return, Rb = benchmark return<br />
Moreover, every stock exhibits sensitivity to several<br />
macro factors, including industry risk. Managing sector<br />
bets would imply constant monitoring of the active sector<br />
risk through direct positions in stocks, which is difficult and<br />
generates frequent rebalancing. The best means to create<br />
alpha from pure active sector exposure is to implement a<br />
strategy using ETFs, tracking the sector indexes as an<br />
overlay to an ETF tracking the whole market index.<br />
Then, the most difficult task is finding a sector rotation<br />
alpha engine that exhibits a high IR ; that is, persistence in<br />
the alpha generation process. Suppose we can implement<br />
an active sector rotation model that generates an average<br />
quarterly alpha of 5% from a long short market neutral<br />
strategy. The optimal construction would be to overlay this<br />
alpha to a sector-neutral stock selection strategy. The two<br />
alphas will have close to orthogonal risk vectors, thus<br />
creating a high information ratio strategy.<br />
At the global portfolio level, the investment sphere is<br />
typically divided into the strategic and tactical sides of asset<br />
allocation. In the longer term, strategic asset allocation<br />
provides the benchmark portfolio – typically with a horizon<br />
of at least one or two years. Investment managers try to<br />
create excess return by actively altering portfolio<br />
composition through over and underweighting particular<br />
asset classes at various points in time, usually with<br />
investment horizons of between three to 12 months.<br />
The goal of Tactical Asset Allocation (TAA) is to improve<br />
the overall return per unit of risk of the portfolio through<br />
active management of asset allocation deviations. This is<br />
designed to facilitate portfolio’s long-term goals by<br />
seeking added value. As for stock selection or sector<br />
allocation alphas, tactical asset allocation alphas reflect<br />
successful asset classes bets versus the strategic asset<br />
allocation benchmark of the portfolio.<br />
TAA looks to alpha generators to generate excess return<br />
over the passive benchmark, a simpler way to manage this<br />
being to divide it into beta and alpha drivers. Beta engines<br />
govern the overall risk profile of the fund as well as its<br />
expected return while alpha engines are used when markets<br />
are misaligned, producing a tactical bet.This can change the<br />
overall return pattern of the strategic asset allocation.<br />
Dynamic core satellite strategies with an ETF<br />
portfolio<br />
The CPPI approach has largely been used in structured<br />
asset management. The technique offers investors the<br />
possibility of an asymmetric risk/reward profile by<br />
protecting downside performances. Most so-called<br />
<strong>FTSE</strong> GLOBAL MARKETS • JANUARY/FEBRUARY 2007<br />
‘protected funds’ use Constant Performance Portfolio<br />
Insurance (CPPI), Dynamic Portfolio Insurance (DPI) or<br />
Option Based Portfolio Insurance (OBPI) techniques to<br />
achieve their investment targets. We can apply these<br />
techniques to the active risk framework. In this case, the<br />
global risk budget is determined by the tracking error risk<br />
and the portfolio manager will dynamically manage his<br />
exposure between active and passive investments to<br />
achieve the targeted tracking error budget. The main<br />
advantage of this technique is the asymmetric active risk<br />
profile of the resulting portfolio. Most of the positive<br />
tracking error will be captured with a floor on the<br />
downside active risk.<br />
What is important to keep in mind when applying the<br />
CPPI approach on active risk management is that the<br />
portfolio manager has a much greater control over the<br />
active return generated by the satellite portfolio than over<br />
the passive return of the core part. As risk is measured in<br />
the active sphere, the global strategy is thus exposed to a<br />
lesser extent to market shortfalls and early immunisation<br />
that can be a limitation in the traditional CPPI approach<br />
based on total risk.<br />
Dynamic management of the beta using a two-ETF<br />
portfolio<br />
175<br />
165<br />
155<br />
145<br />
135<br />
125<br />
115<br />
105<br />
95<br />
Index<br />
Active risk budget increases<br />
as long as the market is going up<br />
0 1 2 3 4 5 6<br />
Portfolio<br />
Source: SG Equity Research, Spring 2006.<br />
Conclusion<br />
A recent survey conduced by EDHEC Risk and Asset<br />
Management Research concluded that following their<br />
rapid development, ETFs have established themselves as<br />
a widely used instrument among European institutional<br />
investors and their asset managers. More than half of the<br />
respondents are current or planned users of ETFs in<br />
equity investments and a majority of them think that the<br />
use of ETFs will increase in the near future. The results<br />
also reveal that the full potential of these instruments for<br />
asset allocation and portfolio construction is not fully<br />
explored by the majority of investment management<br />
professionals, suggesting that the use of ETFs and the<br />
organisation of portfolio management into a coresatellite<br />
approach are bound to increase. This leaves a<br />
significant growth margin for the future development of<br />
the ETF industry.<br />
83
MARKET REPORTS BY <strong>FTSE</strong> RESEARCH<br />
84<br />
<strong>FTSE</strong> Global Equity Index Series – Global<br />
30 December 2005 to 30 November 2006<br />
<strong>FTSE</strong> All Cap Regional Indices (USD)<br />
140 140 140 140 140 140 140 140<br />
130<br />
120<br />
110<br />
100 100 100 100 100 100 100 100<br />
90 90 90 90 90 90 90 90<br />
80<br />
31-Dec-05<br />
31-Jan-06<br />
28-Feb-06<br />
31-Mar-06<br />
30-Apr-06<br />
31-May-06<br />
30-Jun-06<br />
31-Jul-06<br />
31-Aug-06<br />
30-Sep-06<br />
31-Oct-06<br />
30-Nov-06<br />
<strong>FTSE</strong> All Cap (AC) Regional Indices – Capital Returns YTD (USD)<br />
%<br />
40<br />
30<br />
20<br />
10<br />
0<br />
<strong>FTSE</strong> Global AC<br />
<strong>FTSE</strong> All-World Index<br />
<strong>FTSE</strong> Large Cap<br />
<strong>FTSE</strong> Mid Cap<br />
<strong>FTSE</strong> Small Cap<br />
<strong>FTSE</strong> Developed AC<br />
<strong>FTSE</strong> Adv Emerging AC<br />
<strong>FTSE</strong> Secondary Emerging AC<br />
<strong>FTSE</strong> All-Emerging AC<br />
<strong>FTSE</strong> Latin America AC<br />
<strong>FTSE</strong> Middle East & Africa<br />
<strong>FTSE</strong> North America AC<br />
<strong>FTSE</strong> Emerging Europe AC<br />
<strong>FTSE</strong> Asia Pacific ex Japan AC<br />
<strong>FTSE</strong> Japan AC<br />
<strong>FTSE</strong> Dev Europe AC<br />
<strong>FTSE</strong> All-Emerging Country All Cap Indices – Capital Returns YTD<br />
%<br />
50<br />
40<br />
30<br />
20<br />
10<br />
0<br />
-10<br />
<strong>FTSE</strong> Australia AC<br />
<strong>FTSE</strong> Austria AC<br />
<strong>FTSE</strong> Belgium/Lux AC<br />
<strong>FTSE</strong> Canada AC<br />
<strong>FTSE</strong> Denmark AC<br />
<strong>FTSE</strong> Finland AC<br />
<strong>FTSE</strong> France AC<br />
<strong>FTSE</strong> Germany AC<br />
<strong>FTSE</strong> Greece AC<br />
<strong>FTSE</strong> Hong Kong China AC<br />
<strong>FTSE</strong> Ireland AC<br />
<strong>FTSE</strong> Italy AC<br />
<strong>FTSE</strong> Japan AC<br />
<strong>FTSE</strong> Netherlands AC<br />
<strong>FTSE</strong> New Zealand AC<br />
<strong>FTSE</strong> Norway AC<br />
<strong>FTSE</strong> Portugal AC<br />
<strong>FTSE</strong> Singapore AC<br />
<strong>FTSE</strong> Spain AC<br />
<strong>FTSE</strong> Sweden AC<br />
<strong>FTSE</strong> Switzerland AC<br />
<strong>FTSE</strong> UK AC<br />
<strong>FTSE</strong> US AC<br />
<strong>FTSE</strong> Global AC<br />
<strong>FTSE</strong> Developed Europe AC<br />
<strong>FTSE</strong> Japan AC<br />
<strong>FTSE</strong> Asia Pacific AC ex Japan<br />
<strong>FTSE</strong> Middle East & Africa AC<br />
<strong>FTSE</strong> Emerging Europe AC<br />
<strong>FTSE</strong> Latin America AC<br />
<strong>FTSE</strong> North America AC<br />
Dollar Value<br />
Local Currency Value<br />
Key: AC = All Cap, LC = Large Cap, MC = Mid Cap, SC = Small Cap, LC/MC = Large and Mid Cap<br />
JANUARY/FEBRUARY 2007 • <strong>FTSE</strong> GLOBAL MARKETS
<strong>FTSE</strong> All-Emerging Country Indices – Capital Returns YTD<br />
%<br />
70<br />
60<br />
50<br />
40<br />
30<br />
20<br />
10<br />
0<br />
-10<br />
-20<br />
<strong>FTSE</strong> Global All Cap Sector Indices – Capital Returns YTD (USD)<br />
%<br />
40<br />
30<br />
20<br />
10<br />
Stock Performance<br />
Best Performing <strong>FTSE</strong> All-World Index Stocks (USD/%) Worst Performing <strong>FTSE</strong> All-World Index Stocks (USD/%)<br />
Minara Resources AU 235.1 ITV PCL THAI -76.3<br />
Zijin Mining Group (H) CHN 209.7 Partygaming UK -76.1<br />
Shanghai Zhenhua Port Machinery (B) CHN 207.7 Tokyu Construction JA -62.0<br />
Shenzhen Investment (Red Chip) HK 204.6 UFJ Nicos JA -66.9<br />
Great Wall Motor Company (H) CHN 201.0 Yukos RUS -72.6<br />
Overall Index Return (USD) No. of Value 3 M (%) 6 M (%) 12 M (%) YTD (%) Actual DIv<br />
Consts Yld (%)<br />
<strong>FTSE</strong> Global AC Index 8,008 393.03 8.0 10.8 20.2 17.3 2.03<br />
<strong>FTSE</strong> Global LC Index 1,177 374.85 7.0 10.6 18.4 16.0 2.27<br />
<strong>FTSE</strong> Global MC Index 1,728 538.01 9.2 10.3 22.3 18.2 1.83<br />
<strong>FTSE</strong> Global SC Index 4,983 483.39 10.6 10.0 23.6 20.1 1.69<br />
<strong>FTSE</strong> All-World Index 2,917 233.88 7.6 10.9 19.7 16.9 2.10<br />
12%<br />
<strong>FTSE</strong> Asia Pacific AC ex Japan Index 1,793 503.21 13.4 15.9 31.2 24.9 2.62<br />
<strong>FTSE</strong> Latin America AC Index<br />
10%<br />
<strong>FTSE</strong> All Emerging Europe AC Index<br />
204<br />
115<br />
895.84<br />
856.03<br />
13.8<br />
7.9<br />
23.9<br />
17.3<br />
33.9<br />
39.8<br />
31.9<br />
32.8<br />
2.94<br />
1.55<br />
<strong>FTSE</strong> Developed 8% Europe AC Index<br />
<strong>FTSE</strong> Middle East & Africa AC Index<br />
1,691<br />
210<br />
449.83<br />
588.37<br />
9.3<br />
10.2<br />
14.0<br />
6.8<br />
33.1<br />
18.9<br />
28.4<br />
8.1<br />
2.66<br />
2.76<br />
<strong>FTSE</strong> North 6% Americas AC Index 2,622 343.27 7.7 9.9 13.3 13.1 1.68<br />
<strong>FTSE</strong> Japan AC Index 1,373 398.30 -0.3 -1.1 9.3 0.6 1.07<br />
4%<br />
Key: AC = All Cap, LC = Large Cap, MC = Mid Cap, SC = Small Cap, LC/MC = Large and Mid Cap<br />
2%<br />
0%<br />
<strong>FTSE</strong> GLOBAL MARKETS • JANUARY/FEBRUARY 2007<br />
-2%<br />
0<br />
Dollar Value<br />
Local Currency Value<br />
Capital<br />
<strong>FTSE</strong> Argentina AC<br />
<strong>FTSE</strong> Brazil AC<br />
<strong>FTSE</strong> Chile AC<br />
<strong>FTSE</strong> China AC<br />
<strong>FTSE</strong> Colombia AC<br />
<strong>FTSE</strong> Czech Republic AC<br />
<strong>FTSE</strong> Egypt AC<br />
<strong>FTSE</strong> Hungary AC<br />
<strong>FTSE</strong> India AC<br />
<strong>FTSE</strong> Indonesia AC<br />
<strong>FTSE</strong> Israel AC<br />
<strong>FTSE</strong> Korea AC<br />
<strong>FTSE</strong> Malaysia AC<br />
<strong>FTSE</strong> Mexico AC<br />
<strong>FTSE</strong> Morocco AC<br />
<strong>FTSE</strong> Pakistan AC<br />
<strong>FTSE</strong> Peru AC<br />
Oil & Gas Producers<br />
Oil Equipment, Services & Distribution<br />
<strong>FTSE</strong> Philippines AC<br />
Chemicals<br />
<strong>FTSE</strong> Poland AC<br />
Industrial Metals<br />
Mining<br />
<strong>FTSE</strong> Russia AC<br />
Construction & Materials<br />
<strong>FTSE</strong> South Africa AC<br />
Aerospace & Defence<br />
General Insutrials<br />
<strong>FTSE</strong> Taiwan AC<br />
Electronic & Electrical Equipment<br />
<strong>FTSE</strong> Thailand AC<br />
Industrial Engineering<br />
Industrial Transportation<br />
<strong>FTSE</strong> Turkey AC<br />
Support Services<br />
Automobiles & Parts<br />
Beverages<br />
Food Producers<br />
Household Goods<br />
Personal Goods<br />
Tobacco<br />
Health Care Equipment & Services<br />
Pharmaceuticals & Biotechnology<br />
Food & Druug Retailers<br />
General Retailers<br />
Media<br />
Travel & Leisure<br />
Fixed Line Telecommunications<br />
Mobile Telecommunications<br />
Electricity<br />
Gas, Water & Multiutilities<br />
Software & Computer Services<br />
Technology Hardware & Equipment<br />
Banks<br />
Nonlife Insurance<br />
Life Insurrance<br />
Real Estate<br />
General Financial<br />
Equity Investment Instruments<br />
Total Return<br />
85
MARKET REPORTS BY <strong>FTSE</strong> RESEARCH<br />
86<br />
<strong>FTSE</strong> Global Equity Index Series – Developed ex US<br />
30 December 2005 to 30 November 2006<br />
<strong>FTSE</strong> Developed Regional Indices – Large/Mid Cap (USD)<br />
130<br />
130<br />
125<br />
125<br />
120 120 120 120 120 120 120<br />
115<br />
115<br />
110<br />
110<br />
105<br />
105<br />
100<br />
100<br />
95 95 95 95 95 95 95<br />
90<br />
90<br />
31-Dec-05<br />
%<br />
31-Jan-06<br />
28-Feb-06<br />
31-Mar-06<br />
30-Apr-06<br />
31-May-06<br />
30-Jun-06<br />
31-Jul-06<br />
31-Aug-06<br />
30-Nov-06<br />
<strong>FTSE</strong> Developed Regional Indices – Capital Returns YTD (USD)<br />
30.0<br />
22.5<br />
15.0<br />
7.5<br />
0.0<br />
<strong>FTSE</strong> Developed<br />
<strong>FTSE</strong> All-Emerging<br />
<strong>FTSE</strong> Developed ex US<br />
<strong>FTSE</strong> Developed Europe<br />
<strong>FTSE</strong> Developed Asia Pacific<br />
<strong>FTSE</strong> Developed Asia Pacific ex Japan<br />
<strong>FTSE</strong> Eurozone<br />
<strong>FTSE</strong> US<br />
<strong>FTSE</strong> Developed AC ex US<br />
<strong>FTSE</strong> Developed ex US Sector Indices (LC/MC) – Capital Returns YTD (USD)<br />
%<br />
50 50<br />
40<br />
30<br />
30<br />
20<br />
20<br />
10<br />
10<br />
0<br />
0<br />
30-Sep-06<br />
<strong>FTSE</strong> Developed LC ex US<br />
31-Oct-06<br />
<strong>FTSE</strong> Developed MC ex US<br />
<strong>FTSE</strong> Developed SC ex US<br />
Oil & Gas Producers<br />
Oil Equipment, Services & Distribution<br />
Chemicals<br />
Industrial Metals<br />
Mining<br />
Construction & Materials<br />
Aerospace & Defence<br />
General Insutrials<br />
Electronic & Electrical Equipment<br />
Industrial Engineering<br />
Industrial Transportation<br />
Support Services<br />
Automobiles & Parts<br />
Beverages<br />
Food Producers<br />
Household Goods<br />
Personal Goods<br />
Tobacco<br />
Health Care Equipment & Services<br />
Pharmaceuticals & Biotechnology<br />
Food & Druug Retailers<br />
General Retailers<br />
Media<br />
Travel & Leisure<br />
Fixed Line Telecommunications<br />
Mobile Telecommunications<br />
Electricity<br />
Gas, Water & Multiutilities<br />
Software & Computer Services<br />
Technology Hardware & Equipment<br />
Banks<br />
Nonlife Insurance<br />
Life Insurrance<br />
Real Estate<br />
General Financial<br />
Equity Investment Instruments<br />
<strong>FTSE</strong> Developed (LC/MC)<br />
<strong>FTSE</strong> Developed Europe (LC/MC)<br />
<strong>FTSE</strong> Developed Asia Pacific (LC/MC)<br />
<strong>FTSE</strong> All-Emerging (LC/MC)<br />
<strong>FTSE</strong> Developed ex US (LC/MC)<br />
<strong>FTSE</strong> US (LC/MC)<br />
<strong>FTSE</strong> Developed Asia Pacific<br />
ex Japan (LC/MC)<br />
<strong>FTSE</strong> North America AC (US$)<br />
Capital<br />
Capital<br />
Total Return<br />
Total Return<br />
Key: AC = All Cap, LC = Large Cap, MC = Mid Cap, SC = Small Cap, LC/MC = Large and Mid Cap<br />
JANUARY/FEBRUARY 2007 • <strong>FTSE</strong> GLOBAL MARKETS
Stock Performance<br />
Best Performing <strong>FTSE</strong> Developed ex US Index Stocks (USD/%) Worst Performing <strong>FTSE</strong> Developed ex US Index Stocks (USD/%)<br />
Minara Resources AU 235.1 Partygaming UK -76.1<br />
Shenzhen Investment (Red Chip) HK 204.6 UFJ Nicos JA -66.9<br />
Boliden SWED 195.3 Tokyu Construction JA -62.0<br />
Metrovacesa SP 189.0 Aiful JA -61.7<br />
Zinifex AU 166.4 NIS Group JA -59.7<br />
Overall Index Return (USD) No. of Value 3 M (%) 6 M (%) 12 M (%) YTD (%) Actual Div<br />
Consts Yld (%)<br />
<strong>FTSE</strong> Developed ex US Index (LC/MC) 1,346 264.93 6.7 10.4 26.0 20.6 2.41<br />
<strong>FTSE</strong> US Index (LC/MC) 705 581.25 7.6 10.3 12.2 12.3 1.74<br />
<strong>FTSE</strong> Developed Index (LC/MC) 2,051 226.00 7.2 10.4 18.7 16.3 2.08<br />
<strong>FTSE</strong> All-Emerging Index (LC/MC) 866 428.06 12.7 16.4 32.3 24.1 2.29<br />
<strong>FTSE</strong> Developed Europe Index (LC/MC) 515 267.41 8.5 13.5 31.4 27.0 2.78<br />
<strong>FTSE</strong> Developed Asia Pacific Index (LC/MC) 771 239.00 3.1 4.5 15.7 8.6 1.75<br />
<strong>FTSE</strong> Developed Asia Pacific ex Japan Index (LC/MC) 285 407.59 10.9 16.4 27.9 25.5 3.28<br />
<strong>FTSE</strong> Developed ex US AC Index 3,885 447.98 7.2 10.5 26.7 21.1 2.33<br />
<strong>FTSE</strong> Developed ex US LC Index 555 412.06 6.2 10.1 24.8 19.8 2.58<br />
<strong>FTSE</strong> Developed ex US MC Index 1,728 542.97 9.2 12.1 31.7 24.6 1.83<br />
<strong>FTSE</strong> Developed ex US SC Index 4,983 586.29 10.5 10.9 32.3 25.0 1.69<br />
<strong>FTSE</strong> Global Equity Index Series – Asia Pacific<br />
30 December 2005 to 30 November 2006<br />
<strong>FTSE</strong> Asia Pacific All-Cap (AC) Regional Indices (USD)<br />
125<br />
120<br />
115<br />
110<br />
105<br />
100<br />
95<br />
90<br />
31-Dec-05<br />
31-Jan-06<br />
28-Feb-06<br />
31-Mar-06<br />
30-Apr-06<br />
31-May-06<br />
30-Jun-06<br />
<strong>FTSE</strong> GLOBAL MARKETS • JANUARY/FEBRUARY 2007<br />
31-Jul-06<br />
31-Aug-06<br />
30-Sep-06<br />
31-Oct-06<br />
30-Nov-06<br />
<strong>FTSE</strong> Global AC<br />
<strong>FTSE</strong> Developed<br />
Asia Pacific (LC/MC)<br />
<strong>FTSE</strong> Developed Asia Pacific<br />
ex Japan (LC/MC)<br />
<strong>FTSE</strong> Asia Pacific (LC/MC)<br />
<strong>FTSE</strong> All-Emerging<br />
Asia Pacific AC<br />
<strong>FTSE</strong> Japan (LC/MC)<br />
Key: AC = All Cap, LC = Large Cap, MC = Mid Cap, SC = Small Cap, LC/MC = Large and Mid Cap<br />
87
MARKET REPORTS BY <strong>FTSE</strong> RESEARCH<br />
88<br />
<strong>FTSE</strong> Asia Pacific Regional Sector Indices – Capital Returns YTD (USD)<br />
%<br />
30<br />
25<br />
20<br />
15<br />
10<br />
5<br />
0<br />
<strong>FTSE</strong> Asia Pacific AC<br />
<strong>FTSE</strong> Asia Pacific All Cap Sector Indices – Capital Returns YTD (USD)<br />
%<br />
80<br />
70<br />
60<br />
50<br />
40<br />
30<br />
20<br />
10<br />
0<br />
-10<br />
<strong>FTSE</strong> Global AC<br />
Stock Performance<br />
Best Performing <strong>FTSE</strong> Asia Pacific Index Stocks (USD/%) Worst Performing <strong>FTSE</strong> Asia Pacific Index Stocks (USD/%)<br />
Minara Resources AU 235.1 ITV PCL THAI -76.3<br />
Zijin Mining Group (H) CHN 209.7 UFJ Nicos JA -66.9<br />
Shanghai Zhenhua Port Machinery (B) CHN 207.7 Tokyu Construction JA -62.0<br />
Shenzhen Investment (Red Chip) HK 204.6 Aiful JA -61.7<br />
Great Wall Motor Company (H) CHN 201.0 NIS Group JA -59.7<br />
Overall Index Return (USD)<br />
<strong>FTSE</strong> Developed<br />
Asia Pacific (LC/MC)<br />
Developed Asia Pacific<br />
ex Japan (LC/MC)<br />
<strong>FTSE</strong> All-Emerging<br />
Asia Pacific AC<br />
<strong>FTSE</strong> Developed<br />
Asia Pacific AC<br />
<strong>FTSE</strong> Japan Index (LC/MC)<br />
<strong>FTSE</strong> Asia Pacific (LC/MC)<br />
<strong>FTSE</strong> Asia Pacific MC<br />
<strong>FTSE</strong> Asia Pacific SC<br />
<strong>FTSE</strong> Asia Pacific LC<br />
Oil & Gas Producers<br />
Oil Equipment, Services & Distribution<br />
Chemicals<br />
Industrial Metals<br />
Mining<br />
Construction & Materials<br />
Aerospace & Defence<br />
General Insutrials<br />
Electronic & Electrical Equipment<br />
Industrial Engineering<br />
Industrial Transportation<br />
Support Services<br />
Automobiles & Parts<br />
Beverages<br />
Food Producers<br />
Household Goods<br />
Personal Goods<br />
Tobacco<br />
Health Care Equipment & Services<br />
Pharmaceuticals & Biotechnology<br />
Food & Druug Retailers<br />
General Retailers<br />
Media<br />
Travel & Leisure<br />
Fixed Line Telecommunications<br />
Mobile Telecommunications<br />
Electricity<br />
Gas, Water & Multiutilities<br />
Software & Computer Services<br />
Technology Hardware & Equipment<br />
Banks<br />
Nonlife Insurance<br />
Life Insurrance<br />
Real Estate<br />
General Financial<br />
Equity Investment Instruments<br />
Capital<br />
Total Return<br />
No. of Value 3 M (%) 6 M (%) 12 M (%) YTD (%) Actual DIv<br />
Consts Yld (%)<br />
<strong>FTSE</strong> Global AC Index 8008 393.03 8.0 10.8 20.2 17.3 2.03<br />
<strong>FTSE</strong> Asia Pacific AC Index 3166 442.75 6.0 6.5 19.1 11.2 1.83<br />
<strong>FTSE</strong> Asia Pacific Index (LC/MC) 1299 252.22 5.8 7.1 19.8 12.1 1.83<br />
<strong>FTSE</strong> Asia Pacific LC Index 526 427.86 5.7 7.7 20.6 13.2 1.91<br />
<strong>FTSE</strong> Asia Pacific MC Index 774 483.75 6.1 4.1 16.0 7.0 1.79<br />
<strong>FTSE</strong> Asia Pacific SC Index 1851 490.33 7.2 2.4 13.7 4.6 1.91<br />
<strong>FTSE</strong> Developed Asia Pacific ex Japan Index (LC/MC) 285 407.59 10.9 16.4 27.9 25.5 3.28<br />
<strong>FTSE</strong> Developed Asia Pacific Index (LC/MC) 771 239.00 3.1 4.5 15.7 8.6 1.75<br />
<strong>FTSE</strong> All-Emerging Asia Pacific Index (LC/MC) 528 306.71 14.7 15.5 34.0 23.9 2.08<br />
<strong>FTSE</strong> Japan Index (LC/MC) 486 149.73 0.0 -0.1 10.9 2.4 1.05<br />
Key: AC = All Cap, LC = Large Cap, MC = Mid Cap, SC = Small Cap, LC/MC = Large and Mid Cap<br />
JANUARY/FEBRUARY 2007 • <strong>FTSE</strong> GLOBAL MARKETS
%<br />
<strong>FTSE</strong> Global Equity Index Series – Europe<br />
30 December 2005 to 30 November 2006<br />
<strong>FTSE</strong> European Regional Indices Performance (EUR)<br />
120 120 120 120 120 120 120<br />
115 115 115 115 115 115 115<br />
110<br />
105 105 105 105 105 105 105<br />
100<br />
95 95 95 95 95 95 95<br />
90 90 90 90 90 90 90<br />
31-Dec-05<br />
31-Jan-06<br />
28-Feb-06<br />
31-Mar-06<br />
30-Apr-06<br />
31-May-06<br />
30-Jun-06<br />
<strong>FTSE</strong> Europe All Cap Indices – Capital Returns YTD (EUR)<br />
25<br />
20<br />
15<br />
10<br />
5<br />
0<br />
<strong>FTSE</strong> Global AC<br />
<strong>FTSE</strong> Europe AC<br />
<strong>FTSE</strong> Europe LC<br />
<strong>FTSE</strong> Europe MC<br />
<strong>FTSE</strong> Europe SC<br />
<strong>FTSE</strong> Developed Europe AC<br />
<strong>FTSE</strong> All-Emerging Europe AC<br />
<strong>FTSE</strong> Developed Europe All Cap Sector Indices – Capital Returns YTD (EUR)<br />
%<br />
70<br />
60<br />
50<br />
40<br />
30<br />
20<br />
10<br />
0<br />
<strong>FTSE</strong> GLOBAL MARKETS • JANUARY/FEBRUARY 2007<br />
31-Jul-06<br />
<strong>FTSE</strong> Eurozone AC<br />
31-Aug-06<br />
30-Sep-06<br />
<strong>FTSE</strong> Developed Europe<br />
ex UK AC<br />
<strong>FTSE</strong> Eurofirst 300<br />
<strong>FTSE</strong>urofirst 80<br />
31-Oct-06<br />
<strong>FTSE</strong>urofirst 100<br />
30-Nov-06<br />
Oil & Gas Producers<br />
Oil Equipment, Services & Distribution<br />
Chemicals<br />
Industrial Metals<br />
Mining<br />
Construction & Materials<br />
Aerospace & Defence<br />
General Insutrials<br />
Electronic & Electrical Equipment<br />
Industrial Engineering<br />
Industrial Transportation<br />
Support Services<br />
Automobiles & Parts<br />
Beverages<br />
Food Producers<br />
Household Goods<br />
Personal Goods<br />
Tobacco<br />
Health Care Equipment & Services<br />
Pharmaceuticals & Biotechnology<br />
Food & Druug Retailers<br />
General Retailers<br />
Media<br />
Travel & Leisure<br />
Fixed Line Telecommunications<br />
Mobile Telecommunications<br />
Electricity<br />
Gas, Water & Multiutilities<br />
Software & Computer Services<br />
Technology Hardware & Equipment<br />
Banks<br />
Nonlife Insurance<br />
Life Insurrance<br />
Real Estate<br />
General Financial<br />
<strong>FTSE</strong> Global AC<br />
<strong>FTSE</strong> Developed Europe<br />
ex UK LC/MC<br />
<strong>FTSE</strong>urofirst 300<br />
<strong>FTSE</strong> Developed Europe AC<br />
<strong>FTSE</strong>urofirst 100<br />
<strong>FTSE</strong> Eurobloc AC<br />
<strong>FTSE</strong>urofirst 80<br />
<strong>FTSE</strong> North America AC (US$)<br />
Capital<br />
Total Return<br />
Key: AC = All Cap, LC = Large Cap, MC = Mid Cap, SC = Small Cap, LC/MC = Large and Mid Cap<br />
89
MARKET REPORTS BY <strong>FTSE</strong> RESEARCH<br />
90<br />
Stock Performance<br />
Best Performing <strong>FTSE</strong> Developed Europe Index Stocks (EUR/%) Worst Performing <strong>FTSE</strong> Developed Europe Index Stocks (EUR/%)<br />
Boliden SWED 195.3 Partygaming UK -76.1<br />
Metrovacesa SP 189.0 EADS FRA -21.8<br />
Sacyr-Vallehermoso SP 161.7 Tietoenator Oyj FIN -21.7<br />
Vallourec FRA 145.0 PagesJaunes FRA -21.6<br />
Vestas Wind Systems DEN 136.0 Sogecable SP -16.6<br />
Overall Index Return (EUR)<br />
No. of Value 3 M (%) 6 M (%) 12 M (%) YTD (%) Actual Div<br />
Consts Yld (%)<br />
<strong>FTSE</strong> Global AC Index 8008 393.03 8.0 10.8 20.2 17.3 2.03<br />
<strong>FTSE</strong> Europe AC Index 1806 395.36 5.5 10.7 18.6 14.5 2.62<br />
<strong>FTSE</strong> Europe LC Index 225 422.11 4.0 9.2 14.8 11.3 2.98<br />
<strong>FTSE</strong> Europe MC Index 332 519.13 8.8 14.2 27.3 21.8 2.37<br />
<strong>FTSE</strong> Europe SC Index 1073 556.96 11.0 14.0 30.2 24.6 2.11<br />
<strong>FTSE</strong> Developed Europe AC Index 1691 390.77 5.5 10.5 18.3 14.3 2.66<br />
<strong>FTSE</strong> All-Emerging Europe AC Index 115 743.63 4.2 13.6 24.3 18.2 1.55<br />
<strong>FTSE</strong> Eurobloc AC Index 866 411.26 6.5 11.2 20.6 16.1 2.67<br />
<strong>FTSE</strong> Developed Europe ex UK AC Index 1203 416.81 6.6 11.3 20.2 15.7 2.50<br />
<strong>FTSE</strong>urofirst 300 Index 300 1432.43 4.4 9.6 15.9 12.3 2.79<br />
<strong>FTSE</strong>urofirst 80 Index 80 5032.79 5.0 10.1 17.2 12.8 3.09<br />
<strong>FTSE</strong>urofirst 100 Index 100 4573.44 3.1 7.8 12.8 9.5 3.15<br />
<strong>FTSE</strong> UK Index Series<br />
30 December 2005 to 30 November 2006<br />
<strong>FTSE</strong> UK Index Series (GBP)<br />
125<br />
125<br />
120 120<br />
115<br />
115<br />
110<br />
110<br />
105 105<br />
100 100 100<br />
100 100 100<br />
95<br />
95<br />
90<br />
90<br />
85<br />
85<br />
31-Dec-05<br />
31-Dec-05<br />
31-Jan-06<br />
31-Jan-06<br />
28-Feb-06<br />
28-Feb-06<br />
31-Mar-06<br />
31-Mar-06<br />
30-Apr-06<br />
30-Apr-06<br />
31-May-06<br />
31-May-06<br />
30-Jun-06<br />
30-Jun-06<br />
31-Jul-06<br />
31-Jul-06<br />
31-Aug-06<br />
31-Aug-06<br />
30-Sep-06<br />
30-Sep-06<br />
31-Oct-06<br />
31-Oct-06<br />
30-Nov-06<br />
30-Nov-06<br />
<strong>FTSE</strong> <strong>FTSE</strong> 100 100<br />
<strong>FTSE</strong> 250<br />
<strong>FTSE</strong> 350<br />
<strong>FTSE</strong> SmallCap<br />
<strong>FTSE</strong><br />
<strong>FTSE</strong><br />
All-Share<br />
All-Share<br />
<strong>FTSE</strong> Fledgling<br />
<strong>FTSE</strong> Fledgling<br />
<strong>FTSE</strong> AIM All-Share<br />
<strong>FTSE</strong> AIM All-Share<br />
<strong>FTSE</strong> techMARK<br />
<strong>FTSE</strong> techMARK<br />
Key: AC = All Cap, LC = Large Cap, MC = Mid Cap, SC = Small Cap, LC/MC = Large and Mid Cap<br />
<strong>FTSE</strong> North America AC (US$)<br />
JANUARY/FEBRUARY 2007 • <strong>FTSE</strong> GLOBAL MARKETS<br />
<strong>FTSE</strong> North America AC (US$)
<strong>FTSE</strong> All-Share Sector Indices – Capital Returns YTD (GBP)<br />
80<br />
60<br />
40<br />
40<br />
20<br />
20<br />
0<br />
0<br />
-20<br />
<strong>FTSE</strong> UK Indices – Capital Return YTD (GBP)<br />
25<br />
20<br />
15<br />
10<br />
5<br />
0<br />
-5<br />
%<br />
<strong>FTSE</strong> 100<br />
-20<br />
<strong>FTSE</strong> 250<br />
Stock Performance<br />
Best Performing <strong>FTSE</strong> All-Share Index Stocks (GBP/%) Worst Performing <strong>FTSE</strong> All-Share Index Stocks (GBP/%)<br />
UK Coal 186.2 Stanelco -91.3<br />
Aquarius Platinum 141.7 iSOFT Group -89.92<br />
Aveva Group 130.2 Plasmon -86.13<br />
Chemring Group 112.8 Partygaming -79.1<br />
London Stock Exchange Group 110.6 Instore -67.36<br />
Overall Index 8% Return (GBP)<br />
No. of Value 3 M (%) 6 M (%) 12 M (%) YTD (%) Actual Div Net P/E<br />
6%<br />
<strong>FTSE</strong> 100 Index<br />
Consts<br />
100 6048.85 2.4 5.7 11.5 7.7<br />
Yld (%)<br />
3.15<br />
Cover<br />
2.46<br />
Ratio<br />
12.88<br />
<strong>FTSE</strong> 250 Index4% 8%<br />
250 10673.95 11.2 14.8 28.2 21.4 2.12 2.45 19.28<br />
<strong>FTSE</strong> 350 Index 350 3173.54 3.7 7.0 13.8 9.6 3.00 2.46 13.56<br />
<strong>FTSE</strong> SmallCap 2% 6% Index 328 3650.96 5.9 6.6 14.1 10.5 1.83 1.43 38.24<br />
<strong>FTSE</strong> All-Share Index 678 3119.85 3.7 7.0 13.8 9.6 2.96 2.44 13.85<br />
<strong>FTSE</strong> Fledgling 0% 4% Index 246 4190.66 8.4 9.8 16.9 11.8 1.69 -0.91 0<br />
<strong>FTSE</strong> AIM Index 1156 1018.95 -2.6 -9.2 0.7 -2.6 0.53 -0.76 0<br />
<strong>FTSE</strong> techMARK -2% 2% 100 Index 100 1434.49 4.0 4.6 6.6 0.2 1.43 - -<br />
-4%<br />
0%<br />
-6%<br />
-2%<br />
-4%<br />
Mining<br />
Oil & Gas<br />
<strong>FTSE</strong> GLOBAL MARKETS • JANUARY/FEBRUARY 2007<br />
-6%<br />
<strong>FTSE</strong> 350<br />
Chemicals<br />
<strong>FTSE</strong> SmallCap<br />
Construction & Building<br />
Materials<br />
ng<br />
Oil & Gas Producers<br />
Oil Equipment, Services & Distribution<br />
Chemicals<br />
Industrial Metals<br />
Mining<br />
Construction & Materials<br />
Aerospace & Defence<br />
General Insutrials<br />
Electronic & Electrical Equipment<br />
Industrial Engineering<br />
Industrial Transportation<br />
Support Services<br />
Automobiles & Parts<br />
Beverages<br />
Food Producers<br />
Household Goods<br />
Leisure Goods<br />
Personal Goods<br />
Tobacco<br />
Health Care Equipment & Services<br />
Pharmaceuticals & Biotechnology<br />
Food & Druug Retailers<br />
General Retailers<br />
Media<br />
Travel & Leisure<br />
Fixed Line Telecommunications<br />
Mobile Telecommunications<br />
Electricity<br />
Gas, Water & Multiutilities<br />
Software & Computer Services<br />
Technology Hardware & Equipment<br />
Banks<br />
Nonlife Insurance<br />
Life Insurrance<br />
Real Estate<br />
General Financial<br />
Equity Investment Instruments<br />
Key: AC = All Cap, LC = Large Cap, MC = Mid Cap, SC = Small Cap, LC/MC = Large and Mid Cap<br />
Forestry & Paper<br />
r<br />
<strong>FTSE</strong> All-Share<br />
Steel & Other Metals<br />
ls<br />
Aerospace & Defence<br />
ce<br />
<strong>FTSE</strong> Fledgling<br />
Diversified Industrials<br />
ls<br />
Electronic & Electrical<br />
Equipment<br />
al<br />
<strong>FTSE</strong> AIM<br />
All-Share<br />
ryEngineering<br />
& Machinery<br />
Automobiles & Parts<br />
ts<br />
<strong>FTSE</strong><br />
techMARK 100<br />
Household Goods &<br />
Textiles<br />
&<br />
Beverages<br />
Food Producers &<br />
Processors<br />
&<br />
Health<br />
old Personal Care & Household<br />
Products<br />
Capital<br />
Capital<br />
Total Return<br />
Total Return<br />
Pharmaceuticals &<br />
Biotechnology<br />
&<br />
Tobacco<br />
General Retailers<br />
s<br />
Leisure & Hotels<br />
ls<br />
Media & Entertainment<br />
nt<br />
Support Services<br />
91<br />
s<br />
Transport<br />
Food & Drug Retailers<br />
rs
MARKET REPORTS BY <strong>FTSE</strong> RESEARCH<br />
92<br />
<strong>FTSE</strong> Xinhua Index Series<br />
30 December 2005 to 30 November 2006<br />
<strong>FTSE</strong> Xinhua Index Series (CNY/HKD)<br />
200 200 200 200 200 200<br />
180 180 180 180 180 180<br />
160 160 160 160 160 160<br />
140 140 140 140 140 140<br />
120 120 120 120 120 120<br />
100 100 100 100 100 100<br />
<strong>FTSE</strong> Xinhua Index Series<br />
Index Name Consts Value 3 M (%) 6 M (%) 12 M (%) YTD (%)<br />
Actual Div<br />
Yld (%)<br />
<strong>FTSE</strong>/Xinhua 25 Index (HKD) 25 13977.39 18.6 27.8 56.6 51.9 1.86<br />
<strong>FTSE</strong>/Xinhua China 50 Index (CNY) 50 7246.89 41.2 37.2 96.8 85.6 1.37<br />
<strong>FTSE</strong> Xinhua All-Share Index (CNY) 977 3950.56 22.1 22.7 97.0 87.4 1.33<br />
<strong>FTSE</strong> Xinhua 600 Index (CNY) 600 4293.07 24.4 23.7 99.3 88.4 1.42<br />
<strong>FTSE</strong> Xinhua Small Cap Index (CNY) 377 2626.38 6.1 13.9 79.4 76.3 0.67<br />
<strong>FTSE</strong> Xinhua China Bond Total Return Index (CNY)<br />
*Annual Redemption Yield<br />
32 97.25 1.5 1.3 4.1 2.5 2.94*<br />
<strong>FTSE</strong> Hedge Index Series<br />
<strong>FTSE</strong> Hedge Management Styles (USD) – 5-Year Performance<br />
140<br />
130<br />
120<br />
110<br />
100<br />
80 80 80 80 80 80<br />
31-Dec-05<br />
90<br />
80<br />
Nov-01<br />
31-Jan-06<br />
May-02<br />
28-Feb-06<br />
Nov-02<br />
31-Mar-06<br />
May-03<br />
30-Apr-06<br />
Nov-03<br />
31-May-06<br />
May-04<br />
30-Jun-06<br />
Nov-04<br />
31-Jul-06<br />
Based upon indicative index values as at 30 November 2006<br />
31-Aug-06<br />
May-05<br />
30-Sep-06<br />
Nov-05<br />
31-Oct-06<br />
May-06<br />
30-Nov-06<br />
<strong>FTSE</strong> Hedge<br />
<strong>FTSE</strong> Hedge Directional<br />
<strong>FTSE</strong> Hedge Event Driven<br />
<strong>FTSE</strong> Hedge Non-Directional<br />
Key: AC = All Cap, LC = Large Cap, MC = Mid Cap, SC = Small Cap, LC/MC = Large and Mid Cap<br />
Nov-06<br />
<strong>FTSE</strong>/Xinhua China 25 (HKD)<br />
<strong>FTSE</strong> Xinhua All-Share (CNY)<br />
<strong>FTSE</strong> Xinhua Small Cap (CNY)<br />
<strong>FTSE</strong>/Xinhua China A50 (CNY)<br />
<strong>FTSE</strong> Xinhua 600 (CNY)<br />
<strong>FTSE</strong> Xinhua China Government<br />
Bond Total Return Index (CNY)<br />
JANUARY/FEBRUARY 2007 • <strong>FTSE</strong> GLOBAL MARKETS
<strong>FTSE</strong> Hedge – Management Styles & Strategies (NAV Terms)<br />
Index 3 M 6 M 12 M YTD 5 Year 5-Year Ann 3-Year<br />
Level (%) (%) (%) (%) Return (%) Volatility (%)<br />
<strong>FTSE</strong> Hedge Index 5414.40 1.9 1.5 6.2 4.9 27.1 4.9 6.3<br />
Directional 3300.74 3.8 2.9 7.5 5.7 39.2 6.8 8.6<br />
Equity Hedge 2323.72 4.4 4.3 9.8 6.8 42.5 7.3 9.8<br />
Commodity Trading Association (CTA) / Managed Futures 2007.04 -2.9 -4.6 -3.0 -0.4 35.8 6.3 11.5<br />
Global Macro 1982.37 2.5 1.1 4.9 2.6 26.7 4.8 8.3<br />
Event Driven 3401.44 1.8 2.6 8.5 7.2 21.7 4.0 7.7<br />
Merger Arbitrage 2169.25 0.8 3.0 8.0 7.1 9.8 1.9 6.9<br />
Distressed & Opportunities 2353.49 2.6 2.1 8.8 7.2 32.8 5.8 8.8<br />
Non-directional 3105.85 0.2 0.6 4.5 4.0 15.3 2.9 3.7<br />
Convertible Arbitrage 2058.82 0.5 2.1 7.1 6.7 34.9 6.2 5.7<br />
Equity Arbitrage 2105.92 0.1 0.2 6.6 5.9 17.4 3.3 6.1<br />
Fixed Income Relative Value 2056.32 0.1 0.2 2.2 1.8 5.5 1.1 1.9<br />
Based upon indicative index values as at 30 November 2006<br />
<strong>FTSE</strong> EPRA/NAREIT Global Real Estate Index Series<br />
<strong>FTSE</strong> EPRA/NAREIT Global Real Estate Indices (Total Return Basis)<br />
150<br />
140 140 140 140 140<br />
130 130 130 130 130<br />
120<br />
110<br />
100<br />
90<br />
31-Dec-05<br />
31-Jan-06<br />
28-Feb-06<br />
31-Mar-06<br />
30-Apr-06<br />
31-May-06<br />
30-Jun-06<br />
<strong>FTSE</strong> EPRA/NAREIT Global Real Estate Indices (Total Return)<br />
Actual Div<br />
Index Name Consts Value 3 M (%) 6 M (%) 12 M (%) YTD (%) Yld (%)<br />
<strong>FTSE</strong> EPRA/NAREIT Global Index (USD) 326 3493.16 13.5 26.4 44.3 38.6 3.07<br />
<strong>FTSE</strong> EPRA/NAREIT North America Index Index (USD) 138 4217.06 13.4 28.2 39.1 38.5 3.53<br />
<strong>FTSE</strong> EPRA/NAREIT Europe Index (EUR) 99 3543.23 12.9 23.9 42.6 37.3 2.17<br />
<strong>FTSE</strong> EPRA/NAREIT Euro Zone Index (EUR) 42 3707.53 11.7 22.5 41.2 38.4 2.60<br />
<strong>FTSE</strong> EPRA/NAREIT Asia Index (USD) 89 2499.71 11.5 22.7 43.7 29.3 2.99<br />
<strong>FTSE</strong> GLOBAL MARKETS • JANUARY/FEBRUARY 2007<br />
31-Jul-06<br />
31-Aug-06<br />
30-Sep-06<br />
31-Oct-06<br />
30-Nov-06<br />
EPRA/NAREIT Global<br />
Total Return Index (USD)<br />
EPRA/NAREIT North America<br />
Total Return Index (USD)<br />
EPRA/NAREIT Europe<br />
Total Return Index (EUR)<br />
EPRA/NAREIT Eurozone<br />
Total Return Index (EUR)<br />
EPRA/NAREIT Asia<br />
Total Return Index (USD)<br />
Key: AC = All Cap, LC = Large Cap, MC = Mid Cap, SC = Small Cap, LC/MC = Large and Mid Cap<br />
93
MARKET REPORTS BY <strong>FTSE</strong> RESEARCH<br />
94<br />
<strong>FTSE</strong> Bond Indices<br />
<strong>FTSE</strong> Bond Indices (Total Return Basis)<br />
<strong>FTSE</strong> Bond Indices (Total Return)<br />
Annual<br />
Redemption<br />
Index Name Consts Value 3 M (%) 6 M (%) 12 M (%) YTD (%) Yld (%)<br />
<strong>FTSE</strong> Eurozone Government Bond Index (EUR) 239 156.46 1.4 3.4 1.9 0.8 3.83<br />
<strong>FTSE</strong> Pfandbrief Index (EUR) 375 178.96 1.1 2.6 1.6 1.0 3.90<br />
<strong>FTSE</strong> Euro Emerging Markets Bond Index (EUR) 38 214.53 1.4 3.9 3.7 2.8 4.69<br />
<strong>FTSE</strong> Euro Corporate Bond Index (EUR) 315 145.66 1.3 2.9 1.8 1.2 4.31<br />
<strong>FTSE</strong> Gilts Index Linked All Stocks Index (GBP) 11 2104.05 1.8 5.8 6.6 4.6 1.29*<br />
<strong>FTSE</strong> Gilts Fixed All-Stocks Index (GBP) 29 1971.79 1.4 3.1 3.3 1.9 4.27<br />
<strong>FTSE</strong> US Government Bond Index (USD) 126 152.73 2.5 5.3 4.9 3.6 4.64<br />
<strong>FTSE</strong> Japan Government Bond Index (JPY) 243 110.61 0.3 1.7 0.1 0.2 1.55<br />
<strong>FTSE</strong> China Government Bond Index (CNY) 32 97.25 1.5 1.3 4.1 2.5 2.94<br />
* Based on 0% inflation<br />
<strong>FTSE</strong> GWA Index Series<br />
<strong>FTSE</strong> GWA Index Series – 5-Year Performance (Total Return Basis)<br />
250<br />
200<br />
150<br />
100<br />
50<br />
106<br />
104 104 104 104 104 104 104 104<br />
102 102 102 102 102 102 102 102<br />
100 100 100 100 100 100 100 100<br />
98<br />
96<br />
31-Dec-05<br />
Sep-01<br />
31-Jan-06<br />
Mar-02<br />
28-Feb-06<br />
Sep-02<br />
31-Mar-06<br />
Mar-03<br />
30-Apr-06<br />
Sep-03<br />
31-May-06<br />
Mar-04<br />
30-Jun-06<br />
Sep-04<br />
31-Jul-06<br />
Mar-05<br />
31-Aug-06<br />
Sep-05<br />
30-Sep-06<br />
31-Oct-06<br />
Mar-06<br />
30-Nov-06<br />
<strong>FTSE</strong> GWA Developed<br />
Index (USD)<br />
<strong>FTSE</strong> GWA Developed<br />
ex US Index (USD)<br />
<strong>FTSE</strong> GWA Developed<br />
ex Japan Index (USD)<br />
<strong>FTSE</strong> GWA Developed Europe<br />
Index (EUR)<br />
<strong>FTSE</strong> GWA UK Index (GBP)<br />
Key: AC = All Cap, LC = Large Cap, MC = Mid Cap, SC = Small Cap, LC/MC = Large and Mid Cap<br />
Sep-06<br />
<strong>FTSE</strong> Eurozone Government<br />
Bond Index (EUR)<br />
<strong>FTSE</strong> Euro Corporate<br />
Bond Index (EUR)<br />
<strong>FTSE</strong> US Goverment<br />
Bond Index (USD)<br />
<strong>FTSE</strong> Pfandbriefe Index (EUR)<br />
<strong>FTSE</strong> Gilts Index Linked<br />
All Stocks (GBP)<br />
<strong>FTSE</strong> Japan Government<br />
Bond Index (JPY)<br />
<strong>FTSE</strong> Euro Emerging Markets<br />
Bond Index (EUR)<br />
<strong>FTSE</strong> Gilts Fixed All-Stocks (GBP)<br />
JANUARY/FEBRUARY 2007 • <strong>FTSE</strong> GLOBAL MARKETS
<strong>FTSE</strong> GWA Indices (Total Return)<br />
Actual Div<br />
Index Name Consts Value 3 M (%) 6 M (%) 12 M (%) YTD (%) Yld (%)<br />
<strong>FTSE</strong> GWA Developed Index (USD) 2051 4010.01 8.0 12.2 23.9 21.1 2.30<br />
<strong>FTSE</strong> GWA Developed ex US Index (USD) 1346 4333.39 7.8 12.4 31.1 25.7 2.61<br />
<strong>FTSE</strong> GWA Developed ex Japan Index (USD) 1567 4170.75 7.3 18.6 30.6 28.4 2.40<br />
<strong>FTSE</strong> GWA Developed Europe Index (EUR) 517 4015.31 5.9 12.1 21.8 17.6 2.93<br />
<strong>FTSE</strong> GWA UK Index (GBP) 684 3817.03 5.0 9.2 17.5 13.0 3.10<br />
<strong>FTSE</strong> RAFI Index Series<br />
<strong>FTSE</strong> RAFI Index Series – 5-Year Performance (Total Return Basis)<br />
250<br />
200<br />
150<br />
100<br />
50<br />
Nov-01<br />
May-02<br />
Nov-02<br />
May-03<br />
Nov-03<br />
<strong>FTSE</strong> RAFI Indices (Total Return)<br />
May-04<br />
Actual Div<br />
Index Name Consts Value 3 M (%) 6 M (%) 12 M (%) YTD (%) Yld (%)<br />
<strong>FTSE</strong> RAFI US 1000 Index (USD) 985 5962.30 7.9 12.0 17.7 17.5 2.06<br />
<strong>FTSE</strong> RAFI Developed ex US 1000 Index (USD) 1001 6468.59 8.0 12.2 30.6 25.2 2.54<br />
<strong>FTSE</strong> RAFI Kaigai 1000 Index (USD) 1013 5711.71 8.6 13.7 26.3 24.0 2.48<br />
<strong>FTSE</strong> RAFI Europe Index (EUR) 454 5941.63 6.5 12.3 22.9 18.8 2.84<br />
<strong>FTSE</strong> RAFI Eurozone Index (EUR) 264 6040.70 7.2 13.2 24.6 20.8 2.86<br />
<strong>FTSE</strong> Research Team contact details<br />
Andy Harvell Andreas Elia Kamila Lewandowski Sandra Jim<br />
Head of Research Research Executive Index Development Executive Research Manager, Asia Pacific<br />
andy.harvell@ftse.com andreas.elia@ftse.com kamila.lewandowski@ftse.com sandra.jim@ftse.com<br />
+44 20 7866 8986 +44 20 7866 8013 +44 20 7866 1877 +(852) 223 0-5814<br />
<strong>FTSE</strong> GLOBAL MARKETS • JANUARY/FEBRUARY 2007<br />
Nov-04<br />
May-05<br />
Nov-05<br />
May-06<br />
<strong>FTSE</strong> RAFI US 1000 Index (USD)<br />
<strong>FTSE</strong> RAFI Developed ex US<br />
1000 Index (USD)<br />
<strong>FTSE</strong> RAFI Kaigai 1000 Index (USD)<br />
<strong>FTSE</strong> RAFI Europe Index (EUR)<br />
<strong>FTSE</strong> RAFI Eurozone Index (GBP)<br />
Key: AC = All Cap, LC = Large Cap, MC = Mid Cap, SC = Small Cap, LC/MC = Large and Mid Cap<br />
Nov-06<br />
95
CALENDAR<br />
96<br />
Index Reviews January – June 2007<br />
Date Index Series Review Type Effective Data Cut-off<br />
(Close of business)<br />
11-Jan TSEC Taiwan 50 Quarterly review 19-Jan 29-Dec<br />
Mid Jan PSI 20 Semi-annual review 30-Jan 31-Dec<br />
Mid Jan OMX H25 Quarterly review of number of shares 20 Jan 31-Jan<br />
Feb BEL 20 Annual review 1-Mar 31-Dec<br />
Feb AEX Annual review 1-Mar 31-Dec<br />
9-Feb Hang Seng Quarterly review 1-Mar 29-Dec<br />
12-Feb MSCI Standard Index Series Quarterly review 28 Feb 31-Jan<br />
Early Mar ATX Semi-annual review / number of shares 30-Mar 28-Feb<br />
Early Mar CAC 40 Quarterly review 16 Mar 28-Feb<br />
Early Mar S&P / TSX Quarterly review 16-Mar 28-Feb<br />
2-Mar S&P / MIB Semi-annual review 19 Mar 12 Mar<br />
2-Mar S&P / ASX Indices Annual / Quarterly review 16-Mar 28-Feb<br />
3-Mar DAX Quarterly review 16-Mar 28-Feb<br />
7-Mar <strong>FTSE</strong> Asiatop / Asian Sectors Semi-annual review 16-Mar 28 Feb<br />
7-Mar <strong>FTSE</strong> UK Quarterly review 16-Mar 6-Mar<br />
7-Mar <strong>FTSE</strong> All-World Annual review Asia Pacific ex Japan 16-Mar 29-Dec<br />
7-Mar <strong>FTSE</strong>urofirst 300 Quarterly review 16-Mar 28-Feb<br />
7-Mar <strong>FTSE</strong> techMARK 100 Quarterly review 16-Mar 28-Feb<br />
7-Mar <strong>FTSE</strong> eTX Quarterly review 16-Mar 28-Feb<br />
9-Mar NASDAQ 100 Quarterly review / Shares adjustment 16-Mar 28-Feb<br />
12-Mar NZSX 50 Quarterly review 30-Mar 28-Feb<br />
13-Mar S&P MIB Quarterly review - shares & IWF 19-Mar 12-Mar<br />
14 Mar DJ STOXX Quarterly review (components) 16 Mar 20-Feb<br />
14-Mar DJ STOXX Quarterly review (style) 16-Mar 1-Mar<br />
14-Mar S&P US Indices Quarterly review 16-Mar<br />
14-Mar S&P Europe 350 / S&P Euro Quarterly review 16-Mar<br />
14-Mar S&P Topix 150 Quarterly review 16-Mar<br />
14-Mar S&P Asia 50 Quarterly review 16-Mar<br />
14-Mar S&P Global 1200 Quarterly review 16-Mar<br />
14-Mar S&P Global 100 Quarterly review 16-Mar<br />
14-Mar S&P Latin 40 Quarterly review 16-Mar<br />
16-Mar Russell US Indices Quarterly review - IPO additions only 31-Mar 28-Feb<br />
8-Apr TSEC Taiwan 50 Quarterly review 20-Apr 30-Mar<br />
11-Apr <strong>FTSE</strong> Nordic 30 Semi-annual review 20-Apr 30-Apr<br />
Mid April OMX H25 Quarterly review 20-Apr 31-Mar<br />
Late April <strong>FTSE</strong> / ATHEX Semi-annual review 31-May 30-Mar<br />
11-May Hang Seng Quarterly review 1-Jun 30-Mar<br />
16-May MSCI Standard Index Series Annual review 31-May 30-Apr<br />
Early Jun ATX Quarterly review 29-Jun 31-May<br />
Early Jun KOSPI 200 Annual review 8-Jun 31-May<br />
Early Jun IBEX 35 Semi-annual review 2-Jul 31-May<br />
Early Jun CAC 40 Quarterly review 15-Jun 31-May<br />
Early Jun OBX Semi-annual review 15-Jun 31-May<br />
Early Jun S&P / TSX Quarterly review 15-Jun 31-May<br />
1-Jun OMX C20 Semi-annual review 15-Jun 31-May<br />
1-Jun S&P BRIC 40 Semi-annual review - constituents 15-Jun<br />
1-Jun S&P / ASX Indices Quarterly Review 15-Jun 31-May<br />
1-Jun DJ Global Titans 50 Annual review of index composition 15-Jun 30-Apr<br />
4-Jun OMX S30 Semi-annual review 30-Jun 31-May<br />
Sources: Berlinguer, <strong>FTSE</strong>, JP Morgan, Standard & Poors, STOXX<br />
JANUARY/FEBRUARY 2007 • <strong>FTSE</strong> GLOBAL MARKETS
MARHedge Presents:<br />
12th Annual<br />
European Conference<br />
on Alternative Investments<br />
5-7 February 2007 • Hotel President Wilson • Geneva, Switzerland<br />
The MARHedge 12th Annual European Conference on Alternative Investments, 5-7 February in Geneva,<br />
Switzerland, will gather leading hedge fund and fund-of-funds managers, institutional and high-net-worth<br />
investors from all over the world to delve deeply into the next generation of alternative investments. Through<br />
keynote speeches, as well as general and targeted breakout sessions, investors and those who control the<br />
most lucrative distribution channels will reveal what they are looking for from managers. Managers will also<br />
detail the challenges of executing strategies in emerging markets and unique investment styles in more<br />
established arenas.<br />
MARHedge Geneva 2006 attracted a delegate mix of 46% hedge funds, 35% investors and 19% service<br />
providers.<br />
Speakers Include:<br />
Albert Pinzón, Brown Rudnick Berlack Israels LLP<br />
Andrew Alford, Goldman Sachs & Co<br />
Charles Lemonides, ValueWorks LLC<br />
Gabriel Bousbib, Gottex Fund Management<br />
Alper Ince, Pacific Alternative Asset Management Co LLC<br />
Jeffrey Solomon, Ramius Capital Group<br />
Rubin Chen, ING Alternative Asset Management<br />
John Godden, IGS Group Limited<br />
Leila Kardouche, RAB Capital PLC<br />
Marcel Giacometti, Auda (UK) Ltd.<br />
Paul Ross, Arundel Iveagh Investment Management Ltd<br />
Sebastian Dovey, Scorpio Partnership<br />
Sebastian Stubbe, Landmark Investors LLC<br />
Tushar Patel, Hedge Funds Investment Management Ltd<br />
Barbara Rupf Bee, HSBC Republic Investment Ltd<br />
Hrishi Parandekar, Private Wealth Advisory<br />
To Register Today! Contact Jeannie Lee:<br />
jlee@marhedge.com or +1 646 274 6213
Merchant Banking<br />
support 2<br />
Getting you there.<br />
Understanding the fluctuations of the international investment market allows for<br />
innovative investment strategies. At Fortis, we combine experience, expertise and<br />
technology to offer you insight that turns strategic decisions into financial solutions.<br />
From our offices around the world, we have the skills and local market knowledge to<br />
support your needs wherever and whenever that may be.<br />
www.merchantbanking.fortis.com