Annual Report 2010-2011 - Gammon India
Annual Report 2010-2011 - Gammon India
Annual Report 2010-2011 - Gammon India

Create successful ePaper yourself
Turn your PDF publications into a flip-book with our unique Google optimized e-Paper software.
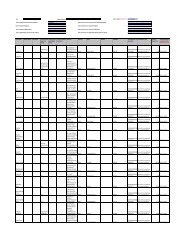
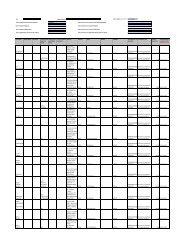
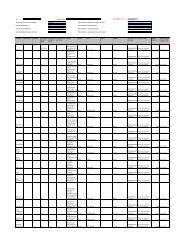
20. Additional information pursuant to Schedule VI to the Companies Act, 1956.<br />
(a) Licensed and installed capacity and production of goods manufactured:<br />
Particulars Transmission Line<br />
Towers & Parts<br />
Conductors<br />
Licensed/Registered capacity<br />
N.A. N.A.<br />
(No License is required)<br />
(N.A.) (N.A.)<br />
Installed capacity (as certified by the management and accepted by 110,000 MT p.a. 36,000 MT p.a.<br />
the auditors, being a technical matter)<br />
(110,000 MT p.a.) (36,000 MT p.a.)<br />
Actual production including job work 102,525 MT p.a 11,916.155 MT p.a.<br />
(Figures in brackets are for the previous year)<br />
(83,512 MT p.a.) (3,860.666 MT p.a.)<br />
(b) Opening and Closing stock of goods manufactured and traded in:<br />
A NNUAL R EPORT I <strong>2010</strong>/11<br />
(` in Crores)<br />
Particulars <strong>2010</strong>-<strong>2011</strong> 2009-10<br />
(Qty.) Amount (Qty.) Amount<br />
Opening Stock-Transmission Line Towers & Parts (MT) 3,348 17.53 6,780 41.61<br />
Opening Stock-Conductor (KM) 90.643 0.99 150.266 2.34<br />
TOTAL 18.52 43.95<br />
Closing Stock-Transmission Line Towers & Parts (MT) (*) *5,183 **29.63 3,348 17.53<br />
Closing Stock-Conductor (KM) 592.835 8.60 90.643 0.99<br />
TOTAL 38.23 18.52<br />
*Includes 95 MT (P.Y. NIL) lying at Port.<br />
**Includes ` 0.52 Crores (P.Y. NIL) lying at Port, But excludes Scrap Stock of ` 0.16 Crores (P.Y. ` 0.22 Crores).<br />
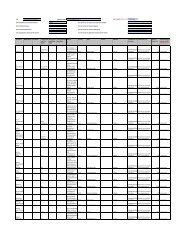
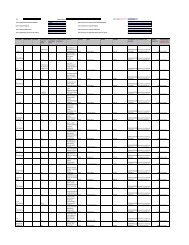
(` in Crores)<br />
Particulars <strong>2010</strong>-<strong>2011</strong> 2009-<strong>2010</strong><br />
Qty (M.T.) Amount Qty (M.T.) Amount<br />
Raw Materials consumed-Transmission Line Towers & Parts:<br />
Steel 101,343 377.75 99,943 352.83<br />
Zinc<br />
Raw materials consumed-Conductor:<br />
4,561 52.97 4,717 48.20<br />
Aluminum Ingots 9,429.23 108.20 3,134.032 30.89<br />
Aluminum/EC Wire Rod 345.56 3.95 363.253 4.18<br />
GI Wire<br />
Turnover:<br />
1,997.42 9.58 394.454 1.79<br />
i) Sale of Towers *(Includes Job work) 100,690* 741.88 86,944 696.66<br />
ii) Sale of Power (In KwH) 5,926,134 2.00 7,486,080 2.52<br />
iii) Conductor (KM) 7,713.95 141.97 2,359.119 57.51<br />
* Includes 336 MT (P.Y. Nil) rejected material sold as scrap.<br />
(c) The requirement of quantitative information of the Company as required by A.S.E. 494 – E dated 30.10.1973 is not applicable to the<br />
Company as regards construction activities of transmission line. As regards various other quantitative details the same have not been<br />
reported as various items are of dissimilar nature and it is not practicable to disclose the quantitative information.<br />
21. Disclosure in accordance with Accounting Standard – 7 (Revised), in respect of contracts entered into on or after 1 st April, 2003:<br />
Particulars Year ended<br />
31 st March, <strong>2011</strong><br />
(` in Crores)<br />
Year ended<br />
31 st March, <strong>2010</strong><br />
Turnover for the year 4,323.45 3,440.84<br />
Aggregate Expenditure (Net of inventory adjustments) for contracts existing as at the year end 12,530.75 11,437.17<br />
Aggregate Contract Profits/Losses recognized for contracts existing as at the year end 1,482.65 1,510.34<br />
Contract Advances (Net) 722.33 798.04<br />
Gross Amount due from customers for contract work 918.59 1,085.77<br />
Gross Amount due to customers for contract work 3.66 0.01<br />
89