Annual Report 2010-2011 - Gammon India
Annual Report 2010-2011 - Gammon India
Annual Report 2010-2011 - Gammon India

Create successful ePaper yourself
Turn your PDF publications into a flip-book with our unique Google optimized e-Paper software.
88<br />
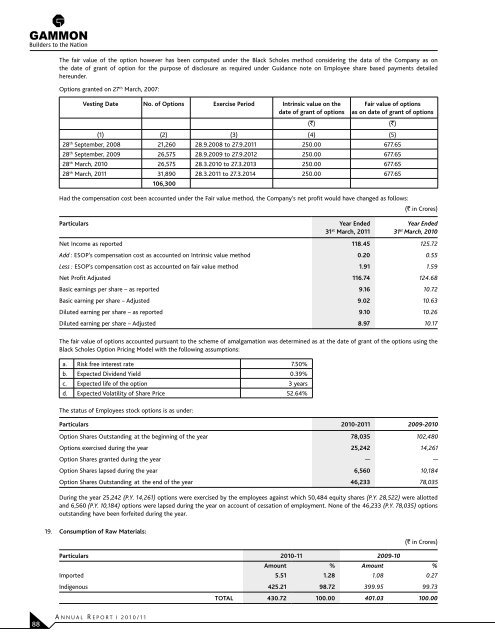
The fair value of the option however has been computed under the Black Scholes method considering the data of the Company as on<br />
the date of grant of option for the purpose of disclosure as required under Guidance note on Employee share based payments detailed<br />
hereunder.<br />
Options granted on 27 th March, 2007:<br />
Vesting Date No. of Options Exercise Period Intrinsic value on the<br />
date of grant of options<br />
A NNUAL R EPORT I <strong>2010</strong>/11<br />
Fair value of options<br />
as on date of grant of options<br />
(`) (`)<br />
(1) (2) (3) (4) (5)<br />
28th September, 2008 21,260 28.9.2008 to 27.9.<strong>2011</strong> 250.00 677.65<br />
28th September, 2009 26,575 28.9.2009 to 27.9.2012 250.00 677.65<br />
28th March, <strong>2010</strong> 26,575 28.3.<strong>2010</strong> to 27.3.2013 250.00 677.65<br />
28th March, <strong>2011</strong> 31,890<br />
106,300<br />
28.3.<strong>2011</strong> to 27.3.2014 250.00 677.65<br />
Had the compensation cost been accounted under the Fair value method, the Company’s net profit would have changed as follows:<br />
(` in Crores)<br />
Particulars Year Ended<br />
31 st March, <strong>2011</strong><br />
Year Ended<br />
31 st March, <strong>2010</strong><br />
Net Income as reported 118.45 125.72<br />
Add : ESOP’s compensation cost as accounted on Intrinsic value method 0.20 0.55<br />
Less : ESOP’s compensation cost as accounted on fair value method 1.91 1.59<br />
Net Profit Adjusted 116.74 124.68<br />
Basic earnings per share – as reported 9.16 10.72<br />
Basic earning per share – Adjusted 9.02 10.63<br />
Diluted earning per share – as reported 9.10 10.26<br />
Diluted earning per share – Adjusted 8.97 10.17<br />
The fair value of options accounted pursuant to the scheme of amalgamation was determined as at the date of grant of the options using the<br />
Black Scholes Option Pricing Model with the following assumptions:<br />
a. Risk free interest rate 7.50%<br />
b. Expected Dividend Yield 0.39%<br />
c. Expected life of the option 3 years<br />
d. Expected Volatility of Share Price 52.64%<br />
The status of Employees stock options is as under:<br />
Particulars <strong>2010</strong>-<strong>2011</strong> 2009-<strong>2010</strong><br />
Option Shares Outstanding at the beginning of the year 78,035 102,480<br />
Options exercised during the year 25,242 14,261<br />
Option Shares granted during the year — —<br />
Option Shares lapsed during the year 6,560 10,184<br />
Option Shares Outstanding at the end of the year 46,233 78,035<br />
During the year 25,242 (P.Y. 14,261) options were exercised by the employees against which 50,484 equity shares (P.Y. 28,522) were allotted<br />
and 6,560 (P.Y. 10,184) options were lapsed during the year on account of cessation of employment. None of the 46,233 (P.Y. 78,035) options<br />
outstanding have been forfeited during the year.<br />
19. Consumption of Raw Materials:<br />
(` in Crores)<br />
Particulars <strong>2010</strong>-11 2009-10<br />
Amount % Amount %<br />
Imported 5.51 1.28 1.08 0.27<br />
Indigenous 425.21 98.72 399.95 99.73<br />
TOTAL 430.72 100.00 401.03 100.00