Annual Report 2010-2011 - Gammon India
Annual Report 2010-2011 - Gammon India
Annual Report 2010-2011 - Gammon India

You also want an ePaper? Increase the reach of your titles
YUMPU automatically turns print PDFs into web optimized ePapers that Google loves.
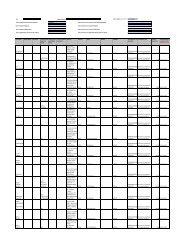
<strong>2010</strong>-<strong>2011</strong> 2009-<strong>2010</strong><br />
` in Crores ` in Crores ` in Crores ` in Crores<br />
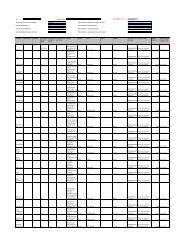
SCHEDULE 13A<br />
SUNDRY EXPENSES INCLUDED UNDER EXPENDITURE OF CONTRACTS<br />
Plant Repairs 18.03 19.17<br />
Rent, Rates & Taxes 29.88 16.13<br />
Staff Welfare 20.59 12.86<br />
Travelling Expenses 28.44 19.92<br />
Guarantee Bond Commission and Bank Charges 13.76 11.54<br />
Other Site Expenses * 91.72 65.13<br />
* None of the individual items included in Other Site Expenses exceeds one<br />
percent of the total turnover<br />
202.42 144.75<br />
SCHEDULE 14<br />
ESTABLISHMENT EXPENSES<br />
Electricity, Power & Fuel 2.45 1.77<br />
Rent 2.14 0.81<br />
Salaries including Provision for Commission and Bonus 68.45 46.23<br />
Contribution to Employees' Provident Fund, ESIS & Other Funds 5.01 5.41<br />
Contribution to Gratuity Fund 3.19 0.77<br />
Staff Welfare Expenses 2.16 1.73<br />
Insurance 8.51 6.91<br />
Rates and Taxes 0.73 1.00<br />
Communication Expenses 4.21 2.73<br />
Travelling, Leave Passage and Motor Car Expenses 12.45 7.25<br />
Professional Fees 14.85 5.96<br />
Repairs & Maintenance 8.61 3.61<br />
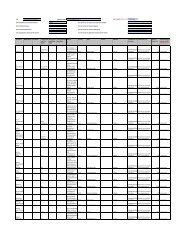
General Charges<br />
Auditors Remuneration:<br />
9.86 6.17<br />
– Audit Fees including Tax Audit Fees & Consolidation 0.66 0.51<br />
– Limited Review 0.09 0.07<br />
– Certification 0.01 0.07<br />
– Other Services 0.05 0.05<br />
– Reimbursement of Out of Pocket Expenses – 0.01<br />
0.81 0.71<br />
Branch Auditors' Fees 0.45 0.20<br />
Directors Sitting Fees 0.07 0.12<br />
Managerial Remuneration 9.51 6.32<br />
Write off against Leasehold Land 0.03 0.01<br />
Bad debt w/off 4.94 4.07<br />
Provision for doubtful debts (Net) 0.35 3.15<br />
Donation 0.13 0.04<br />
Loss on Sale of Assets – 0.32<br />
Foreign Exchange (Gain)/Loss 12.49 23.26<br />
Employee Compensation Expense – ESOS 0.20 0.55<br />
171.60 129.11<br />
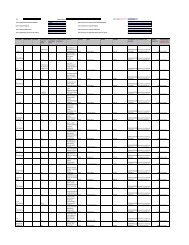
SCHEDULE 15<br />
FINANCIAL COST (NET)<br />
INTEREST EXPENSED<br />
Fixed Period Loans 166.38 102.21<br />
Other Loans 66.90 59.76<br />
Other Finance Charges 21.82 29.10<br />
Mark to Market on Fx Transactions (Refer Note B-8(a)) (2.36) (3.23)<br />
252.74 187.84<br />
Less: INTEREST EARNED<br />
Fixed Deposits with Banks<br />
(TDS ` 0.07 Crores, Previous Year ` 0.19 Crores)<br />
0.73 1.05<br />
Fixed Deposits with Joint Stock Companies (Refer Note B-17)<br />
(TDS ` 21.94 Crores, Previous Year ` 5.84 Crores)<br />
219.40 37.20<br />
Others (TDS ` 0.82 Crores, Previous Year ` 0.18 Crores) 20.30 9.93<br />
240.43 48.18<br />
12.31 139.66<br />
A NNUAL R EPORT I <strong>2010</strong>/11<br />
79