Annual Report 2010-2011 - Gammon India
Annual Report 2010-2011 - Gammon India
Annual Report 2010-2011 - Gammon India

You also want an ePaper? Increase the reach of your titles
YUMPU automatically turns print PDFs into web optimized ePapers that Google loves.
78<br />
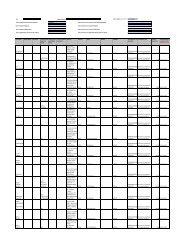
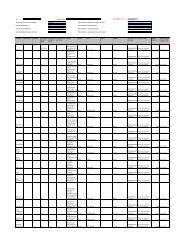
SCHEDULES FORMING PART OF PROFIT AND LOSS ACCOUNT<br />
<strong>2010</strong>-<strong>2011</strong> 2009-<strong>2010</strong><br />
` in Crores ` in Crores ` in Crores ` in Crores<br />
SCHEDULE 12<br />
SALES/TURNOVER<br />
Sales/Turnover 5,636.85 4,534.25<br />
Other Contractual Revenue 17.08 105.78<br />
Less: Sub Contract Cost (17.08) 105.78<br />
– –<br />
5,636.85 4,534.25<br />
SCHEDULE 12A<br />
OTHER OPERATING INCOME<br />
Fees & Operating Receipts 6.39 13.84<br />
Hire Charges on Assets – 3.15<br />
6.39 16.99<br />
SCHEDULE 12B<br />
OTHER INCOME<br />
Dividend Income 0.36 0.39<br />
Miscellaneous Income 4.69 1.89<br />
Profit on Sale of Assets 0.14 –<br />
Profit on Sale of Investments 25.86 38.82<br />
31.05 41.10<br />
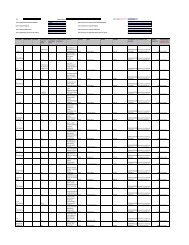
SCHEDULE 13<br />
EXPENDITURE ON CONTRACTS<br />
Opening Inventory:<br />
Stores and Construction Material at Sites 507.15 318.29<br />
Work-in-progress 744.19 603.91<br />
1,251.34 922.20<br />
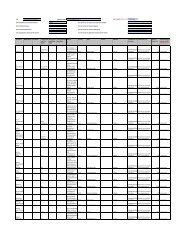
Add:<br />
Purchases of Materials 2,657.03 2,062.56<br />
Sub Contract Expenses 1,621.83 1,413.86<br />
Plant Hire Charges 71.40 43.45<br />
Consumption of Spares 41.84 39.60<br />
Outward Freight 71.97 63.71<br />
Sales Tax 70.91 62.66<br />
Service Tax 59.54 53.26<br />
Power and Fuel 183.84 113.52<br />
Fees and Consultations 54.62 33.66<br />
Insurance 38.69 22.51<br />
Site Personnel Expenses 294.43 216.44<br />
Sundry Expenses (As per schedule 13A annexed) 202.42 144.75<br />
Insurance Claim Received (62.92) (12.57)<br />
5,305.60 4,257.41<br />
Less:<br />
Closing Stock of Stores & Construction Materials including materials drawn<br />
from Contractees ` 2.73 Crores, Previous Year ` 0.24 Crores 602.68 507.15<br />
Closing Work-in-progress including estimated profits 835.26 744.19<br />
1,437.94 1,251.34<br />
Finished Good and WIP (Manufacturing)<br />
Opening Stock<br />
– WIP – Mfg. 39.31 43.58<br />
– Finished Goods<br />
Less: Closing stock<br />
18.74 46.48<br />
– WIP – Mfg. 11.76 39.31<br />
– Finished Goods 38.40 18.74<br />
7.89 32.02<br />
5,126.89 3,960.29<br />
A NNUAL R EPORT I <strong>2010</strong>/11