Annual Report 2010-2011 - Gammon India
Annual Report 2010-2011 - Gammon India
Annual Report 2010-2011 - Gammon India

You also want an ePaper? Increase the reach of your titles
YUMPU automatically turns print PDFs into web optimized ePapers that Google loves.
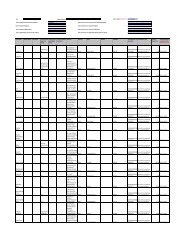
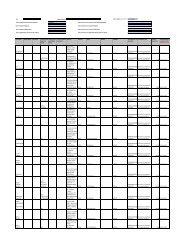
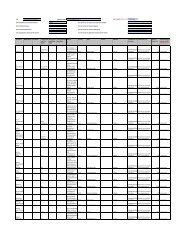
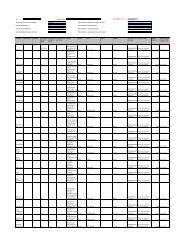
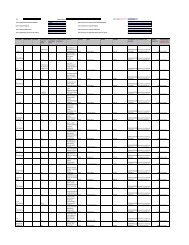
SCHEDULE 5<br />
FIXED ASSETS<br />
(` in Crores)<br />
GROSS BLOCK DEPRECIATION NET BLOCK<br />
AS AT<br />
31.03.<strong>2010</strong><br />
AS AT<br />
31.03.<strong>2011</strong><br />
FETR AS AT<br />
31.03.<strong>2011</strong><br />
DEDUCTIONS/<br />
ADJUSTMENTS<br />
FOR THE<br />
YEAR<br />
AS AT<br />
01.04.<strong>2010</strong><br />
AS AT<br />
31.03.<strong>2011</strong><br />
ADDITIONS FETR DEDUCTIONS/<br />
ADJUSTMENTS<br />
PARTICULARS AS AT<br />
01.04.<strong>2010</strong><br />
TANGIBLE ASSETS<br />
LEASEHOLD LAND 3.78 0.94 – – 4.71 0.07 – 0.03 – 0.04 4.67 3.70<br />
FREEHOLD PROPERTY 330.34 31.84 – – 362.18 27.27 5.15 – – 32.42 329.76 303.07<br />
PLANT AND MACHINERY 945.34 280.22 0.43 13.16 1,212.84 282.33 73.41 9.56 0.21 346.39 866.45 663.01<br />
MOTOR VEHICLES 139.44 11.18 0.00 8.37 142.25 64.00 8.34 7.28 0.00 65.06 77.19 75.43<br />
OFFICE EQUIPMENTS 27.34 18.36 – – 45.70 10.47 3.64 – – 14.11 31.59 16.87<br />
ELECTRICAL INSTALLATION 2.05 2.20 – – 4.25 0.28 0.28 – – 0.56 3.69 1.77<br />
WINDMILLS 26.95 – – – 26.95 8.43 2.79 – – 11.22 15.73 18.52<br />
TOTAL TANGIBLE ASSETS 1,475.24 344.74 0.43 21.53 1,798.88 392.85 93.61 16.87 0.21 469.81 1,329.08 1,082.38<br />
INTANGIBLE ASSETS<br />
TOWER DESIGN 3.47 – – – 3.47 1.56 1.20 – – 2.76 0.71 1.92<br />
ERP SOFTWARE 0.09 0.17 – – 0.25 0.04 0.03 – – 0.07 0.18 0.05<br />
TOTAL INTANGIBLE ASSETS 3.56 0.17 – – 3.73 1.60 1.23 – – 2.83 0.89 1.97<br />
TOTAL ASSETS 1,478.80 344.91 0.43 21.53 1,802.61 394.45 94.84 16.87 0.21 472.64 1,329.97 1,084.35<br />
PREVIOUS YEAR 1,275.01 214.17 2.83 7.55 1,478.80 326.98 74.08 5.50 1.12 394.45 1,084.35<br />
ADD: CAPITAL WORK IN PROGRESS INCLUDING CAPITAL ADVANCES 52.68 84.64<br />
1,382.65 1,168.99<br />
NOTES:<br />
1. Freehold Property includes cost of Freehold Land ` 123.50 Crores including the revaluation portion (Previous Year ` 123.50 Crores).<br />
2. Leasehold Land is at cost less amount written off.<br />
3. The Company has once again revalued on 31st March, 2007 all its Freehold Property, most of which were revalued earlier on 31st March, 1999 by Approved valuers. The consequent increase in the value of Fixed Assets pursuant to the second<br />
revaluation amounted to ` 186.89 Crores and has been credited to the Revaluation Reserve A/c.<br />
4. Depreciation for the Year Ended 31st March, <strong>2011</strong> amounts to ` 94.84 Crores (Previous Year Ended 31/03/<strong>2010</strong> ` 74.08 Crores) from which has been deducted a sum of ` 3.13 Crores (Previous Year ` 3.13 Crores) being the Depreciation in<br />
respect of Revaluation of Fixed Assets which has been drawn from the Revaluation Reserve A/c.<br />
5. Exchange Valuation difference in respect of Oman Fixed Assets ` 0.22 Crores (Previous Year ` 1.72 Crores) being transferred to Foreign Currency Translation reserve.<br />
6. Borrowing cost capitalised to Capital Work In Progress is ` 2.61 Crores (Previous Year ` 4.46 Crores).<br />
A NNUAL R EPORT I <strong>2010</strong>/11<br />
73