Annual Report 2010-2011 - Gammon India
Annual Report 2010-2011 - Gammon India
Annual Report 2010-2011 - Gammon India

You also want an ePaper? Increase the reach of your titles
YUMPU automatically turns print PDFs into web optimized ePapers that Google loves.
142<br />
c. In the absence of disclosures made in the accounts of one of the overseas joint venture Company regarding effect of acquisition and<br />
disposal of subsidiaries, no such disclosure is possible to be made in the Consolidated Account.<br />
d. Disclosures relating to the employee benefits for the overseas components have not been given in the absence of data in the required<br />
format.<br />
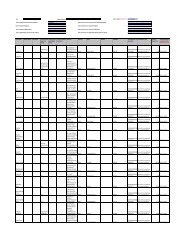
22. Disclosure under AS-29<br />
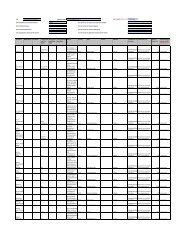
Account Head Opening<br />
Balance<br />
A NNUAL R EPORT I <strong>2010</strong>/11<br />
Provisions<br />
made during<br />
the year<br />
Paid/Utilized<br />
during<br />
the year<br />
(` In Crores)<br />
Closing<br />
Balance<br />
Provision for Risks and Contingencies 190.85 22.03 73.99 138.89<br />
(Previous period figures in brackets)<br />
(221.52) (14.48) (40.10) (190.85)<br />
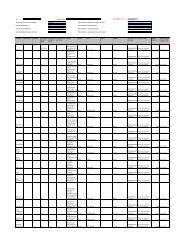
23. Earnings Per Share (EPS):<br />
Earnings Per Share (EPS) = Net Profit attributable to shareholders/Weighted Number of Shares Outstanding:<br />
Particulars As at<br />
31st As at<br />
March, <strong>2011</strong> 31st March, <strong>2010</strong><br />
Net Profit After Taxation (` in Crores) 110.03 45.70<br />
Preference Dividend (incl. Dividend Distribution Tax) — 7.08<br />
Net profit attributable to the Equity Share holders 110.03 38.62<br />
Weighted Number of Shares during the period – Basic 129,365,956 110,624,017<br />
Weighted Number of Shares during the period – Diluted 130,169,428 115,609,343<br />
Earnings Per Share – Basic (`) 8.51 3.49<br />
Earnings Per Share – Diluted (`) 8.45 3.34<br />
Reconciliation of weighted number of shares outstanding during the year:<br />
Particulars As at<br />
31st As at<br />
March, <strong>2011</strong> 31st March, <strong>2010</strong><br />
Nominal Value of Equity Shares (` per share)<br />
For Basic EPS:<br />
2 2<br />
Number of Equity Shares at the beginning 127,438,698 106,850,776<br />
Add : Issue of shares under ESOP 50,484 28,522<br />
Add : Issue of shares under QIP — 12,809,400<br />
Add : On conversion of warrants 82,50,000 7,750,000<br />
Number of Equity Shares at the end 135,739,182 127,438,698<br />
Weighted average of equity shares at the end<br />
For Dilutive EPS:<br />
129,365,956 110,624,017<br />
Weighted average no. of shares in calculating basic EPS 129,365,956 110,624,017<br />
Add : Shares kept in abeyance 725,800 725,800<br />
Add : On grant of stock option under ESOP 77,671 131,099<br />
Add : On account of convertible warrant — 4,128,427<br />
Weighted average no. of shares in calculating dilutive EPS 130,169,428 115,609,343<br />
For the purposes of computation of earning per shares the equity shares to be issued against the Equity Share Suspense account pursuant to the<br />
scheme of amalgamation, preference dividend on preference share suspense account and the options granted to the employees of the erstwhile<br />
ATSL have been considered in the weighted average shares during the period. Similarly 7,25,800 equity shares kept in abeyance from earlier<br />
equity offerings have also been considered for dilution. The weighted shares have been determined with reference to the respective dates of<br />
allotment of the shares issued under QIP, ESOPS and the Warrants respectively.<br />
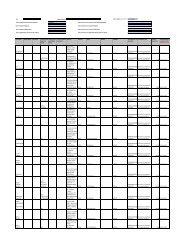
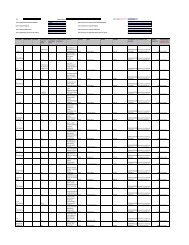
24. (a) Foreign currency exposure un-hedged as at 31 st March, <strong>2011</strong> is ` 678.28 Crores (Previous year ` 579.34 Crores) receivables and ` 201.03<br />
Crores (Previous year ` 189.68 Crores) payables. Currency wise unhedged amounts are as follows:<br />
Currency As at 31 st March, <strong>2011</strong> As at 31 st March, <strong>2010</strong><br />
Receivables Payables Receivables Payables<br />
USD 99,943,121 20,764,391 35,951,700 1,38,092,074<br />
EURO 23,802,114 5,284,398 12,935,099 13,630,489<br />
GBP — — — 181,342<br />
AED 55,560 — — —<br />
OMR 5,252,748 3,720,673 6,257,892 3,375,490<br />
DZD 263,342,163 200,720,302 217,629,782 160,514,270<br />
NGN — 6,213,707 — 6,213,707<br />
KSH 30,567,932 3,200,359 8,992,397 5,381,707<br />
BTN 27,323,645 181,743,200 — —