Annual Report 2010-2011 - Gammon India
Annual Report 2010-2011 - Gammon India Annual Report 2010-2011 - Gammon India
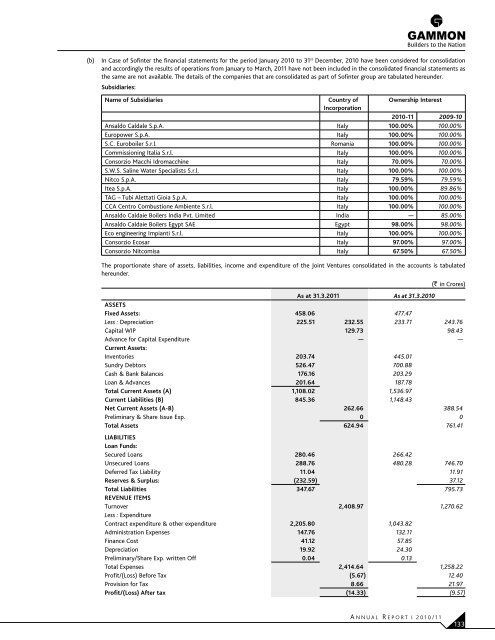
(b) In Case of Sofinter the financial statements for the period January 2010 to 31 st December, 2010 have been considered for consolidation and accordingly the results of operations from January to March, 2011 have not been included in the consolidated financial statements as the same are not available. The details of the companies that are consolidated as part of Sofinter group are tabulated hereunder. Subsidiaries: Name of Subsidiaries Country of Incorporation Ownership Interest 2010-11 2009-10 Ansaldo Caldale S.p.A. Italy 100.00% 100.00% europower S.p.A. Italy 100.00% 100.00% S.C. euroboiler S.r.l. Romania 100.00% 100.00% Commissioning Italia S.r.l. Italy 100.00% 100.00% Consorzio Macchi Idromacchine Italy 70.00% 70.00% S.W.S. Saline Water Specialists S.r.l. Italy 100.00% 100.00% Nitco S.p.A. Italy 79.59% 79.59% Itea S.p.A. Italy 100.00% 89.86% TAG – Tubi Alettati Gioia S.p.A. Italy 100.00% 100.00% CCA Centro Combustione Ambiente S.r.l. Italy 100.00% 100.00% Ansaldo Caldaie Boilers India Pvt. Limited India — 85.00% Ansaldo Caldaie Boilers Egypt SAE egypt 98.00% 98.00% eco engineering Impianti S.r.l. Italy 100.00% 100.00% Consorzio ecosar Italy 97.00% 97.00% Consorzio Nitcomisa Italy 67.50% 67.50% The proportionate share of assets, liabilities, income and expenditure of the Joint Ventures consolidated in the accounts is tabulated hereunder. A NNUAL R EPORT I 2010/11 (` in Crores) As at 31.3.2011 As at 31.3.2010 ASSETS Fixed Assets: 458.06 477.47 Less : Depreciation 225.51 232.55 233.71 243.76 Capital WIP 129.73 98.43 Advance for Capital Expenditure Current Assets: — — Inventories 203.74 445.01 Sundry Debtors 526.47 700.88 Cash & Bank Balances 176.16 203.29 Loan & Advances 201.64 187.78 Total Current Assets (A) 1,108.02 1,536.97 Current Liabilities (B) 845.36 1,148.43 Net Current Assets (A-B) 262.66 388.54 Preliminary & Share Issue Exp. 0 0 Total Assets 624.94 761.41 LIABILITIES Loan Funds: Secured Loans 280.46 266.42 Unsecured Loans 288.76 480.28 746.70 Deferred Tax Liability 11.04 11.91 Reserves & Surplus: (232.59) 37.12 Total Liabilities 347.67 795.73 REVENUE ITEMS Turnover 2,408.97 1,270.62 Less : Expenditure Contract expenditure & other expenditure 2,205.80 1,043.82 Administration Expenses 147.76 132.11 Finance Cost 41.12 57.85 Depreciation 19.92 24.30 Preliminary/Share Exp. written Off 0.04 0.13 Total Expenses 2,414.64 1,258.22 Profit/(Loss) Before Tax (5.67) 12.40 Provision for Tax 8.66 21.97 Profit/(Loss) After tax (14.33) (9.57) 133
134 (c) The above figures pertaining to the Joint Venture Companies are based on the audited accounts for the year ended 31 st March, 2011 except for BWIOTPL, HBPL, SEZAL GCT, GOM and JG which are based on the un-audited management accounts. (d) Sofinter – The entry into force of the agreement executed on 1 st December, 2009 between credit institutions and a number of companies part of the Sofinter Group for the restructuring of debts and signature credit lines (the “Agreement”) has involved: • acomplex series of compliance requirements and contractual conditions, including a commitment to implement a number of actions aimed at strengthening the equity of the Sofinter Group; • the execution of operations to strengthen the capital through capital increases, including by third parties, and through the exploitation of the equity investments in the subsidiaries Ansaldo Caldaie and Itea; • the compliance with specific financial covenants throughout the entire term of the Agreement. Aspart of the agreement with credit institutions , The sofinter group assessed the offers received for the acquisition of a shareholding in the subsidiary Ansaldo Caldaie and selected an offer from a New Investor by which the New Investor is required to make investments which in addition to strengthening the groups equity structure, should bring a concrete contribution to developing activities on international markets, more specifically the Indian market. The agreement reached, which was authorised on 27 th May, 2011 by the Italian Antitrust Authority, should be executed shortly. The requests contained in the offer made by the new investor and the partial failure to comply with certain provisions contained in the Agreement made it necessary to re-start negotiations with the banks in January, 2011. Said negotiations are mainly about the extension of the term of the Agreement and the confirmation of the credit lines, including the increase thereof, as specified in the Report on Operations under “Corporate Transactions” and the re-negotiation of new financial covenants. The cited increase is necessary in order to implement the new 2011/2014 strategic plan of the Sofinter Group. Inconnection with the re-negotiation of the new strategic plan, an expert appointed pursuant to art. 67 of Italian Law will assess the plan’s reasonableness and suitability to allow repayment of debts and to restore the Group’s financial position. Theeconomic forecast contained in the aforesaid strategic plan involve a consolidation of Ansaldo Caldaie’s position in its historic markets as well as a development of new markets, also thanks to a number of agreements between the Sofinter Group and its new investors. The positive market trends as regards demand for the products offered by the Sofinter Group, which have been recently observed and are forecast for the near future by major sector analyst, lead the Directors to believe that the targets set by the new strategic plan may reasonably be met, although within the limits which are normally intrinsic to the degree of probability that future events take place in line with the forecasts made. Achievement of the plan’s targets therefore ultimately depends on the support of the banks, which have not yet signed the new agreement, and for this reason an uncertainty still exists that may cast significant doubt on the Group’s ability to continue operating as a going concern. However, in the light of the development of the negotiations with the credit institutions currently being finalised, an agreement having been reached on the key terms of the new agreement, and considering that the matters still pending will not prevent a successful completion of the negotiations, also in light of the favourable attitude of credit institutions, the Directors believe it is reasonable to expect that the new agreement, while not yet executed, will be executed in the month of July. The here above mentioned uncertainty is deriving, at the date of approval of this financial statement, from the pending undersigning of the bank Agreement, and will be effectively overcome upon the signature of the Agreement expected to happen during this month of July, 2011. Therefore, after carrying out the necessary checks and assessing the degree of occurrence of the uncertain events referred to above, as well as obtaining appropriate comfort from credit institutions about the likely outcome of the negotiations on the new agreement, in drawing up these Financial Statements, the Directors have deemed it appropriate to adopt the going concern basis of accounting. 3. Associates The following Associates have been accounted on one line basis applying the Equity Method in accordance with Accounting Standard (AS) – 23 “Accounting for Investment in Associates in Consolidated Financial Statements”. (` in Crores) Name of Company % Share Held A NNUAL R EPORT I 2010/11 Original Cost of Investments Goodwill/ (Capital Reserve) Adjusted/ Accumulated Profit/(Loss) upto previous period Profit for the Current Period Other Adjustments Carrying Amount of Investment Itro PTE Limited * 24.50% 7.26 0.00 -8.81 -6.66 8.21 0.00 Ecopower S.r.l.* 10.00% 0.16 0.00 0.57 0.05 0.00 0.78 SWS G&B * 25.00% 0.03 0.00 0.00 0.00 0.00 0.03 Europower Middle East * 24.50% 0.15 0.00 0.00 0.00 0.00 0.15 Cons Ansaldo energie riun.* 12.50% 0.08 0.00 0.00 0.00 0.00 0.08 Multiservice * 17.50% 0.11 0.00 0.00 0.00 0.00 0.11 Oristano Ambiente * Eversun Sparkle Maritime Services 20.00% 0.13 0.00 0.00 0.00 0.00 0.13 Pvt. Limited (‘ESMSPL’) ** 25.12% 1.70 0.44 -1.17 0.55 0.00 1.08 Modern Toll Roads Limited ** 36.92% 0.02 0.00 0.00 0.00 0.00 0.02 Fin est S.p.A. 50.00% 19.52 7.57 0.27 0.38 0.00 20.17 TOTAL 29.16 8.01 -9.14 -5.68 8.21 22.55 * Marked companies are associates of Joint Venture, Sofinter Group and hence proportionate share of its investments and share of profit/ (loss) is taken. ** Marked companies are associates of subsidiary GIPL.
- Page 86 and 87: 9.95% - Redeemable Non-Convertible
- Page 88 and 89: (b) Sundry Debtors include the foll
- Page 90 and 91: 13. In respect of the road projects
- Page 92 and 93: 20. Additional information pursuant
- Page 94 and 95: 23. The Company is engaged mainly i
- Page 96 and 97: 33. The balance with The Freyssinet
- Page 98 and 99: (d) Transactions of Oman Branch and
- Page 100 and 101: SCHEDULE - 1 Related Party Disclosu
- Page 102 and 103: Nature of Transactions/Relationship
- Page 104 and 105: Nature of Transactions/Relationship
- Page 106 and 107: BALANCE SHEET ABSTRACT OF COMPANY
- Page 108 and 109: Metropolitan Infrahousing Private L
- Page 110 and 111: Patliputra Highway Limited * Patna
- Page 112 and 113: Gammon Holdings B.V. Gammon Interna
- Page 114 and 115: Sr. No. Particulars No. of shares/
- Page 116 and 117: existing at the date of preparation
- Page 118 and 119: CONSOLIDATED PROFIT AND LOSS ACCOUN
- Page 120 and 121: C. CASH FLOW FROM FINANCING ACTIVIT
- Page 122 and 123: SCHEDULE 4 FIXED ASSETS (` in Crore
- Page 124 and 125: As at 31 st March, 2011 As at 31 st
- Page 126 and 127: April 10 - March 11 April 09 - Marc
- Page 128 and 129: The cash compensation on account of
- Page 130 and 131: 10. Investments Investments are cla
- Page 132 and 133: When the hedge concerns the fair va
- Page 134 and 135: Name of Subsidiaries Country of Inc
- Page 138 and 139: The particulars of Investment in As
- Page 140 and 141: K. SOFINTER: The loan envisages the
- Page 142 and 143: 12. Retention Bonus for employees:
- Page 144 and 145: (b) In respect of the road projects
- Page 146 and 147: (b) In respect of currency swap der
- Page 148 and 149: VSPL, a subsidiary of the Company,
- Page 150 and 151: Annexure I Related party Disclosure
- Page 152: vakils
(b) In Case of Sofinter the financial statements for the period January <strong>2010</strong> to 31 st December, <strong>2010</strong> have been considered for consolidation<br />
and accordingly the results of operations from January to March, <strong>2011</strong> have not been included in the consolidated financial statements as<br />
the same are not available. The details of the companies that are consolidated as part of Sofinter group are tabulated hereunder.<br />
Subsidiaries:<br />
Name of Subsidiaries Country of<br />
Incorporation<br />
Ownership Interest<br />
<strong>2010</strong>-11 2009-10<br />
Ansaldo Caldale S.p.A. Italy 100.00% 100.00%<br />
europower S.p.A. Italy 100.00% 100.00%<br />
S.C. euroboiler S.r.l. Romania 100.00% 100.00%<br />
Commissioning Italia S.r.l. Italy 100.00% 100.00%<br />
Consorzio Macchi Idromacchine Italy 70.00% 70.00%<br />
S.W.S. Saline Water Specialists S.r.l. Italy 100.00% 100.00%<br />
Nitco S.p.A. Italy 79.59% 79.59%<br />
Itea S.p.A. Italy 100.00% 89.86%<br />
TAG – Tubi Alettati Gioia S.p.A. Italy 100.00% 100.00%<br />
CCA Centro Combustione Ambiente S.r.l. Italy 100.00% 100.00%<br />
Ansaldo Caldaie Boilers <strong>India</strong> Pvt. Limited <strong>India</strong> — 85.00%<br />
Ansaldo Caldaie Boilers Egypt SAE egypt 98.00% 98.00%<br />
eco engineering Impianti S.r.l. Italy 100.00% 100.00%<br />
Consorzio ecosar Italy 97.00% 97.00%<br />
Consorzio Nitcomisa Italy 67.50% 67.50%<br />
The proportionate share of assets, liabilities, income and expenditure of the Joint Ventures consolidated in the accounts is tabulated<br />
hereunder.<br />
A NNUAL R EPORT I <strong>2010</strong>/11<br />
(` in Crores)<br />
As at 31.3.<strong>2011</strong> As at 31.3.<strong>2010</strong><br />
ASSETS<br />
Fixed Assets: 458.06 477.47<br />
Less : Depreciation 225.51 232.55 233.71 243.76<br />
Capital WIP 129.73 98.43<br />
Advance for Capital Expenditure<br />
Current Assets:<br />
— —<br />
Inventories 203.74 445.01<br />
Sundry Debtors 526.47 700.88<br />
Cash & Bank Balances 176.16 203.29<br />
Loan & Advances 201.64 187.78<br />
Total Current Assets (A) 1,108.02 1,536.97<br />
Current Liabilities (B) 845.36 1,148.43<br />
Net Current Assets (A-B) 262.66 388.54<br />
Preliminary & Share Issue Exp. 0 0<br />
Total Assets 624.94 761.41<br />
LIABILITIES<br />
Loan Funds:<br />
Secured Loans 280.46 266.42<br />
Unsecured Loans 288.76 480.28 746.70<br />
Deferred Tax Liability 11.04 11.91<br />
Reserves & Surplus: (232.59) 37.12<br />
Total Liabilities 347.67 795.73<br />
REVENUE ITEMS<br />
Turnover 2,408.97 1,270.62<br />
Less : Expenditure<br />
Contract expenditure & other expenditure 2,205.80 1,043.82<br />
Administration Expenses 147.76 132.11<br />
Finance Cost 41.12 57.85<br />
Depreciation 19.92 24.30<br />
Preliminary/Share Exp. written Off 0.04 0.13<br />
Total Expenses 2,414.64 1,258.22<br />
Profit/(Loss) Before Tax (5.67) 12.40<br />
Provision for Tax 8.66 21.97<br />
Profit/(Loss) After tax (14.33) (9.57)<br />
133


