Annual Report 2010-2011 - Gammon India
Annual Report 2010-2011 - Gammon India
Annual Report 2010-2011 - Gammon India

You also want an ePaper? Increase the reach of your titles
YUMPU automatically turns print PDFs into web optimized ePapers that Google loves.
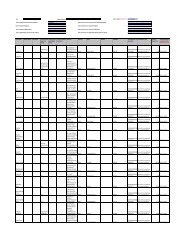
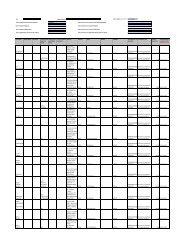
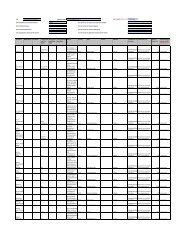
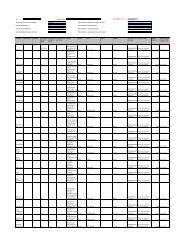
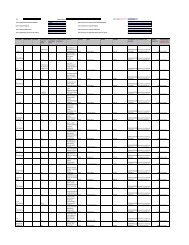
SCHEDULE 4<br />
FIXED ASSETS<br />
(` in Crores)<br />
GROSS BLOCK DEPRECIATION NET BLOCK<br />
Opening addi- Deduc- Foreign As at as at Opening For the Deduc- Foreign Impair- As at As at as at<br />
on a/C of tions tions / Transla- 31.03.<strong>2011</strong> 01.04.<strong>2010</strong> on a/C of Year tions/ Transla- ment 31.03.<strong>2011</strong> 31.03.<strong>2011</strong> 31.03.<strong>2010</strong><br />
amalgama-<br />
adjust- tion<br />
amalgama-<br />
adjust- tion<br />
tion/Further<br />
ments adjust-<br />
tion/Further<br />
ments adjustacquisition<br />
ments<br />
acquisition<br />
ments<br />
Tangible Assets<br />
Leasehold Land 190.49 – 4.35 – (18.98) 175.86 22.90 – 4.24 0.03 (2.53) – 24.65 151.21 167.59<br />
Particulars as at<br />
01.04.<strong>2010</strong><br />
Freehold Property 944.33 – 86.98 (0.13) (65.65) 965.52 117.05 – 18.67 0.01 (9.82) – 125.91 839.62 827.28<br />
Plant and Machinery 1,831.09 0.01 341.95 (17.62) (82.57) 2,072.86 636.75 0.00 118.99 (12.08) (35.35) 0.01 708.33 1,364.53 1,194.34<br />
Office Equipments 84.40 4.36 32.31 (3.05) (2.79) 115.22 51.29 1.73 8.35 (1.74) (2.05) 0.01 57.59 57.64 33.11<br />
Motor vehicles 162.41 0.33 15.32 (8.86) (2.06) 167.13 76.50 – 11.09 (7.89) (0.41) – 79.29 87.84 85.91<br />
Road & Project Bridges 575.92 – 0.52 – – 576.44 181.76 – 50.80 – – – 232.56 343.87 394.16<br />
Project Berth 203.82 – – (0.00) – 203.82 35.32 – 7.55 0.27 – – 43.15 160.68 168.50<br />
Windmills 26.95 – – – – 26.95 8.43 – 2.79 – – – 11.22 15.73 18.52<br />
4,019.41 4.69 481.43 (29.67) (172.06) 4,303.80 1,130.00 1.73 222.48 (21.38) (50.16) 0.02 1,282.68 3,021.12 2,889.41<br />
Intangible Asset<br />
Toll Concession Rights – – 575.82 – – 575.82 – – 11.71 – – – 11.71 564.11 –<br />
Others 130.81 – 3.54 (0.00) (12.42) 121.93 88.93 – 10.20 (0.07) (9.57) – 89.49 32.44 41.87<br />
130.81 – 579.36 (0.00) (12.42) 697.74 88.93 – 21.90 (0.07) (9.57) – 101.20 596.55 41.87<br />
Total 4,150.22 4.69 1,060.78 (29.67) (184.48) 5,001.54 1,218.93 1.73 244.39 (21.45) (59.74) 0.02 1,383.88 3,617.67 2,931.28<br />
Previous Year 3,682.74 152.67 407.81 (55.78) (37.22) 4,150.22 1,043.05 22.15 201.27 (33.48) (14.06) – 1,218.93<br />
Add: Capital WIP 1,847.73 1692.26<br />
5,465.39 4,623.54<br />
NOTES:<br />
1. Leasehold Land is at cost less amount written off.<br />
2. The Company has once again revalued on 31st March, 2007 all its Freehold Property, most of which were revalued earlier on 31st March, 1999 by approved valuers. The consequent increase in the value of Fixed assets pursuant to the second<br />
revaluation amounted to ` 1,868,928,586/- and has been credited to the Revaluation Reserve a/c.<br />
3. Depreciation for the Year Ended 31st March, <strong>2011</strong> amounts to ` 244.39 Crores (Previous Year Ended 31.03.<strong>2010</strong> ` 201.27 Crores) from which has been deducted a sum of ` 3.13 Crores (Previous Year ended 31.03.<strong>2010</strong> ` 3.13 Crores) being<br />
the Depreciation in respect of Revaluation of Fixed assets which has been drawn from the Revaluation Reserve a/c. Depreciation for the Year ended 31st March, <strong>2011</strong> amounts to ` 0.02 Crores has been transferred to Capital WIP and<br />
` 0.01 Crores is transferred to pre-operative expenses.<br />
A NNUAL R EPORT I <strong>2010</strong>/11<br />
119