Annual Report 2010-2011 - Gammon India
Annual Report 2010-2011 - Gammon India
Annual Report 2010-2011 - Gammon India

You also want an ePaper? Increase the reach of your titles
YUMPU automatically turns print PDFs into web optimized ePapers that Google loves.
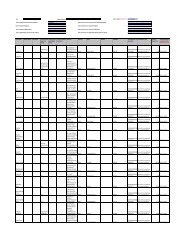
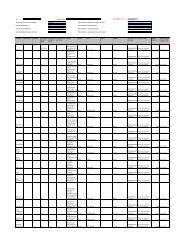
116<br />
A NNUAL R EPORT I <strong>2010</strong>/11<br />
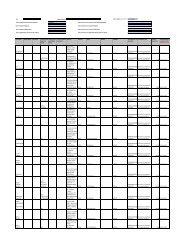
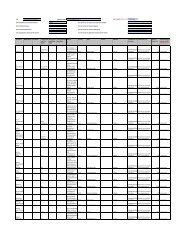
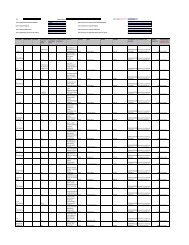
CONSOLIDATED CASH FLOW STATEMENT<br />
FOR THE YEAR ENDED 31 ST MARCH, <strong>2011</strong><br />
12 Months<br />
April <strong>2010</strong> – March <strong>2011</strong><br />
` in Crores<br />
12 Months<br />
April 2009 – March <strong>2010</strong><br />
` in Crores<br />
A. CASH FLOW FROM OPERATING ACTIVITIES:<br />
Net Profit before Tax and extraordinary items<br />
adjustments for :<br />
268.90 167.60<br />
Depreciation 241.23 198.11<br />
Profit/Loss on Sale of assets 0.11 (0.09)<br />
Profit/Loss on Sale of Investments (27.07) (42.47)<br />
Employees Compensation Expenses 1.32 3.01<br />
Dividend Income (4.11) (5.88)<br />
Interest (Net) 47.09 386.89<br />
Foreign Exchange loss /gain (0.69) 0.65<br />
Preliminary Expenses Written off 0.97 1.18<br />
Foreign Currency Monetary Translation Difference 28.41 37.56<br />
Prior Period adjustments (4.45) (1.58)<br />
Share of Loss in associates 7.70 6.56<br />
amount Written off 21.28 16.24<br />
311.79 600.18<br />
Operating Profit before Working Capital Changes<br />
adjustments for :<br />
580.69 767.78<br />
Effect of Foreign Currency Translation of Cash Flows (46.85) 101.81<br />
Trade and Other Receivables (75.00) (310.88)<br />
Inventories 131.43 (334.74)<br />
Trade Payables & Working Capital Finance (214.18) 42.87<br />
Loan and advances (138.86) 65.64<br />
Property Development (194.03) (28.56)<br />
(537.49) (463.86)<br />
Cash Generated from the Operations (43.20) 303.92<br />
Direct Taxes paid (121.40) (96.26)<br />
NET CASH FROM OPERATING ACTIVITIES (78.20) 207.66<br />
B. CASH FLOW FROM INVESTMENT ACTIVITIES<br />
Purchase of Fixed assets (including CWIP) (972.03) (978.87)<br />
Sale of Fixed assets 5.07 1.34<br />
Cash & Bank balance taken over on acquisition 50.21 –<br />
Share application Money Pending allotment 6.30 (8.71)<br />
Loans given to Subsidiaries, associates and others (26.02) (25.25)<br />
Loans Refund from Subsidiaries, associates and others 76.08 36.53<br />
Purchase of Investments in – associates (4.71) (5.61)<br />
– Others (895.28) (968.66)<br />
Sale of Investments in – Others 747.91 1,022.29<br />
acquisition of Stake in Subsidiaries (77.43) (35.98)<br />
Interest received 26.75 18.81<br />
Dividend received 4.11 0.48<br />
NET CASH FROM INVESTMENT ACTIVITIES (1,059.04) (943.65)