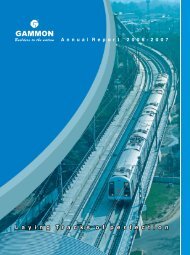
Annual Report 2010-2011 - Gammon India
Annual Report 2010-2011 - Gammon India
Annual Report 2010-2011 - Gammon India

You also want an ePaper? Increase the reach of your titles
YUMPU automatically turns print PDFs into web optimized ePapers that Google loves.
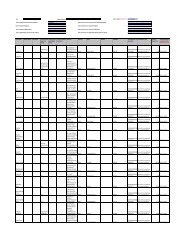
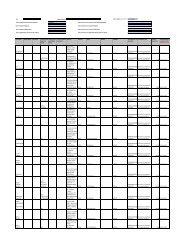
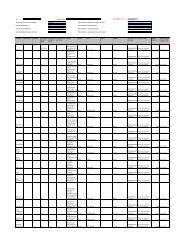
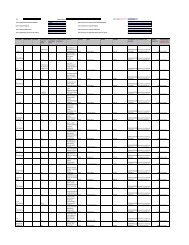
DETAILS OF SUBSIDIARIES OF GAMMON INDIA LTD.<br />
(Pursuant to the Central Government Order under Section 212(8) of the Companies Act, 1956<br />
Sr. No. Particulars <strong>Gammon</strong> Italy<br />
Srl<br />
108<br />
A NNUAL R EPORT I <strong>2010</strong>/11<br />
SAE Powerlines<br />
Srl<br />
P. Van Eerd<br />
Beheersmaatschappaji<br />
B.V. -Netherland<br />
ATSL Holdings BV,<br />
Netherland<br />
Associated<br />
Transrail<br />
Structures Ltd.,<br />
Nigeria<br />
Campo<br />
Puma<br />
Oriente S.A.<br />
Financial year ending on 31st December, <strong>2010</strong> 31st December, <strong>2010</strong> 31st March, <strong>2011</strong> 31st March, <strong>2011</strong> 31st March, <strong>2011</strong> 31st December, <strong>2010</strong><br />
Currency EURO EURO EURO EURO Naira USD<br />
Exchange rate on the last day of financial year 59.81 59.81 63.24 63.24 0.29 44.81<br />
1. Share Capital (including share application money<br />
pending allotment) 598,100 461,638,581 1,004,378 1,152,855 2,900,000 537,720<br />
2. Reserves (714,909) (437,824,761) (176,728,830) (85,833,781) (12,678,541) 2,975,038<br />
3. Liabilities 421,182 2,190,124,547 671,856,429 760,995,944 10,381,157 2,039,414,127<br />
4. Total Liabilities 304,373 2,213,938,367 496,131,977 676,315,018 602,616 2,042,926,885<br />
5. Total Assets 304,373 2,213,938,367 496,131,977 676,315,018 602,616 2,042,926,885<br />
6. Investments (excluding subsidiary companies) — — 474,629,645 — — 1,744,688,956<br />
7. Turnover — 1,887,594,096 — — — —<br />
8. Profit before taxation (212,013) (170,844,587) (30,364,582) (34,085,444) (6,083,808) —<br />
9. Provision for taxation — 100,058,772 — — — —<br />
10. Profit after taxation (212,013) (270,903,360) (30,364,582) (34,085,444) (6,083,808) —<br />
11. Dividend – Equity — — — — — —<br />
12. Dividend – Preference — — — — — —<br />
13. Proposed Dividend – Equity — — — — — —<br />
14. Proposed Dividend – Preference — — — — — —<br />
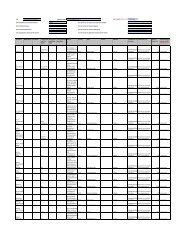
Details of Investment<br />
(I) Joint Ventures<br />
Punjab Biomass Power Limited<br />
Eversun Sparkle Maritimes Services<br />
— — — — — —<br />
Pvt. Limited — — — — — —<br />
SEZ Adityapur Limited — — — — — —<br />
Indira Container Terminal<br />
Pvt. Limited — — — — — —<br />
(II) Other<br />
Modern Toll Roads — — — — — —<br />
ATSL Infrastructure Projects Limited — — — — — —<br />
Haryana Biomass Power Limited — — — — — —<br />
Blue Water Iron Ore Terminal Pvt. Limited — — — — — —<br />
Sadelmi Spa — — 474,629,645 — — —<br />
Non Traded, Redeemable, Quoted NCDs' — — — — — —<br />
Investment in Mutual Fund — — — — — —<br />
Partnership firm (Aparna Infra Energy) — — — — — —<br />
Other — — — — — 1,744,688,956<br />
*** The Companies became subsidiary during the year <strong>2010</strong>-11.