Annual Report 2010-2011 - Gammon India
Annual Report 2010-2011 - Gammon India
Annual Report 2010-2011 - Gammon India

Create successful ePaper yourself
Turn your PDF publications into a flip-book with our unique Google optimized e-Paper software.
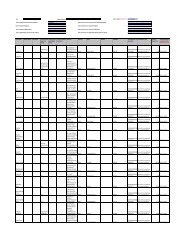
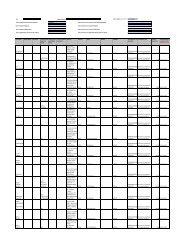
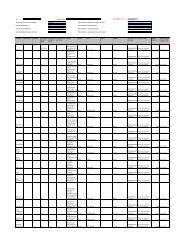
DETAILS OF SUBSIDIARIES OF GAMMON INDIA LTD.<br />
(Pursuant to the Central Government Order under Section 212(8) of the Companies Act, 1956<br />
Sr. No. Particulars ATSL<br />
Infrastructure<br />
Projects<br />
Limited<br />
104<br />
A NNUAL R EPORT I <strong>2010</strong>/11<br />
Deepmala<br />
Infrastructure<br />
Private<br />
Limited<br />
GACTEL<br />
Turnkey<br />
Projects<br />
Limited<br />
<strong>Gammon</strong> &<br />
Billimoria<br />
Limited<br />
<strong>Gammon</strong><br />
Infrastructure<br />
Projects<br />
Limited<br />
<strong>Gammon</strong><br />
Power<br />
Limited<br />
<strong>Gammon</strong><br />
Realty<br />
Limited<br />
<strong>Gammon</strong><br />
Retail<br />
Infrastructure<br />
Private<br />
Limited<br />
Financial year ending on 31-03-<strong>2011</strong> 31-03-<strong>2011</strong> 31-03-<strong>2011</strong> 31-03-<strong>2011</strong> 31-03-<strong>2011</strong> 31-03-<strong>2011</strong> 31-03-<strong>2011</strong> 31-03-<strong>2011</strong> 31-03-<strong>2011</strong><br />
1. Share Capital (including share application<br />
money pending allotment)<br />
Transrail<br />
Lighting<br />
Limited<br />
500,000 100,000 50,500,000 1,000,000 1,474,790,758 500,000 200,500,000 100,000 51,500,000<br />
2. Reserves (124,444) — (127,525,619) 10,825,512 4,354,193,135 (1,348,608) (390,150,750) (59,358) (55,331,249)<br />
3. Liabilities 200,043,926 4,545,347,021 2,192,074,901 592,072,480 2,235,019,050 1,431,836 1,084,580,571 64,595 835,955,949<br />
4. Total Liabilities 200,419,482 4,545,447,021 2,115,049,282 603,897,992 8,064,002,943 583,228 894,929,821 105,237 832,124,700<br />
5. Total Assets 200,419,482 4,545,447,021 2,115,049,282 603,897,992 8,064,002,943 583,228 894,929,821 105,237 832,124,700<br />
6. Investments (excluding subsidiary<br />
companies) — — 18,385,833 — 386,229,500 — — — —<br />
7. Turnover — — 1,117,488,571 — 860,040,941 — — — 230,127,026<br />
8. Profit before taxation (42,455) — 1,201,242 3,865,955 459,257,644 (25,797) (70,181,958) (24,716) (78,289,295)<br />
9. Provision for taxation — — 16,135,526 1,194,597 101,955,259 — — — (24,639,872)<br />
10. Profit after taxation (42,455) — (14,934,284) 2,671,358 357,302,385 (25,797) (70,181,958) (24,716) (53,649,423)<br />
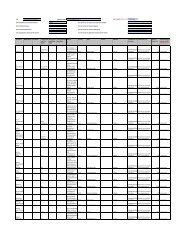
11. Dividend – Equity — — — — — — — — —<br />
12. Dividend – Preference — — — — — — — — —<br />
13. Proposed Dividend – Equity — — — — — — — — —<br />
14. Proposed Dividend – Preference — — — — — — — — —<br />
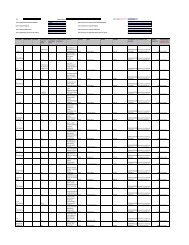
Details of Investment<br />
(I) Joint Ventures<br />
Punjab Biomass Power Limited<br />
Eversun Sparkle Maritimes Services<br />
— — — — 105,000,000 — — — —<br />
Pvt. Limited — — — — 21,439,500 — — — —<br />
SEZ Adityapur Limited — — — — 190,000 — — — —<br />
Indira Container Terminal<br />
Pvt. Limited — — — — 243,758,400 — — — —<br />
Modern Toll Roads — — — — 244,700 — — — —<br />
Haryana Biomass Power Limited — — — — 250,000 — — — —<br />
Blue Water Iron Ore Terminal<br />
Pvt. Limited — — — — 15,346,900 — — — —<br />
(II) Other<br />
Non Traded, Reddemable,<br />
Quoted NCDs' — — — — — — — — —<br />
Investment in Mutual Fund — — 18,385,833 — — — — — —<br />
Partnership firm<br />
(Aparna Infra Energy)<br />
— — — — — — — — —<br />
Other — — — — — — — — —