FINANCIAL STATEMENTS 2010 - Finnlines
FINANCIAL STATEMENTS 2010 - Finnlines
FINANCIAL STATEMENTS 2010 - Finnlines

You also want an ePaper? Increase the reach of your titles
YUMPU automatically turns print PDFs into web optimized ePapers that Google loves.
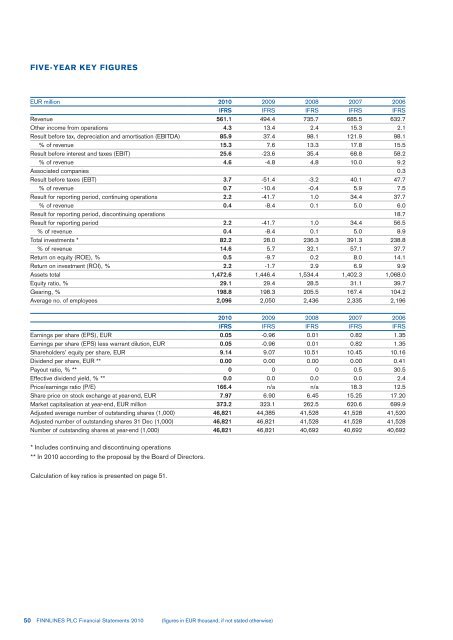
FIVE-YEAR KEY FIGURES<br />
EUR million <strong>2010</strong> 2009 2008 2007 2006<br />
IFRS IFRS IFRS IFRS IFRS<br />
Revenue 561.1 494.4 735.7 685.5 632.7<br />
Other income from operations 4.3 13.4 2.4 15.3 2.1<br />
Result before tax, depreciation and amortisation (EBITDA) 85.9 37.4 98.1 121.9 98.1<br />
% of revenue 15.3 7.6 13.3 17.8 15.5<br />
Result before interest and taxes (EBIT) 25.6 -23.6 35.4 68.8 58.2<br />
% of revenue 4.6 -4.8 4.8 10.0 9.2<br />
Associated companies 0.3<br />
Result before taxes (EBT) 3.7 -51.4 -3.2 40.1 47.7<br />
% of revenue 0.7 -10.4 -0.4 5.9 7.5<br />
Result for reporting period, continuing operations 2.2 -41.7 1.0 34.4 37.7<br />
% of revenue 0.4 -8.4 0.1 5.0 6.0<br />
Result for reporting period, discontinuing operations 18.7<br />
Result for reporting period 2.2 -41.7 1.0 34.4 56.5<br />
% of revenue 0.4 -8.4 0.1 5.0 8.9<br />
Total investments * 82.2 28.0 236.3 391.3 238.8<br />
% of revenue 14.6 5.7 32.1 57.1 37.7<br />
Return on equity (ROE), % 0.5 -9.7 0.2 8.0 14.1<br />
Return on investment (ROI), % 2.2 -1.7 2.9 6.9 9.9<br />
Assets total 1,472.6 1,446.4 1,534.4 1,402.3 1,068.0<br />
Equity ratio, % 29.1 29.4 28.5 31.1 39.7<br />
Gearing, % 198.8 198.3 205.5 167.4 104.2<br />
Average no. of employees 2,096 2,050 2,436 2,335 2,196<br />
<strong>2010</strong> 2009 2008 2007 2006<br />
IFRS IFRS IFRS IFRS IFRS<br />
Earnings per share (EPS), EUR 0.05 -0.96 0.01 0.82 1.35<br />
Earnings per share (EPS) less warrant dilution, EUR 0.05 -0.96 0.01 0.82 1.35<br />
Shareholders’ equity per share, EUR 9.14 9.07 10.51 10.45 10.16<br />
Dividend per share, EUR ** 0.00 0.00 0.00 0.00 0.41<br />
Payout ratio, % ** 0 0 0 0.5 30.5<br />
Effective dividend yield, % ** 0.0 0.0 0.0 0.0 2.4<br />
Price/earnings ratio (P/E) 166.4 n/a n/a 18.3 12.5<br />
Share price on stock exchange at year-end, EUR 7.97 6.90 6.45 15.25 17.20<br />
Market capitalisation at year-end, EUR million 373.2 323.1 262.5 620.6 699.9<br />
Adjusted average number of outstanding shares (1,000) 46,821 44,385 41,528 41,528 41,520<br />
Adjusted number of outstanding shares 31 Dec (1,000) 46,821 46,821 41,528 41,528 41,528<br />
Number of outstanding shares at year-end (1,000) 46,821 46,821 40,692 40,692 40,692<br />
* Includes continuing and discontinuing operations<br />
** In <strong>2010</strong> according to the proposal by the Board of Directors.<br />
Calculation of key ratios is presented on page 51.<br />
50 FINNLINES PLC Financial Statements <strong>2010</strong> (figures in EUR thousand, if not stated otherwise)