FINANCIAL STATEMENTS 2010 - Finnlines
FINANCIAL STATEMENTS 2010 - Finnlines FINANCIAL STATEMENTS 2010 - Finnlines
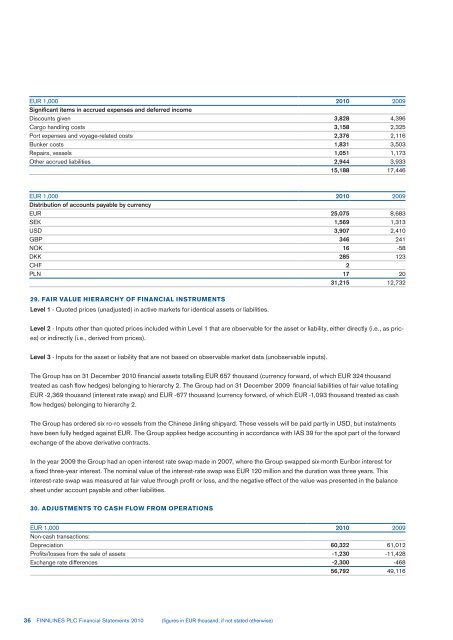
EUR 1,000 2010 2009 Significant items in accrued expenses and deferred income Discounts given 3,828 4,396 Cargo handling costs 3,158 2,325 Port expenses and voyage-related costs 2,376 2,116 Bunker costs 1,831 3,503 Repairs, vessels 1,051 1,173 Other accrued liabilities 2,944 3,933 15,188 17,446 EUR 1,000 2010 2009 Distribution of accounts payable by currency EUR 25,075 8,683 SEK 1,569 1,313 USD 3,907 2,410 GBP 346 241 NOK 16 -58 DKK 285 123 CHF 2 PLN 17 20 31,215 12,732 29. FAIR VALUE HIERARCHY OF FINANCIAL INSTRUMENTS Level 1 - Quoted prices (unadjusted) in active markets for identical assets or liabilities. Level 2 - Inputs other than quoted prices included within Level 1 that are observable for the asset or liability, either directly (i.e., as pric- es) or indirectly (i.e., derived from prices). Level 3 - Inputs for the asset or liability that are not based on observable market data (unobservable inputs). The Group has on 31 December 2010 financial assets totalling EUR 657 thousand (currency forward, of which EUR 324 thousand treated as cash flow hedges) belonging to hierarchy 2. The Group had on 31 December 2009 financial liabilities of fair value totalling EUR -2,369 thousand (interest rate swap) and EUR -677 thousand (currency forward, of which EUR -1,093 thousand treated as cash flow hedges) belonging to hierarchy 2. The Group has ordered six ro-ro vessels from the Chinese Jinling shipyard. These vessels will be paid partly in USD, but instalments have been fully hedged against EUR. The Group applies hedge accounting in accordance with IAS 39 for the spot part of the forward exchange of the above derivative contracts. In the year 2009 the Group had an open interest rate swap made in 2007, where the Group swapped six-month Euribor interest for a fixed three-year interest. The nominal value of the interest-rate swap was EUR 120 million and the duration was three years. This interest-rate swap was measured at fair value through profit or loss, and the negative effect of the value was presented in the balance sheet under account payable and other liabilities. 30. ADJUSTMENTS TO CASH FLOW FROM OPERATIONS EUR 1,000 2010 2009 Non-cash transactions: Depreciation 60,322 61,012 Profits/losses from the sale of assets -1,230 -11,428 Exchange rate differences -2,300 -468 56,792 49,116 36 FINNLINES PLC Financial Statements 2010 (figures in EUR thousand, if not stated otherwise)
31. PENSION LIABILITIES The Group’s pension plans are organised through external pension insurance companies. The Group’s obligations in relation to defined benefit plans are calculated separately for each plan using the projected unit credit meth- od. Pension costs are recognised as expenses during each employee’s employment term on the basis of calculations made by author- ised actuaries. In calculating the current value of a pension liability, the Group uses the market rate of return of high-quality debenture bonds issued by companies or the interest rate of government debt obligations as the discount rate. The maturity of debenture bonds and debt obligations corresponds in all essential aspects to the maturity of the pension obligation being considered. Finnlines Plc’s and Finnsteve Oy Ab’s plan assets of defined benefit pensions in Finland are mainly managed by insurance companies. The assets are the responsibility of the insurance companies and a part of the insurance company’s investments assets, therefore, it is not possible to disclose the distribution of assets in categories. The assets are managed in accordance with the local statutory require- ments under which the plans are obliged to pay guaranteed sums irrespective of market conditions. EUR 1,000 2010 2009 Post-employment benefits Defined benefit pension plans (receivable) -128 -197 Defined benefit pension plans (liability) 2,310 2,355 2,182 2,158 EUR 1,000 2010 2009 Defined benefits plans Defined benefits plans Reconciliation of statement of financial position 1 Jan 2,158 2,105 Net income (-) / expenses (+) recognised in profit and loss account 202 -32 Payments into the plan -178 85 31 Dec 2,182 2,158 Pension liabilities on statement of financial position Present value of funded liabilities 8,054 9,103 Fair value of plan assets -4,476 -5,346 Unrecognised actuarial profits (+) and losses (-) -1,396 -1,599 Total liabilities (receivables) 2,182 2,158 EUR 1,000 2010 2009 Defined benefits plans Defined benefits plans Pension costs on profit and loss account Service costs in current period -52 -301 Interest expense -361 -410 Expected income from plan assets 243 246 Actuarial profits (+) / losses (-) -32 Service cost of past periods 0 497 Gains and losses on curtailments and settlements 0 Total in personnel costs -202 32 (figures in EUR thousand, if not stated otherwise) FINNLINES PLC Financial Statements 2010 37
- Page 1 and 2: FINANCIAL STATEMENTS 2010
- Page 3 and 4: BOARD OF DIRECTORS’ REPORT THE CO
- Page 5 and 6: elated to this. Other significant r
- Page 7 and 8: CONSOLIDATED STATEMENT OF COMPREHEN
- Page 9 and 10: CONSOLIDATED STATEMENT OF CHANGES I
- Page 11 and 12: NOTES TO THE CONSOLIDATED FINANCIAL
- Page 13 and 14: ated companies are consolidated usi
- Page 15 and 16: egory includes assets held for trad
- Page 17 and 18: In defined benefit plans, the emplo
- Page 19 and 20: Segment assets, liabilities and inv
- Page 21 and 22: 8. PERSONNEL EXPENSES EUR 1,000 201
- Page 23 and 24: 13. EARNINGS PER SHARE UNDILUTED Un
- Page 25 and 26: Assets leased through finance lease
- Page 27 and 28: Main factors used in calculating va
- Page 29 and 30: 21. DEFERRED TAX ASSETS AND LIABILI
- Page 31 and 32: EUR 1,000 2010 2009 Significant ite
- Page 33 and 34: 26. PROVISIONS EUR 1,000 2010 2009
- Page 35: Finance lease liabilities Finance l
- Page 39 and 40: Hedge Accounting The Group has orde
- Page 41 and 42: The Group had an interest rate swap
- Page 43 and 44: COMMODITY RISK The Group is exposed
- Page 45 and 46: with the Helsinki Court of Appeal a
- Page 47 and 48: In April 2009, Finnlines Plc's subs
- Page 49 and 50: Shares outstanding 31 December 2005
- Page 51 and 52: CALCULATION OF KEY RATIOS, IFRS Ear
- Page 53 and 54: PROFIT AND LOSS ACCOUNT, PARENT COM
- Page 55 and 56: CASH FLOW STATEMENT, PARENT COMPANY
- Page 57 and 58: NOTES TO THE FINANCIAL STATEMENTS,
- Page 59 and 60: 8. EXTRAORDINARY ITEMS EUR 2010 200
- Page 61 and 62: 14. INVENTORIES EUR 2010 2009 Bunke
- Page 63 and 64: 18. ACCUMULATED APPROPRIATIONS EUR
- Page 65 and 66: CONTINGENCIES AND COMMITMENTS EUR 1
- Page 67 and 68: BOARD'S PROPOSAL FOR THE USE OF THE
- Page 69 and 70: AUDITOR'S REPORT TO THE ANNUAL GENE
EUR 1,000 <strong>2010</strong> 2009<br />
Significant items in accrued expenses and deferred income<br />
Discounts given 3,828 4,396<br />
Cargo handling costs 3,158 2,325<br />
Port expenses and voyage-related costs 2,376 2,116<br />
Bunker costs 1,831 3,503<br />
Repairs, vessels 1,051 1,173<br />
Other accrued liabilities 2,944 3,933<br />
15,188 17,446<br />
EUR 1,000 <strong>2010</strong> 2009<br />
Distribution of accounts payable by currency<br />
EUR 25,075 8,683<br />
SEK 1,569 1,313<br />
USD 3,907 2,410<br />
GBP 346 241<br />
NOK 16 -58<br />
DKK 285 123<br />
CHF 2<br />
PLN 17 20<br />
31,215 12,732<br />
29. FAIR VALUE HIERARCHY OF <strong>FINANCIAL</strong> INSTRUMENTS<br />
Level 1 - Quoted prices (unadjusted) in active markets for identical assets or liabilities.<br />
Level 2 - Inputs other than quoted prices included within Level 1 that are observable for the asset or liability, either directly (i.e., as pric-<br />
es) or indirectly (i.e., derived from prices).<br />
Level 3 - Inputs for the asset or liability that are not based on observable market data (unobservable inputs).<br />
The Group has on 31 December <strong>2010</strong> financial assets totalling EUR 657 thousand (currency forward, of which EUR 324 thousand<br />
treated as cash flow hedges) belonging to hierarchy 2. The Group had on 31 December 2009 financial liabilities of fair value totalling<br />
EUR -2,369 thousand (interest rate swap) and EUR -677 thousand (currency forward, of which EUR -1,093 thousand treated as cash<br />
flow hedges) belonging to hierarchy 2.<br />
The Group has ordered six ro-ro vessels from the Chinese Jinling shipyard. These vessels will be paid partly in USD, but instalments<br />
have been fully hedged against EUR. The Group applies hedge accounting in accordance with IAS 39 for the spot part of the forward<br />
exchange of the above derivative contracts.<br />
In the year 2009 the Group had an open interest rate swap made in 2007, where the Group swapped six-month Euribor interest for<br />
a fixed three-year interest. The nominal value of the interest-rate swap was EUR 120 million and the duration was three years. This<br />
interest-rate swap was measured at fair value through profit or loss, and the negative effect of the value was presented in the balance<br />
sheet under account payable and other liabilities.<br />
30. ADJUSTMENTS TO CASH FLOW FROM OPERATIONS<br />
EUR 1,000 <strong>2010</strong> 2009<br />
Non-cash transactions:<br />
Depreciation 60,322 61,012<br />
Profits/losses from the sale of assets -1,230 -11,428<br />
Exchange rate differences -2,300 -468<br />
56,792 49,116<br />
36 FINNLINES PLC Financial Statements <strong>2010</strong> (figures in EUR thousand, if not stated otherwise)


