FINANCIAL STATEMENTS 2010 - Finnlines
FINANCIAL STATEMENTS 2010 - Finnlines
FINANCIAL STATEMENTS 2010 - Finnlines

You also want an ePaper? Increase the reach of your titles
YUMPU automatically turns print PDFs into web optimized ePapers that Google loves.
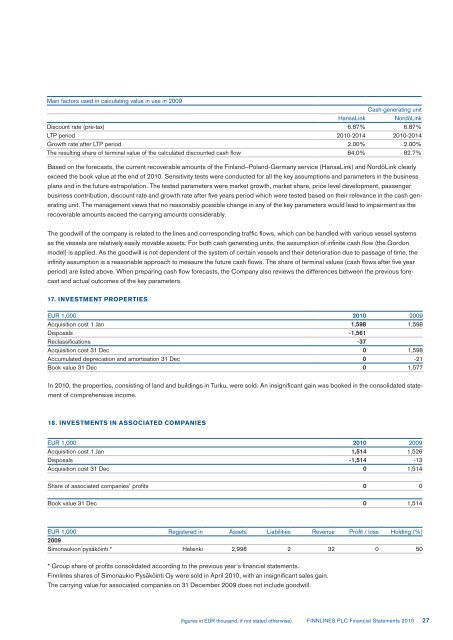
Main factors used in calculating value in use in 2009<br />
HansaLink<br />
Cash-generating unit<br />
NordöLink<br />
Discount rate (pre-tax) 6.87% 6.87%<br />
LTP period <strong>2010</strong>-2014 <strong>2010</strong>-2014<br />
Growth rate after LTP period 2.00% 2.00%<br />
The resulting share of terminal value of the calculated discounted cash flow 84.0% 82.7%<br />
Based on the forecasts, the current recoverable amounts of the Finland–Poland-Germany service (HansaLink) and NordöLink clearly<br />
exceed the book value at the end of <strong>2010</strong>. Sensitivity tests were conducted for all the key assumptions and parameters in the business<br />
plans and in the future extrapolation. The tested parameters were market growth, market share, price level development, passenger<br />
business contribution, discount rate and growth rate after five years period which were tested based on their relevance in the cash gen-<br />
erating unit. The management views that no reasonably possible change in any of the key parameters would lead to impairment as the<br />
recoverable amounts exceed the carrying amounts considerably.<br />
The goodwill of the company is related to the lines and corresponding traffic flows, which can be handled with various vessel systems<br />
as the vessels are relatively easily movable assets. For both cash generating units, the assumption of infinite cash flow (the Gordon<br />
model) is applied. As the goodwill is not dependent of the system of certain vessels and their deterioration due to passage of time, the<br />
infinity assumption is a reasonable approach to measure the future cash flows. The share of terminal values (cash flows after five year<br />
period) are listed above. When preparing cash flow forecasts, the Company also reviews the differences between the previous fore-<br />
cast and actual outcomes of the key parameters.<br />
17. INVESTMENT PROPERTIES<br />
EUR 1,000 <strong>2010</strong> 2009<br />
Acquisition cost 1 Jan 1,598 1,598<br />
Disposals -1,561<br />
Reclassifications -37<br />
Acquisition cost 31 Dec 0 1,598<br />
Accumulated depreciation and amortisation 31 Dec 0 -21<br />
Book value 31 Dec 0 1,577<br />
In <strong>2010</strong>, the properties, consisting of land and buildings in Turku, were sold. An insignificant gain was booked in the consolidated state-<br />
ment of comprehensive income.<br />
18. INVESTMENTS IN ASSOCIATED COMPANIES<br />
EUR 1,000 <strong>2010</strong> 2009<br />
Acquisition cost 1 Jan 1,514 1,526<br />
Disposals -1,514 -13<br />
Acquisition cost 31 Dec 0 1,514<br />
Share of associated companies’ profits 0 0<br />
Book value 31 Dec 0 1,514<br />
EUR 1,000 Registered in Assets Liabilities Revenue Profit / loss Holding (%)<br />
2009<br />
Simonaukion pysäköinti * Helsinki 2,998 2 32 0 50<br />
* Group share of profits consolidated according to the previous year's financial statements.<br />
<strong>Finnlines</strong> shares of Simonaukio Pysäköinti Oy were sold in April <strong>2010</strong>, with an insignificant sales gain.<br />
The carrying value for associated companies on 31 December 2009 does not include goodwill.<br />
(figures in EUR thousand, if not stated otherwise)<br />
FINNLINES PLC Financial Statements <strong>2010</strong><br />
27