FRC 2012 Sensor Basics Tutorial - The Fighting Pi
FRC 2012 Sensor Basics Tutorial - The Fighting Pi
FRC 2012 Sensor Basics Tutorial - The Fighting Pi

Create successful ePaper yourself
Turn your PDF publications into a flip-book with our unique Google optimized e-Paper software.
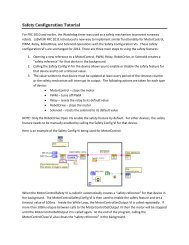
Getting Started with <strong>Sensor</strong>s<br />
Contents<br />
Introduction<br />
Introduction<br />
Configuring the Hardware<br />
Exploring the <strong>Sensor</strong> API<br />
Developing an Example<br />
Customizing a LabVIEW Application<br />
Using Other Types of <strong>Sensor</strong>s<br />
Conclusion<br />
In this tutorial, we will explore how to acquire data from sensors using an cRIO-<strong>FRC</strong>2 and LabVIEW 2011<br />
(installed from the FIRST Robotics Software <strong>2012</strong> installation disc). We will give detailed instructions on<br />
using an accelerometer followed by a brief overview of other sensor types including a gyro, an ultrasonic<br />
sensor, a counter, and an encoder.<br />
Note: This tutorial was created using beta software and hardware. <strong>The</strong> final product may differ<br />
slightly from the products shown. <strong>The</strong> bare boards used in this tutorial will have enclosures in<br />
the final version.<br />
Configuring the Hardware<br />
<strong>Sensor</strong>s are electrical devices that return a voltage corresponding to a physical property. In the case of<br />
an accelerometer, the voltage it returns is proportional to the acceleration the sensor is experiencing.<br />
<strong>The</strong> physical connections for the gyro and ultrasonic sensors are the same as the accelerometer. You will<br />
be using the analog breakout to interface all of your analog sensors with the NI 9201 module in your<br />
cRIO-<strong>FRC</strong> chassis.
Connect the analog breakout to the NI 9201 in Slot 1. <strong>The</strong> 25-pin D-sub connector will connect the<br />
analog breakout to the NI 9201, while the 24 exposed pins (three for each channel) and the white 2-pin<br />
connector will connect to your sensors and power supply, respectively. <strong>The</strong> three pins on the edge of<br />
the breakout are use to designate if the analog breakout is to use the 12 volt connector or analog input<br />
8 as its power source—you can connect power to either one, but make sure you set the jumper<br />
correctly. In this demonstration we will be using the 12 volt connector so we will jumper the select<br />
common pin and the select 12V pin.<br />
Once the analog breakout is powered you are ready to connect your sensors. We will be using an<br />
accelerometer similar to the one in the <strong>2012</strong> <strong>FRC</strong> kit of parts.<br />
In general sensors require power (often called excitation) and output a voltage that is proportional to a<br />
physical phenomon. This sensor is a two axis accelerometer meaning that it can measure acceleration in<br />
two directions—this is achieved by putting two separate accelerometers on the same sensor with<br />
different orientations. While most sensors would have three wires: power, ground, and signal out, this<br />
sensor has four wires since it is really two accelerometers in one. Both accelerometers share the power<br />
and ground wires and each has their own signal out wires. In order to measure the acceleration in both<br />
directions we would need to use two analog input channels. However, in this demo we will only be
using a single analog input to measure acceleration in one direction so we will not be connecting the<br />
second signal out wire.<br />
Within each set of three exposed pins for each analog input channel, the pin farthest from the board is<br />
used for the analog input signal, the center pin is used for the +5V power supply (for excitation), and the<br />
pin closest to the board is the ground pin. Connect to accelerometer to the breakout board according to<br />
this pin configuration. This is the last connection required to take measurements from the sensor so<br />
now we will examine the software side of things.<br />
Exploring the <strong>Sensor</strong> API<br />
In this tutorial we will assume that you are already familiar with opening a new project and VI in<br />
LabVIEW <strong>FRC</strong> Edition <strong>2012</strong>. If you would like details on how to open a new project, please refer to Best<br />
Practices For Using the <strong>FRC</strong> cRIO Project Frameworks.<br />
Once you have a new VI open, access the Functions palette by right-clicking on the white space in the<br />
Block Diagram. Here you will find the WPI Robotics Library palette where you can navigate to the<br />
<strong>Sensor</strong>s palette.
Click on the <strong>Sensor</strong>s icon in order to see the different sensor palettes available to you. Each palette<br />
contains VIs that allow you to gather data from different types of sensors.<br />
For example, the VIs in the Accelerometer palette allow you to measure an acceleration value as well as<br />
set different properties for the measurement. <strong>The</strong>se properties, SetCenterVolt and SetGain, can change<br />
the how acceleration measurements are taken. <strong>The</strong> SetCenterVolt VI will calibrate the accelerometer’s<br />
zero point and the SetGain VI will set how sensitive your graph will be to a change in voltage.<br />
To display the Accelerometer VIs, select the Accelerometer palette.<br />
<strong>The</strong> Accelerometer VIs use the same Open»Get»Close paradigm that many of the other Robotics APIs<br />
use.<br />
Developing an Example<br />
To begin writing your code, drag and drop the Open, GetAcceleration, and Close VIs onto your Block<br />
Diagram. <strong>The</strong> Open VI opens communication between the cRIO and the accelerometer. <strong>The</strong><br />
GetAcceleration VI returns the voltage data from the accelerometer. <strong>The</strong> Close VI closes the<br />
communication between the cRIO and the accelerometer.
Next we need to set the center voltage and the gain for the accelerometer in order to calibrate the<br />
accelerometer and receive useful data. On your Block Diagram, make room between the Open VI and<br />
the GetAcceleration VI and then right-click on a blank space of the Block Diagram to open the Functions<br />
Palette. Navigate to the Accelerometer palette and place a SetCenterVoltage VI and a SetGain VI in<br />
between the Open VI and GetAcceleration VI. You can now wire together each of the VIs as shown<br />
below.<br />
To be able to set the Center Voltage for the accelerometer, right-click on the Center Voltage input<br />
terminal of the SetCenter VI and navigate to Create»Control – this will place the corresponding control<br />
on the Front Panel. Follow the same steps to create a control for the Gain input terminal of the SetGain<br />
VI. To display the data collected by the sensor on the Front Panel, right-click on the Acceleration output<br />
of the GetAcceleration VI and navigate to Create»Indicator.<br />
Next we will direct the VIs to the appropriate module and channel to which the accelerometer is<br />
connected. Right-click on the Analog Module (Slot 1) input terminal on the Open VI and select<br />
Create»Control. Follow the same steps to create a control for the Analog Channel input terminal. This<br />
will place controls on the Front Panel that will allow you to select the module and analog channel for<br />
your accelerometer.
Next, add a While Loop around the SetCenter, SetGain and GetAcceleration VIs so the VI continually<br />
updates with new data. To do this, right-click on the Block Diagram to bring up the Functions palette and<br />
navigate to the Functions»Programming»Structures palette and select a While Loop. Click to the topleft<br />
of the SetCenter VI and drag the loop to include all VIs except the Open and Close VIs. References<br />
for the sensors only need to be open and closed once, so they do not need to be inside the loop.<br />
Right-click on the condition terminal in the bottom-right of the While Loop and select Create»Control to<br />
place a stop button on the Front Panel. Finally, add a Wait VI to the While Loop so that the code<br />
executes every 10 milliseconds. <strong>The</strong> Wait function is located in the Functions»Programming»Timing<br />
palette. Right-click on the Milliseconds to Wait input terminal and select Create»Constant. Set this<br />
constant to 10.<br />
Switch to the Front Panel and set the controls (Analog Module (Slot 1), Analog Channel, Center Voltage,<br />
Gain (VoltsPerG)) accordingly. You can switch to the Front Panel by going to the Window menu and<br />
selecting Show Front Panel. You can also move and resize the items on the Front Panel as you see fit.<br />
Now you are ready to collect data from your accelerometer. Run the program to see the data from the<br />
accelerometer displayed on your Front Panel.<br />
Customizing a LabVIEW Application
LabVIEW allows you to customize a program for your own personal needs. For instance, you can graph<br />
your data on the Front Panel and set different parameters for your application. For this example we will<br />
graph the sensor data on the Front Panel as well as turn an LED on or off depending on upper and lower<br />
limits that we determine.<br />
Start by switching to the Front Panel if it is not already showing. You should already see your Stop<br />
button, Analog Module (Slot 1) control, Analog Channel control, Center Voltage control, Gain control,<br />
and Accelerometer indicator. We will now add two numeric controls for the upper and lower limits, a<br />
round LED, and a chart to the Front Panel. Right-click on the Front Panel to bring up the Controls<br />
palette. Navigate to the Controls»Modern»Graph palette and place a Waveform Chart on the Front<br />
Panel. Next, bring up the Controls palette again and navigate to the Controls»Modern»Numeric and<br />
place a Numeric Control on the Front Panel. Repeat this step to add a second Numeric Control. Change<br />
the names of the controls to Upper Limit Bound and Lower Limit Bound. Finally, navigate to the<br />
Controls»Modern»Boolean palette and place a Round LED on the Front Panel. Change the name of the<br />
Boolean to Alarm. Feel free to move and resize and rename the controls on the Front Panel as you wish.<br />
Your Front Panel should resemble the figure below.<br />
Switch back to the Block Diagram (Window»Show Block Diagram) where you should see the different<br />
controls you added to your Front Panel. Resize the While Loop to make room for additional code and<br />
move all the new controls inside of the While Loop.<br />
We want our new Chart to display not only the accelerometer data, but also the upper and lower<br />
bounds that we set on the Front Panel. To do this, use a Bundle function to bundle each of these values<br />
into a cluster to be passed into the Waveform Chart. Right-click on the Block Diagram to bring up the<br />
Functions palette and then navigate to the Functions»Programming»Cluster, Class, & Variant palette<br />
and place a Bundle function on the Block Diagram to the right of your Upper and Lower Bound controls.<br />
Hover your mouse over the bottom of the Bundle function and expand the Bundle to three inputs. Next<br />
wire the Acceleration output of the GetAcceleration VI to the first input, the Upper Limit Bound to the
second input, and the Lower Limit Bound to the third slot input. Finally, wire the output of the Bundle to<br />
the Waveform Chart.<br />
<strong>The</strong> last thing we want to do is set our alarm to true if the value of the data from our sensor is below the<br />
lower bound or above the upper bound. We can use comparison VIs to determine if either of these<br />
events happen. Right-click on the Block Diagram and navigate to the<br />
Functions»Programming»Comparison palette and place an In Range and Coerce VI on the Block<br />
Diagram.<br />
Wire the Acceleration output from the GetAcceleration VI to the x input of the In Range and Coerce VI.<br />
Next, wire the Upper Limit Bound to the upper limit input and the Lower Limit Bound to the lower limit<br />
input of the In Range and Coerce VI. This will send a True output if Acceleration value is within this<br />
range. We want to turn the Alarm LED on when the Acceleration value is outside of the specified range.<br />
To accomplish this, we need to use a Not function to compute the logical negation of the input. Rightclick<br />
on the Block Diagram and navigate to the Functions»Programming»Boolean palette and place a<br />
Not function to the right of the In Range and Coerce VI. Wire the In Range? output of the In Range and<br />
Coerce VI to the input of the Not function, and then the output of the Not function to the input of the<br />
Alarm LED.
We want our program to stop when we click on the Stop button, but we also want it to stop if an error<br />
occurs during the program. <strong>The</strong> Error Out output for each of the Accelerometer VIs is a cluster of three<br />
different values: Status, Code, and Source. <strong>The</strong> Status is a boolean value that will signal True when an<br />
error has occurred. To get access to the Status value, we need to “unbundle” the Error Out cluster.<br />
Right-click on the Block Diagram and navigate to the Functions»Programming»Cluster, Class, & Variant<br />
palette and place an Unbundle By Name function on the Block Diagram. Wire the Error Out output of<br />
the GetAcceleration VI to the input of the Unbundle By Name. By default, the Status value should<br />
appear in the Unbundle By Name. If Status does not appear, left-click on the Unbundle By Name and<br />
select Status from the pop-up menu.<br />
Since we want to stop the While Loop when the Stop button or the Status value is true, we need to use<br />
an Or function to evaluate the signals. Right-click on the Block Diagram and navigate to the<br />
Functions»Programming»Boolean palette and place an Or function to the right of the Unbundle By<br />
Name. Disconnect the Stop button from the condition terminal by clicking on the wire connecting the<br />
two and pressing the Delete key or right-clicking on the wire and selecting Delete Wire Branch. <strong>The</strong>n<br />
wire the output of the Unbundle By Name and the Stop button to the inputs of the Or function and the<br />
output of the Or function to the input of the condition terminal.
You now have a complete program that will read values from your accelerometer and display that<br />
information to a graph on your Front Panel and alert you if the value exceeds the specified range. Run<br />
the VI from within your project that targets the cRIO-<strong>FRC</strong>. You should see the values on your chart and<br />
indicator change depending on how much you shake the accelerometer.<br />
Using Other Types of <strong>Sensor</strong>s<br />
In addition to accelerometers, WPI Robotics Library provides an API for other types of sensors. For each<br />
sensor there is a palette of VIs that make extensive use of the Open»Get»Close and Open»Set»Close<br />
paradigm. This allows you to make use of your experience with different sensor typess.<br />
For accelerometers, gyroscopes, and ultrasonic distance sensors, changing between measurement types<br />
can be as simple as plugging a new sensor into the analog breakout board and using the corresponding
sensor API. Each of these sensors use an analog signal that returns a voltage proportional to a physical<br />
value.<br />
Examples for these types of sensors, such as the gyroscope example below, can be found by going to<br />
Getting Started window and clicking the Find Examples link in the bottom right corner. You can access<br />
the Getting Started window from any LabVIEW window by going to View»Getting Started Window….<br />
Each example will show how to use the sensor’s corresponding API in the WPI Robotics Library.<br />
For the remaining sensor types, such as encoder and counters, the programming follows a similar<br />
procedure, but the hardware setup differs.<br />
Encoders and counters are digital sensors. Rather than returning a voltage proportional to a physical<br />
value they monitor rising and/or falling edges of digital signals to either count or measure position.<br />
Since these are digital sensors they will need to connect to the NI 9403 digital module and use the digital<br />
sidecar rather than the analog breakout board.
<strong>The</strong> digital side car has many more connections than the analog bumper, but we will focus on the<br />
necessary connections for making counter and encoder measurements. <strong>The</strong> digital side car also requires<br />
power at the +12 V pins like the analog breakout board. You can connect to the internal counters using<br />
the GPIO (General Purpose Input Output) pins which allow you to make either counter or encoder<br />
measurements.
Once you have connected the encoder to the appropriate channel you can use the encoder palette to<br />
make an angular position measurement. Examples for these sensors, such as the encoder example<br />
below, can also be found by going to Getting Started windows and clicking the Find Examples link in the<br />
bottom right corner.<br />
Conclusion<br />
This concludes the overview of the <strong>FRC</strong> Robotics <strong>Sensor</strong> API. We have taken a detailed look into how to<br />
make analog sensor measurements using an accelerometer and the WPI Robotics Library <strong>Sensor</strong> API.<br />
Please refer to the FIRST Robotics Competition VIs Help file and other tutorials for more detailed<br />
information about this API.