Quantitative Research - SPSS
Quantitative Research - SPSS
Quantitative Research - SPSS

You also want an ePaper? Increase the reach of your titles
YUMPU automatically turns print PDFs into web optimized ePapers that Google loves.
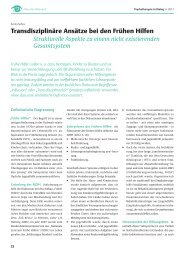
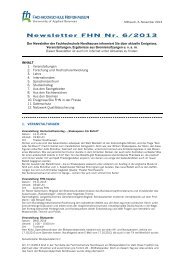
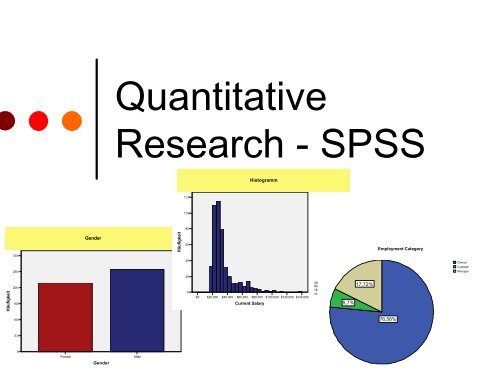
Häufigkeit<br />
300<br />
250<br />
200<br />
150<br />
100<br />
50<br />
0<br />
Female<br />
Gender<br />
Gender<br />
<strong>Quantitative</strong><br />
<strong>Research</strong> - <strong>SPSS</strong><br />
Male<br />
Häufigkeit<br />
120<br />
100<br />
80<br />
60<br />
40<br />
20<br />
0<br />
$0<br />
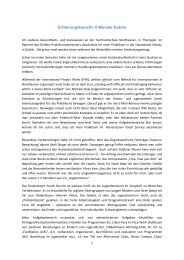
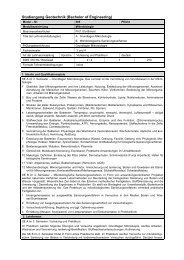
Histogramm<br />
Mittelwert =$34.419,57<br />
Std.-Abw.<br />
=$17.075,661<br />
N =474<br />
$20.000 $40.000 $60.000 $80.000 $100.000 $120.000 $140.000<br />
Current Salary<br />
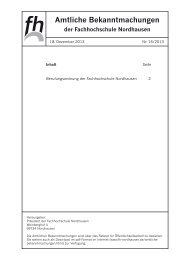
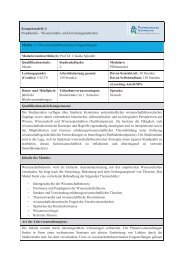
5,7%<br />
17,72%<br />
Employment Category<br />
76,58%<br />
Clerical<br />
Custodial<br />
Manager
Pertti Vilpas
<strong>Quantitative</strong> <strong>Research</strong><br />
“A formal, objective, systematic<br />
process in which numerical data are<br />
utilised to obtain information about<br />
the world"
Stages of the<br />
quantitative research process<br />
1. Topic and research problem definition<br />
2. What information is needed<br />
3. Question specification<br />
4. Sampling<br />
5. Data collection<br />
6. Statistical Analysis<br />
7. Report
<strong>Research</strong> Problem<br />
Example:<br />
What is the public opinion about the<br />
World Cup Ticket Sale System in Germany?
Questionnaire Design<br />
Are you an active sportsman? Yes<br />
No<br />
Judge the Fairness of the Ticket-System unfair<br />
less fair<br />
fair<br />
very fair<br />
Judge the handling of the Ticket sale very complicated<br />
complicated<br />
not complicated<br />
easy handling<br />
…..
Sampling<br />
Random Sampling<br />
Systematic Random Sampling<br />
Stratified Random Sampling
Random Sampling<br />
gender<br />
2<br />
1<br />
2<br />
2<br />
1<br />
1<br />
2<br />
…<br />
Education Level<br />
15<br />
16<br />
12<br />
8<br />
15<br />
15<br />
15<br />
…<br />
salary<br />
57000<br />
40200<br />
21450<br />
21900<br />
45000<br />
32100<br />
36000<br />
…
Systematic Random<br />
Sampling<br />
gender<br />
2<br />
1<br />
2<br />
2<br />
1<br />
1<br />
2<br />
…<br />
Education Level<br />
15<br />
16<br />
12<br />
8<br />
15<br />
15<br />
15<br />
…<br />
salary<br />
57000<br />
40200<br />
21450<br />
21900<br />
45000<br />
32100<br />
36000<br />
…
Data collection with Surveys<br />
Telephone<br />
E-Mail<br />
Computer<br />
Mailing
Data Collection<br />
Example:<br />
Random Sampling =>1000 respondents<br />
Internet Phonebook<br />
Data Collection => Telephone Interview
Statistical Analysis<br />
<strong>SPSS</strong><br />
Statistical Package for Social Scientists,<br />
a very powerful statistical package, excellent<br />
for undertaking and cross-sectional analysis.<br />
It can also be used for time series analysis.
Possibilities of <strong>SPSS</strong> I<br />
Descriptive Statistics:<br />
Frequencies<br />
Tables<br />
Charts
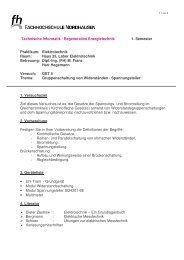
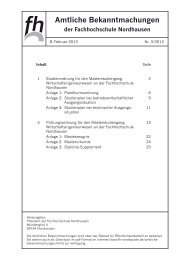
Percent<br />
40<br />
30<br />
20<br />
10<br />
0<br />
Animist<br />
Buddhist<br />
37,96%<br />
Catholic<br />
Hindu<br />
Religion<br />
Jewish<br />
25,0%<br />
3,7% 6,48% 7,41%<br />
0,93% 0,93%<br />
Muslim<br />
Orthodox<br />
14,81%<br />
Protstnt<br />
1,85%<br />
Taoist<br />
0,93%<br />
The figure shows religion of 109 countries<br />
in the world in percentages.<br />
Tribal
Region or<br />
economic group<br />
OECD<br />
Pacific/Asia<br />
Africa<br />
Mean<br />
N<br />
Mean<br />
N<br />
Mean<br />
N<br />
mean value literacy<br />
People who Females who<br />
read (%) read (%)<br />
97,67 92,83<br />
21 6<br />
72,94 62,20<br />
17 15<br />
47,26 32,06<br />
19 18<br />
Almost all people can read in OECD – 98 %,<br />
in Pacific/Asia the percent is 73 %<br />
But in Africa only half of the people can read.<br />
If you have a look at the female percents it is<br />
remarkable that only every 3. woman can read<br />
in Africa.
Possibilities of <strong>SPSS</strong> II<br />
Inferential Statistics<br />
Crosstabulation<br />
Correlation<br />
…
Attended Sports Event in Last Yr * Respondent's Sex<br />
Crosstabulation<br />
Attended Sports<br />
Event in Last Yr<br />
Total<br />
Yes<br />
No<br />
Frequency<br />
%<br />
Frequency<br />
%<br />
Frequency<br />
%<br />
Respondent's Sex<br />
Male Female Total<br />
384 407 791<br />
60,2% 47,8% 53,1%<br />
254 444 698<br />
39,8% 52,2% 46,9%<br />
638 851 1489<br />
100,0% 100,0% 100,0%<br />
Table shows that there is a relationship<br />
between Gender and sports event activity.<br />
48 % of females did attend the events<br />
60 % of all males did
Conclusions<br />
It might be useful for you to find out more<br />
about <strong>SPSS</strong>.<br />
It could be important for your whole career.<br />
We also used Moodle and found it very<br />
useful (http://moodle.org)
Applause, please!!!