Full Document Available - The Food and Environment Research ...
Full Document Available - The Food and Environment Research ...
Full Document Available - The Food and Environment Research ...

Create successful ePaper yourself
Turn your PDF publications into a flip-book with our unique Google optimized e-Paper software.
PESTICIDE USAGE SURVEY REPORT 195<br />
OUTDOOR VEGETABLE CROPS<br />
IN GREAT BRITAIN<br />
2003<br />
D. G. Garthwaite, M. R. Thomas, A. Dawson, H. Stoddart & H. Anderson<br />
Pesticide Usage Survey<br />
Central Science Laboratory<br />
S<strong>and</strong> Hutton<br />
York<br />
YO41 1LZ<br />
Department for <strong>Environment</strong>, <strong>Food</strong> <strong>and</strong> Rural Affairs<br />
&<br />
Scottish Executive <strong>Environment</strong> <strong>and</strong> Rural Affairs Department
CONTENTS Page<br />
Summary 1<br />
Introduction 2<br />
Methods 3<br />
Results <strong>and</strong> discussion 5<br />
Crops 5<br />
Overall usage of pesticides 7<br />
Extent <strong>and</strong> quantities of pesticide formulations used 12<br />
Extent <strong>and</strong> quantities of active substances used 23<br />
Pesticide usage on Brassicas 27<br />
Pesticide usage on Root Crucifers 34<br />
Pesticide usage on Peas & Beans 40<br />
Pesticide usage on Onions & Leeks 47<br />
Pesticide usage on Carrots, Parsnips & Celery 54<br />
Pesticide usage on Lettuce, Endive etc. 61<br />
Pesticide usage on Sweetcorn 67<br />
Pesticide usage on Other Root Vegetables 73<br />
Pesticide usage on Cucurbits 79<br />
Pesticide usage on Other Outdoor Vegetables 85<br />
Comparison of pesticide usage on All Vegetable Crops 92<br />
Vegetable seed treatments 96<br />
Treatment of vegetables during storage 100<br />
Acknowledgements 102<br />
References 102<br />
Appendix 1 - Crops Encountered During <strong>The</strong> 2003 Outdoor Vegetable Crops Survey 103<br />
Appendix 2 – List of Recently Published Pesticide Usage Survey Reports 104<br />
iii
ROUNDING<br />
Due to rounding of figures, the sum of constituent items in the tables may not agree exactly with the totals shown.<br />
DEFINITIONS<br />
a) 'Pesticide' is used throughout this report to include commercial formulations containing active substances of<br />
insecticides, acaricides, molluscicides, fungicides, herbicides, desiccants, soil sterilants, nematicides <strong>and</strong> growth<br />
regulators.<br />
b) 'Treated area' is the gross area treated with a pesticide, including all repeat applications, some of which may have been<br />
applied to the l<strong>and</strong> in preparation for drilling/planting, or applied to a crop which subsequently failed <strong>and</strong> was re-<br />
drilled/planted with the current crop, <strong>and</strong> thus may appear as an inappropriate use on that crop.<br />
c) Where quoted in the text, reasons for application are the grower’s stated reasons for use of that particular pesticide on<br />
that crop <strong>and</strong> may not always seem entirely appropriate.<br />
d) Where individual active substances are mentioned in the text, they are listed in descending order of use by hectares<br />
treated.<br />
e) Throughout all tables, “Other” refers to chemicals grouped together because they were applied to less than 0.1% of the<br />
total area treated with pesticides.<br />
f) <strong>The</strong> term “formulation(s)” used within the text is used here to describe either single active substances or mixtures of<br />
active substances contained within an individual product. It does not refer to any of the solvents, pH modifiers or<br />
adjuvants also contained within a product that contribute to its efficacy.<br />
QUALITY CONTROL OF DATA<br />
All data are collected by personal interview using fully qualified staff working to st<strong>and</strong>ard operating procedures. Paper<br />
records are held at S<strong>and</strong> Hutton, York, but individual holdings cannot be identified. Data are entered onto a computer<br />
database which has extensive error checking routines associated with the input program. Each item of data is then<br />
checked after entry <strong>and</strong> subsequently all forms are re-checked by someone other than the original operator. Prior to<br />
compilation of the tables, the data are further subjected to a range of computer checks to detect, amongst other things,<br />
any values which, on agronomic grounds, appear suspect. Any thus revealed are further scrutinised, <strong>and</strong>, if necessary,<br />
referred back to the original source. All the tables are prepared by computer once the data set is considered correct, thus<br />
eliminating transcription <strong>and</strong> typographical errors.<br />
iv
SUMMARY<br />
This report is the third to present information on all aspects of pesticide usage on vegetable crops grown for human<br />
consumption in Great Britain, the previous reports being on usage in 1999 <strong>and</strong> 1995. Prior to 1995, surveys reported on<br />
usage in Engl<strong>and</strong> & Wales <strong>and</strong> Scotl<strong>and</strong> separately. Ten major crop groups, incorporating 101 distinct crops, were<br />
encountered. Data on pesticide usage were collected from 4,203 examples during visits by trained pesticide usage<br />
surveyors to 602 holdings throughout Great Britain. <strong>The</strong> total area sampled represented 21% of the total area of<br />
vegetable crops grown in Great Britain during the 2003 season.<br />
<strong>The</strong>re were reductions of 8% <strong>and</strong> 20% in the area of all vegetable crops grown compared with 1999, <strong>and</strong> 1991<br />
respectively. However, there has been a one percent increase in the area treated compared with 1999 <strong>and</strong> 23% compared<br />
with 1991. By contrast the weights applied decreased by 31% compared with 1999, <strong>and</strong> by 8% over the last thirteen<br />
years. This reflects a trend, particularly in onions, leeks <strong>and</strong> beetroot, towards the use of products with lower rates of<br />
application, <strong>and</strong> the use of repeat low dose spray programmes.<br />
Herbicides accounted for 40% of the total pesticide-treated area of vegetable crops grown in Great Britain in 2003,<br />
insecticides 32%, fungicides 24%, molluscicides <strong>and</strong> repellents 3%, sulphur one percent <strong>and</strong> sodium chloride, growth<br />
regulators, physical control agents, biological control agents, growth stimulants <strong>and</strong> soil sterilants less than one percent<br />
each. In contrast, herbicides accounted for 52% of the total weight of pesticide active substances applied, fungicides<br />
23%, sodium chloride 7%, sulphur 6%, insecticides 5%, soil sterilants 4%, molluscicides & repellents 2% <strong>and</strong> growth<br />
regulators one percent. Physical control agents, growth stimulants <strong>and</strong> biological control agents accounted for less than<br />
one percent each.<br />
<strong>The</strong> most extensively-used herbicide formulations were: glyphosate (10% of all herbicide applications) used on all crops<br />
prior to drilling or planting; cyanazine (9%) used extensively on peas & beans <strong>and</strong> onions & leeks; ioxynil (8%) used<br />
mainly on onions & leeks; propachlor, used extensively (8%) on onions & leeks; pendimethalin (7%) used extensively on<br />
onions & leeks <strong>and</strong> carrots, parsnips & celery; <strong>and</strong> linuron (6%) used mainly on carrots, parsnips, & celery.<br />
Pyrethroids were the most extensively-used insecticides accounting for 51% of the insecticide-treated area, followed by<br />
carbamates 26%, pyrethroid/carbamate formulations 9% <strong>and</strong> organophosphates 4%. Five insecticides accounted for<br />
approximately 81% of the total insecticide-treated area of all vegetable crops: lambda-cyhalothrin (31%); pirimicarb<br />
(23%); deltamethrin (11%); lambda-cyhalothrin/pirimicarb (6%); <strong>and</strong> cypermethrin (5%). Other extensively-used<br />
insecticides included deltamethrin/pirimicarb, triazamate <strong>and</strong> nicotine. Aldicarb was the only nematicide recorded.<br />
<strong>The</strong> most extensively-used fungicide formulations applied as sprays were: azoxystrobin (used principally on carrots,<br />
vining peas <strong>and</strong> dry bulb onions); tebuconazole (used principally on carrots, Brussels sprouts, parsnips <strong>and</strong> leeks);<br />
dimethomorph/mancozeb (used entirely on dry-bulb onions); copper oxychloride (predominantly applied to dry-bulb<br />
onions, carrots & calabrese (as a bactericide)); <strong>and</strong> chlorothalonil (predominantly used on dry-bulb onions, Brussels<br />
sprouts <strong>and</strong> salad onions).<br />
Active substances showing major increases in area treated included dimethomorph <strong>and</strong> triazamate. Usage of bifenthrin<br />
increased by over seven times compared with 1999, that of alpha-cypermethrin by over three times, whereas the treated<br />
areas of metalaxyl-M <strong>and</strong> mancozeb more than doubled. Usage of azoxystrobin, tepraloxydim, pymetrozine, boscalid<br />
<strong>and</strong> pyraclostrobin on vegetable crops were encountered for the first time in this survey. Significant reductions in use<br />
were seen in dimethoate (down 89%), metalaxyl (down by 86% <strong>and</strong> now replaced by metalaxyl-M) <strong>and</strong> cypermethrin<br />
(56%).<br />
1
INTRODUCTION<br />
<strong>The</strong> Advisory Committee on Pesticides advises government on all aspects of pesticide use. In order to discharge this<br />
function, the Committee must regularly monitor the usage of all pesticides <strong>and</strong> needs accurate data on the usage of<br />
individual active substances.<br />
As part of the ongoing process for obtaining data, the Pesticide Usage Survey Teams of the Central Science Laboratory,<br />
an executive agency of the Department for <strong>Environment</strong>, <strong>Food</strong> <strong>and</strong> Rural Affairs, <strong>and</strong> the Scottish Agricultural Science<br />
Agency, an agency of the Scottish Executive <strong>Environment</strong> <strong>and</strong> Rural Affairs Department, conducted a survey of pesticide<br />
usage on vegetable crops grown from autumn 2002 through to autumn 2003, by visiting holdings throughout Great<br />
Britain from autumn 2003 to spring 2004.<br />
This was the third fully coordinated survey of pesticide usage on vegetable crops throughout Great Britain, but was the<br />
tenth survey of pesticide usage on vegetable crops in Engl<strong>and</strong> & Wales. Previous surveys were reported by Sly (1972),<br />
Umpleby & Sly (1977), Sly (1982), Umpleby et al. (1982), Garthwaite et al. (1990), Thomas et al. (1992) <strong>and</strong> Garthwaite<br />
et al. (1997; 2001). Surveys of pesticide usage on vegetable crops in Scotl<strong>and</strong> have been reported by Umpleby et al.<br />
(1982), Brodie & Wood (1986), Shave & Dickson (1991) <strong>and</strong> Bowen et al. (1992).<br />
Information on all aspects of pesticide usage in Great Britain plus the Government Office Regions (GOR) of Engl<strong>and</strong> &<br />
Wales can be obtained from the Pesticide Usage Survey Team at the Central Science Laboratory, York either by<br />
telephone on 01904 462410, by post or through their web site at www.csl.gov.uk/liaison. Further data related specifically<br />
to Scotl<strong>and</strong> can be obtained from the Pesticide Usage Survey Team at the Scottish Agricultural Science Agency, East<br />
Craigs, Edinburgh.<br />
A list of the most recently published survey reports is shown in Appendix 2. Copies of reports on pesticide usage may be<br />
purchased from Defra Publications, London, SE99 7TP (Tel. 01645 556000).<br />
REPORT FORMAT<br />
In order to improve the presentation of data within this report summary charts <strong>and</strong> tables for each crop have been<br />
incorporated. <strong>The</strong>se take three forms:<br />
1. A summary of the number of all pesticide spray applications, products <strong>and</strong> active substances currently used <strong>and</strong><br />
how these have changed over the last 10 years.<br />
2. Data are presented which outline the percentage of monthly applications made for each of the main pesticide<br />
groups, in particular insecticides, fungicides <strong>and</strong> herbicides. Within a pesticide group each individual monthly<br />
figure is expressed as a proportion of the total annual application of that pesticide group. Figures are expressed<br />
proportionately in order to remove any bias caused by one pesticide group dominating all usage on an individual<br />
crop.<br />
3. For each major pesticide group, detailed data are presented on the five principal active substances used on an<br />
individual crop. <strong>The</strong>se data include the area treated with each formulation in 2003, the weight applied in 2003,<br />
the proportion of the total area treated within each pesticide group, the proportion of the census area grown<br />
treated with each formulation, the average number of applications of each formulation made to an individual<br />
crop where treated with that formulation <strong>and</strong> the average proportion of its full label rate used on that crop.<br />
2
METHODS<br />
<strong>The</strong> samples of holdings to be surveyed were selected using data from the Agricultural Census Returns, June 2002 for<br />
Engl<strong>and</strong> & Wales (Anon., 2003a) <strong>and</strong> for Scotl<strong>and</strong> (Anon., 2003b).<br />
<strong>The</strong> samples were drawn from the census returns so as to represent the area of all vegetable crops grown throughout<br />
Engl<strong>and</strong>, Scotl<strong>and</strong> <strong>and</strong> Wales. For Engl<strong>and</strong> the sample was selected within each of the eight Government Office<br />
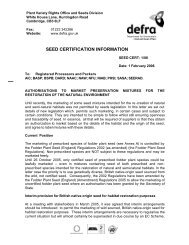
Regions, together with Wales, while in Scotl<strong>and</strong> the country was divided into 11 l<strong>and</strong>-use regions (Fig. 1). <strong>The</strong> samples<br />
were stratified according to the total area of all vegetable crops grown in each region <strong>and</strong> by size group based on the total<br />
area of vegetable crops grown on each holding. <strong>The</strong> area of vegetable crops sampled in each size group <strong>and</strong> each region<br />
was proportional to the total area of vegetable crops grown on holdings of each size group in each region.<br />
For the purposes of this survey <strong>and</strong> for sample selection the total area of vegetable crops was taken as the sum of the<br />
areas of the vegetable crops included in the June census questionnaire: broad beans; runner beans (pinched <strong>and</strong><br />
climbing); French beans; picking peas; all other vegetables. Dry harvest peas <strong>and</strong> field beans for combining were not<br />
included in this survey but data on pesticide use on these crops may be found under surveys of arable crops.<br />
A second supplementary sample was taken to identify holdings growing vining peas. This was done to achieve a better<br />
representation of vining pea crops which was unlikely to be achieved from the first sample as most vining pea crops are<br />
grown on holdings growing arable crops rather than other vegetable crops. All other crops were well represented in the<br />
first sample.<br />
An introductory letter was sent to the occupiers of the selected holdings explaining the purpose of the survey. A total of<br />
602 holdings were visited during the winter of 2003/04, of which 66 grew only vining peas. Data were collected during a<br />
personal interview with the grower conducted by an experienced pesticide usage surveyor. Where a holding listed in the<br />
original sample was not able to provide data it was replaced with another from the same size group <strong>and</strong> region, held on a<br />
reserve list.<br />
Raising factors<br />
<strong>The</strong> pesticide usage data collected from each holding were raised by two factors to give an estimate of regional usage; the<br />
first factor being dependent on farm size group <strong>and</strong> region <strong>and</strong> the second dependent on crop area <strong>and</strong> region. <strong>The</strong> data<br />
were further adjusted by a third factor to give estimates of total pesticide usage related to the national cropping areas in<br />
Great Britain (Thomas, 2001).<br />
<strong>The</strong> raising factors were based on the areas of vegetable crops grown <strong>and</strong> harvested in 2003 as recorded in the June<br />
Agricultural Census Returns both for Engl<strong>and</strong> & Wales (Anon., 2004a) <strong>and</strong> Scotl<strong>and</strong> (Anon., 2004b). Further<br />
adjustments to the area of multiple cropped vegetables, such as lettuce, <strong>and</strong> estimates of the areas of minor crops grown<br />
were made using the results of the January Vegetable Census (Anon., 2004c).<br />
<strong>The</strong> Questionnaire<br />
<strong>The</strong> questionnaire for the main part of the survey consisted of two forms which were completed during an interview with<br />
the farmer.<br />
Form 1 summarised the areas of vegetable crops grown on the designated holding from autumn 2002 through to autumn<br />
2003.<br />
Form 2 dealt with all aspects of pesticide usage on the individual crops grown on the holding <strong>and</strong> harvested during this<br />
period, a separate form being used for each field or planting. This included pesticides applied prior to planting <strong>and</strong> as<br />
these are subsequently associated with the production of that crop they may appear as inappropriate uses. Certain<br />
agronomic details which may have influenced pesticide usage (including method of planting or drilling, use of crop<br />
covers, drilling rates, varieties, time of planting <strong>and</strong> harvest, methods of pesticide application, use of adjuvants <strong>and</strong> the<br />
volume of spray applied) were also recorded on form 2.<br />
3
Fig. 1 Counties in Government Office Regions of Engl<strong>and</strong> & Wales <strong>and</strong> regions covered by SEERAD in Scotl<strong>and</strong><br />
West Midl<strong>and</strong>s<br />
Hereford<br />
Worcester<br />
Shropshire<br />
Staffordshire<br />
Warwickshire<br />
West Midl<strong>and</strong>s<br />
Wales<br />
Clywd<br />
Dyfed<br />
Gwent<br />
Gwynedd<br />
Mid Glamorgan<br />
Powys<br />
S Glamorgan<br />
W Glamorgan<br />
North West<br />
Cheshire<br />
Cumbria<br />
Lancashire<br />
Merseyside<br />
Greater Manchester<br />
South West<br />
Cornwall<br />
Devon<br />
Dorset<br />
Gloucestershire<br />
Avon<br />
Somerset<br />
Wiltshire<br />
4<br />
Scotl<strong>and</strong><br />
Borders<br />
Central<br />
Dumfries & Galloway<br />
Fife<br />
Grampian<br />
Highl<strong>and</strong>s & Isl<strong>and</strong>s<br />
Lothian<br />
Strathclyde<br />
Tayside<br />
North East<br />
Clevel<strong>and</strong><br />
Durham<br />
Tyne & Wear<br />
Northumberl<strong>and</strong><br />
Yorkshire & the Humber<br />
S. Yorkshire<br />
N. Yorkshire<br />
W. Yorkshire<br />
East Yorkshire<br />
East Midl<strong>and</strong>s<br />
Derby<br />
Leicestershire<br />
Lincolnshire<br />
Northamptonshire<br />
Nottinghamshire<br />
Eastern<br />
Bedfordshire<br />
Cambridgeshire<br />
Essex<br />
Hertfordshire<br />
Norfolk<br />
Suffolk<br />
South East<br />
Berkshire<br />
Buckinghamshire<br />
Hampshire<br />
IOW<br />
London<br />
Kent<br />
Oxon<br />
Surrey<br />
E Sussex<br />
W Sussex
RESULTS AND DISCUSSION<br />
CROPS<br />
Information concerning ten main types of vegetable crops <strong>and</strong> data on pesticide usage were collected from 4,203<br />
examples grown on 602 holdings throughout Great Britain. Ten major crop groups were included in the survey, with a<br />
total of 101 distinct crops encountered. <strong>The</strong> sample accounted for 21% of the total area of vegetable crops grown in<br />
Great Britain during the 2003 season. A full list of the crops encountered in the survey can be found in Appendix 1.<br />
<strong>The</strong> areas of each crop group grown in the eight GOR regions of Engl<strong>and</strong>, Wales <strong>and</strong> Scotl<strong>and</strong> are shown in Table 1.<br />
Four crop groups accounted for over 80% of the total area of vegetables grown: peas & beans (38%), brassicas (27%),<br />
carrots, parsnips & celery (11%) <strong>and</strong> onions & leeks (10%). Approximately 32% of the total area of vegetable crops<br />
grown was in East Midl<strong>and</strong>s Region, 26% in Eastern Region, 13% in Yorkshire & the Humber Region, 9% in Scotl<strong>and</strong>,<br />
5% in each of London & the South East, North West <strong>and</strong> West Midl<strong>and</strong>s Regions, 4% in South West Region, one percent<br />
in North East Region <strong>and</strong> less than one percent in Wales.<br />
<strong>The</strong> distribution of most crop groups was generally in line with their regional distribution with the exception of<br />
sweetcorn, where 67% was grown in London & the South East Region, onions & leeks, where 38% were grown in<br />
Eastern region <strong>and</strong> 32% in East Midl<strong>and</strong>s Region, lettuce, endive etc. where 64% was grown in Eastern region, root<br />
crucifers where 59% were grown in Scotl<strong>and</strong> <strong>and</strong> other vegetables, where 48% were grown in Eastern region.<br />
5
6<br />
Table 1 Area of vegetable crops grown in Great Britain 2003 (hectares)<br />
East Eastern London & North North South West Yorkshire & Wales Scotl<strong>and</strong> Great<br />
Midl<strong>and</strong>s the South East East West West Midl<strong>and</strong>s the Humber Britain<br />
Brassicas etc. 17,407 1,990 1,590 47 3,407 3,168 1,576 599 359 2,281 32,424<br />
Root crucifers 94 295 11 14 201 265 34 97 9 1,445 2,465<br />
Peas <strong>and</strong> beans 14,445 11,417 1,114 494 23 648 1,779 12,111 65 4,117 46,211<br />
Onions <strong>and</strong> leeks 3,942 4,737 826 10 357 401 1,404 514 4 202 12,397<br />
Carrots, parsnips, celery 3,054 5,051 179 215 1,193 209 313 1,022 4 1,822 13,062<br />
Lettuce, endive etc. . 3,550 693 . 671 106 17 299 16 161 5,513<br />
Sweetcorn . 265 738 . . 8 88 . 1 . 1,100<br />
Other root vegetables 198 873 41 2 87 22 39 620 4 458 2,342<br />
Cucurbits 10 586 251 . 8 106 58 4 61 . 1,084<br />
Other vegetables 187 2,453 1,191 . 67 453 628 39 6 104 5,127<br />
All vegetable crops 39,334 31,217 6,634 776 6,014 5,385 5,936 15,305 528 10,590 121,725
OVERALL USAGE OF PESTICIDES<br />
Regional pesticide usage<br />
Regional pesticide usage closely approximated the areas of vegetable crops grown, although usage, particularly of<br />
molluscicides, was relatively higher in East Midl<strong>and</strong>s Region. Approximately 36% of the pesticide-treated area was in<br />
East Midl<strong>and</strong>s Region (32% of the area grown) <strong>and</strong> 31% in Eastern Region (26% of the area grown). In contrast usage in<br />
Yorkshire & the Humber Region accounted for 8% of the pesticide-treated area but for 13% of the area grown.<br />
Pesticide usage on crops<br />
Pesticide usage generally reflected the area of crops grown, although usage was relatively higher on onions & leeks <strong>and</strong><br />
carrots, parsnips & celery than any other vegetable crop groups (Tables 1 & 2). Approximately 25% of the total<br />
pesticide-treated area was on brassicas, which represented 27% of the area of all vegetables grown, 25% on onions &<br />
leeks (10% of the area grown), 21% on peas & beans (38% of the area grown) <strong>and</strong> 18% on carrots, parsnips & celery<br />
(11% of the area grown).<br />
Proportion of crops treated<br />
<strong>The</strong> percentage areas of each crop treated with the different pesticide groups are shown in Table 3 whilst the mean<br />
number of spray rounds, mean number of products <strong>and</strong> mean number of active substances applied are shown in Tables<br />
4a-c. Data presented on the number of products <strong>and</strong> active substances applied may well include repeat applications of the<br />
same product or active substance <strong>and</strong> does not imply completely different products used on each occasion.<br />
Many fungicides <strong>and</strong> herbicides were applied in product formulations that contained more than one active substance, or<br />
as product mixtures in the same spray tank, whereas different insecticides were rarely applied together <strong>and</strong> products often<br />
contained only a single active substance, though they may well have been applied at the same time as a fungicide or<br />
herbicide.<br />
Herbicides <strong>and</strong> desiccants were applied to a mean of 94% of the total area of vegetable crops <strong>and</strong> to at least 79% of the<br />
area of any vegetable crop group, with a mean of 3 applications comprising 4 products <strong>and</strong> 4 active substances. Almost<br />
all onions & leeks, peas & beans, carrots, parsnips & celery, lettuce, endive etc. <strong>and</strong> other root vegetables were treated<br />
with herbicide. Onions & leeks, the most intensively herbicide-treated crop group, received, on average, 6 applications<br />
of herbicides totalling 10 products <strong>and</strong> 10 active substances, mainly resulting from repeat low-dose applications. Only<br />
79% of cucurbits received a herbicide application, comprising on average around 1 product containing a single active<br />
substance.<br />
Insecticide usage was most extensive on carrots, parsnip & celery, with typically 90% of the crop being treated with 4<br />
applications comprising 4 products <strong>and</strong> 4 active substances. A slightly smaller percentage of brassicas etc. was treated<br />
(89%), typically with 3 applications, totalling 5 products <strong>and</strong> 5 active substances. On average, two insecticide sprays<br />
containing 3 products <strong>and</strong> active substances were used across all vegetable crop groups.<br />
Fungicides were applied to 51% of the total area of vegetable crops, with a mean of 2 applications, 3 products <strong>and</strong> 3<br />
active substances. No fungicide applications were made to sweetcorn. Usage on onions & leeks was most extensive,<br />
with 94% of the area grown being treated, using an average of 4 fungicide applications, 9 products <strong>and</strong> 12 active<br />
substances.<br />
7
Molluscicides <strong>and</strong> repellents were applied to 9% of the area of all crops <strong>and</strong> were proportionately most extensively-used<br />
on root crucifers (62% of the crop treated), brassicas etc. (17% of the crop area treated) <strong>and</strong> lettuce, endive etc., (13% of<br />
the crop treated).<br />
Sulphur was applied to 7% of all vegetable crops, with most usage being on carrots, parsnips & celery, comprising 12%<br />
of the area grown, <strong>and</strong> on peas & beans <strong>and</strong> sweetcorn, accounting for 10% each of the area grown. Usage of sulphur on<br />
all crops treated was confined, on average, to a single application, <strong>and</strong> may well have been applied for crop nutritional<br />
purposes.<br />
Growth regulators were used on only two crop groups, onions & leeks, where they were used on 27% of the area grown,<br />
<strong>and</strong> carrots, parsnip & celery, accounting for one percent of the area grown. This usage is entirely attributable to the use<br />
of maleic hydrazide to suppress growth during storage.<br />
Biological control agents were used on less than one percent of the total vegetable crop area, with Bacillus thuringiensis,<br />
used for the control of caterpillars, being used on a wide range of crops, while Phytoseiulus persimilis, for the control of<br />
two-spotted spider mite, was restricted to use on runner beans.<br />
<strong>The</strong> soil sterilant, dazomet, accounted for less than one percent of all applications.<br />
Approximately 3% of all crops grown remained untreated, with most pesticide applications being made to lettuce, endive<br />
etc. Approximately 15% of cucurbits, 8% of sweetcorn <strong>and</strong> 6% of carrots, parsnip & celery received no foliar<br />
applications.<br />
8
9<br />
Table 2a Area of vegetable crops in Great Britain in 2003 treated with pesticides by crop group (spray hectares) - excluding seed treatments<br />
Brassicas etc. Root Peas & Onions & Carrots etc. Lettuce Sweetcorn Other root Cucurbits Other All<br />
crucifers beans leeks endive etc. vegetables vegetables crops<br />
Insecticides & nematicides 149,325 4,593 76,601 22,880 70,956 25,583 1,478 1,869 41 10,004 363,329<br />
Fungicides 57,607 1,994 19,625 117,437 55,434 19,533 . 1,883 528 3,512 277,552<br />
Herbicides 63,187 5,198 121,662 136,510 72,621 15,060 2,666 16,183 1,602 14,747 449,436<br />
Sodium chloride 4 . . . . . . 5 . 187 195<br />
Growth regulators . . . 3,275 170 . . . . . 3,445<br />
Molluscicides & repellents 11,954 3,791 13,029 2 13 1,845 1 9 97 382 31,124<br />
Biological control agents 159 . 273 . . 3 . . . 98 533<br />
Soil sterilants . . 78 4 . . . . 7 . 88<br />
Sulphur 1,001 157 4,200 200 2,572 112 216 170 267 99 8,992<br />
Physical control agents 100 141 . 524 124 . 108 . . 208 1,205<br />
Growth stimulant . . . . 116 . . . . . 116<br />
All pesticides 283,338 15,874 235,467 280,830 202,006 62,136 4,469 20,119 2,541 29,236 1,136,015<br />
Table 2b Weight of pesticides applied to vegetable crops in Great Britain 2003 by crop group (kg of a.s.) - excluding seed treatments<br />
Brassicas etc. Root Peas & Onions & Carrots etc. Lettuce Sweetcorn Other root Cucurbits Other All<br />
crucifers beans leeks endive etc. vegetables vegetables crops<br />
Insecticides & nematicides 18,987 1,445 4,539 4,944 11,365 2,096 170 111 9 676 44,341<br />
Fungicides 21,988 668 5,495 112,078 22,163 17,308 . 1,309 57 2,102 183,168<br />
Herbicides 108,624 6,680 98,269 101,263 57,094 18,220 2,096 8,987 912 18,688 420,832<br />
Sodium chloride 718 . . . . . . 568 . 54,759 56,045<br />
Growth regulators . . . 6,493 900 . . . . . 7,393<br />
Molluscicides & repellents 4,599 2,080 6,576 1 3 452 . 5 32 117 13,865<br />
Biological control agents 8 . 443 . . . . . . 3 454<br />
Soil sterilants . . 33,656 1,362 . . . . 1,296 . 36,314<br />
Sulphur 3,411 768 23,036 596 13,395 850 778 912 847 381 44,975<br />
Physical control agents 419 249 . 1,310 506 . 108 . . 216 2,808<br />
Growth stimulant . . . . 116 . . . . . 116<br />
All pesticides 158,754 11,890 172,014 228,048 105,541 38,926 3,153 11,890 3,153 76,943 810,311
10<br />
Table 3 Usage of pesticides on vegetable crops in Great Britain 2003 - percentage area of crops treated with pesticides<br />
Insecticides Fungicides Sulphur Herbicides 1 & Growth Molluscicides & Biological Soil Not<br />
& nematicides desiccants regulators & repellents control agents sterilants treated<br />
Brassicas etc. 88.6 53.6 2.6 90.2 . 17.4 0.4 . 3.6<br />
Root crucifers 63.3 50.9 5.1 92.1 . 62.4 . . 2.8<br />
Peas <strong>and</strong> beans 80.7 27.7 10.2 96.5 . 6.2 0.1 < 0.1 2.0<br />
Onions <strong>and</strong> leeks 61.6 94.1 1.5 97.5 27.0 < 0.1 . < 0.1 1.3<br />
Carrots, parsnips, celery 90.4 84.9 12.4 92.4 1.4 0.1 . . 5.8<br />
Lettuce, endive etc. 84.7 88.9 2.6 96.3 . 12.9 0.1 . 1.1<br />
Sweetcorn 57.3 . 9.8 91.3 . 0.1 . . 8.1<br />
Other root vegetables 27.8 30.5 7.5 96.2 . 0.4 . . 3.7<br />
Cucurbits 3.8 27.1 9.0 79.4 . 9.2 . 0.6 15.3<br />
Other vegetables 48.0 31.0 1.8 88.2 . 8.1 1.7 . 7.2<br />
All crops 78.7 50.9 6.7 93.8 2.9 9.3 0.2 < 0.1 3.2<br />
Table 4a Usage of pesticides on vegetable crops in Great Britain 2003 - number of spray rounds applied to crops<br />
Insecticides Fungicides Sulphur Herbicides 1 & Growth Molluscicides Biological Soil All<br />
& nematicides desiccants regulators & repellents control agents sterilants pesticides<br />
Brassicas etc. 3.1 1.1 < 0.1 1.8 . 0.3 < 0.1 . 5.6<br />
Root crucifers 2.2 0.7 0.2 1.8 . 1.0 . . 5.4<br />
Peas <strong>and</strong> beans 1.0 0.7 0.1 2.0 . 0.1 < 0.1 < 0.1 3.4<br />
Onions <strong>and</strong> leeks 1.7 4.4 < 0.1 5.7 0.2 < 0.1 . < 0.1 10.7<br />
Carrots, parsnips, celery 3.8 2.8 0.2 2.9 < 0.1 < 0.1 . . 7.3<br />
Lettuce, endive etc. 2.2 2.4 < 0.1 1.8 . 0.2 < 0.1 . 5.5<br />
Sweetcorn 1.2 . 0.1 2.0 . < 0.1 . . 3.3<br />
Other root vegetables 0.7 0.4 0.1 3.0 . 0.1 . . 4.0<br />
Cucurbits 0.1 0.5 0.1 0.9 . 0.2 . < 0.1 1.7<br />
Other vegetables 0.8 0.5 < 0.1 1.9 . 0.1 < 0.1 . 3.2<br />
All crops 2.4 1.7 0.1 2.5 < 0.1 0.2 < 0.1 < 0.1 5.9<br />
1 includes use of sodium chloride as a herbicide
11<br />
Table 4b Usage of pesticides on vegetable crops in Great Britain 2003 - number of products applied to crops<br />
Insecticides Fungicides Sulphur Herbicides 1<br />
Growth Molluscicides Biological Soil All<br />
& nematicides & desiccants regulators & repellents control agents sterilants pesticides<br />
Brassicas etc. 4.5 1.4 < 0.1 2.1 . 0.3 < 0.1 . 8.3<br />
Root crucifers 2.2 0.8 0.2 2.1 . 1.0 . . 6.3<br />
Peas <strong>and</strong> beans 1.2 0.8 0.1 2.3 . 0.1 < 0.1 < 0.1 4.5<br />
Onions <strong>and</strong> leeks 1.9 8.6 < 0.1 10.1 . < 0.1 . < 0.1 20.6<br />
Carrots, parsnips, celery 4.3 3.3 0.2 4.7 . < 0.1 . . 12.5<br />
Lettuce, endive etc. 3.8 3.2 < 0.1 2.6 . 0.2 < 0.1 . 9.7<br />
Sweetcorn 1.2 . 0.1 2.3 . < 0.1 . . 3.7<br />
Other root vegetables 0.8 0.5 0.1 5.2 . 0.1 . . 6.6<br />
Cucurbits 0.1 0.5 0.1 1.3 . 0.2 . < 0.1 2.2<br />
Other vegetables 0.9 0.5 < 0.1 2.5 . 0.1 < 0.1 . 4.1<br />
All crops 3.1 2.6 2.6 3.7 . 0.2 < 0.1 < 0.1 9.6<br />
Table 4c Usage of pesticides on vegetable crops in Great Britain 2003 - number of active ingredients applied to crops<br />
Insecticides Fungicides Sulphur Herbicides 1<br />
Growth Molluscicides Biological Soil All<br />
& nematicides & desiccants regulators & repellents control agents sterilants pesticides<br />
Brassicas etc. 5.0 1.9 < 0.1 2.1 . 0.3 < 0.1 . 9.3<br />
Root crucifers 2.2 0.9 0.2 2.3 . 1.0 . . 6.6<br />
Peas <strong>and</strong> beans 1.3 0.9 0.1 3.2 . 0.1 < 0.1 < 0.1 5.5<br />
Onions <strong>and</strong> leeks 1.9 11.6 < 0.1 10.4 . < 0.1 . < 0.1 23.9<br />
Carrots, parsnips, celery 4.3 3.5 0.2 4.9 . < 0.1 . . 12.9<br />
Lettuce, endive etc. 3.8 3.5 < 0.1 2.6 . 0.2 < 0.1 . 10.1<br />
Sweetcorn 1.2 . 0.1 2.4 . < 0.1 . . 3.8<br />
Other root vegetables 0.8 0.5 0.1 5.7 . 0.1 . . 7.2<br />
Cucurbits 0.1 0.5 0.1 1.4 . 0.2 . < 0.1 2.3<br />
Other vegetables 1.0 0.6 < 0.1 2.7 . 0.1 < 0.1 . 4.4<br />
All crops 3.3 3.3 0.1 3.9 . 0.2 < 0.1 < 0.1 10.7<br />
1 includes use of sodium chloride as a herbicide
EXTENT AND QUANTITIES OF PESTICIDE FORMULATIONS USED<br />
<strong>The</strong> estimated total areas of each crop treated in Great Britain with each pesticide formulation are illustrated in Table 5,<br />
whilst the estimated total quantities of pesticide active substances used in each formulation are shown in Table 6.<br />
Herbicides accounted for 40% of the total pesticide-treated area of vegetable crops grown in Great Britain in 2003,<br />
insecticides 32%, fungicides 24%, molluscicides <strong>and</strong> repellents 3%, sulphur one percent <strong>and</strong> sodium chloride, growth<br />
regulators, physical control agents, biological control agents, growth stimulants <strong>and</strong> soil sterilants less than one percent<br />
each. In contrast, herbicides accounted for 52% of the total weight of pesticide active substances applied, fungicides<br />
23%, sodium chloride 7%, sulphur 6%, insecticides 5%, soil sterilants 4%, molluscicides & repellents 2%, growth<br />
regulators one percent, physical control agents, growth stimulants <strong>and</strong> biological control agents less than one percent.<br />
<strong>The</strong> most extensively-used herbicide formulations were: glyphosate (10% of all herbicide applications) used on all crops<br />
prior to drilling or planting; cyanazine (9%) used extensively on peas & beans <strong>and</strong> onions & leeks; ioxynil (8%) used<br />
mainly on onions & leeks; propachlor, used extensively (8%) on onions & leeks; pendimethalin (7%) used extensively on<br />
onions & leeks <strong>and</strong> carrots, parsnips & celery; <strong>and</strong> linuron (6%) used mainly on carrots, parsnips, & celery.<br />
Pyrethroids were the most extensively-used insecticides, accounting for 51% of the insecticide-treated area, followed by<br />
carbamates 26%, pyrethroid/carbamates 9% <strong>and</strong> organophosphates 4%. Five insecticides accounted for approximately<br />
81% of the total insecticide-treated area of all vegetable crops: lambda-cyhalothrin (31%); pirimicarb (23%);<br />
deltamethrin (11%); lambda-cyhalothrin/pirimicarb (6%); <strong>and</strong> cypermethrin (5%). Other extensively-used insecticides<br />
included deltamethrin/pirimicarb, triazamate <strong>and</strong> nicotine. Aldicarb was the only nematicide recorded.<br />
<strong>The</strong> most extensively-used fungicide formulations applied as sprays were: azoxystrobin (used principally on carrots,<br />
vining peas <strong>and</strong> dry bulb onions); tebuconazole (used principally on carrots, Brussels sprouts, parsnips <strong>and</strong> leeks);<br />
dimethomorph/mancozeb (used entirely on dry-bulb onions); copper oxychloride (predominantly applied to dry-bulb<br />
onions, carrots & calabrese(as a bactericide)); <strong>and</strong> chlorothalonil (predominantly used on dry-bulb onions, Brussels<br />
sprouts <strong>and</strong> salad onions).<br />
Most sulphur applications were made to vining peas (45% of the total used), carrots (15%) or parsnips (14%).<br />
Use of the growth regulator maleic hydrazide was confined mainly, 95% of the treated area, to the bulb onion crop to<br />
prevent sprouting in store. <strong>The</strong> remaining 5% was used on carrots <strong>and</strong> parsnips in order to prevent re-growth during the<br />
winter months.<br />
Usage of molluscicides was confined mainly to peas & beans, comprising 42% of the total molluscicide & repellent area,<br />
brassicas etc. a further 38%, root crucifers 12% <strong>and</strong> lettuce, endive etc. 6%. Metaldehyde (90%) <strong>and</strong> methiocarb (10%)<br />
were the two most commonly used molluscicides.<br />
Usage of other pesticides was minimal, with biological control being confined to the use of Bacillus thuringiensis <strong>and</strong><br />
Phytoseiulus persimilis. <strong>The</strong> soil sterilant dazomet was applied to less than one percent of the area treated but this<br />
accounted for 4% of the total weight applied, reflecting the relatively high rates of application that are necessary.<br />
12
13<br />
Table 5 Usage of pesticides on vegetable crops grown in Great Britain, 2003 (spray hectares)<br />
Fungicides<br />
Brassicas etc. Root Peas & Onions & Carrots etc. Lettuce Sweetcorn Other root Cucurbits Other All<br />
crucifers beans leeks endive etc. vegetables vegetables crops<br />
Azoxystrobin 5,387 1,013 12,507 13,200 13,566 5,948 . 264 . 1,010 52,894<br />
Boscalid/pyraclostrobin 5,973 . . . . . . . . 16 5,989<br />
Chlorothalonil 7,099 1 479 15,523 996 . . 237 . . 24,336<br />
Chlorothalonil/metalaxyl 1,897 . 1,194 4,033 . . . . . . 7,124<br />
Chlorothalonil/metalaxyl-M 3,989 1 337 9,894 . . . . . . 14,220<br />
Copper oxychloride 1<br />
1,614 . . 21,590 2,634 . . 806 . 78 26,723<br />
Difenoconazole 15,513 . . . 554 . . 172 . 138 16,378<br />
Dimethomorph/mancozeb . . . 29,508 . . . . . . 29,508<br />
Fenpropimorph 92 . . 266 7,200 . . 234 . . 7,792<br />
Fosetyl-aluminium . . . 520 . 1,756 . . . 486 2,762<br />
Iprodione 453 . 563 2,797 . 3,857 . . . 348 8,019<br />
Iprodione/thiophanate-methyl . . . . 4,899 . . . . . 4,899<br />
Mancozeb . . . 12,683 . 4,847 . . . 115 17,645<br />
Mancozeb/metalaxyl-M 4,282 132 . . . 2,347 . . . 446 7,208<br />
Metalaxyl-M . . . 1,648 7,063 . . 169 . 141 9,022<br />
Tebuconazole 9,854 445 657 4,572 17,925 11 . . . 711 34,174<br />
Thiram . . . . . 702 . . . . 702<br />
Triadimenol 1,291 294 . . 424 . . . . . 2,009<br />
Vinclozolin . . 3,591 . . . . . . . 3,591<br />
Other 2 fungicides 3 162 109 295 1,203 173 64 . . 528 22 2,557<br />
All fungicides 57,607 1,994 19,625 117,437 55,434 19,533 . 1,883 528 3,512 277,552<br />
Sulphur 1,001 157 4,200 200 2,572 112 216 170 267 99 8,992<br />
1 Copper oxychloride is also used against bacterial diseases, e.g. on calabrese<br />
2 Throughout all tables, “Other” refers to chemicals grouped together because they were applied to less than 0.1% of the total area treated with pesticides<br />
3 Other fungicides include benomyl, bupirimate, bupirimate/triforine, carbendazim/chlorothalonil, carbendazim/iprodione, carbendazim/metalaxyl, chlorothalonil/fenpropimorph, chlorothalonil/vinclozolin, copper<br />
oxychloride/metalaxyl, copper sulphate, cupric ammonium carbonate, dimethomorph/mancozeb, epoxiconazole/kresoxim-methyl, fenbuconazole/prochloraz, ferbam/maneb/zineb, fluazinam, imazalil, maneb/zinc, prochloraz,<br />
propamocarb hydrochloride, propiconazole, pyrazophos, quintozene, spiroxamine, tebuconazole/triadimenol <strong>and</strong> triadimefon.
14<br />
Table 5 (cont) Usage of pesticides on vegetable crops grown in Great Britain, 2003 (spray hectares)<br />
Brassicas etc. Root Peas & Onions & Carrots etc. Lettuce Sweetcorn Other root Cucurbits Other All<br />
crucifers beans leeks endive etc. vegetables vegetables crops<br />
Growth regulators<br />
Maleic hydrazide 0 0 0 3,275 170 0 0 0 0 0 3,445<br />
Herbicides<br />
Atrazine . . . . . . 1,252 . . . 1,252<br />
Bentazone . . 1,835 2,155 . . . . . . 3,991<br />
Bentazone/MCPB . . 22,785 . . . . . . . 22,785<br />
Chloridazon . . . 10,777 . . . . . . 10,777<br />
Chlorpropham 8 . . 3,078 . 5,464 . . . 76 8,625<br />
Chlorpropham/fenuron . . . 760 . . . 1 . 702 1,462<br />
Chlorpropham/pentanochlor . . . . 1,767 . . . . 145 1,911<br />
Chlorthal-dimethyl 639 3 375 623 . . . . . 59 1,698<br />
Clomazone . . . . 1,654 . . . . . 1,654<br />
Clopyralid 1,337 50 . 1,845 . . 2 574 . 852 4,660<br />
Cyanazine 1,055 . 27,412 11,957 . . . . . . 40,424<br />
Cycloxydim 50 . 1,484 607 25 . . . . . 2,167<br />
Diquat/paraquat 818 83 2,667 3,166 874 231 3 28 71 1,387 9,329<br />
Ethofumesate . . . 1,393 . . . 2,922 . . 4,315<br />
Fluazifop-P-butyl . . 53 1,119 260 . . 122 . . 1,553<br />
Fluroxypyr . . . 7,618 . . . . . . 7,618<br />
Fomesafen . . 2,766 . . . . . . . 2,766<br />
Fomesafen/terbutryn . . 8,290 . . . . . . . 8,290<br />
Glyphosate 8,132 877 24,904 5,529 3,206 1,348 265 546 178 1,849 46,834<br />
Ioxynil 9 . . 37,731 57 . . . . . 37,797<br />
Lenacil . . . . . . . 1,073 . 865 1,938<br />
Linuron . . . 1,240 24,477 . . 300 . 1,445 27,463<br />
MCPA/MCPB . . 4,735 . . . . . . . 4,735<br />
MCPB . . 3,560 . . . . . . . 3,560<br />
Metamitron . . . . . . . 3,037 . 1,161 4,198<br />
Metazachlor 15,506 1,404 . . . . . . . . 16,910<br />
Metoxuron . . . . 14,389 . . . . . 14,389<br />
Metribuzin . . . . 1,899 . . . . 172 2,071<br />
Paraquat 471 . 55 360 63 10 . 23 90 412 1,483<br />
Pendimethalin 1,431 2 151 17,898 8,597 245 210 . 7 956 29,498<br />
Pentanochlor . . . . 3,854 . . 3 . 287 4,144<br />
Phenmedipham . . . . . . . 4,539 . 385 4,923<br />
Prometryn . . . 2,263 3,755 . . 1 . 308 6,327<br />
Propachlor 11,974 639 2 16,305 10 6,305 . . . 229 35,463<br />
2
15<br />
Table 5 (cont) Usage of pesticides on vegetable crops grown in Great Britain, 2003 (spray hectares)<br />
Brassicas etc. Root Peas & Onions & Carrots etc. Lettuce Sweetcorn Other root Cucurbits Other All<br />
crucifers beans leeks endive etc. vegetables vegetables crops<br />
Herbicides (cont)<br />
Propaquizafop 33 . . 3,216 5,685 . . 315 . 704 9,953<br />
Propyzamide 2 . 3 . . 1,440 . 109 596 151 2,301<br />
Tepraloxydim . . 2,914 5,209 913 . . 22 . . 9,059<br />
Terbuthylazine/terbutryn . . 16,433 . . . . . . . 16,433<br />
Trifluralin 19,723 1,979 591 9 726 17 . 78 6 719 23,850<br />
Triflusulfuron-methyl . . . . . . . 1,552 . . 1,552<br />
Other herbicides 1 2,003 162 646 1,652 408 . 934 943 654 2,071 9,473<br />
All herbicides 63,187 5,198 121,662 136,510 72,621 15,060 2,666 16,183 1,602 14,747 449,436<br />
Sodium chloride 4 . . . . . . 5 . 187 195<br />
1 Other herbicides includes aziprotryne, bromoxynil, chloridazon/propachlor, chlorthal-dimethyl/propachlor, cyanazine/pendimethalin, desmedipham/ethofumesate/phenmedipham, dichlobenil, diphenamid, diquat, diuron,<br />
ethofumesate/phenmedipham, glufosinate-ammonium, isoxaben, MCPA, pyridate, simazine, sodium monochloroacetate, tebutam <strong>and</strong> terbacil.
16<br />
Table 5 (cont) Usage of pesticides on vegetable crops grown in Great Britain, 2003 (spray hectares)<br />
Brassicas etc. Root Peas & Onions & Carrots etc. Lettuce Sweetcorn Other root Cucurbits Other All<br />
crucifers beans leeks endive etc. vegetables vegetables crops<br />
Biological control agents<br />
Other biological control agents 1 159 . 274 . . 3 . . . 98 533<br />
Insecticides & nematicides<br />
Aldicarb . . . 2,258 6,700 . . . . . 8,958<br />
Alpha-cypermethrin 5,773 . 1 . . . . 11 . 217 6,002<br />
Bifenthrin 7,528 . . . . . . . . . 7,528<br />
Chlorfenvinphos . 2,126 . . . . . . . . 2,126<br />
Chlorpyrifos 4,935 134 . 656 8 7 10 . . . 5,749<br />
Cypermethrin 8,821 72 1,995 14 3,529 3,454 . . . 1,035 18,919<br />
Deltamethrin 7,186 1,806 2,086 16,499 4,203 5,172 54 6 . 3,628 40,641<br />
Deltamethrin/pirimicarb 12,939 . 334 . . . . . . 55 13,328<br />
Dimethoate 2,944 . . 3,178 . 17 . . . . 6,139<br />
Lambda-cyhalothrin 34,178 4 26,796 189 43,976 5,013 235 1,218 2 1,137 112,748<br />
Lambda-cyhalothrin/pirimicarb 6,381 . 12,598 . 118 305 . . . 727 20,130<br />
Nicotine 6,736 . . 8 123 4,981 . . . 354 12,202<br />
Pirimicarb 30,880 443 32,052 12 12,185 5,673 1,180 632 39 2,276 85,371<br />
Pymetrozine 7,218 2 . . . 957 . . . 558 8,735<br />
Triazamate 12,589 . 57 . . . . . . . 12,645<br />
Other insecticides & nematicides 1<br />
1,217 6 682 66 115 3 . 2 . 17 2,108<br />
All insecticides & nematicides 149,325 4,593 76,601 22,880 70,956 25,583 1,478 1,869 41 10,004 363,329<br />
1 Other biological control agents includes Bacillus thuringiensis <strong>and</strong> Phytoseiulus persimilis.<br />
2 Other insecticides includes carbosulfan, diflubenzuron, fatty acids, gamma-HCH, malathion, rotenone, sugar, triazophos, unspecified insecticides <strong>and</strong> zeta-cypermethrin.
17<br />
Table 5 (cont) Usage of pesticides on vegetable crops grown in Great Britain, 2003 (spray hectares)<br />
Molluscicides & repellents<br />
Brassicas etc. Root Peas & Onions & Carrots etc. Lettuce Sweetcorn Other root Cucurbits Other All<br />
crucifers beans leeks endive etc. vegetables vegetables crops<br />
Metaldehyde 9,877 3,785 12,652 2 1 1,348 . 7 76 348 28,095<br />
Methiocarb 2,034 5 372 . 9 497 1 . 20 33 2,972<br />
Other molluscicides & repellents 1<br />
42 1 6 1 3 . . 1 1 1 56<br />
All molluscicides & repellents 11,954 3,791 13,029 2 13 1,845 1 9 97 382 31,124<br />
Soil sterilants<br />
Dazomet<br />
Molluscicides & repellents<br />
. . 78 4 . . . . 7 . 89<br />
Growth stimulant<br />
Trichoderma spp. . . . . 116 . . . . . 116<br />
Physical control agents<br />
Natural plant extracts 2<br />
1 Other molluscicides & repellents were unspecified molluscicides<br />
2 Natural plant extracts were based on garlic<br />
100 141 . 524 124 . 108 . . 209 1,206
18<br />
Table 6 Usage of pesticides on vegetable crops grown in Great Britain, 2003 (kg active substance applied)<br />
Fungicides<br />
Brassicas etc. Root Peas & Onions & Carrots etc. Lettuce Sweetcorn Other root Cucurbits Other All<br />
crucifers beans leeks endive etc. vegetables vegetables crops<br />
Azoxystrobin 1,014 149 2,409 2,288 2,859 1,337 . 51 . 173 10,279<br />
Boscalid/pyraclostrobin 1,831 . . . . . . . . 5 1,836<br />
Chlorothalonil 7,243 1 467 13,582 1,454 . . 340 . . 23,087<br />
Chlorothalonil/metalaxyl 1,666 . 750 3,459 . . . . . . 5,874<br />
Chlorothalonil/metalaxyl-M 2,723 1 198 9,076 . . . . . . 11,998<br />
Copper oxychloride 1<br />
1,162 . . 18,289 2,294 . . 758 . 10 22,512<br />
Difenoconazole 1,099 . . . 69 . . 16 . 15 1,200<br />
Dimethomorph/mancozeb . . . 42,730 . . . . . . 42,730<br />
Fenpropimorph 52 . . 199 4,663 . . 134 . . 5,048<br />
Fosetyl-aluminium 2 . . 834 . 3,122 . . . 952 4,910<br />
Iprodione 233 . 157 863 . 682 . . . 139 2,075<br />
Iprodione/thiophanate-methyl . . . . 3,055 . . . . . 3,055<br />
Mancozeb . . . 19,805 . 7,876 . . . 158 27,838<br />
Mancozeb/metalaxyl-M 3,225 135 . . . 3,033 . . . 525 6,917<br />
Metalaxyl-M . . . 100 3,815 . . 10 . 8 3,933<br />
Tebuconazole 1,377 72 107 748 3,653 1 . . . 94 6,052<br />
Thiram . . . . . 1,092 . . . . 1,092<br />
Triadimenol 155 37 . . 51 . . . . . 243<br />
Vinclozolin . . 1,295 . . . . . . . 1,294<br />
Other fungicides 2<br />
207 273 113 107 249 165 . . 57 24 1,195<br />
All fungicides 21,988 668 5,495 112,079 22,163 17,308 . 1,309 57 2,102 183,168<br />
Sulphur 3,411 768 23,036 596 13,395 850 778 912 847 381 44,975<br />
1 Copper oxychloride is also used against bacterial diseases, e.g. on calabrese<br />
2 Other fungicides includes benomyl, bupirimate, bupirimate/triforine, carbendazim/chlorothalonil, carbendazim/iprodione, carbendazim/metalaxyl, chlorothalonil/fenpropimorph, chlorothalonil/vinclozolin, copper<br />
oxychloride/metalaxyl, copper sulphate, cupric ammonium carbonate, dimethomorph/mancozeb, epoxiconazole/kresoxim-methyl, fenbuconazole/prochloraz, ferbam/maneb/zineb, fluazinam, imazalil, maneb/zinc, prochloraz,<br />
propamocarb hydrochloride, propiconazole, pyrazophos, quintozene, spiroxamine, tebuconazole/triadimenol <strong>and</strong> triadimefon.
19<br />
Table 6 (cont) Usage of pesticides on vegetable crops grown in Great Britain, 2003 (kg active substance applied)<br />
Brassicas etc. Root Peas & Onions & Carrots etc. Lettuce Sweetcorn Other root Cucurbits Other All<br />
crucifers beans leeks endive etc. vegetables vegetables crops<br />
Growth regulators<br />
Maleic hydrazide . . . 10,455 . . . . . . 10,455<br />
Herbicides & desiccants<br />
Atrazine . . . . . . 1,144 . . . 1,144<br />
Bentazone . . 1,035 868 . . . . . . 1,903<br />
Bentazone/MCPB . . 30,337 . . . . . . . 30,337<br />
Chloridazon . . . 4,018 . . . . . . 4,018<br />
Chlorpropham 9 . . 2,397 . 4,485 . . . 70 6,961<br />
Chlorpropham/fenuron . . . 203 . . . 8 . 4,918 5,128<br />
Chlorpropham/pentanochlor . . . . 1,594 . . . . 205 1,799<br />
Chlorthal-dimethyl 1,757 15 1,165 2,732 . . . . 1 203 5,873<br />
Clomazone . . . . 148 . . . . . 148<br />
Clopyralid 155 5 . 113 . . . 43 . 65 381<br />
Cyanazine 812 . 6,598 1,439 . . 1 . . . 8,850<br />
Cycloxydim 7 . 159 104 5 . . . . . 274<br />
Diquat/paraquat 557 58 1,021 1,476 281 163 3 18 51 793 4,419<br />
Ethofumesate . . . 369 . . . 946 . . 1,315<br />
Fluazifop-P-butyl . . 3 241 47 . . 18 . . 309<br />
Fluroxypyr . . . 500 . . . . . . 500<br />
Fomesafen . . 397 . . . . . . . 397<br />
Fomesafen/terbutryn . . 8,753 . . . . . . . 8,753<br />
Glyphosate 7,902 1,030 21,859 5,336 3,831 1,619 316 639 226 2,236 44,994<br />
Ioxynil 3 . . 2,881 12 . . . . . 2,896<br />
Lenacil . . . . . . . 276 . 977 1,253<br />
Linuron . . . 117 11,292 . . 77 . 819 12,305<br />
MCPA/MCPB . . 2,089 . . . . . . . 2,089<br />
MCPB . . 6,283 . . . . . . . 6,283<br />
Metamitron . . . . . . . 4,874 . 1,014 5,888<br />
Metazachlor 10,541 705 . . . . . . . . 11,246
20<br />
Table 6 (cont) Usage of pesticides on vegetable crops grown in Great Britain, 2003 (kg active substance applied)<br />
Herbicides & desiccants cont.<br />
Brassicas etc. Root Peas & Onions & Carrots etc. Lettuce Sweetcorn Other root Cucurbits Other All<br />
crucifers beans leeks endive etc. vegetables vegetables crops<br />
Metoxuron . . . . 18,372 . . . . . 18,372<br />
Metribuzin . . . . 668 . . . . 116 783<br />
Paraquat 269 . 33 262 37 7 . 14 47 339 1,008<br />
Pendimethalin 1,850 2 176 8,767 12,815 296 250 . 10 1,228 25,394<br />
Pentanochlor . . . . 3,857 . . 7 . 216 4,080<br />
Phenmedipham . . . . . . . 1,388 . 47 1,436<br />
Prometryn . . . 428 2,687 . . 1 . 235 3,351<br />
Propachlor 49,981 2,545 8 59,433 29 10,124 . . . 823 122,944<br />
Propaquizafop 2 . . 255 459 . . 21 . 37 775<br />
Propyzamide 1 . 2 . . 1,513 . 130 410 178 2,233<br />
Tepraloxydim . . 135 309 64 . . 2 . . 510<br />
Terbuthylazine/terbutryn . . 17,502 . . . . . . . 17,502<br />
Trifluralin 18,002 1,673 323 10 615 13 . 81 7 645 21,369<br />
Triflusulfuron-methyl . . . . . . . 12 . . 12<br />
Other herbicides 1 17,496 647 392 9,006 280 0 382 999 160 58,283 87,645<br />
All herbicides 108,624 6,680 98,269 101,263 57,094 18,220 2,096 8,987 912 18,688 420,832<br />
Sodium chloride 718 . . . . . . 568 . 54,759 56,045<br />
1 Other herbicides include aziprotryne, bromoxynil, chloridazon/propachlor, chlorthal-dimethyl/propachlor, cyanazine/pendimethalin, desmedipham/ethofumesate/phenmedipham, dichlobenil, diphenamid, diquat, diuron,<br />
ethofumesate/phenmedipham, glufosinate-ammonium, isoxaben, MCPA, pyridate, simazine, sodium monochloroacetate, tebutam <strong>and</strong> terbacil.
21<br />
Table 6 (cont) Usage of pesticides on vegetable crops grown in Great Britain, 2003 (kg active substance applied)<br />
Brassicas etc. Root Peas & Onions & Carrots etc. Lettuce Sweetcorn Other root Cucurbits Other All<br />
crucifers beans leeks endive etc. vegetables vegetables crops<br />
Biological control agents<br />
Other biological control agents 1<br />
7 . 1 . .
22<br />
Table 6 (cont) Usage of pesticides on vegetable crops grown in Great Britain, 2003 (kg active substance applied)<br />
Molluscicides & repellents<br />
Brassicas etc. Root Peas & Onions & Carrots etc. Lettuce Sweetcorn Other root Cucurbits Other All<br />
crucifers beans leeks endive etc. vegetables vegetables crops<br />
Metaldehyde 4,115 2,079 6,494 1 . 397 . 5 28 110 13,230<br />
Methiocarb 303 1 82 . 2 55 . . 4 7 454<br />
Other molluscicides & repellents 1<br />
182 . . . . . . . . . 182<br />
All molluscicides & repellents 4,599 2,080 6,576 1 3 452 . 5 32 117 13,866<br />
Soil sterilants<br />
Dazomet<br />
. . 33,765 1,362 . . . . 1,315 . 36,441<br />
Growth stimulants<br />
Trichoderma spp. . . . . 116 . . . . . 116<br />
Physical control agents<br />
Natural plant extracts 420 249 . 1,310 506 . 108 . . 217 2,809<br />
1 Other molluscicides & repellents were unspecified molluscicides.
EXTENT AND QUANTITIES OF ACTIVE SUBSTANCES USED<br />
<strong>The</strong> 50 pesticide active substances used most extensively on all vegetable crops in Great Britain in 2003 are listed in<br />
descending order of area treated in Table 7. A similar list showing the 50 most used active substances in descending<br />
order of weight applied is presented in Table 8. <strong>The</strong> rating of active substances varies in each list depending upon their<br />
extent of usage, rate of application, relative activity per unit weight <strong>and</strong> their relative proportions in formulated products,<br />
especially for those products which contain more than one active substance.<br />
Active substances showing major increases in area treated included dimethomorph <strong>and</strong> triazamate. Usage of bifenthrin<br />
increased by over seven times compared with 1999, that of alpha-cypermethrin by over three times, whereas the areas<br />
treated with metalaxyl-M <strong>and</strong> mancozeb more than doubled. Usage of azoxystrobin, tepraloxydim, pymetrozine,<br />
boscalid <strong>and</strong> pyraclostrobin were encountered for the first time on vegetable crops. Significant reductions in use were<br />
seen in dimethoate (down 89%), metalaxyl (down by 86% <strong>and</strong> now replaced by metalaxyl-M) <strong>and</strong> cypermethrin (56%).<br />
<strong>The</strong> ten most extensively-used active substances by area treated included four herbicides, three insecticides <strong>and</strong> three<br />
fungicides. Usage of lambda-cyhalothrin, the most widely used insecticide, accounted for 43% of the principal three<br />
insecticides, an increase of 17% compared with 1999. Over half of the pesticide active substances included in the<br />
principal ten by area treated showed an increase in usage compared with 1999. Usage of glyphosate increased by 49%<br />
compared with 1999, whereas all other herbicides in the principal ten by area treated showed a decrease in use. Usage of<br />
mancozeb, principally on dry-bulb onions, more than doubled compared with 1999, whilst that of azoxystrobin, only<br />
registered for use in vegetable crops since the previous survey, appeared at number 5 by area treated.<br />
Propachlor, which decreased in weight by 12% compared with 1999, was the principal active substance applied by<br />
weight, with most applications being made to onions & leeks <strong>and</strong> brassicas etc. Compared with 1999, the use of<br />
mancozeb had more than doubled in terms of weight applied, in line with the increased treated area. <strong>The</strong> use of the<br />
commodity chemical sodium chloride, applied as a herbicide mainly to asparagus <strong>and</strong> beetroot, declined by 75%<br />
compared with 1999. Some of this use may have been applied additionally as a plant nutrient but could not be separated<br />
from its use as a herbicide. <strong>The</strong> remaining principal seven active substances applied by weight included three herbicides,<br />
sulphur, two fungicides <strong>and</strong> a soil sterilant.<br />
<strong>The</strong> most extensively-used insecticide active substance by area treated was lambda-cyhalothrin, being used on almost all<br />
crops but predominantly on carrots, parsnips & celery where it accounted for 62% of the total insecticide-treated area,<br />
<strong>and</strong> brassicas etc. where it comprised 23%. Next was pirimicarb, increasing by 56% compared with 1999, <strong>and</strong> accounting<br />
for 80% of the sweetcorn insecticide-treated area, 42% of the pea & bean insecticide-treated area <strong>and</strong> 21% of the<br />
insecticide-treated area of brassicas etc. Also popular were cypermethrin, decreasing by 56% compared with 1999 <strong>and</strong><br />
being used predominantly on brassicas etc., triazamate, used almost exclusively on brassicas, <strong>and</strong> increasing dramatically<br />
compared with 1999 <strong>and</strong> aldicarb, used solely on carrots, parsnips, dry-bulb onions <strong>and</strong> leeks, but declining by 16%<br />
compared with 1999.<br />
By weight applied, pirimicarb was the main insecticide active substance, being 16 th in the principal 50. <strong>The</strong> amount used<br />
had increased by 57% compared with the last survey.<br />
<strong>The</strong> four major herbicide active substances encountered in the principal ten by area were: glyphosate, showing an<br />
increase of 49% compared with the previous survey <strong>and</strong> being encountered mainly as a pre-drilling or pre-planting<br />
treatment to all crop groups; cyanazine, where usage decreased slightly, by 4%, being confined almost entirely to peas &<br />
beans <strong>and</strong> onions & leeks; ioxynil, its usage decreasing by 18%, <strong>and</strong> being used almost exclusively on onions & leeks;<br />
<strong>and</strong> propachlor, where usage again decreased slightly, by 8%, being used mainly on onions & leeks <strong>and</strong> brassicas.<br />
23
By weight applied, four registered herbicides appeared in the principal 10 active substances reflecting their higher rates<br />
of application in comparison with other pesticides. <strong>The</strong> usage of propachlor decreased by 12%, whilst that of glyphosate<br />
has increased by 65% compared with 1999, in line with their changes in areas treated.<br />
<strong>The</strong> most extensively-used fungicide active substances by area treated were mancozeb, azoxystrobin, chlorothalonil,<br />
tebuconazole, metalaxyl-M <strong>and</strong> dimethomorph. Chlorothalonil usage was 30% less than in the last survey, being applied<br />
primarily to onions & leeks <strong>and</strong> brassicas. Usage of tebuconazole decreased by 12% compared with 1999, being applied<br />
primarily to carrots, parsnips & celery <strong>and</strong> brassicas. Usage of metalaxyl-M increased by 139% <strong>and</strong> was applied<br />
primarily to onions & leeks, carrots, parsnips & celery <strong>and</strong> brassicas. Usage of dimethomorph, used on only 64 hectares<br />
in 1999, rose to almost 30,000 treated hectares of onions & leeks in 2003.<br />
Sulphur, the 37 th most important active substance by area treated, was the fifth most important by weight applied,<br />
reflecting its relatively high rate of application. Although usage was mainly on peas & beans <strong>and</strong> carrots, parsnips &<br />
celery, it was recorded as being used on all crops.<br />
Usage of the molluscicide metaldehyde increased by 35% in terms of area treated <strong>and</strong> 46% by weight applied compared<br />
with the previous survey in 1999.<br />
Compared with 1999, dazomet, the only soil sterilant recorded, decreased by 19% in terms of treated area <strong>and</strong> by 55% on<br />
weight applied.<br />
24
Table 7 Estimated area (ha) of application of the fifty most extensively-used active substances on all vegetable crops surveyed in 2003 in Great Britain<br />
Active substance Area treated (ha) Area treated 1999 (ha) % change on 1999 Movement<br />
1 Lambda-cyhalothrin 132,877 114,026 17 ↑<br />
2 Pirimicarb 118,829 76,307 56 ↑<br />
3 Mancozeb 54,378 25,839 110 ↑<br />
4 Deltamethrin 53,969 44,339 22 ↑<br />
5 Azoxystrobin 52,917 . ↑<br />
6 Glyphosate 46,834 31,431 49 ↑<br />
7 Chlorothalonil 45,680 65,271 -30 ↓<br />
8 Cyanazine 40,475 42,124 -4 ↓<br />
9 Ioxynil 37,797 45,973 -18 ↓<br />
10 Propachlor 37,112 40,153 -8 ↓<br />
11 Tebuconazole 34,174 38,751 -12 ↓<br />
12 MCPB 31,080 30,122 3 ↑<br />
13 Metalaxyl-M 30,450 12,733 139 ↑<br />
14 Pendimethalin 29,549 29,622 < -1 ↓<br />
15 Dimethomorph 29,508 64 > 1000 ↑<br />
16 Metaldehyde 28,095 20,789 35 ↑<br />
17 Linuron 27,463 30,699 -11 ↓<br />
18 Bentazone 26,776 20,260 32 ↑<br />
19 Copper oxychloride 26,723 20,081 33 ↑<br />
20 Terbutryn 24,723 27,345 -10 ↓<br />
21 Trifluralin 23,850 22,380 7 ↑<br />
22 Cypermethrin 18,919 42,648 -56 ↓<br />
23 Metazachlor 16,910 16,293 4 ↑<br />
24 Terbuthylazine 16,433 23,123 -29 ↓<br />
25 Difenoconazole 16,378 9,188 78 ↑<br />
26 Metoxuron 14,389 17,047 -16 ↓<br />
27 Iprodione 12,918 17,029 -24 ↓<br />
28 Triazamate 12,645 16 > 1000 ↑<br />
29 Nicotine 12,202 9,032 35 ↑<br />
30 Chlorpropham 11,999 9,433 27 ↑<br />
31 Chloridazon 11,780 11,125 6 ↑<br />
32 Fomesafen 11,055 6,389 73 ↑<br />
33 Paraquat 10,812 13,047 -17 ↓<br />
34 Propaquizafop 9,953 10,366 -4 ↓<br />
35 Diquat 9,901 10,483 -6 ↓<br />
36 Tepraloxydim 9,059 . ↑<br />
37 Sulphur 8,992 12,783 -30 ↓<br />
38 Aldicarb 8,958 10,717 -16 ↓<br />
39 Pymetrozine 8,735 . ↑<br />
40 Fenpropimorph 7,815 10,593 -26 ↓<br />
41 Fluroxypyr 7,618 8,218 -7 ↓<br />
42 Bifenthrin 7,528 1,014 643 ↑<br />
43 Metalaxyl 7,124 50,257 -86 ↓<br />
44 Prometryn 6,327 6,532 -3 ↓<br />
45 Dimethoate 6,139 57,279 -89 ↓<br />
46 Pentanochlor 6,055 6,468 -6 ↓<br />
47 Alpha-cypermethrin 6,002 1,723 248 ↑<br />
48 Boscalid 5,989 . ↑<br />
49 Pyraclostrobin 5,989 . ↑<br />
50 Phenmedipham 5,853 3,907 50 ↑<br />
25
Table 8 Estimated amount (kg) of application of the fifty most extensively-used active substances on all vegetable crops surveyed in 2003 in Great<br />
Britain<br />
Active substance Amount used (kg) Amount used 1999 (kg) % change on 1999 Movement<br />
1 Propachlor 128,014 145,363 -12 ↓<br />
2 Mancozeb 72,774 34,261 112 ↑<br />
3 Sodium chloride 56,045 222,490 -75 ↓<br />
4 Glyphosate 44,994 27,191 65 ↑<br />
5 Sulphur 44,975 61,884 -27 ↓<br />
6 Chlorothalonil 39,356 59,359 -34 ↓<br />
7 Dazomet 36,314 80,963 -55 ↓<br />
8 Pendimethalin 25,458 27,274 -7 ↓<br />
9 MCPB 23,257 18,977 23 ↑<br />
10 Copper oxychloride 22,512 18,637 21 ↑<br />
11 Trifluralin 21,369 20,820 3 ↑<br />
12 Terbutryn 19,543 21,958 -11 ↓<br />
13 Metoxuron 18,372 25,596 -28 ↓<br />
14 Sodium monochloroacetate 18,137 31,389 -42 ↓<br />
15 Bentazone 17,071 11,855 44 ↑<br />
16 Pirimicarb 16,007 10,172 57 ↑<br />
17 Metaldehyde 13,230 9,064 46 ↑<br />
18 Linuron 12,305 15,178 -19 ↓<br />
19 Aldicarb 12,074 15,160 -20 ↓<br />
20 Chlorpropham 11,749 9,971 18 ↑<br />
21 Metazachlor 11,246 11,252 < -1 ↓<br />
22 Azoxystrobin 10,281 . ↑<br />
23 Cyanazine 8,886 14,587 -39 ↓<br />
24 Maleic hydrazide 7,393 10,445 -29 ↓<br />
25 Chlorthal-dimethyl 7,374 5,733 29 ↑<br />
26 Tebuconazole 6,052 6,681 -9 ↓<br />
27 Metamitron 5,888 2,932 101 ↑<br />
28 Pentanochlor 5,279 6,153 -14 ↓<br />
29 Terbuthylazine 5,253 7,369 -29 ↓<br />
30 Metalaxyl-M 5,178 4,333 19 ↑<br />
31 Fenpropimorph 5,054 7,450 -32 ↓<br />
32 Fosetyl-aluminium 4,910 2,969 65 ↑<br />
33 Chloridazon 4,799 4,158 15 ↑<br />
34 Chlorpyrifos 4,764 6,770 -30 ↓<br />
35 Dimethomorph 4,320 10 > 1000 ↑<br />
36 Paraquat 3,659 4,453 -18 ↓<br />
37 Iprodione 3,603 5,370 -33 ↓<br />
38 Prometryn 3,351 2,795 20 ↑<br />
39 Ioxynil 2,896 4,609 -37 ↓<br />
40 Natural plant extracts 2,808 . ↑<br />
41 Dimethoate 2,371 22,564 -89 ↓<br />
42 Propyzamide 2,233 4,332 -48 ↓<br />
43 Diquat 1,998 2,305 -13 ↓<br />
44 Nicotine 1,981 1,405 41 ↑<br />
45 Fomesafen 1,856 1,243 49 ↑<br />
46 Pymetrozine 1,670 . ↑<br />
47 Phenmedipham 1,654 1,244 33 ↑<br />
48 Thiophanate-methyl 1,535 1,628 -6 ↓<br />
49 Ethofumesate 1,524 770 98 ↑<br />
50 Boscalid 1,468 . ↑<br />
26
PESTICIDE USAGE ON BRASSICAS<br />
A full list of the crops included in this crop group can be found in Appendix 1, however calabrese, cauliflowers (autumn,<br />
summer & winter) <strong>and</strong> Brussels sprouts were the main crops encountered. Brassicas received, on average, 3 insecticide<br />
sprays, 2 herbicides <strong>and</strong> 1 fungicide. Insecticides accounted for 53% of the pesticide-treated area, herbicides 22%,<br />
fungicides 20%, molluscicides 4% <strong>and</strong> sulphur, biological control agents <strong>and</strong> physical control agents less than one<br />
percent each. However, by weight applied herbicides comprised 69% of the total weight of pesticides applied, fungicides<br />
14%, insecticides 12%, molluscicides 3%, sulphur 2% <strong>and</strong> physical <strong>and</strong> biological control agents less than one percent<br />
each.<br />
<strong>The</strong> charts below illustrate the timing of applications made to the two main crops in the Brassicas etc. crop group.<br />
Percentage of applications<br />
Percentage of applications<br />
60<br />
50<br />
40<br />
30<br />
20<br />
10<br />
0<br />
35<br />
30<br />
25<br />
20<br />
15<br />
10<br />
5<br />
0<br />
Timing of pesticide applications to Calabrese: January 2003 - December 2003<br />
Jan Feb Mar Apr May Jun Jul Aug Sep Oct Nov Dec<br />
Fungicide Herbicide Insecticide<br />
Timing of pesticide applications to Summer & Autumn Cauliflower: January 2003 -<br />
December 2003<br />
Jan Feb Mar Apr May Jun Jul Aug Sep Oct Nov Dec<br />
Fungicide Herbicide Insecticide<br />
27
Pesticide usage on brassicas (continued)<br />
Percentage of applications<br />
60<br />
50<br />
40<br />
30<br />
20<br />
10<br />
0<br />
Timing of pesticide applications to Brussels Sprouts: January 2003 - December 2003<br />
Jan Feb Mar Apr May Jun Jul Aug Sep Oct Nov Dec<br />
Brassicas etc. – Sprayer water volumes<br />
Fungicide Herbicide Insecticide<br />
Most sprays were applied in water volumes at or over 300 litres per hectare, with a larger percentage of insecticides being<br />
applied in water volumes over 500 litres per hectare.<br />
Percentage of area sprayed<br />
50<br />
40<br />
30<br />
20<br />
10<br />
0<br />
Sprayer water volumes used for pesticide applications to Brassicas etc. 2003<br />
Fungicide Herbicide Insecticide<br />
28<br />
500 L/Ha
Brassicas etc. – Herbicides<br />
In line with the range of crops being grown, herbicides were applied throughout the year, either as pre-planting or preemergence<br />
applications or as applications within the growing crop for control of specific weeds. According to reasons<br />
given by the growers, general weed control accounted for 78% of all applications made, broad-leaved weed control 16%,<br />
with control of specific weeds such as thistles, chickweed <strong>and</strong> mayweed each accounting for one percent of the treated<br />
area. Treatments for the control of crop volunteers comprised a further one percent. Trifluralin was used on 59% of the<br />
total area of brassicas grown <strong>and</strong> accounted for 31% of the herbicide-treated area. Trifluralin, metazachlor <strong>and</strong><br />
propachlor together comprised three-quarters of the herbicide-treated area of brassicas.<br />
Herbicide active substance Formulation<br />
area treated<br />
(ha)<br />
Weight of a.s.<br />
applied (kg)<br />
29<br />
Proportion of<br />
herbicidetreated<br />
area<br />
Proportion of<br />
census area<br />
treated<br />
Average<br />
number of<br />
applications<br />
Average<br />
proportion of<br />
full label rate<br />
Trifluralin 19,723 18,002 0.31 0.59 1.01 0.81<br />
Metazachlor 15,506 10,541 0.25 0.46 0.98 0.88<br />
Propachlor 11,974 49,981 0.19 0.35 0.95 0.64<br />
Glyphosate 8,132 7,902 0.13 0.21 1.24 0.66<br />
Pendimethalin 1,431 1,850 0.02 0.04 1.03 1.05<br />
Brassicas etc. – Fungicides<br />
Difenoconazole <strong>and</strong> tebuconazole were the two main fungicides used on brassicas, together accounting for 44% of the<br />
fungicide-treated area. Most of the principal fungicides were applied at between half <strong>and</strong> full recommended rate with the<br />
majority, 45%, being used for general disease control. Control of ringspot (Mycosphaerella brassicicola) <strong>and</strong> dark leaf<br />
spot (Alternaria brassicae & A. brassicicola) together accounted for 31% of all applications, with white blister (Albugo<br />
c<strong>and</strong>ida) control accounting for a further 9%.<br />
Fungicide active substance<br />
Formulation<br />
area treated<br />
(ha)<br />
Weight of a.s.<br />
applied (kg)<br />
Proportion of<br />
fungicidetreated<br />
area<br />
Proportion of<br />
census area<br />
treated<br />
Average<br />
number of<br />
applications<br />
Average<br />
proportion of<br />
full label rate<br />
Difenoconazole 15,513 1,099 0.27 0.30 1.45 0.94<br />
Tebuconazole 9,854 1,377 0.17 0.20 1.37 0.55<br />
Chlorothalonil 7,099 7,243 0.12 0.14 1.36 0.68<br />
Boscalid/pyraclostrobin 5,973 1,831 0.10 0.14 1.28 0.95<br />
Azoxystrobin 5,387 1,014 0.09 0.13 1.19 0.97<br />
Brassicas etc. – Insecticides<br />
Aphids were the main reason given for insecticide application, accounting for 42% of all specified applications. Control<br />
of caterpillars accounted for a further 20%, while the two reasons combined accounted for almost 79% of the insecticidetreated<br />
area. Caterpillars of the diamond-back moth, Plutella xylostella accounted for 6% <strong>and</strong> peach potato aphid Myzus<br />
persicae a further 3%. <strong>The</strong> control of MACE-resistant peach-potato aphids was also identified as an important issue for<br />
brassica growers. Two formulations comprised over 40% of all insecticide applications, namely lambda-cyhalothrin<br />
(23%) <strong>and</strong> pirimicarb (21%), with two applications of each being used on half of the area of brassicas grown.<br />
Insecticide active substance Formulation<br />
area treated<br />
(ha)<br />
Weight of a.s.<br />
applied (kg)<br />
Proportion of<br />
insecticidetreated<br />
area<br />
Proportion of<br />
census area<br />
treated<br />
Average<br />
number of<br />
applications<br />
Average<br />
proportion of<br />
full label rate<br />
Lambda-cyhalothrin 34,178 215 0.23 0.51 2.17 0.61<br />
Pirimicarb 30,880 5,685 0.21 0.50 1.86 0.85<br />
Deltamethrin/pirimicarb 12,939 1,942 0.09 0.23 1.54 0.97<br />
Triazamate 12,589 587 0.08 0.19 1.77 0.87<br />
Cypermethrin 8,821 209 0.06 0.19 1.55 0.92
Brassicas etc. – Comparison with previous survey (Tables 9 & 10)<br />
<strong>The</strong> area of brassicas grown in 2003 had decreased by 7% compared with 1999 <strong>and</strong> by 26% compared with 1991. In line<br />
with this reduction, the area treated fell by 13% compared with 1999, <strong>and</strong> by 4% compared with 1991. Over the same<br />
period, the weight of pesticides applied had decreased by 18% compared with 1999, <strong>and</strong> by 41% compared with 1991,<br />
reflecting a move to growers applying lower dose rates per hectare <strong>and</strong> to new products active at much lower rates of<br />
application. In particular the average application rate of insecticides had fallen from 0.38 kg of active substance per<br />
hectare in 1991 to 0.13 kg/ha in 2003. Similarly fungicide rates of application had fallen from 0.97 kg/ha in 1991 to 0.38<br />
kg/ha in 2003, with herbicides falling from 2.57 kg/ha to 1.72 kg/ha over the same period.<br />
<strong>The</strong> chart below illustrates that there has been little change in the number of sprays, products <strong>and</strong> active substances<br />
applied to brassicas between 1991 <strong>and</strong> 2003.<br />
Number of applications<br />
10<br />
8<br />
6<br />
4<br />
2<br />
0<br />
Brassicas etc. – Herbicides<br />
Summary of the number of pesticide sprays, products <strong>and</strong> active substances applied to<br />
Brassicas etc. 1991 - 2003<br />
1991 1995 1999 2003<br />
30<br />
Sprays<br />
Products<br />
Active substances<br />
Herbicide usage, in terms of area treated, increased by 11% between 1999 <strong>and</strong> 2003, with the weight applied increasing<br />
by 7%. Trifluralin has continued to be the principal herbicide active substance applied to brassicas since 1995, with all<br />
three of the principal active substances showing little change, in terms of their importance of use, since 1991.<br />
Changes in the area treated (ha) for the top five herbicides in 2003 used on brassicas over the period 1991 – 2003<br />
(figures in parentheses refer to position in previous years)<br />
Herbicide 2003 1999 1995 1991<br />
Trifluralin 19,723 16,786 (1) 21,521 (1) 16,885 (2)<br />
Metazachlor 15,506 13,966 (2) 10,619 (3) 5,570 (3)<br />
Propachlor 11,974 12,306 (3) 19,918 (2) 22,215 (1)<br />
Glyphosate 8,132 4,258 (4) 1,938 (8) 936 (9)<br />
Pendimethalin 1,431 858 (9) 479 (13) 102 (257)
Brassicas etc. – Fungicides<br />
Fungicide usage on brassicas decreased by 11% between 1999 <strong>and</strong> 2003 but had increased by 42% compared with 1991.<br />
<strong>The</strong> use of difenconazole, first recorded in 1999, accounted for over a third of the area treated with the principal five<br />
fungicide active substances. While the use of chlorothalonil had continued to increase from 1991 to 1999, it was<br />
replaced by tebuconazole as the principal active substance in 1999.<br />
Changes in the area treated (ha) for the top five fungicides in 2003 used on brassicas over the period 1991 – 2003<br />
(figures in parentheses refer to position in previous years)<br />
Fungicide 2003 1999 1995 1991<br />
Difenoconazole 15,513 9,188 (3)<br />
Tebuconazole 9,854 15,370 (1) 12,694 (2)<br />
Chlorothalonil 7,099 14,262 (2) 13,331 (1) 9,927 (1)<br />
Boscalid/pyraclostrobin 5,973<br />
Azoxystrobin 5,387<br />
Brassicas etc. – Insecticides<br />
Organophosphate usage on brassicas decreased by 89% compared with the last survey <strong>and</strong> by 92% compared with 1991.<br />
By contrast, the use of “other insecticides”, in particular deltamethrin/pirimicarb <strong>and</strong> triazamate, increased by more than<br />
three times compared with 1999, with carbamates increasing by 40% over the same period. <strong>The</strong> use of pirimicarb has<br />
shown a continual increase since 1991, in contrast to cypermethrin, which has declined in use since 1995. Triazamate<br />
use was recorded for the first time on brassicas in the current survey.<br />
Changes in the area treated (ha) for the top five insecticides in 2003 used on brassicas over the period 1991 – 2003<br />
(figures in parentheses refer to position in previous years)<br />
Insecticide 2003 1999 1995 1991<br />
Lambda-cyhalothrin 34,178 43,808 (2) 12,871 (6) 7,851 (6)<br />
Pirimicarb 30,880 20,998 (4) 18,378 (4) 12,041 (3)<br />
Deltamethrin/pirimicarb 12,939 3,681 (8)<br />
Triazamate 12,589<br />
Cypermethrin 8,821 22,727 (3) 72,409 (2) 43,112 (2)<br />
31
Table 9 Comparison of pesticide usage in brassicas, 1991 - 2003, area treated (ha) <strong>and</strong> amount used (t)<br />
Chemical 1991 1995 1999 2003<br />
ha t ha t ha t ha t<br />
Insecticides<br />
Benzoylureas 936 0.09 . . . . 282 0.02<br />
Carbamates 17,081 7.86 21,908 6.68 22,662 5.11 31,637 6.74<br />
Organochlorines 179 0.04 673 0.28 6 < 0.01 1 < 0.01<br />
Organophosphates 103,203 63.02 118,910 56.06 71,289 37.85 7,878 5.27<br />
Pyrethroids 68,539 1.32 108,498 2.03 79,467 0.90 63,493 0.58<br />
Other insecticides 1,055 0.14 2,392 0.29 14,131 2.24 46,034 6.36<br />
Total - all insecticides 190,993 72.47 252,381 65.35 187,555 46.10 149,325 18.99<br />
Registered biological control agents 153 0.09 22 0.01 82 0.01 159 0.01<br />
Fungicides 40,596 39.24 60,528 48.67 64,593 34.50 57,607 21.99<br />
Sulphur 26 0.06 498 2.28 911 4.13 1,001 3.41<br />
Herbicides 59,100 152.07 72,163 161.50 57,081 101.41 63,187 108.62<br />
Sodium chloride 1<br />
. . . . . . 4 0.72<br />
Molluscicides 4,151 1.08 6,123 2.07 17,200 6.31 11,954 4.60<br />
Repellents 169 0.06 239 0.24 5 0.02 . .<br />
Soil sterilants 6 2.33 9 3.60 . . . .<br />
Physical control agents . . . . . . 100 0.42<br />
Total - all registered pesticides 295,195 267.41 391,963 283.71 327,428 192.48 283,338 158.75<br />
Area grown 43,832 40,828 34,743 32,424<br />
1 data on use of sodium chloride was not collected in 1991 or 1995<br />
32
Table 10 Comparison of pesticide usage in brassicas 1991 - 2003, treated area as a percentage of area grown <strong>and</strong> average rate applied (kg a.s./ha)<br />
Chemical 1991 1995 1999 2003<br />
Area treated Average Area treated Average Area treated Average Area treated Average<br />
as % of area appln. rate as % of area appln. rate as % of area appln. rate as % of area appln. rate<br />
grown (kg a.s./ha) grown (kg a.s./ha) grown (kg a.s./ha) grown (kg a.s./ha)<br />
Insecticides<br />
Benzoylureas 2 0.09 . . . . 1 0.07<br />
Carbamates 39 0.46 54 0.30 65 0.23 98 0.21<br />
Organochlorines < 1 0.23 2 0.42 < 1 0.28 < 1 0.42<br />
Organophosphates 235 0.61 291 0.47 205 0.53 24 0.67<br />
Pyrethroids 156 0.02 266 0.02 229 0.01 196 0.01<br />
Other insecticides 2 0.13 6 0.12 41 0.16 142 0.14<br />
Total - all insecticides 436 0.38 618 0.26 540 0.25 461 0.13<br />
Registered biological control agents < 1 0.60 < 1 0.33 < 1 0.18 < 1 0.05<br />
Fungicides 93 0.97 148 0.80 186 0.53 178 0.38<br />
Sulphur < 1 2.38 1 4.59 3 4.53 3 3.41<br />
Herbicides 135 2.57 177 2.24 164 1.78 195 1.72<br />
Sodium chloride 1<br />
. . . . . . < 1 174.52<br />
Molluscicides 9 0.26 15 0.34 50 0.37 37 0.38<br />
Repellents < 1 0.36 1 1.00 < 1 3.20 . .<br />
Soil sterilants < 1 364.62 < 1 389.07 . . . .<br />
Physical control agents . . . . . . < 1 4.19<br />
All registered pesticides 673 0.91 960 0.72 942 0.59 874 0.56<br />
1 data on use of sodium chloride was not collected in 1991 or 1995<br />
33
PESTICIDE USAGE ON ROOT CRUCIFERS<br />
Crops within this group included turnips, swedes <strong>and</strong> radishes. Root crucifers received, on average, 2 insecticide sprays,<br />
2 herbicides, 1 molluscicide <strong>and</strong> 1 fungicide. Herbicides accounted for 33% of the pesticide-treated area, insecticides<br />
29%, molluscicides 24%, fungicides 13%, sulphur <strong>and</strong> physical control agents one percent each. By weight, herbicides<br />
comprised 56% of the total amount of pesticides applied, molluscicides 17%, insecticides 12%, sulphur 6%, fungicides<br />
6% <strong>and</strong> physical control agents 2%.<br />
Percentage of applications<br />
70<br />
60<br />
50<br />
40<br />
30<br />
20<br />
10<br />
0<br />
Timing of pesticide applications to Turnips <strong>and</strong> Swedes: January 2003 - December 2003<br />
Jan Feb Mar Apr May Jun Jul Aug Sep Oct Nov Dec<br />
Root crucifers – Sprayer water volumes<br />
Fungicide Herbicide Insecticide<br />
Although most sprays were applied to root crucifers in water volumes over 400 litres per hectare, a quarter of all<br />
insecticides, primarily to control cabbage root fly, were applied in water volumes over 500 litres per hectare.<br />
Percentage of area sprayed<br />
60<br />
50<br />
40<br />
30<br />
20<br />
10<br />
0<br />
Sprayer water volumes used for pesticide applications to Root crucifers 2003<br />
Fungicide Herbicide Insecticide<br />
34<br />
500 L/Ha
Root crucifers – Herbicides<br />
Trifluralin, the principal herbicide encountered, accounted for 38% of the total herbicide-treated area <strong>and</strong> was used on<br />
80% of the area of root crucifers grown. Most of the principal herbicides were applied at rates between 58% <strong>and</strong> 83% of<br />
full recommended rate. Almost all herbicides were applied for general weed control with nettle <strong>and</strong> nightshade being the<br />
only specific weeds cited.<br />
Herbicide active substance Formulation<br />
area treated<br />
(ha)<br />
Weight of a.s.<br />
applied (kg)<br />
35<br />
Proportion of<br />
herbicidetreated<br />
area<br />
Proportion of<br />
census area<br />
treated<br />
Average<br />
number of<br />
applications<br />
Average<br />
proportion of<br />
full label rate<br />
Trifluralin 1,979 1,673 0.38 0.80 0.99 0.83<br />
Metazachlor 1,404 705 0.27 0.57 1.00 0.76<br />
Glyphosate 877 1,030 0.17 0.34 1.10 0.85<br />
Propachlor 639 2,545 0.12 0.26 1.00 0.60<br />
Chlorthal-dimethyl/propachlor 129 631 0.02 0.05 1.00 0.58<br />
Root crucifers – Fungicides<br />
Azoxystrobin, used at three quarters of the full label rate, accounted for just over half of the fungicide-treated area, being<br />
used on 38% of the area of root crucifers grown. Although general disease control was the single most important reason<br />
for fungicide use, at 65% of the fungicide-treated area, powdery mildew accounted for a further 21%, Rhizoctonia for 8%<br />
<strong>and</strong> Botrytis for 6%.<br />
Fungicide active substance Formulation<br />
area treated<br />
(ha)<br />
Weight of a.s.<br />
applied (kg)<br />
Proportion of<br />
fungicidetreated<br />
area<br />
Proportion of<br />
census area<br />
treated<br />
Average<br />
number of<br />
applications<br />
Average<br />
proportion of<br />
full label rate<br />
Azoxystrobin 1,013 149 0.51 0.38 1.13 0.72<br />
Tebuconazole 445 72 0.22 0.12 1.56 0.64<br />
Triadimenol 294 37 0.15 0.08 1.60 1.00<br />
Mancozeb/metalaxyl-M 132 135 0.07 0.05 1.00 1.00<br />
Tolclofos-methyl 109 273 0.05 0.04 1.00 1.00<br />
Root crucifers – Insecticides<br />
Chlorfenvinphos, mainly for the control of cabbage root fly, Delia radicum, accounted for almost half of all insecticide<br />
applications <strong>and</strong> was used on 30% of the total area of root crucifers grown. Although cabbage root fly accounted for<br />
64% of all insecticide applications, brassica flea beetles (Phyllotreta spp.) comprised the reason for a further 12% of<br />
applications <strong>and</strong> aphids 9%.<br />
Insecticide active substance Formulation<br />
area treated<br />
(ha)<br />
Weight of a.s.<br />
applied (kg)<br />
Proportion of<br />
insecticidetreated<br />
area<br />
Proportion of<br />
census area<br />
treated<br />
Average<br />
number of<br />
applications<br />
Average<br />
proportion of<br />
full label rate<br />
Chlorfenvinphos 2,126 1,223 0.46 0.30 2.39 0.87<br />
Deltamethrin 1,806 12 0.39 0.51 1.75 0.93<br />
Pirimicarb 443 69 0.10 0.17 1.27 0.68<br />
Chlorpyrifos 134 128 0.03 0.05 1.00 1.10<br />
Cypermethrin 72 1 0.02 0.03 1.00 0.87<br />
Root crucifers – Molluscicides<br />
Metaldehyde accounted for almost all of the molluscicide treated area.
Root Crucifers – Comparison with previous survey (Tables 11 & 12)<br />
<strong>The</strong> area of root crucifers grown in 2003 had decreased by 42% compared with 1999 <strong>and</strong> by 53% compared with 1991.<br />
In line with this reduction, the area treated had fallen by 43% compared with 1999, <strong>and</strong> by 57% compared with 1991.<br />
Over the same period, the weight of pesticides applied decreased by 50% compared with 1999, <strong>and</strong> by 70% compared<br />
with 1991, reflecting a move to growers applying lower dose rates per hectare <strong>and</strong> to new products active at much lower<br />
rates of application. In particular, the average application rate of insecticides had fallen from 0.75 kg of active substance<br />
per hectare in 1991 to 0.31 kg/ha in 2003. Similarly, fungicide rates of application had fallen from 0.48 kg/ha in 1991 to<br />
0.33 kg/ha in 2003, with herbicides falling from 1.8 kg/ha to 1.29 kg/ha over the same period.<br />
<strong>The</strong> chart below illustrates that there has been little change in the number of sprays, products or active substances applied<br />
to root crucifers between 1991 <strong>and</strong> 2003.<br />
Number of applications<br />
7<br />
6<br />
5<br />
4<br />
3<br />
2<br />
1<br />
0<br />
Root crucifers – Herbicides<br />
Summary of the number of pesticide sprays, products <strong>and</strong> active substances applied to<br />
Root crucifers 1991 - 2003<br />
1991 1995 1999 2003<br />
36<br />
Sprays<br />
Products<br />
Active substances<br />
Since 1991, herbicide usage has continued to fall <strong>and</strong> the area treated in 2003 was 39% lower. In line with usage on<br />
other brassicas, trifluralin continued to be the principal herbicide used on root crucifers between 1991 <strong>and</strong> 2003.<br />
Metazachlor has been the second most important herbicide used on root crucifers since 1995.<br />
Changes in the area treated (ha) for the top five herbicides in 2003 used on root crucifers over the period 1991 – 2003<br />
(figures in parentheses refer to position in previous years)<br />
Herbicide 2003 1999 1995 1991<br />
Trifluralin 1,979 3,259 (1) 3,265 (1) 4,385 (1)<br />
Metazachlor 1,404 2,263 (2) 1,965 (2) 1,265 (3)<br />
Glyphosate 877 263 (4) 117 (7) 25 (9)<br />
Propachlor 639 1,075 (3) 595 (3) 1,453 (2)<br />
Chlorthal-dimethyl/propachlor 129
Root crucifers etc. – Comparison with previous survey (cont)<br />
Root crucifers – Fungicides<br />
<strong>The</strong>re was a slight increase, 14%, in the area treated with fungicides between 1999 <strong>and</strong> 2003. Although fungicide usage<br />
on root crucifers was minimal, azoxystrobin, the principal fungicide <strong>and</strong> encountered for the first time in 2003, accounted<br />
for 51% of all usage.<br />
Changes in the area treated (ha) for the top five fungicides in 2003 used on root crucifers over the period 1991 – 2003<br />
(figures in parentheses refer to position in previous years)<br />
Fungicide 2003 1999 1995 1991<br />
Azoxystrobin 1,013<br />
Tebuconazole 445 154 (5)<br />
Triadimenol 294 481 (2) 80 (4) 833 (2)<br />
Mancozeb/metalaxyl-M 132 317 (3)<br />
Tolclofos-methyl 109<br />
Root crucifers – Insecticides<br />
Organophosphate usage on root crucifers had decreased by 77% compared with 1999 <strong>and</strong> by 84% compared with 1991.<br />
By contrast, the use of pyrethroids more doubled between 1999 <strong>and</strong> 2003. Since 1991, chlorfenvinphos, for the control<br />
of cabbage root fly (D. radicum), has remained the principal active substance used on root crucifers, though usage was<br />
down considerably on that found in 1999, with a four-fold increase in the use of deltamethrin.<br />
Changes in the area treated (ha) for the top five insecticides in 2003 used on root crucifers over the period 1991 – 2003<br />
(figures in parentheses refer to position in previous years)<br />
Insecticide 2003 1999 1995 1991<br />
Chlorfenvinphos 2,126 7,701 (1) 7,695 (1) 10,679 (1)<br />
Deltamethrin 1,806 469 (3) 202 (8) 148 (7)<br />
Pirimicarb 443 424 (5) 638 (5)<br />
Chlorpyrifos 134 65 (7) 1,065 (2) 51 (9)<br />
Cypermethrin 72 446 (4) 752 (4) 1,167 (3)<br />
37
Table 11 Comparison of pesticide usage in root crucifers, 1991 - 2003, area treated (ha) <strong>and</strong> amount used (t)<br />
Chemical 1991 1995 1999 2003<br />
ha t ha t ha t ha t<br />
Insecticides<br />
Carbamates 4,544 5.50 4,164 3.67 3,366 2.79 449 0.08<br />
Organochlorines 12 < 0.01 . . . . . .<br />
Organophosphates 14,001 9.53 10,346 6.68 10,012 5.80 2,260 1.35<br />
Pyrethroids 1,510 0.03 1,110 0.02 924 0.01 1,882 0.01<br />
Other insecticides . . 126 0.02 317 0.03 2 < 0.01<br />
Total - all insecticides 20,067 15.07 15,746 10.39 14,619 8.64 4,593 1.44<br />
Fungicides 5,922 2.84 2,408 1.01 1,754 1.11 1,994 0.67<br />
Sulphur 1,886 5.81 1,246 2.59 1,200 3.74 157 0.77<br />
Herbicides 8,509 15.33 6,829 7.95 7,553 9.61 5,198 6.68<br />
Molluscicides 946 0.13 1,613 0.51 2,491 0.72 3,791 2.08<br />
Physical control agents . . . . . . 141 0.25<br />
Total - all registered pesticides 37,329 39.17 27,842 22.44 27,618 23.83 15,874 11.89<br />
Area grown 5,274 4,171 4,237 2,465<br />
38
Table 12 Comparison of pesticide usage in root crucifers, 1991 - 2003, treated area as a percentage of area grown <strong>and</strong> average rate applied (kg a.s./ha)<br />
Chemical 1991 1995 1999 2003<br />
Area treated Average Area treated Average Area treated Average Area treated Average<br />
as % of area appln. rate as % of area appln. rate as % of area appln. rate as % of area appln. rate<br />
grown (kg a.s./ha) grown (kg a.s./ha) grown (kg a.s./ha) grown (kg a.s./ha)<br />
Insecticides<br />
Carbamates 86 1.21 100 0.88 79 0.83 18 0.18<br />
Organochlorines < 1 0.28 . . . . . .<br />
Organophosphates 265 0.68 248 0.65 236 0.58 92 0.60<br />
Pyrethroids 29 0.02 27 0.02 22 0.02 76 0.01<br />
Other insecticides . . 3 0.15 7 0.10 < 1 0.20<br />
Total - all insecticides 380 0.75 378 0.66 345 0.59 186 0.31<br />
Fungicides 112 0.48 58 0.42 41 0.64 81 0.33<br />
Sulphur 36 3.08 30 2.08 28 3.12 6 4.89<br />
Herbicides 161 1.80 164 1.16 178 1.27 211 1.29<br />
Molluscicides 18 0.14 39 0.32 59 0.29 154 0.55<br />
Physical control agents . . . . . . 6 1.77<br />
All registered pesticides 708 1.05 668 0.81 652 0.86 644 0.75<br />
39
PESTICIDE USAGE ON PEAS & BEANS<br />
Crops within this group included broad, French <strong>and</strong> runner beans, <strong>and</strong> peas for picking <strong>and</strong> vining. Dry harvest peas <strong>and</strong><br />
field beans for combining are included in surveys of arable crops not vegetables. <strong>The</strong> large area of vining peas strongly<br />
influences the use of all pesticides within this group.<br />
Peas & beans received, on average, 2 herbicide sprays, 1 insecticide <strong>and</strong> a fungicide. Herbicides accounted for 52% of<br />
the pesticide-treated area, insecticides 33%, fungicides 8%, molluscicides 6%, sulphur 2% <strong>and</strong> biological control agents<br />
<strong>and</strong> soil sterilants less than one percent. By weight, herbicides comprised 57% of the total weight of pesticides applied,<br />
soil sterilants 20%, sulphur 13%, molluscicides 4%, fungicides 3%, insecticides 3% <strong>and</strong> biological control agents less<br />
than one percent.<br />
Percentage of applications<br />
Percentage of applications<br />
80<br />
70<br />
60<br />
50<br />
40<br />
30<br />
20<br />
10<br />
0<br />
100<br />
90<br />
80<br />
70<br />
60<br />
50<br />
40<br />
30<br />
20<br />
10<br />
0<br />
Timing of pesticide applications to Vining Peas: January 2003 - December 2003<br />
Jan Feb Mar Apr May Jun Jul Aug Sep Oct Nov Dec<br />
Fungicide Herbicide Insecticide<br />
Timing of pesticide applications to French Beans: January 2003 - December 2003<br />
Jan Feb Mar Apr May Jun Jul Aug Sep Oct Nov Dec<br />
Fungicide Herbicide Insecticide<br />
40
Peas & beans – Sprayer water volumes<br />
<strong>The</strong> area of vining peas grown dominates the total area of Peas & beans grown, this is reflected in the sprayer water<br />
volumes illustrated in the chart below. In contrast to many other vegetable crops, vining peas are commonly grown as<br />
part of an arable rotation; as such the water volumes used are lower, more in line with those used on arable crops than<br />
those used on most other vegetable crops.<br />
Percentage of area sprayed<br />
70<br />
60<br />
50<br />
40<br />
30<br />
20<br />
10<br />
0<br />
Peas & beans – Herbicides<br />
Sprayer water volumes used for pesticide applications to Peas & beans 2003<br />
Fungicide Herbicide Insecticide<br />
41<br />
500 L/Ha<br />
Cyanazine was the most important herbicide recorded on peas & beans, accounting for 23% of the herbicide-treated area<br />
<strong>and</strong> being used on 59% of the total area of peas & beans grown. Glyphosate, applied pre-drilling, accounted for a further<br />
20% of the herbicide-treated area <strong>and</strong> 47% of the total area grown. Although accounting for a lesser-treated area than<br />
glyphosate, bentazone/MCPB was used on 49% of the area grown. Most herbicides, 60%, were used for general weed<br />
control, with a further 17% of applications being used for broad-leaved weed control. Crop volunteers <strong>and</strong> grass weeds<br />
comprised a further 8% each.<br />
Herbicide active substance Formulation<br />
area treated<br />
(ha)<br />
Weight of a.s.<br />
applied (kg)<br />
Proportion of<br />
herbicidetreated<br />
area<br />
Proportion of<br />
census area<br />
treated<br />
Average<br />
number of<br />
applications<br />
Average<br />
proportion of<br />
full label rate<br />
Cyanazine 27,412 6,598 0.23 0.59 1.01 0.31<br />
Glyphosate 24,904 21,859 0.20 0.47 1.28 0.69<br />
Bentazone/MCPB 22,785 30,337 0.19 0.49 1.02 0.81<br />
Terbuthylazine/terbutryn 16,433 17,502 0.14 0.36 1.01 0.65<br />
Fomesafen/terbutryn 8,290 8,753 0.07 0.18 1.00 0.78<br />
Peas & beans – Fungicides<br />
Over a quarter of the area of peas <strong>and</strong> beans grown was treated with azoxystrobin, which accounted for 64% of the<br />
fungicide-treated area. <strong>The</strong> majority of applications, 35%, were made for Botrytis control, general disease control 21%,<br />
combinations of Botrytis <strong>and</strong> mildew 16%, Sclerotinia 10% or mildew, particularly downy mildew 14%.<br />
Fungicide active substance Formulation<br />
area treated<br />
(ha)<br />
Weight of a.s.<br />
applied (kg)<br />
Proportion of<br />
fungicidetreated<br />
area<br />
Proportion of<br />
census area<br />
treated<br />
Average<br />
number of<br />
applications<br />
Average<br />
proportion of<br />
full label rate<br />
Azoxystrobin 12,507 2,409 0.64 0.27 1.07 0.77<br />
Vinclozolin 3,591 1,294 0.18 0.07 1.11 0.80<br />
Chlorothalonil/metalaxyl 1,194 750 0.06 0.01 1.38 0.73<br />
Tebuconazole 657 106 0.03 0.01 1.11 0.92<br />
Iprodione 563 157 0.03 0.01 1.00 0.70
Peas & beans – Insecticides<br />
Pirimicarb was the single most important insecticide active substance used on peas <strong>and</strong> beans <strong>and</strong> accounted for 42% of<br />
the total insecticide-treated area, being used on almost two-thirds of the area grown. Together, pirimicarb <strong>and</strong> lambdacyhalothrin,<br />
either alone or in formulated mixtures, comprised 93% of the total insecticide-treated area. Aphids were the<br />
most important pests cited, accounting for 69% of the total treated area; pea moth (Cydia nigricana) comprised a further<br />
11%, with combinations of aphids <strong>and</strong> caterpillars 11%, thrips (Kakothrips pisivorus) 3% <strong>and</strong> pea <strong>and</strong> bean weevil<br />
(Sitona spp.) 2%.<br />
Insecticide active substance<br />
Formulation<br />
area treated<br />
(ha)<br />
Weight of a.s.<br />
applied (kg)<br />
42<br />
Proportion of<br />
insecticidetreated<br />
area<br />
Proportion of<br />
census area<br />
treated<br />
Average<br />
number of<br />
applications<br />
Average<br />
proportion of<br />
full label rate<br />
Pirimicarb 32,052 2,947 0.42 0.62 1.14 0.72<br />
Lambda-cyhalothrin 26,796 146 0.35 0.48 1.21 0.70<br />
Lambda-cyhalothrin/pirimicarb 12,598 1,325 0.16 0.16 1.16 0.65<br />
Deltamethrin 2,086 15 0.03 0.03 1.46 0.94<br />
Cypermethrin 1,995 50 0.03 0.04 1.00 0.97<br />
Peas & beans – Molluscicides<br />
Metaldehyde accounted for 97% of the molluscicide treated area <strong>and</strong> was used mainly on vining peas.<br />
Peas & beans – Biological control agents<br />
All biological control agents within this crop group were used on runner beans; with Phytoseilius persimilis for the<br />
control of two-spotted mite, Tetranychus urticae, accounting for 92% of the total area treated. Bacillus thuringiensis<br />
var.kurstaki, for the control of caterpillars of the Silver-Y moth, Autographa gamma, comprised the remainder.
Peas & beans – Comparison with previous survey (Tables 13 & 14)<br />
<strong>The</strong> area of peas & beans grown in 2003 had increased by 7% compared with 1999, but had decreased by 16% compared<br />
with 1991. However, the pesticide-treated area of peas & beans increased by 26% compared with 1999, <strong>and</strong> by 38%<br />
compared with 1991. In line with this increase in the treated area, the weight of pesticides applied had increased by 65%<br />
compared with 1999, <strong>and</strong> by 39% compared with 1991, with much of this increase resulting from the use of the soil<br />
sterilant dazomet, with its relatively high rate of application, prior to the planting of pea & bean crops. Despite the<br />
increase in the total weight applied, the average application rate of insecticides has fallen from 0.14 kg of active<br />
substance per hectare in 1991 to 0.06 kg/ha in 2003. Similarly, fungicide rates of application had fallen from 0.68 kg/ha<br />
in 1991 to 0.28 kg/ha in 2003, with herbicide rates falling from 0.97 kg/ha to 0.81 kg/ha over the same period.<br />
<strong>The</strong> use of organophosphate insecticides on peas & beans was not encountered in 2003. This has, in part, contributed to<br />
the reduction in the rate of application of insecticides to peas & beans, as organophosphate products are normally applied<br />
at higher rates than other insecticide groups.<br />
<strong>The</strong> chart below illustrates that there has been little change in the number of sprays, products or active substances applied<br />
to peas & beans between 1991 <strong>and</strong> 2003.<br />
Number of applications<br />
7<br />
6<br />
5<br />
4<br />
3<br />
2<br />
1<br />
0<br />
Peas & beans – Herbicides<br />
Summary of the number of pesticide sprays, products <strong>and</strong> active substances applied to<br />
Peas & beans 1991 - 2003<br />
1991 1995 1999 2003<br />
43<br />
Sprays<br />
Products<br />
Active substances<br />
Herbicide usage on peas & beans increased by 11% between 1999 <strong>and</strong> 2003, reflecting both the increased area grown <strong>and</strong><br />
a greater use of glyphosate pre-drilling. Cyanazine was the principal active substance used on peas & beans from 1991 to<br />
2003. During the same period the use of glyphosate increased almost six fold.<br />
Changes in the area treated (ha) for the top five herbicides in 2003 used on peas & beans over the period 1991 – 2003<br />
(figures in parentheses refer to position in previous years)<br />
Herbicide 2003 1999 1995 1991<br />
Cyanazine 27,412 26,530 (1) 30,535 (1) 25,019 (1)<br />
Glyphosate 24,904 14,939 (4) 6,357 (5) 4,282 (8)<br />
Bentazone/MCPB 22,785 15,909 (3) 23,820 (3) 11,969 (3)<br />
Terbuthylazine/terbutryn 16,433 22,418 (2) 26,414 (2) 19,520 (2)<br />
Fomesafen/terbutryn 8,290 4,848 (6) 2,048 (9)
Peas & beans – Fungicides<br />
Fungicide usage on peas more than doubled between 1999 <strong>and</strong> 2003, although 2003 usage showed an increase of only<br />
11% compared with 1999. Azoxystrobin, the principal fungicide used on peas & beans, was encountered for the first<br />
time in 2003 <strong>and</strong> accounted for 64% of all fungicide usage. Azoxystrobin has replaced vinclozolin, the principal<br />
fungicide used in 1991 <strong>and</strong> 1999, both active substances being used predominantly on vining peas for botrytis control.<br />
Chlorothalonil formulated alone was the most extensively-used fungicide in 1995, but was not in the top five in 2003.<br />
Changes in the area treated (ha) for the top five fungicides in 2003 used on peas & beans over the period 1991 – 2003<br />
(figures in parentheses refer to position in previous years)<br />
Fungicide 2003 1999 1995 1991<br />
Azoxystrobin 12,507<br />
Vinclozolin 3,591 2,715 (1) 2,443 (2) 4,680 (1)<br />
Chlorothalonil/metalaxyl 1,194 1,464 (2) 458 (5) 2,226 (3)<br />
Tebuconazole 657 228 (8)<br />
Iprodione 563 243 (7) 3 (8) 1,886 (5)<br />
Peas & beans – Insecticides<br />
No organophosphate usage was recorded on peas & beans in 2003, but the use of other insecticides, in particular lambdacyhalothrin/pirimicarb,<br />
had more than doubled compared with 1999. Pirimicarb, used for aphid control, particularly in<br />
vining peas, has been the principal insecticide active substance used between 1991 <strong>and</strong> 2003. <strong>The</strong> use of lambdacyhalothrin<br />
continued to increase over the same period, commonly being used for the control of pea moth, (C. nigricana),<br />
again on vining peas.<br />
Changes in the area treated (ha) for the top five insecticides in 2003 used on peas & beans over the period 1991 – 2003<br />
(figures in parentheses refer to position in previous years)<br />
Insecticide 2003 1999 1995 1991<br />
Pirimicarb 32,052 28,136 (1) 38,312 (1) 21,788 (1)<br />
Lambda-cyhalothrin 26,796 18,092 (2) 8,047 (3) 1,566 (7)<br />
Lambda-cyhalothrin/pirimicarb 12,598 3,037 (4)<br />
Deltamethrin 2,086 2,867 (5) 1,296 (8) 2,467 (5)<br />
Cypermethrin 1,995 10,666 (3) 17,484 (2) 6,758 (2)<br />
44
Table 13 Comparison of pesticide usage in peas <strong>and</strong> beans, 1991 - 2003, area treated (ha) <strong>and</strong> amount used (t)<br />
Chemical 1991 1995 1999 2003<br />
ha t ha t ha t ha t<br />
Acaricides . . 38 0.01 . . . .<br />
Insecticides<br />
Carbamates 21,788 2.79 38,312 4.31 28,136 2.66 32,052 2.95<br />
Organochlorines . . 5 < 0.01 . . . .<br />
Organophosphates 9,215 2.83 11,307 4.52 1,233 0.42 . .<br />
Pyrethroids 12,229 0.23 26,854 0.50 31,625 0.38 31,560 0.22<br />
Other insecticides 135 0.02 3,144 0.33 4,178 0.49 12,989 1.37<br />
Total - all insecticides 43,367 5.86 79,622 9.67 65,172 3.96 76,601 4.54<br />
Registered biological control agents . . . . 312 0.06 21 < 0.01<br />
Fungicides 17,681 11.94 8,939 6.31 8,608 5.28 19,625 5.49<br />
Sulphur . . 1,001 2.72 862 4.03 4,200 23.04<br />
Herbicides 109,084 105.85 116,409 104.37 109,471 88.78 121,662 98.27<br />
Molluscicides 15 < 0.01 225 0.07 2,971 1.62 13,029 6.58<br />
Soil sterilants . . 8 2.96 . . 78 33.66<br />
Total - all registered pesticides 170,147 123.66 206,241 126.10 187,396 103.71 235,215 171.57<br />
Other biological control agents . . 346 < 0.01 7 < 0.01 252 0.44<br />
Area grown 54,769 51,966 45,365 46,211<br />
45
Table 14 Comparison of pesticide usage in peas <strong>and</strong> beans, 1991 - 2003, treated area as a percentage of area grown <strong>and</strong> average rate applied (kg<br />
a.s./ha)<br />
Chemical 1991 1995 1999 2003<br />
Area treated Average Area treated Average Area treated Average Area treated Average<br />
as % of area appln. rate as % of area appln. rate as % of area appln. rate as % of area appln. rate<br />
grown (kg a.s./ha) grown (kg a.s./ha) grown (kg a.s./ha) grown (kg a.s./ha)<br />
Acaricides . . < 1 0.16 . . . .<br />
Insecticides<br />
Carbamates 40 0.13 74 0.11 62 0.09 69 0.09<br />
Organochlorines . . < 1 0.84 . . . .<br />
Organophosphates 17 0.31 22 0.40 3 0.34 . .<br />
Pyrethroids 22 0.02 52 0.02 70 0.01 68 0.01<br />
Other insecticides < 1 0.13 6 0.11 9 0.12 28 0.11<br />
Total - all insecticides 79 0.14 153 0.12 144 0.06 166 0.06<br />
Registered biological control agents . . . . 1 0.18 < 1 0.03<br />
Fungicides 32 0.68 17 0.71 19 0.61 42 0.28<br />
Sulphur . . 2 2.72 2 4.67 9 5.49<br />
Herbicides 199 0.97 224 0.90 241 0.81 263 0.81<br />
Molluscicides < 1 0.22 < 1 0.31 7 0.55 28 0.50<br />
Soil sterilants . . < 1 389.07 . . < 1 430.58<br />
All registered pesticides 311 0.73 398 0.61 413 0.55 510 0.73<br />
Other biological control agents . . 1 . . . 1 1.76<br />
46
PESTICIDE USAGE ON ONIONS & LEEKS<br />
Crops within this group included onions, both salad <strong>and</strong> dry bulb, leeks, shallots <strong>and</strong> garlic. Onions & leeks received, on<br />
average, 6 herbicide sprays, 4 fungicides <strong>and</strong> 2 insecticides. Herbicides accounted for 49% of the pesticide-treated area,<br />
fungicides 42%, insecticides 8%, growth regulators one percent <strong>and</strong> physical control agents, sulphur, soil sterilants <strong>and</strong><br />
molluscicides less than one percent each. By weight, fungicides comprised 49% of the total weight of pesticides applied,<br />
herbicides 44%, growth regulators 3%, insecticides 2%, soil sterilants <strong>and</strong> physical control agents one percent <strong>and</strong><br />
sulphur <strong>and</strong> molluscicides less than one percent. All usage of the growth regulator maleic hydrazide was confined to drybulb<br />
onions, 39% of the crop receiving a single application.<br />
Percentage of applications<br />
Percentage of applications<br />
50<br />
45<br />
40<br />
35<br />
30<br />
25<br />
20<br />
15<br />
10<br />
5<br />
0<br />
40<br />
35<br />
30<br />
25<br />
20<br />
15<br />
10<br />
5<br />
0<br />
Timing of pesticide applications to Dry Bulb Onions: January 2003 - December 2003<br />
Jan Feb Mar Apr May Jun Jul Aug Sep Oct Nov Dec<br />
Fungicide Herbicide Insecticide<br />
Timing of pesticide applications to Leeks: January 2003 - December 2003<br />
Jan Feb Mar Apr May Jun Jul Aug Sep Oct Nov Dec<br />
Fungicide Herbicide Insecticide<br />
47
Onions & leeks – Sprayer water volumes<br />
It can be seen from the chart below that although most sprays, particularly fungicides, were applied in water volumes<br />
below 300 litres, over half of the growth regulator, maleic hydrazide, applications were in water volumes of 300 litres or<br />
above.<br />
Percentage of area sprayed<br />
70<br />
60<br />
50<br />
40<br />
30<br />
20<br />
10<br />
0<br />
Onions & leeks - Herbicides<br />
Sprayer water volumes used for pesticide applications to Onions & leeks 2003<br />
Fungicide Growth regulator Herbicide Insecticide<br />
48<br />
500 L/Ha<br />
Most herbicides used on onions & leeks were applied throughout the life of the crop as part of a repeat low dose<br />
programme. This is exemplified by the relatively low proportions of full label rate used in each application, 13% in the<br />
case of ioxynil, the principal herbicide, <strong>and</strong> the relatively high average number of applications used. Although most<br />
herbicides were used for general weed control, 42% of the herbicide-treated area, or broad leaved weed control, 33% of<br />
the area, many specific weeds, including knotgrass, fat hen, annual meadow grass, thistles, mayweeds, redshank, field<br />
pansy, cleavers, fumitory, groundsel <strong>and</strong> nettles were also cited. Crop volunteers accounted for a further 6% of herbicide<br />
usage with the control of a barley cover crop, planted to protect soil from wind erosion on exposed sites, comprising a<br />
further one percent.<br />
Herbicide active substance Formulation<br />
area treated<br />
(ha)<br />
Weight of a.s.<br />
applied (kg)<br />
Proportion of<br />
herbicidetreated<br />
area<br />
Proportion of<br />
census area<br />
treated<br />
Average<br />
number of<br />
applications<br />
Average<br />
proportion of<br />
full label rate<br />
Ioxynil 37,731 2,881 0.28 0.92 3.23 0.13<br />
Pendimethalin 17,898 8,767 0.13 0.85 1.45 0.48<br />
Propachlor 16,305 59,433 0.12 0.91 1.24 0.64<br />
Cyanazine 11,957 1,439 0.09 0.56 1.85 0.07<br />
Chloridazon 10,777 4,018 0.08 0.58 1.46 0.41
Onions & leeks - Fungicides<br />
<strong>The</strong> control of mildew, particularly downy mildew (Peronospora destructor), was the main reason cited for fungicide<br />
usage on onions & leeks, where it accounted for 61% of all applications made to this crop group. Other important<br />
specific reasons for use included Botrytis spp. 13%, leek rust (Puccinia allii) 8% <strong>and</strong> white tip of leeks (Phytophthora<br />
porri) 6%. <strong>The</strong> principal fungicide, dimethomorph/mancozeb, was used on two thirds of the area of onions & leeks<br />
grown <strong>and</strong> was applied on average almost four times during the life of the crop. Copper oxychloride, used both as a<br />
foliar feed <strong>and</strong> fungicide, was used on half of the area grown <strong>and</strong> was again applied on average almost four times during<br />
the life of the crop.<br />
Fungicide active substance Formulation<br />
area treated<br />
(ha)<br />
Weight of a.s.<br />
applied (kg)<br />
49<br />
Proportion of<br />
fungicidetreated<br />
area<br />
Proportion of<br />
census area<br />
treated<br />
Average<br />
number of<br />
applications<br />
Average<br />
proportion of<br />
full label rate<br />
Dimethomorph/mancozeb 29,508 42,730 0.25 0.67 3.59 0.98<br />
Copper oxychloride 21,590 18,289 0.18 0.50 3.51 0.89<br />
Chlorothalonil 15,523 13,582 0.13 0.48 2.80 0.86<br />
Azoxystrobin 13,200 2,288 0.11 0.63 1.72 0.78<br />
Mancozeb 12,683 19,805 0.11 0.41 2.54 0.81<br />
Onions & Leeks – Insecticides & nematicides<br />
Three applications of deltamethrin were applied to over half of the area of onions & leeks grown, with most applications<br />
being applied at or near full label rate. <strong>The</strong> most important reason given for insecticide usage, 83% of the insecticide <strong>and</strong><br />
nematicide-treated area, was control of the onion thrips (Thrips tabaci). One other important reason for use, 8% of the<br />
insecticide <strong>and</strong> nematicide-treated area, included the control of the stem <strong>and</strong> bulb nematode (Ditylenchus dipsaci) on drybulb<br />
onions, normally achieved using granular aldicarb applications at the time of drilling or planting.<br />
Insecticide active substance<br />
Formulation<br />
area treated<br />
(ha)<br />
Weight of a.s.<br />
applied (kg)<br />
Proportion of<br />
insecticidetreated<br />
area<br />
Proportion of<br />
census area<br />
treated<br />
Average<br />
number of<br />
applications<br />
Average<br />
proportion of<br />
full label rate<br />
Deltamethrin 16,499 122 0.72 0.55 2.69 0.97<br />
Dimethoate 3,178 1,209 0.14 0.10 2.10 0.92<br />
Aldicarb 2,258 3,059 0.10 0.18 0.97 0.29<br />
Chlorpyrifos 656 498 0.03 0.05 1.00 0.76<br />
Lambda-cyhalothrin 189 1 0.01 0.01 1.72 0.57
Onions & leeks – Comparison with previous survey (Tables 15 & 16)<br />
<strong>The</strong> area of onions & leeks grown in 2003 had decreased by 24% compared with 1999, but increased by 6% compared<br />
with 1991. <strong>The</strong> pesticide-treated area of onions & leeks increased by 5% compared with 1999, <strong>and</strong> had more than<br />
doubled compared with 1991. In contrast to the increase in the treated area, the weight of pesticides applied decreased by<br />
5% compared with 1999, but increased by 57% compared with 1991. <strong>The</strong> increase in the area treated reflects the<br />
increased use of repeat low dose applications with herbicides <strong>and</strong> a greater awareness of the need to control both downy<br />
mildew <strong>and</strong> onion thrips. Despite the increase in the total area treated the average application rate of insecticides had<br />
fallen from 0.51 kg of active substance per hectare in 1991 to 0.22 kg/ha in 2003. Similarly, fungicide rates of<br />
application fell from 1.01 kg/ha in 1991 to 0.95 kg/ha in 2003, while herbicide rates fell from 1.39 kg/ha to 0.74 kg/ha<br />
over the same period.<br />
<strong>The</strong> charts below illustrates that there has been a gradual increase in the number of sprays, products <strong>and</strong> active substances<br />
applied to onions & leeks between 1991 <strong>and</strong> 2003. In particular, the use of fungicide applications has increased from two<br />
products used in 1991 to eight products in 2003, whilst the number of active substances applied has increased from four<br />
to twelve over the same period.<br />
Number of applications<br />
Numbers of applications<br />
30<br />
25<br />
20<br />
15<br />
10<br />
5<br />
0<br />
14<br />
12<br />
10<br />
8<br />
6<br />
4<br />
2<br />
0<br />
Summary of the number of pesticide sprays, products <strong>and</strong> active substances applied to<br />
Onions & leeks 1991 - 2003<br />
1991 1995 1999 2003<br />
50<br />
Sprays<br />
Products<br />
Summary of the number of fungicide sprays, products <strong>and</strong> active substances applied to<br />
Onions & leeks 1991 - 2003<br />
1991 1995 1999 2003<br />
Active substances<br />
Sprays<br />
Products<br />
Active substances
Onions & leeks – Herbicides<br />
Herbicide usage fell by 11% between 1999 <strong>and</strong> 2003, in line with the decrease in the area grown. Ioxynil remained the<br />
principal herbicide active substance used on onions & leeks, although the use of chloridazon has continued to increase in<br />
use since its first occurrence in 1995.<br />
Changes in the area treated (ha) for the top five herbicides in 2003 used on onions & leeks over the period 1991 – 2003<br />
(figures in parentheses refer to position in previous years)<br />
Herbicide 2003 1999 1995 1991<br />
Ioxynil 37,731 45,938 (1) 35,365 (1) 15,491 (1)<br />
Pendimethalin 17,898 17,119 (3) 8,650 (4) 5,102 (5)<br />
Propachlor 16,305 19,215 (2) 14,443 (2) 11,679 (3)<br />
Cyanazine 11,957 14,945 (4) 11,617 (3) 6,182 (4)<br />
Chloridazon 10,777 9,628 (5) 2,182 (11)<br />
Onions & leeks - Fungicides<br />
Dimethomorph/mancozeb was only used on a small area in 1999 but it has now replaced chlorothalonil as the most<br />
widely used fungicide on onions <strong>and</strong> leeks. Despite the fall in the area grown between 1999 <strong>and</strong> 2003, the area treated<br />
with fungicides had increased by 43%, reflecting the increased pressure to control downy mildew.<br />
Changes in the area treated (ha) for the top five fungicides in 2003 used on onions & leeks over the period 1991 – 2003<br />
(figures in parentheses refer to position in previous years)<br />
Fungicide 2003 1999 1995 1991<br />
Dimethomorph/mancozeb 29,508 64 (15)<br />
Copper oxychloride 21,590 15,176 (3) 2,835 (5) 1,460 (8)<br />
Chlorothalonil 15,523 20,661 (1) 14,863 (1) 6,593 (1)<br />
Azoxystrobin 13,200<br />
Mancozeb 12,683 691 (10) 622 (9) 907 (10)<br />
Insecticides – Onions & leeks<br />
Overall usage of insecticides fell by 8% in terms of area treated between 1999 <strong>and</strong> 2003. However, the area treated in<br />
2003 was three times greater than that in 1991. <strong>The</strong> usage of organophosphates fell by 43% between 1999 <strong>and</strong> 2003,<br />
with pyrethroids increasing by 12% over the same period. Deltamethrin, used primarily for the control of onion thrips (T.<br />
tabaci), continued to the most important insecticide active substance used on onions & leeks.<br />
Changes in the area treated (ha) for the top five insecticides in 2003 used on onions & leeks over the period 1991 – 2003<br />
(figures in parentheses refer to position in previous years)<br />
Insecticide 2003 1999 1995 1991<br />
Deltamethrin 16,499 14,784 (1) 8,008 (1) 2,486 (1)<br />
Dimethoate 3,178 1,935 (3) 435 (6) 397 (5)<br />
Chlorpyrifos 656 2,731 (2) 1,312 (4) 456 (4)<br />
Lambda-cyhalothrin 189 62 (9) 25 (11)<br />
Malathion 43 16 (12) 27 (11)<br />
51
Table 15 Comparison of pesticide usage in onions & leeks, 1991 - 2003, area treated (ha) <strong>and</strong> amount used (t)<br />
Chemical 1991 1995 1999 2003<br />
ha t ha t ha t ha t<br />
Insecticides<br />
Benzoylureas . . . . 96 < 0.01 . .<br />
Carbamates 2,235 2.53 1,956 2.48 3,042 4.10 2,270 3.06<br />
Organochlorines . . 59 0.03 . . . .<br />
Organophosphates 1,695 1.14 3,688 2.87 6,810 4.10 3,877 1.76<br />
Pyrethroids 3,321 0.04 10,131 0.12 14,934 0.11 16,702 0.12<br />
Other insecticides 63 0.01 45 0.01 . . 31 < 0.01<br />
Total - all insecticides 7,313 3.72 15,879 5.51 24,883 8.31 22,880 4.94<br />
Fungicides 33,114 33.41 41,296 34.48 81,884 73.59 117,437 112.08<br />
Sulphur . . 260 0.50 2,160 12.31 200 0.60<br />
Growth regulators 3,837 10.88 4,616 11.85 4,995 10.44 3,275 6.49<br />
Herbicides 69,722 97.23 110,066 124.45 154,130 134.23 136,510 101.26<br />
Molluscicides . . 28 0.01 240 0.07 2 < 0.01<br />
Repellents . . 4 0.01 . . . .<br />
Soil sterilants . . . . . . 4 1.36<br />
Physical control agents . . . . . . 524 1.31<br />
Total - all registered pesticides 113,986 145.24 172,148 176.81 268,291 238.95 280,830 228.05<br />
Area grown 11,670 13,477 16,289 12,392<br />
52
Table 16 Comparison of pesticide usage in onions & leeks, 1991 - 2003, treated area as a percentage of area grown <strong>and</strong> average rate applied (kg a.s./ha)<br />
Chemical 1991 1995 1999 2003<br />
Area treated Average Area treated Average Area treated Average Area treated Average<br />
as % of area appln. rate as % of area appln. rate as % of area appln. rate as % of area appln. rate<br />
grown (kg a.s./ha) grown (kg a.s./ha) grown (kg a.s./ha) grown (kg a.s./ha)<br />
Insecticides<br />
Benzoylureas . . . . 1 0.02 . .<br />
Carbamates 19 1.13 15 1.27 19 1.35 18 1.35<br />
Organochlorines . . < 1 0.51 . . . .<br />
Organophosphates 15 0.68 27 0.78 42 0.60 31 0.45<br />
Pyrethroids 28 0.01 75 0.01 92 0.01 135 0.01<br />
Other insecticides 1 0.13 < 1 0.13 . . < 1 0.04<br />
Total - all insecticides 63 0.51 118 0.35 153 0.33 185 0.22<br />
Fungicides 284 1.01 306 0.84 503 0.90 948 0.95<br />
Sulphur . . 2 1.93 13 5.70 2 2.98<br />
Growth regulators 33 2.84 34 2.57 31 2.09 26 1.98<br />
Herbicides 597 1.39 817 1.13 946 0.87 1,102 0.74<br />
Molluscicides . . < 1 0.23 1 0.31 < 1 0.64<br />
Repellents . . < 1 3.40 . . . .<br />
Soil sterilants . . . . . . < 1 378.30<br />
Physical control agents . . . . . . 4 2.50<br />
All registered pesticides 977 1.27 1,277 1.03 1,647 0.89 2,266 0.81<br />
53
PESTICIDE USAGE ON CARROTS, PARSNIPS & CELERY<br />
Crops within this group included carrots, parsnips <strong>and</strong> celery. Carrots etc. received, on average, 4 insecticide sprays, 3<br />
herbicides <strong>and</strong> 3 fungicides. Herbicides accounted for 36% of the pesticide-treated area, insecticides 35%, fungicides<br />
27%, sulphur one percent <strong>and</strong> growth regulators, physical control agents, growth stimulants <strong>and</strong> molluscicides less than<br />
one percent each. By weight, herbicides comprised 54% of the total weight of pesticides applied, fungicides 21%,<br />
sulphur 13%, insecticides 11%, growth regulators one percent <strong>and</strong> physical control agents, growth stimulants <strong>and</strong><br />
molluscicides less than one percent.<br />
All usage of the growth regulator maleic hydrazide was confined to either parsnips, where 5% of the crop was treated<br />
with a single application, or carrots, where less than one percent of the crop received a single application. All<br />
applications of maleic hydrazide were made in October.<br />
Percentage of applications<br />
Percentage of applications<br />
35<br />
30<br />
25<br />
20<br />
15<br />
10<br />
5<br />
0<br />
40<br />
35<br />
30<br />
25<br />
20<br />
15<br />
10<br />
5<br />
0<br />
Timing of pesticide applications on Carrots: January 2003 - December 2003<br />
Jan Feb Mar Apr May Jun Jul Aug Sep Oct Nov Dec<br />
Fungicide Herbicide Insecticide<br />
Timing of pesticide applications to Parsnips: January 2003 - December 2003<br />
Jan Feb Mar Apr May Jun Jul Aug Sep Oct Nov Dec<br />
Fungicide Herbicide Insecticide<br />
54
Carrots, parsnips, celery – Sprayer water volumes<br />
Although over 40% of applications of herbicides, insecticides <strong>and</strong> fungicides were applied in sprayer water volumes of<br />
between 200 <strong>and</strong> 300 litres of water per hectare, the majority of growth regulators <strong>and</strong> over 30% of fungicides <strong>and</strong><br />
herbicides were applied in water volumes of between 400 <strong>and</strong> 500 litres of water per hectare.<br />
Percentage of area sprayed<br />
70<br />
60<br />
50<br />
40<br />
30<br />
20<br />
10<br />
0<br />
Sprayer water volumes used for pesticide applications to Carrots, parsnips & celery 2003<br />
Fungicide Growth regulator Herbicide Insecticide<br />
Carrots, parsnips, celery – Herbicides<br />
55<br />
500 L/Ha<br />
According to reasons given by the growers, general weed control <strong>and</strong> broad-leaved weed control accounted for 62% <strong>and</strong><br />
17% of the herbicide-treated area respectively. However, usage for the control of crop volunteers comprised a further 8%<br />
of the area <strong>and</strong> the removal of a barley cover crop in fields susceptible to wind erosion 2%. Linuron was used on almost<br />
all carrots etc., with most crops receiving two applications on average. <strong>The</strong> table below shows that most herbicides were<br />
applied below the full label rate confirming the use of a repeat low dose programme.<br />
Herbicide active substance Formulation<br />
area treated<br />
(ha)<br />
Weight of a.s.<br />
applied (kg)<br />
Proportion of<br />
herbicidetreated<br />
area<br />
Proportion of<br />
census area<br />
treated<br />
Average<br />
number of<br />
applications<br />
Average<br />
proportion of<br />
full label rate<br />
Linuron 24,477 11,292 0.34 0.88 1.80 0.47<br />
Metoxuron 14,389 18,372 0.20 0.71 1.44 0.30<br />
Pendimethalin 8,597 12,815 0.12 0.65 1.00 0.77<br />
Propaquizafop 5,685 459 0.08 0.38 1.15 0.56<br />
Pentanochlor 3,854 3,857 0.05 0.22 1.26 0.50
Carrots, parsnips, celery – Fungicides<br />
Twenty three percent of fungicides were used for general disease control, the most common reason given, leaf blight<br />
(Alternaria dauci), mildew, cavity spot (Pythium spp.) <strong>and</strong> crown rot accounted for a further 16%, 16%, 12% <strong>and</strong> 11%<br />
respectively. Most fungicides were applied at or near the full label rate, with most crops receiving two applications of<br />
tebuconazole <strong>and</strong> azoxystrobin.<br />
Fungicide active substance Formulation<br />
area treated<br />
(ha)<br />
Weight of a.s.<br />
applied (kg)<br />
56<br />
Proportion of<br />
fungicidetreated<br />
area<br />
Proportion of<br />
census area<br />
treated<br />
Average<br />
number of<br />
applications<br />
Average<br />
proportion of<br />
full label rate<br />
Tebuconazole 17,925 3,653 0.32 0.62 1.96 0.80<br />
Azoxystrobin 13,566 2,859 0.24 0.55 1.61 0.87<br />
Fenpropimorph 7,200 4,663 0.13 0.29 1.86 0.89<br />
Metalaxyl-M 7,063 3,815 0.13 0.54 0.99 0.80<br />
Iprodione/thiophanate-methyl 4,899 3,055 0.09 0.31 1.24 0.92<br />
Carrots, parsnips, celery – Insecticides<br />
<strong>The</strong> use of lambda-cyhalothrin accounted for 62% of the insecticide-treated area with an average of three applications, at<br />
full label rate, being used on 85% of the total area grown. Pirimicarb was used on almost half of the area grown with two<br />
applications being used on average.<br />
Carrot fly (Psila rosae) was the principal reason for control, accounting for 52% of the insecticide-treated area. <strong>The</strong><br />
control of aphids comprised a further 29% of the insecticide-treated area, with willow carrot aphid (Cavariella<br />
aegopodii) being the most commonly cited species. <strong>The</strong> control of Parsnip Yellow Fleck Virus, transmitted by the<br />
willow carrot aphid, was also cited as a reason in addition to aphid control on 6% of the insecticide-treated area. All<br />
uses of insecticides for both carrot fly <strong>and</strong> aphids accounted for 77% of the total insecticide-treated area. <strong>The</strong> use of<br />
aldicarb, on 51% of the area grown, was primarily for the control of nematodes (Longidorus <strong>and</strong> Trichodorus spp.) which<br />
cause stunting <strong>and</strong> fanging in carrots <strong>and</strong> parsnips.<br />
Insecticide active substance<br />
Formulation<br />
area treated<br />
(ha)<br />
Weight of a.s.<br />
applied (kg)<br />
Proportion of<br />
insecticidetreated<br />
area<br />
Proportion of<br />
census area<br />
treated<br />
Average<br />
number of<br />
applications<br />
Average<br />
proportion of<br />
full label rate<br />
Lambda-cyhalothrin 43,978 626 0.62 0.85 3.32 0.99<br />
Pirimicarb 12,185 1,440 0.17 0.47 1.97 0.91<br />
Aldicarb 6,700 9,015 0.09 0.51 1.00 0.35<br />
Deltamethrin 4,203 29 0.06 0.17 2.30 0.96<br />
Cypermethrin 3,529 84 0.05 0.26 1.03 1.00
Carrots, parsnips, celery – Comparison with previous survey (Tables 17 & 18)<br />
<strong>The</strong> area of carrots etc. grown in 2003 had decreased by 18% compared with 1999 <strong>and</strong> by 31% compared with 1991.<br />
However, the pesticide-treated area had only decreased by 4% compared with 1999, <strong>and</strong> increased by 16% compared<br />
with 1991. In contrast to the 4% decrease in the treated area between 1999 <strong>and</strong> 2003, the weight of pesticides applied<br />
decreased by 34% compared with 1999, <strong>and</strong> by 53% compared with 1991. <strong>The</strong> average application rate of insecticides<br />
had fallen from 0.79 kg of active substance per hectare in 1991 to 0.16 kg/ha in 2003. Similarly fungicide rates of<br />
application had fallen from 5.23 kg/ha in 1991 to 0.40 kg/ha in 2003 with herbicide usage falling from 1.1 kg/ha to 0.79<br />
kg/ha over the same period.<br />
<strong>The</strong> charts below illustrate that there has been a gradual increase in the number of sprays, products <strong>and</strong> active substances<br />
applied to carrots etc. between 1991 <strong>and</strong> 2003. In particular the use of fungicide applications has increased from one<br />
product used in 1991 to three products in 2003.<br />
Number of applications<br />
Number of applications<br />
14<br />
12<br />
10<br />
8<br />
6<br />
4<br />
2<br />
0<br />
4<br />
3<br />
2<br />
1<br />
0<br />
Summary of the number of pesticide sprays, products <strong>and</strong> active substances applied to<br />
Carrots, parsnips & celery 1991 - 2003<br />
1991 1995 1999 2003<br />
57<br />
Sprays<br />
Products<br />
Summary of the number of fungicide sprays, products <strong>and</strong> active substances applied to<br />
Carrots, parsnips & celery 1991 - 2003<br />
1991 1995 1999 2003<br />
Active substances<br />
Sprays<br />
Products<br />
Active substances
Carrots, parsnips, celery – Herbicides<br />
Herbicide usage decreased by 12% between 1999 <strong>and</strong> 2003 but increased by 8% in 2003 compared with 1991. <strong>The</strong><br />
positions of linuron, metoxuron <strong>and</strong> pendimethalin have remained unchanged since 1991.<br />
Changes in the area treated (ha) for the top five herbicides in 2003 used on carrots, parsnips & celery over the period 1991 – 2003<br />
(figures in parentheses refer to position in previous years)<br />
Herbicide 2003 1999 1995 1991<br />
Linuron 24,477 28,964 (1) 31,887 (1) 32,556 (1)<br />
Metoxuron 14,389 17,047 (2) 15,124 (2) 16,559 (2)<br />
Pendimethalin 8,597 10,756 (3) 9,663 (3) 3,933 (3)<br />
Propaquizafop 5,685 4,207 (5) 1,623 (7)<br />
Pentanochlor 3,854 5,423 (4) 1,126 (8) 2,020 (7)<br />
Carrots, parsnips, celery – Fungicides<br />
Fungicide usage, in terms of area treated, had increased by 15% compared with 1999 <strong>and</strong> by four times compared with<br />
1991. None of the current top five fungicides were used in 1991 <strong>and</strong> azoxystrobin has replaced fenpropimorph as the<br />
second most important fungicide used on carrots etc.<br />
Changes in the area treated (ha) for the top five fungicides in 2003 used on carrots, parsnips & celery over the period 1991 – 2003<br />
(figures in parentheses refer to position in previous years)<br />
Fungicide 2003 1999 1995 1991<br />
Tebuconazole 17,925 18,421 (1)<br />
Azoxystrobin 13,566<br />
Fenpropimorph 7,200 8,471 (2) 7,764 (2)<br />
Metalaxyl-M 7,063 7,964 (3)<br />
Iprodione/thiophanate-methyl 4,899 3,513 (4) 6,005 (3)<br />
Carrots, parsnips, celery – Insecticides<br />
Usage of insecticides, in terms of area treated, had declined by 2% compared with 1999 <strong>and</strong> by 23% compared with<br />
1991. In terms of weight applied, insecticide use has fallen by 44% compared with 1999 <strong>and</strong> by 84% compared with<br />
1991. <strong>The</strong>re was limited usage of organophosphates in 2003, these having declined by 99% compared with 1999. By<br />
contrast, the area treated with carbamates increased by 56% <strong>and</strong> that of pyrethroids by 6%. Lambda-cyhalothrin<br />
remained the principal active substance, as it was in 1999.<br />
Changes in the area treated (ha) for the top five insecticides in 2003 used on carrots, parsnips & celery over the period 1991 – 2003<br />
(figures in parentheses refer to position in previous years)<br />
Insecticide 2003 1999 1995 1991<br />
Lambda-cyhalothrin 43,976 41,877 (1) 6,313 (4)<br />
Pirimicarb 12,185 3,845 (4) 6,903 (3) 9,566 (3)<br />
Deltamethrin 4,203 5,534 (3) 18 (15) 65 (13)<br />
Cypermethrin 3,529 1,503 (5) 18,299 (2) 7,041 (5)<br />
Nicotine 123 57 (12)<br />
58
Table 17 Comparison of pesticide usage on carrots, parsnips etc., 1991 - 2003, area treated (ha) <strong>and</strong> amount used (t)<br />
Chemical 1991 1995 1999 2003<br />
ha t ha t ha t ha t<br />
Insecticides<br />
Carbamates 15,450 7.01 13,995 9.63 12,145 12.07 18,984 10.56<br />
Organochlorines . . . . 2 < 0.01 . .<br />
Organophosphates 69,485 65.74 38,656 36.13 10,192 7.16 13 0.01<br />
Pyrethroids 7,105 0.23 24,630 0.55 48,914 0.65 51,708 0.74<br />
Other insecticides 12 < 0.01 37 < 0.01 1,459 0.23 251 0.05<br />
Total - all insecticides 92,053 72.98 77,317 46.31 72,712 20.11 70,956 11.36<br />
Fungicides 13,799 72.13 30,431 69.34 48,169 30.66 55,434 22.16<br />
Sulphur 1,246 6.36 5,980 28.94 7,424 36.83 2,572 13.40<br />
Growth regulators . . . . . . 170 0.90<br />
Herbicides 67,415 74.17 69,476 67.17 82,584 72.18 72,621 57.09<br />
Molluscicides . . 20 0.01 340 0.09 13 < 0.01<br />
Soil sterilants . . . . 5 0.83 . .<br />
Physical control agents . . . . . . 124 0.51<br />
Growth stimulants . . . . . . 116 0.12<br />
Total - all registered pesticides 174,513 225.64 183,226 211.75 211,234 160.69 202,006 105.54<br />
Area grown 18,981 16,469 15,851 13,062<br />
59
Table 18 Comparison of pesticide usage in carrots, parsnips etc., 1991 - 2003, treated area as a percentage of area grown <strong>and</strong> average rate applied (kg<br />
a.s./ha)<br />
Chemical 1991 1995 1999 2003<br />
Area treated Average Area treated Average Area treated Average Area treated Average<br />
as % of area appln. rate as % of area appln. rate as % of area appln. rate as % of area appln. rate<br />
grown (kg a.s./ha) grown (kg a.s./ha) grown (kg a.s./ha) grown (kg a.s./ha)<br />
Insecticides<br />
Carbamates 81 0.45 85 0.69 77 0.99 145 0.56<br />
Organochlorines . . . . < 1 0.01 . .<br />
Organophosphates 366 0.95 235 0.93 64 0.70 < 1 0.89<br />
Pyrethroids 37 0.03 150 0.02 309 0.01 396 0.01<br />
Other insecticides . . . . 9 0.16 2 0.22<br />
Total - all insecticides 485 0.79 469 0.60 459 0.28 543 0.16<br />
Fungicides 73 5.23 185 2.28 304 0.64 424 0.40<br />
Sulphur 7 5.10 36 4.84 47 4.96 20 5.21<br />
Growth regulators . . . . . . 1 5.30<br />
Herbicides 355 1.10 422 0.97 521 0.87 556 0.79<br />
Molluscicides . . < 1 0.25 2 0.27 < 1 0.19<br />
Soil sterilants . . . . < 1 152.00 . .<br />
Physical control agents . . . . . . 1 4.07<br />
Growth stimulants . . . . . . 1 1.00<br />
All registered pesticides 919 1.29 1,113 1.16 1,333 0.76 1,547 0.52<br />
60
PESTICIDE USAGE ON LETTUCE, ENDIVE ETC.<br />
Crops within this group included endive, Chinese cabbage <strong>and</strong> lettuce, including cos <strong>and</strong> iceberg types, but not those<br />
grown for baby leaf production. Lettuce, endive etc. received, on average, 2 fungicide sprays, 2 insecticides <strong>and</strong> 2<br />
herbicides. Insecticides accounted for 41% of the pesticide-treated area, fungicides 31%, herbicides 24%, molluscicides<br />
3%, sulphur <strong>and</strong> biological control agents less than one percent. By weight, herbicides comprised 47% of the total<br />
weight of pesticides applied, fungicides 44%, insecticides 5%, sulphur 2%, molluscicides one percent <strong>and</strong> biological<br />
control agents less than one percent.<br />
Percentage of applications<br />
30<br />
25<br />
20<br />
15<br />
10<br />
5<br />
0<br />
Timing of pesticide applications to Lettuce: January 2003 - December 2003<br />
Jan Feb Mar Apr May Jun Jul Aug Sep Oct Nov Dec<br />
Lettuce, endive etc. – Sprayer water volumes<br />
Fungicide Herbicide Insecticide<br />
Most applications of herbicides, insecticides <strong>and</strong> fungicides were applied in sprayer water volumes of between 400 <strong>and</strong><br />
500 litres per hectare, with less than 10% using volumes either under 200 litres per hectare or over 500 litres per hectare.<br />
Percentage of area sprayed<br />
80<br />
70<br />
60<br />
50<br />
40<br />
30<br />
20<br />
10<br />
0<br />
Sprayer water volumes used for pesticide applications to Lettuce, endive etc. 2003<br />
Fungicide Herbicide Insecticide<br />
61<br />
500 L/Ha
Lettuce, endive etc. – Herbicides<br />
General weed control <strong>and</strong> broad-leaved weed control accounted for 52% <strong>and</strong> 47% of the herbicide-treated area<br />
respectively. Propachlor was used on almost all lettuce etc., with most crops, 84% of the area grown, receiving a single<br />
application on average. <strong>The</strong> use of chlorpropham was also extensive, with 59% of the area grown receiving two<br />
applications each at approximately half the recommended rate.<br />
Herbicide active substance Formulation<br />
area treated<br />
(ha)<br />
Weight of a.s.<br />
applied (kg)<br />
62<br />
Proportion of<br />
herbicidetreated<br />
area<br />
Proportion of<br />
census area<br />
treated<br />
Average<br />
number of<br />
applications<br />
Average<br />
proportion of<br />
full label rate<br />
Propachlor 6,305 10,124 0.42 0.84 1.27 0.60<br />
Chlorpropham 5,464 4,485 0.36 0.59 1.59 0.53<br />
Propyzamide 1,440 1,513 0.10 0.26 1.00 0.81<br />
Glyphosate 1,348 1,619 0.09 0.22 1.06 0.90<br />
Pendimethalin 245 296 0.02 0.04 1.00 0.61<br />
Lettuce, endive etc. – Fungicides<br />
Although two thirds of fungicide treatments were against downy mildew (Bremia lactucae), control of grey mould<br />
(Botrytis cinerea) accounted for a further 19% of the fungicide-treated area. Azoxystrobin <strong>and</strong> mancozeb were the two<br />
active substances most frequently encountered, being used on 76% <strong>and</strong> 69% of the total area grown respectively.<br />
Fungicide active substance Formulation<br />
area treated<br />
(ha)<br />
Weight of a.s.<br />
applied (kg)<br />
Proportion of<br />
fungicidetreated<br />
area<br />
Proportion of<br />
census area<br />
treated<br />
Average<br />
number of<br />
applications<br />
Average<br />
proportion of<br />
full label rate<br />
Azoxystrobin 5,948 1,337 0.30 0.76 1.23 0.94<br />
Mancozeb 4,847 7,876 0.25 0.69 1.18 0.52<br />
Iprodione 3,857 682 0.20 0.41 1.51 0.56<br />
Mancozeb/metalaxyl-M 2,347 3,033 0.12 0.39 1.01 1.00<br />
Fosetyl-aluminium 1,756 3,122 0.09 0.23 1.08 0.70<br />
Lettuce, endive etc. – Insecticides<br />
Pirimicarb was the most extensively-used insecticide on lettuce etc. with two applications being applied to over half of<br />
the area grown. Most insecticide applications were made for the control of aphids, 43%, caterpillars 43% or a<br />
combination of the two 3%.<br />
Insecticide active substance<br />
Formulation<br />
area treated<br />
(ha)<br />
Weight of a.s.<br />
applied (kg)<br />
Proportion of<br />
insecticidetreated<br />
area<br />
Proportion of<br />
census area<br />
treated<br />
Average<br />
number of<br />
applications<br />
Average<br />
proportion of<br />
full label rate<br />
Pirimicarb 5,673 783 0.22 0.54 1.66 0.55<br />
Deltamethrin 5,172 33 0.20 0.54 1.50 1.02<br />
Lambda-cyhalothrin 5,013 36 0.20 0.59 1.46 0.95<br />
Nicotine 4,981 904 0.19 0.44 1.77 0.79<br />
Cypermethrin 3,454 86 0.14 0.46 1.39 1.00<br />
Lettuce, endive etc. – Molluscicides<br />
<strong>The</strong> use of metaldehyde accounted for 73% of the molluscicides used on lettuce etc. with methiocarb comprising the<br />
remaining 27%.
Lettuce, endive etc. – Comparison with previous survey (Tables 19 & 20)<br />
<strong>The</strong> area of lettuce etc. grown in 2003 had decreased by 6% compared with 1999 <strong>and</strong> by 36% compared with 1991.<br />
However, the pesticide-treated area of lettuce etc. increased by 4% compared with 1999, but decreased by 35% compared<br />
with 1991. In contrast to the 4% increase in the treated area between 1999 <strong>and</strong> 2003, the weight of pesticides applied<br />
decreased by 28% compared with 1999, <strong>and</strong> by 36% compared with 1991. This apparent anomaly is due mainly to the<br />
absence of soil sterilants recorded in the current survey on this crop. <strong>The</strong> average application rate of insecticides had<br />
fallen from 0.22 kg of active substance per hectare in 1991 to 0.08 kg/ha in 2003. Similarly fungicide rates of application<br />
fell from 1.05 kg/ha in 1991 to 0.89 kg/ha in 2003 with herbicides falling from 1.53 kg/ha to 1.21 kg/ha over the same<br />
period.<br />
<strong>The</strong> chart below illustrates that there has been a gradual decrease in the number of sprays, products <strong>and</strong> active substances<br />
applied to lettuce etc. since 1995. This may, in part, be due to an increased use of modular plants <strong>and</strong> the reduction in the<br />
number of sprays used because of the reduced time, <strong>and</strong> therefore susceptibility to pests, diseases <strong>and</strong> weeds, between<br />
planting <strong>and</strong> harvesting.<br />
Number of applications<br />
14<br />
12<br />
10<br />
8<br />
6<br />
4<br />
2<br />
0<br />
Summary of the number of pesticide sprays, products <strong>and</strong> active substances applied to<br />
Lettuce, endive etc. 1991 - 2003<br />
1991 1995 1999 2003<br />
63<br />
Sprays<br />
Products<br />
Active substances
Lettuce, endive etc. – Herbicides<br />
Herbicide usage, in terms of area treated, increased by 2% between 1999 <strong>and</strong> 2003. Propachlor remained the principal<br />
herbicide active substance, as in 1999. <strong>The</strong> use of chlorpropham, in terms of area treated <strong>and</strong> its importance in<br />
comparison to other herbicides used on lettuce, has continued to increase since 1991.<br />
Changes in the area treated (ha) for the top five herbicides in 2003 used on lettuce, endive etc. over the period 1991 – 2003<br />
(figures in parentheses refer to position in previous years)<br />
Herbicide 2003 1999 1995 1991<br />
Propachlor 6,305 5,814 (1) 4,500 (2) 3,779 (2)<br />
Chlorpropham 5,464 3,242 (3) 2,359 (3) 1,151 (4)<br />
Propyzamide 1,440 3,756 (2) 4,839 (1) 5,737 (1)<br />
Glyphosate 1,348 595 (5) 1,415 (4) 68 (8)<br />
Pendimethalin 245 317 (6) 205 (7) 203 (7)<br />
Lettuce, endive etc. – Fungicides<br />
In terms of area treated, fungicide usage increased by 13% between 1999 <strong>and</strong> 2003 but had decreased by 25% in 2003<br />
compared with 1991. By weight applied, fungicide usage had decreased slightly (by 4%) compared with 1999, but had<br />
fallen by 37% compared with 1991. Encountered for the first time in 2003 was azoxystrobin, replacing iprodione as the<br />
principal active substance used.<br />
Changes in the area treated (ha) for the top five fungicides in 2003 used on lettuce, endive etc. over the period 1991 – 2003<br />
(figures in parentheses refer to position in previous years)<br />
Fungicide 2003 1999 1995 1991<br />
Azoxystrobin 5,948<br />
Mancozeb 4,847 1,700 (4) 3,923 (3)<br />
Iprodione 3,857 6,848 (1) 11,724 (1) 8,162 (1)<br />
Mancozeb/metalaxyl-M 2,347<br />
Fosetyl-aluminium 1,756 1,517 (5) 620 (6) 334 (8)<br />
Lettuce, endive etc. – Insecticides<br />
Insecticide usage in 2003, in terms of area treated, was 4% greater than in 1999, but 54% less than in 1991. By weight<br />
applied, the total used in 2003 was 39% less than in 1999 but 83% less than in 1991. Usage of organophosphate<br />
insecticides in 2003 was minimal, having fallen from a maximum treated area of 22,586 hectares in 1991. Usage of<br />
pyrethroids increased by 29% between 1999 <strong>and</strong> 2003, with “other insecticides”, particularly nicotine, increasing by 97%<br />
over the same period. Pirimicarb was the principal active substance used in the surveyed years 1991, 1995, 1999 <strong>and</strong><br />
2003.<br />
64
Changes in the area treated (ha) for the top five insecticides in 2003 used on lettuce, endive etc. over the period 1991 – 2003<br />
(figures in parentheses refer to position in previous years)<br />
Insecticide 2003 1999 1995 1991<br />
Pirimicarb 5,673 6,234 (1) 20,657 (1) 17,328 (1)<br />
Deltamethrin 5,172 5,491 (2) 3,437 (5) 7,081 (4)<br />
Lambda-cyhalothrin 5,013 287 (10) 115 (11)<br />
Nicotine 4,981 1,017 (6) 1,596 (7)<br />
Cypermethrin 3,454 4,798 (3) 10,175 (2) 8,015 (3)<br />
Table 19 Comparison of pesticide usage in lettuce, endive etc., 1991 - 2003, area treated (ha) <strong>and</strong> amount used (t)<br />
Chemical 1991 1995 1999 2003<br />
ha t ha t ha t ha t<br />
Insecticides<br />
Carbamates 17,328 2.47 20,657 3.03 6,234 0.99 5,673 0.78<br />
Organophosphates 22,586 9.36 12,666 4.24 4,576 1.82 25 0.01<br />
Pyrethroids 15,205 0.28 13,802 0.27 10,577 0.16 13,639 0.16<br />
Other insecticides . . 2,077 0.37 3,177 0.46 6,246 1.14<br />
Total - all insecticides 55,118 12.11 49,203 7.92 24,564 3.43 25,583 2.10<br />
Registered biological control agents 620 0.09 622 0.06 . . 3 < 0.01<br />
Fungicides 26,176 27.60 25,973 22.85 17,264 17.94 19,533 17.31<br />
Sulphur . . 34 0.13 . . 112 0.85<br />
Herbicides 13,573 20.80 14,094 20.30 14,801 20.74 15,060 18.22<br />
Molluscicides 38 0.01 439 0.20 3,316 1.24 1,845 0.45<br />
Soil sterilants 1 0.42 11 4.10 14 10.42 . .<br />
Total - all registered pesticides 95,527 61.04 90,375 55.55 59,960 53.77 62,136 38.93<br />
Area grown 8,646 6,855 5,858 5,513<br />
65
Table 20 Comparison of pesticide usage in lettuce, endive etc., 1991 - 2003, treated area as a percentage of area grown <strong>and</strong> average rate applied (kg<br />
a.s./ha)<br />
Chemical 1991 1995 1999 2003<br />
Area treated Average Area treated Average Area treated Average Area treated Average<br />
as % of area appln. rate as % of area appln. rate as % of area appln. rate as % of area appln. rate<br />
grown (kg a.s./ha) grown (kg a.s./ha) grown (kg a.s./ha) grown (kg a.s./ha)<br />
Insecticides<br />
Carbamates 200 0.14 301 0.15 106 0.16 103 0.14<br />
Organophosphates 261 0.41 185 0.33 78 0.40 < 1 0.52<br />
Pyrethroids 176 0.02 201 0.02 181 0.01 247 0.01<br />
Other insecticides . . 30 0.18 54 0.15 113 0.18<br />
Total - all insecticides 638 0.22 718 0.16 419 0.14 464 0.08<br />
Registered biological control agents 7 0.15 9 0.09 . . < 1 0.03<br />
Fungicides 303 1.05 379 0.88 295 1.04 354 0.89<br />
Sulphur . . < 1 3.85 . . 2 7.61<br />
Herbicides 157 1.53 206 1.44 253 1.40 273 1.21<br />
Molluscicides < 1 0.21 6 0.44 57 0.37 33 0.25<br />
Soil sterilants < 1 376.18 < 1 384.15 < 1 742.50 . .<br />
All registered pesticides 1,105 0.64 1,318 0.61 1,024 0.90 1,127 0.63<br />
66
PESTICIDE USAGE ON SWEETCORN<br />
Sweetcorn received, on average, 2 herbicide sprays <strong>and</strong> an insecticide. Herbicides accounted for 60% of the pesticidetreated<br />
area, insecticides 33%, sulphur 5%, physical control agents 2% <strong>and</strong> molluscicides less than one percent. By<br />
weight herbicides comprised 66% of the total weight of pesticides applied, sulphur 25%, insecticides 5%, physical<br />
control agents 3% <strong>and</strong> molluscicides less than one percent.<br />
Percentage of applications<br />
80<br />
70<br />
60<br />
50<br />
40<br />
30<br />
20<br />
10<br />
0<br />
Timing of pesticide applications to Sweetcorn: January 2003 - December 2003<br />
Jan Feb Mar Apr May Jun Jul Aug Sep Oct Nov Dec<br />
Sweetcorn – Sprayer water volumes<br />
Herbicide Insecticide<br />
Most applications of herbicides <strong>and</strong> insecticides were in sprayer water volumes of between 200 <strong>and</strong> 300 litres of water<br />
per hectare.<br />
Percentage of area sprayed<br />
60<br />
50<br />
40<br />
30<br />
20<br />
10<br />
0<br />
Sprayer water volumes used for pesticide applications to Sweetcorn 2003<br />
Herbicide Insecticide<br />
67<br />
500 L/Ha
Sweetcorn – Herbicides<br />
General weed control <strong>and</strong> broad-leaved weed control together accounted for 96% of the herbicide-treated area, the only<br />
other reason given for herbicide usage being the control of black nightshade (Solanum nigrum). Atrazine was used on<br />
almost all sweetcorn, with the majority of crops, 86% of the area grown, receiving a single application at just over half<br />
the maximum recommended rate. <strong>The</strong> use of bromoxynil was also extensive, with 65% of the area grown receiving a<br />
single application at approximately half rate.<br />
Herbicide active substance Formulation<br />
area treated<br />
(ha)<br />
Weight of a.s.<br />
applied (kg)<br />
68<br />
Proportion of<br />
herbicidetreated<br />
area<br />
Proportion of<br />
census area<br />
treated<br />
Average<br />
number of<br />
applications<br />
Average<br />
proportion of<br />
full label rate<br />
Atrazine 1,252 1,144 0.47 0.86 1.27 0.59<br />
Bromoxynil 865 264 0.32 0.65 1.31 0.51<br />
Glyphosate 265 316 0.10 0.24 1.00 0.85<br />
Pendimethalin 210 250 0.08 0.19 1.00 0.53<br />
Cyanazine/pendimethalin 48 100 0.02 0.04 1.00 1.00<br />
Sweetcorn – Insecticides<br />
Pirimicarb was the most extensively-used insecticide on sweetcorn, accounting for 80% of the insecticide-treated area,<br />
with two applications being applied to just under half of the area grown. Most insecticide applications were made for the<br />
control of aphids, 87%, thrips 8% or frit fly (Oscinella frit).<br />
Insecticide active substance<br />
Formulation<br />
area treated<br />
(ha)<br />
Weight of a.s.<br />
applied (kg)<br />
Proportion of<br />
insecticidetreated<br />
area<br />
Proportion of<br />
census area<br />
treated<br />
Average<br />
number of<br />
applications<br />
Average<br />
proportion of<br />
full label rate<br />
Pirimicarb 1,180 164 0.80 0.46 2.01 0.99<br />
Lambda-cyhalothrin 235 1 0.16 0.20 1.75 1.00<br />
Deltamethrin 54 0 0.04 0.02 2.00 1.00<br />
Chlorpyrifos 10 5 0.01 0.01 1.00 1.00
Sweetcorn – Comparison with previous survey (Tables 21 & 22)<br />
<strong>The</strong> area of sweetcorn grown in 2003 had decreased by 35% compared with 1999 <strong>and</strong> by 28% compared with 1991. <strong>The</strong><br />
pesticide-treated area of sweetcorn decreased by 56% compared with 1999, but increased by 4% compared with 1991. In<br />
terms of weight applied, pesticide usage decreased by 32% compared with 1999, <strong>and</strong> by 10% compared with 1991. <strong>The</strong><br />
average application rate of insecticides had fallen from 0.40 kg of active substance per hectare in 1991 to 0.12 kg/ha in<br />
2003. Similarly herbicide rates of application fell from 1.08 kg/ha in 1991 to 0.79 kg/ha in 2003.<br />
<strong>The</strong> chart below indicates a decrease in the number of sprays, products <strong>and</strong> active substances applied to sweetcorn since<br />
1991, after reaching a peak in 1999.<br />
Number of applications<br />
6<br />
5<br />
4<br />
3<br />
2<br />
1<br />
0<br />
Summary of the number of pesticide sprays, products <strong>and</strong> active substances applied to<br />
Sweetcorn 1991 - 2003<br />
1991 1995 1999 2003<br />
69<br />
Sprays<br />
Products<br />
Active substances
Sweetcorn – Herbicides<br />
Herbicide usage, in terms of area treated, decreased by 35% between 1999 <strong>and</strong> 2003, but increased by 1% compared with<br />
1991. Atrazine continues to be the principal active substance used on sweetcorn, with bromoxynil usage for nightshade<br />
control showing an increase compared with 1999.<br />
Changes in the area treated (ha) for the top five herbicides in 2003 used on sweetcorn over the period 1991 – 2003<br />
(figures in parentheses refer to position in previous years)<br />
Herbicide 2003 1999 1995 1991<br />
Atrazine 1,252 2,083 (1) 2,034 (1) 1,828 (1)<br />
Bromoxynil 865 639 (3)<br />
Glyphosate 265 409 (4) 491 (4) 47 (4)<br />
Pendimethalin 210 140 (5)<br />
Cyanazine/pendimethalin 48<br />
Sweetcorn – Insecticides<br />
Insecticide usage in 2003, in terms of area treated, was 75% less than in 1999, <strong>and</strong> 11% less than in 1991. By weight<br />
applied, the total used in 2003 was 88% less than in 1999 <strong>and</strong> 74% less than in 1991. Usage of organophosphate<br />
insecticides in 2003 was minimal, having fallen from a maximum treated area of 2,636 hectares in 1999. Usage of all<br />
other insecticide groups also declined between 1999 <strong>and</strong> 2003. Pirimicarb was the principal active substance used in<br />
1999 <strong>and</strong> 2003.<br />
Changes in the area treated (ha) for all insecticides in 2003 used on sweetcorn over the period 1991 – 2003<br />
(figures in parentheses refer to position in previous years)<br />
Insecticide 2003 1999 1995 1991<br />
Pirimicarb 1,180 2,485 (1) 434 (4) 435 (2)<br />
Lambda-cyhalothrin 235 638 (4)<br />
Deltamethrin 54<br />
Chlorpyrifos 10 412 (5) 149 (5)<br />
70
Table 21 Comparison of pesticide usage in sweetcorn, 1991 - 2003, area treated (ha) <strong>and</strong> amount used (t)<br />
Chemical 1991 1995 1999 2003<br />
ha t ha t ha t ha t<br />
Insecticides<br />
Carbamates 499 0.12 613 0.16 2,485 0.35 1,180 0.16<br />
Organochlorines 91 0.10 . . . . . .<br />
Organophosphates 1,075 0.43 2,416 0.90 2,636 1.05 10 < 0.01<br />
Pyrethroids . . . . 638 < 0.01 288 < 0.01<br />
Other insecticides . . . . 73 < 0.01 . .<br />
Total - all insecticides 1,666 0.66 3,029 1.06 5,832 1.40 1,478 0.17<br />
Fungicides . . . . 23 0.02 . .<br />
Sulphur . . . . . . 216 0.78<br />
Herbicides 2,635 2.85 5,817 4.03 4,126 3.20 2,666 2.10<br />
Molluscicides . . . . 153 0.02 1 < 0.01<br />
Physical control agents . . . . . . 108 0.11<br />
Total - all registered pesticides 4,301 3.51 8,846 5.09 10,134 4.63 4,469 3.15<br />
Area grown 1,533 2,025 1,690 1,100<br />
71
Table 22 Comparison of pesticide usage in sweetcorn, 1991 - 2003, treated area as a percentage of area grown <strong>and</strong> average rate applied (kg a.s./ha)<br />
Chemical 1991 1995 1999 2003<br />
Area treated Average Area treated Average Area treated Average Area treated Average<br />
as % of area appln. rate as % of area appln. rate as % of area appln. rate as % of area appln. rate<br />
grown (kg a.s./ha) grown (kg a.s./ha) grown (kg a.s./ha) grown (kg a.s./ha)<br />
Insecticides<br />
Carbamates 33 0.25 30 0.27 147 0.14 107 0.14<br />
Organochlorines 6 1.12 . . . . . .<br />
Organophosphates 70 0.40 119 0.37 156 0.40 1 0.51<br />
Pyrethroids . . . . 38 0.01 26 0.01<br />
Other insecticides . . . . 4 0.00 . .<br />
Total - all insecticides 109 0.40 150 0.35 345 0.24 134 0.12<br />
Fungicides . . . . 1 0.75 . .<br />
Sulphur . . . . . . 20 3.60<br />
Herbicides 172 1.08 287 0.69 244 0.78 242 0.79<br />
Molluscicides . . . . 9 0.12 < 1 0.22<br />
Physical control agents . . . . . . 10 1.00<br />
All registered pesticides 281 0.82 437 0.58 600 0.46 406 0.71<br />
72
PESTICIDE USAGE ON OTHER ROOT VEGETABLES<br />
Crops within this group included beetroot, celeriac, chicory <strong>and</strong> Jerusalem artichoke. However, beetroot comprised 89%<br />
of the total area of vegetable crops grown in this crop group. Other root vegetables received, on average, 3 herbicides<br />
<strong>and</strong> 1 insecticide. Herbicides accounted for 80% of the pesticide-treated area, fungicides 9%, insecticides 9%, sulphur<br />
one percent <strong>and</strong> molluscicides <strong>and</strong> sodium chloride less than one percent. By weight applied, herbicides comprised 76%<br />
of the total amount of pesticide, fungicides 11%, sulphur 8%, sodium chloride 5%, insecticides one percent <strong>and</strong><br />
molluscicides less than one percent.<br />
Percentage of applications<br />
70<br />
60<br />
50<br />
40<br />
30<br />
20<br />
10<br />
0<br />
Timing of pesticide applications to Beetroot: January 2003 - December 2003<br />
Jan Feb Mar Apr May Jun Jul Aug Sep Oct Nov Dec<br />
Other root vegetables – Sprayer water volumes<br />
Fungicide Herbicide Insecticide<br />
Most applications of insecticides <strong>and</strong> fungicides were applied in sprayer water volumes of between 200 <strong>and</strong> 300 litres of<br />
water per hectare. However, herbicides, often used as part of a repeat low dose rate program, were mainly applied in<br />
water volumes less than 200 litres per hectare.<br />
Percentage of area sprayed<br />
70<br />
60<br />
50<br />
40<br />
30<br />
20<br />
10<br />
0<br />
Sprayer water volumes used for pesticide applications to Other root vegetables 2003<br />
Fungicide Herbicide Insecticide<br />
73<br />
500 L/Ha
Other root vegetables – Herbicides<br />
According to reasons given by growers, general weed control <strong>and</strong> broad-leaved weed control accounted for 82% <strong>and</strong> 15%<br />
of the herbicide-treated area respectively. <strong>The</strong> control of a barley cover crop sown on fields at risk from wind erosion<br />
comprised a further one percent of all herbicide applications. Phenmedipham was used on almost all other root vegetable<br />
crops, with most, 82% of the area grown, receiving two applications, at two-thirds the full label rate. <strong>The</strong> use of<br />
metamitron <strong>and</strong> ethofumesate was also extensive, with 61% <strong>and</strong> 68% respectively, of the area grown, receiving two<br />
applications at less than half rate.<br />
Herbicide active substance Formulation<br />
area treated<br />
(ha)<br />
Weight of a.s.<br />
applied (kg)<br />
74<br />
Proportion of<br />
herbicidetreated<br />
area<br />
Proportion of<br />
census area<br />
treated<br />
Average<br />
number of<br />
applications<br />
Average<br />
proportion of<br />
full label rate<br />
Phenmedipham 4,539 1,388 0.28 0.82 1.87 0.66<br />
Metamitron 3,037 4,874 0.19 0.61 1.76 0.46<br />
Ethofumesate 2,922 946 0.18 0.68 1.74 0.27<br />
Triflusulfuron-methyl 1,552 12 0.10 0.44 1.20 0.63<br />
Lenacil 1,073 276 0.07 0.27 1.22 0.25<br />
Other root vegetables – Fungicides<br />
Although fungicide usage was minimal, 43% of fungicides were used for leaf spot (Septoria apiicola) control on celeriac,<br />
27% for rust (Uromyces betae) control on beetroot, 14% for sclerotinia rot (Sclerotinia sclerotiorum) of celeriac <strong>and</strong> 8%<br />
for mildew control. Copper oxychloride was the principal active substance used, accounting for 43% of the fungicidetreated<br />
area, being used on 11% of the area grown.<br />
Fungicide active substance Formulation<br />
area treated<br />
(ha)<br />
Weight of a.s.<br />
applied (kg)<br />
Proportion of<br />
fungicidetreated<br />
area<br />
Proportion of<br />
census area<br />
treated<br />
Average<br />
number of<br />
applications<br />
Average<br />
proportion of<br />
full label rate<br />
Copper oxychloride 806 758 0.43 0.11 3.00 0.85<br />
Azoxystrobin 264 51 0.14 0.06 1.50 0.83<br />
Chlorothalonil 237 340 0.13 0.03 2.00 0.90<br />
Fenpropimorph 234 134 0.12 0.07 1.33 0.75<br />
Difenoconazole 172 16 0.09 0.03 2.50 0.85<br />
Other root vegetables – Insecticides<br />
Aphids, carrot fly (P. rosae) <strong>and</strong> silver-Y moth (A. gamma) were the principal reasons given for insecticide use,<br />
accounting for 62%, 18% <strong>and</strong> 15% of the insecticide-treated area respectively. Lambda-cyhalothrin was the most<br />
extensively-used insecticide on other root vegetables, accounting for almost two thirds of the insecticide-treated area,<br />
with two applications being applied to 23% of the area grown. Two applications of pirimicarb, comprising 34% of the<br />
insecticide-treated area, were applied to 13% of the area grown.<br />
Insecticide active substance<br />
Formulation<br />
area treated<br />
(ha)<br />
Weight of a.s.<br />
applied (kg)<br />
Proportion of<br />
insecticidetreated<br />
area<br />
Proportion of<br />
census area<br />
treated<br />
Average<br />
number of<br />
applications<br />
Average<br />
proportion of<br />
full label rate<br />
Lambda-cyhalothrin 1,218 13 0.65 0.23 2.06 0.94<br />
Pirimicarb 632 96 0.34 0.13 2.00 0.88<br />
Alpha-cypermethrin 11 < 1 0.01 < 0.01 1.00 1.00<br />
Deltamethrin 6 < 1 < 0.01 < 0.01 1.00 0.82<br />
Carbosulfan 2 2 < 0.01 < 0.01 1.00 1.00
Other root vegetables – Comparison with previous survey (Tables 23 & 24)<br />
<strong>The</strong> area of other root vegetables grown in 2003 had increased by 33% compared with 1999 but decreased by 3%<br />
compared with 1991. However, the pesticide-treated area of other root vegetables, excluding sodium chloride use,<br />
increased by 89% compared with 1999, <strong>and</strong> by 10% compared with 1991. Again excluding sodium chloride, the weight<br />
of pesticides applied increased by 107% compared with 1999, with a 43% increase compared with 1991. <strong>The</strong> average<br />
application rate of insecticides had fallen from 0.37 kg of active substance per hectare in 1991 to 0.06 kg/ha in 2003.<br />
Similarly fungicide rates of application fell from 0.93 kg/ha in 1991 to 0.69 kg/ha in 2003 whilst the rate of herbicide<br />
applications increased from 0.49 kg/ha to 0.56 kg/ha over the same period.<br />
<strong>The</strong> charts below illustrates that there was a decrease in the number of sprays, products <strong>and</strong> active substances applied to<br />
other root vegetables between 1991 <strong>and</strong> 2003. However, compared with 1999, although the number of sprays has<br />
remained the same, the total number of products <strong>and</strong> active substances used had increased, reflecting a greater degree of<br />
tank mixing in 2003.<br />
Number of applications<br />
9<br />
8<br />
7<br />
6<br />
5<br />
4<br />
3<br />
2<br />
1<br />
0<br />
Summary of the number of pesticide sprays, products <strong>and</strong> active substances applied to<br />
Other root vegetables 1991 - 2003<br />
1991 1995 1999 2003<br />
75<br />
Sprays<br />
Products<br />
Active substances
Other root vegetables – Herbicides<br />
Herbicide usage increased by 63% in terms of area treated between 1999 <strong>and</strong> 2003, whilst the weight applied increased<br />
by 84% over the same period. Since 1995 the order of the principal three active substances, phenmedipham, metamitron<br />
<strong>and</strong> ethofumesate, has remained unchanged.<br />
Changes in the area treated (ha) for the top five herbicides in 2003 used on other root vegetables over the period 1991 – 2003<br />
(figures in parentheses refer to position in previous years)<br />
Herbicide 2003 1999 1995 1991<br />
Phenmedipham 4,539 3,695 (1) 4,728 (1) 6,592 (1)<br />
Metamitron 3,037 2,181 (2) 1,950 (2) 2,299 (3)<br />
Ethofumesate 2,922 1,343 (3) 1,221 (3) 3,025 (2)<br />
Triflusulfuron-methyl 1,552 824 (5)<br />
Lenacil 1,073 138 (8) 232 (6) 11 (15)<br />
Other root vegetables – Fungicides<br />
In terms of area treated, fungicide usage had increased more than ten fold compared with previous surveys while by<br />
weight applied it had increased more than nine fold. Encountered for the first time in 2003 were the use of copper<br />
oxychloride, azoxystrobin <strong>and</strong> difenconazole.<br />
Changes in the area treated (ha) for the top five fungicides in 2003 used on other root vegetables over the period 1991 – 2003<br />
(figures in parentheses refer to position in previous years)<br />
Fungicide 2003 1999 1995 1991<br />
Copper oxychloride 806<br />
Azoxystrobin 264<br />
Chlorothalonil 237 12 (3) 99 (1)<br />
Fenpropimorph 234 173 (1) 76 (1)<br />
Difenoconazole 172<br />
Other root vegetables – Insecticides<br />
Insecticide usage in 2003, in terms of area treated, was more than four times greater than in 1999, but 46% less than in<br />
1991. By weight applied, the total used in 2003 was the same as in 1999 but 91% less than in 1991. <strong>The</strong>re was no<br />
recorded usage of organophosphate insecticides in 2003. Usage of pyrethroids increased more than six fold from the<br />
previous survey, while use of carbamates increased from 20 to 635 treated hectares over the same period. Lambdacyhalothrin<br />
was the principal active substance used.<br />
Changes in the area treated (ha) for all insecticides in 2003 used on other root vegetables over the period 1991 – 2003<br />
(figures in parentheses refer to position in previous years)<br />
Insecticide 2003 1999 1995 1991<br />
Lambda-cyhalothrin 1,218 121 (2) 5 (9)<br />
Pirimicarb 632 12 (7) 1,056 (1) 776 (2)<br />
Alpha-cypermethrin 11<br />
Deltamethrin 6 2 (11) 68 (8)<br />
76
Table 23 Comparison of pesticide usage in other root vegetables, 1991 - 2003, area treated (ha) <strong>and</strong> amount used (t)<br />
Chemical 1991 1995 1999 2003<br />
ha t ha t ha t ha t<br />
Insecticides<br />
Carbamates 776 0.11 1,194 0.26 20 0.01 635 0.10<br />
Organochlorines . . 2 < 0.01 . . . .<br />
Organophosphates 1,884 1.16 1,023 0.53 214 0.10 . .<br />
Pyrethroids 798 0.02 719 0.02 204 < 0.01 1,235 0.01<br />
Other insecticides . . . . 6 < 0.01 . .<br />
Total - all insecticides 3,457 1.29 2,938 0.81 444 0.11 1,869 0.11<br />
Fungicides 116 0.11 76 0.06 185 0.14 1,883 1.31<br />
Sulphur . . . . 104 0.32 170 0.91<br />
Herbicides 14,734 6.52 10,481 8.13 9,918 4.88 16,183 8.99<br />
Sodium chloride 1<br />
. . . . 68 67.62 5 0.57<br />
Molluscicides 31 0.01 78 0.03 . . 9 < 0.01<br />
Total - all registered pesticides 18,339 7.92 13,574 9.03 10,719 73.08 20,119 11.89<br />
Area grown 2,426 2,513 1,760 2,342<br />
1 data on use of sodium chloride was not collected in 1991 or 1995<br />
77
Table 24 Comparison of pesticide usage in other root vegetables, 1991 - 2003, treated area as a percentage of area grown <strong>and</strong> average rate applied (kg<br />
a.s./ha)<br />
Chemical 1991 1995 1999 2003<br />
Area treated Average Area treated Average Area treated Average Area treated Average<br />
as % of area appln. rate as % of area appln. rate as % of area appln. rate as % of area appln. rate<br />
grown (kg a.s./ha) grown (kg a.s./ha) grown (kg a.s./ha) grown (kg a.s./ha)<br />
Insecticides<br />
Carbamates 32 0.14 48 0.22 1 0.49 27 0.15<br />
Organochlorines . . < 1 0.84 . . . .<br />
Organophosphates 78 0.62 41 0.52 12 0.47 . .<br />
Pyrethroids 33 0.02 29 0.02 12 0.01 53 0.01<br />
Other insecticides . . . . < 1 0.16 . .<br />
Total - all insecticides 143 0.37 117 0.28 25 0.26 80 0.06<br />
Fungicides 5 0.93 3 0.75 11 0.76 80 0.69<br />
Sulphur . . . . 6 3.03 7 5.37<br />
Herbicides 607 0.44 417 0.78 564 0.49 691 0.56<br />
Sodium chloride 1<br />
. . . . 4 1,000.00 < 1 125.65<br />
Molluscicides 1 0.22 3 0.44 . . < 1 0.53<br />
All registered pesticides 756 0.43 540 0.67 609 6.82 859 0.59<br />
1 data on use of sodium chloride was not collected in 1991 or 1995<br />
78
PESTICIDE USAGE ON CUCURBITS<br />
Crops within this group included outdoor production of courgettes, cucumber, gherkins, marrow, melon <strong>and</strong> pumpkins.<br />
However, pumpkins comprised 56% of the total area of vegetable crops grown within this crop group, with courgettes &<br />
marrows together accounting for almost all of the remainder. Cucurbits received, on average, 1 herbicide <strong>and</strong> 1<br />
fungicide. Herbicides accounted for 63% of the pesticide-treated area, fungicides 21%, sulphur 11%, molluscicides 4%,<br />
insecticides 2%, <strong>and</strong> soil sterilants less than one percent. By weight, soil sterilants comprised 41% of the total weight of<br />
pesticides applied, herbicides 29%, sulphur 27%, fungicides 2%, molluscicides one percent <strong>and</strong> insecticides less than one<br />
percent.<br />
Percentage of applications<br />
120<br />
100<br />
80<br />
60<br />
40<br />
20<br />
0<br />
Timing of applications to Courgette: January 2003 - December 2003<br />
Jan Feb Mar Apr May Jun Jul Aug Sep Oct Nov Dec<br />
Cucurbits – Sprayer water volumes<br />
Fungicide Herbicide Insecticide<br />
A wide range of water volumes were used for fungicide applications, whereas most herbicides were applied in sprayer<br />
water volumes of between 400 <strong>and</strong> 500 litres per hectare, with insecticides being applied in water volumes between 300<br />
<strong>and</strong> 400 litres per hectare.<br />
Percentage of area sprayed<br />
80<br />
70<br />
60<br />
50<br />
40<br />
30<br />
20<br />
10<br />
0<br />
Sprayer water volumes used for pesticide applications to Cucurbits 2003<br />
Fungicide Herbicide Insecticide<br />
79<br />
500 L/Ha
Cucurbits – Herbicides<br />
According to the reasons given by growers, general weed control <strong>and</strong> broad-leaved weed control accounted for 90% <strong>and</strong><br />
10% of the herbicide-treated area respectively. Isoxaben <strong>and</strong> propyzamide were the principal herbicide active substances<br />
used, accounting for 40% <strong>and</strong> 37% of the herbicide-treated area respectively. No single herbicide active substance was<br />
used more than once on cucurbit crops.<br />
Herbicide active substance Formulation<br />
area treated<br />
(ha)<br />
Weight of a.s.<br />
applied (kg)<br />
80<br />
Proportion of<br />
herbicidetreated<br />
area<br />
Proportion of<br />
census area<br />
treated<br />
Average<br />
number of<br />
applications<br />
Average<br />
proportion of<br />
full label rate<br />
Isoxaben 646 145 0.40 0.60 1.00 0.84<br />
Propyzamide 596 410 0.37 0.55 1.00 0.90<br />
Glyphosate 178 226 0.11 0.16 1.00 0.87<br />
Paraquat 90 47 0.06 0.08 1.00 0.42<br />
Diquat/paraquat 71 51 0.04 0.07 1.00 0.55<br />
Cucurbits – Fungicides<br />
<strong>The</strong> control of powdery mildew (Erysiphe cichoracearum) was the only reason cited for disease control. Bupirimate at<br />
three-quarters of the full label rate was used on 15% of the area of the crop grown <strong>and</strong> accounted for 68% of the<br />
fungicide-treated area.<br />
Fungicide active substance Formulation<br />
area treated<br />
(ha)<br />
Weight of a.s.<br />
applied (kg)<br />
Proportion of<br />
fungicidetreated<br />
area<br />
Proportion of<br />
census area<br />
treated<br />
Average<br />
number of<br />
applications<br />
Average<br />
proportion of<br />
full label rate<br />
Bupirimate 358 55 0.68 0.15 1.89 0.76<br />
Fenarimol 103 1 0.19 0.09 1.00 0.64<br />
Imazalil 67 2 0.13 0.03 1.25 1.00<br />
Cucurbits – Insecticides<br />
Aphids were the only reason cited for insecticide use. Pirimicarb was the principal active substance, being used on 4% of<br />
the area of the crop grown <strong>and</strong> accounting for 96% of all insecticide usage.<br />
Insecticide active substance<br />
Formulation<br />
area treated<br />
(ha)<br />
Weight of a.s.<br />
applied (kg)<br />
Proportion of<br />
insecticidetreated<br />
area<br />
Proportion of<br />
census area<br />
treated<br />
Average<br />
number of<br />
applications<br />
Average<br />
proportion of<br />
full label rate<br />
Pirimicarb 39 9 0.96 0.04 1.00 0.56<br />
Lambda-cyhalothrin 2 < 1 0.04 < 0.01 1.00 1.00<br />
Cucurbits – Soil sterilants<br />
Dazomet was the only soil sterilant record, being used prior to the planting of one percent the total area of cucurbits<br />
grown.
Cucurbits – Comparison with previous survey (Tables 25 & 26)<br />
<strong>The</strong> area of cucurbits grown in 2003 had decreased by 3% compared with 1999 but increased by 11% compared with<br />
1991. However, the pesticide-treated area of cucurbits increased by 20% compared with 1999, <strong>and</strong> by more than three<br />
times compared with 1991. <strong>The</strong> weight of pesticides applied decreased by 96% compared with 1999, but increased by<br />
more than four times compared with 1991. <strong>The</strong> large decrease in the weight applied between 1999 <strong>and</strong> 2003 is due to a<br />
greatly reduced use of soil sterilants. <strong>The</strong> average application rate of insecticides has fallen from 0.38 kg of active<br />
substance per hectare in 1991 to 0.13 kg/ha in 2003. Similarly fungicide rates of application fell from 0.97 kg/ha in 1991<br />
to 0.38 kg/ha in 2003, with the rate of herbicide applications declining from 2.57 kg/ha to 1.73 kg/ha over the same<br />
period.<br />
<strong>The</strong> charts below illustrates that there was a decrease in the number of sprays, products <strong>and</strong> active substances applied to<br />
cucurbits between 1991 <strong>and</strong> 2003.<br />
Number of applications<br />
4<br />
3<br />
2<br />
1<br />
0<br />
Summary of the number of pesticide sprays, products <strong>and</strong> active substances applied to<br />
Cucurbits 1991 - 2003<br />
1991 1995 1999 2003<br />
81<br />
Sprays<br />
Products<br />
Active substances
Cucurbits – Herbicides<br />
Herbicide usage increased by 96% in terms of area treated between 1999 <strong>and</strong> 2003, whilst the weight applied increased<br />
by 11% over the same period. <strong>The</strong> principal herbicides used in 2003, isoxaben <strong>and</strong> propyzamide, were not encountered<br />
prior to 1999.<br />
Changes in the area treated (ha) for the top five herbicides in 2003 used on cucurbits over the period 1991 – 2003<br />
(figures in parentheses refer to position in previous years)<br />
Herbicide 2003 1999 1995 1991<br />
Isoxaben 646 12 (8)<br />
Propyzamide 596 20 (5)<br />
Glyphosate 178 414 (1) 74 (3) 20 (3)<br />
Paraquat 90 54 (3) 323 (1) 84 (2)<br />
Diquat/paraquat 71 262 (2) 147 (2) 17 (4)<br />
Cucurbits – Fungicides<br />
In terms of area treated, fungicide usage had decreased by 14% compared with 1999, but more than doubled compared<br />
with 1991. By weight applied, fungicide usage had decreased by 57% compared with 1999 <strong>and</strong> by 25% compared with<br />
1991. Bupirimate has been the principal fungicide recorded since 1991.<br />
Changes in the area treated (ha) for all fungicides in 2003 used on cucurbits over the period 1991 – 2003<br />
(figures in parentheses refer to position in previous years)<br />
Fungicide 2003 1999 1995 1991<br />
Bupirimate 358 345 (1) 215 (1) 70 (1)<br />
Fenarimol 103 16 (5) 50 (2)<br />
Imazalil 67 96 (3) 213 (2) 38 (5)<br />
Cucurbits – Insecticides<br />
<strong>The</strong>re was limited use of insecticides in 2003, with no recorded use of organophosphates <strong>and</strong> overall insecticide usage<br />
fell by 90% compared with the previous survey <strong>and</strong> by 87% compared with 1991. Pirimicarb has been the principal<br />
active substance used since 1991.<br />
Changes in the area treated (ha) for all insecticides in 2003 used on cucurbits over the period 1991 – 2003<br />
(figures in parentheses refer to position in previous years)<br />
Insecticide 2003 1999 1995 1991<br />
Pirimicarb 39 277 (1) 132 (1) 5 (4)<br />
Lambda-cyhalothrin 2<br />
82
Table 25 Comparison of pesticide usage on cucurbits, 1991 - 2003, area treated (ha) <strong>and</strong> amount used (t)<br />
Chemical 1991 1995 1999 2003<br />
ha t ha t ha t ha t<br />
Insecticides<br />
Carbamates 5 < 0.01 132 0.03 277 0.05 39 0.01<br />
Organophosphates 315 0.07 11 < 0.01 20 0.01 . .<br />
Pyrethroids . . . . 112 0.02 2 < 0.01<br />
Total - all insecticides 320 0.07 143 0.03 410 0.08 41 0.01<br />
Fungicides 244 0.08 620 0.24 612 0.14 528 0.06<br />
Sulphur . . . . 123 0.53 267 0.85<br />
Herbicides 257 0.61 603 0.62 819 0.82 1,602 0.91<br />
Molluscicides 4 < 0.01 61 0.01 53 0.02 97 0.03<br />
Soil sterilants . . 8 3.12 110 80.96 7 1.30<br />
Total - all registered pesticides 824 0.77 1,435 4.02 2,126 82.55 2,541 3.15<br />
Area grown 970 950 1,112 1,080<br />
83
Table 26 Comparison of pesticide usage in cucurbits, 1991 - 2003, treated area as a percentage of area grown <strong>and</strong> average rate applied (kg a.s./ha)<br />
Chemical 1991 1995 1999 2003<br />
Area treated Average Area treated Average Area treated Average Area treated Average<br />
as % of area appln. rate as % of area appln. rate as % of area appln. rate as % of area appln. rate<br />
grown (kg a.s./ha) grown (kg a.s./ha) grown (kg a.s./ha) grown (kg a.s./ha)<br />
Insecticides<br />
Benzoylureas 2 0.09 . . . . 1 0.07<br />
Carbamates 39 0.46 54 0.30 65 0.23 98 0.21<br />
Organochlorines < 1 0.23 2 0.42 < 1 0.28 < 1 0.42<br />
Organophosphates 235 0.61 291 0.47 205 0.53 24 0.67<br />
Pyrethroids 156 0.02 266 0.02 229 0.01 196 0.01<br />
Other insecticides 2 0.13 6 0.12 41 0.16 142 0.14<br />
Total - all insecticides 436 0.38 618 0.26 540 0.25 461 0.13<br />
Registered biological control agents < 1 0.60 < 1 0.33 < 1 0.18 < 1 0.05<br />
Fungicides 93 0.97 148 0.80 186 0.53 178 0.38<br />
Sulphur < 1 2.38 1 4.59 3 4.53 3 3.41<br />
Herbicides 135 2.57 177 2.24 164 1.78 195 1.73<br />
Molluscicides 9 0.26 15 0.34 50 0.37 37 0.38<br />
Repellents < 1 0.36 1 1.00 < 1 3.20 . .<br />
Soil sterilants < 1 364.62 < 1 389.07 . . . .<br />
Physical control agents . . . . . . < 1 4.19<br />
All registered pesticides 673 0.91 960 0.72 942 0.59 874 0.56<br />
84
PESTICIDE USAGE ON OTHER OUTDOOR VEGETABLES<br />
This crop group included a wide variety of crops. However, herbs, both annual <strong>and</strong> perennial, comprised 41% of the total<br />
area of other outdoor vegetable crops, with asparagus accounting for a further 18% <strong>and</strong> baby leaf vegetables 11%. As a<br />
mixed group they received, on average, 2 herbicides, 1 insecticide <strong>and</strong> 1 fungicide. Herbicides accounted for 50% of the<br />
pesticide-treated area, insecticides 34%, fungicides 12%, molluscicides, physical control agents <strong>and</strong> sodium chloride one<br />
percent each <strong>and</strong> sulphur <strong>and</strong> biological control agents less than one percent. By weight, sodium chloride comprised 71%<br />
of the total weight of pesticides applied, herbicides 24%, fungicides 3%, insecticides one percent <strong>and</strong> sulphur, physical<br />
control agents, molluscicides <strong>and</strong> biological control agents less than one percent. Applications of sodium chloride to<br />
other outdoor vegetables were restricted to asparagus crops.<br />
Percentage of applications<br />
Percentage of applications<br />
60<br />
50<br />
40<br />
30<br />
20<br />
10<br />
0<br />
45<br />
40<br />
35<br />
30<br />
25<br />
20<br />
15<br />
10<br />
5<br />
0<br />
Timing of pesticide application to Herbs: January 2003 - December 2003<br />
Jan Feb Mar Apr May Jun Jul Aug Sep Oct Nov Dec<br />
Fungicide Herbicide Insecticide<br />
Timing of pesticide applications to Asparagus: January 2003 - December 2003<br />
Jan Feb Mar Apr May Jun Jul Aug Sep Oct Nov Dec<br />
Fungicide Herbicide Insecticide<br />
85
Other outdoor vegetables – Sprayer water volumes<br />
Most fungicides, herbicides <strong>and</strong> insecticides were applied in sprayer water volumes of between 200 <strong>and</strong> 300 litres per<br />
hectare.<br />
Percentage of area sprayed<br />
80<br />
70<br />
60<br />
50<br />
40<br />
30<br />
20<br />
10<br />
0<br />
Sprayer water volumes used for pesticide applications to Other outdoor vegetables 2003<br />
Other outdoor vegetables – Herbicides<br />
Fungicide Herbicide Insecticide<br />
86<br />
500 L/Ha<br />
According to reasons given by growers, broad-leaved weed control <strong>and</strong> general weed control accounted for 82% <strong>and</strong> 15%<br />
of the herbicide-treated area respectively. A single application of glyphosate was used, at almost full label rate, prior to<br />
the planting or sowing of a third of the crop. Linuron, used at half full label rate, was used on another 24% of the area<br />
grown <strong>and</strong> accounted for 10% of the herbicide-treated area.<br />
Herbicide active substance Formulation<br />
area treated<br />
(ha)<br />
Weight of a.s.<br />
applied (kg)<br />
Proportion of<br />
herbicidetreated<br />
area<br />
Proportion of<br />
census area<br />
treated<br />
Average<br />
number of<br />
applications<br />
Average<br />
proportion of<br />
full label rate<br />
Glyphosate 1,849 2,236 0.12 0.33 1.03 0.93<br />
Linuron 1,445 819 0.10 0.24 1.03 0.55<br />
Diquat/paraquat 1,387 793 0.09 0.19 1.19 0.55<br />
Metamitron 1,161 1,014 0.08 0.14 1.40 0.51<br />
Pendimethalin 956 1,228 0.06 0.19 1.00 0.58<br />
Other outdoor vegetables – Fungicides<br />
Most fungicides, 42% of the fungicide-treated area, were used for general disease control, with a further 27% being used<br />
specifically against downy mildews. Control of purple spot (Stemphyllium vesicarium) on asparagus accounted for a<br />
further 8% of the fungicide-treated area. Use of azoxystrobin accounted for 29% of the fungicide-treated area, being<br />
used on 17% of the area grown, tebuconazole was used on a further 10% of the area grown, whilst fosetyl-aluminium,<br />
used on 7% of the area grown, accounted for 45% of the weight of fungicides applied.<br />
Fungicide active substance Formulation<br />
area treated<br />
(ha)<br />
Weight of a.s.<br />
applied (kg)<br />
Proportion of<br />
fungicidetreated<br />
area<br />
Proportion of<br />
census area<br />
treated<br />
Average<br />
number of<br />
applications<br />
Average<br />
proportion of<br />
full label rate<br />
Azoxystrobin 1,010 173 0.29 0.17 1.19 0.79<br />
Tebuconazole 711 94 0.20 0.10 1.39 0.81<br />
Fosetyl-aluminium 486 951 0.14 0.07 1.43 0.93<br />
Mancozeb/metalaxyl-M 446 525 0.13 0.08 1.14 0.95<br />
Iprodione 348 139 0.10 0.06 1.07 0.74
Other outdoor vegetables – Insecticides<br />
Aphids were the main reason cited for insecticide use, accounting for 41% of usage. Other important pest species<br />
included caterpillars, carrot fly (P. rosae) <strong>and</strong> asparagus beetle (Crioceris asparagi), accounting for 21%, 12% <strong>and</strong> 7% of<br />
the insecticide-treated area respectively. Deltamethrin was the principal active substance, being used on 37% of the area<br />
of the crop grown <strong>and</strong> accounting for 36% of all insecticide usage. <strong>The</strong> use of pirimicarb, primarily for aphid control,<br />
accounted for a further 23% of the insecticide-treated area.<br />
Insecticide active substance<br />
Formulation<br />
area treated<br />
(ha)<br />
Weight of a.s.<br />
applied (kg)<br />
87<br />
Proportion of<br />
insecticidetreated<br />
area<br />
Proportion of<br />
census area<br />
treated<br />
Average<br />
number of<br />
applications<br />
Average<br />
proportion of<br />
full label rate<br />
Deltamethrin 3,628 25 0.36 0.37 2.05 0.95<br />
Pirimicarb 2,276 345 0.23 0.21 1.67 1.28<br />
Lambda-cyhalothrin 1,137 7 0.11 0.11 1.48 0.76<br />
Cypermethrin 1,034 25 0.10 0.14 1.48 0.99<br />
Lambdacyhalothrin/pirimicarb<br />
727 109 0.07 0.09 1.52 0.96
Other outdoor vegetables – Comparison with previous survey (Tables 27 & 28)<br />
<strong>The</strong> area of other outdoor vegetables grown in 2003 had increased by 5% compared with 1999 <strong>and</strong> by 11% compared<br />
with 1991. However, excluding sodium chloride, the pesticide-treated area increased by 89% compared with 1999, <strong>and</strong><br />
almost three fold compared with 1991. Again, excluding sodium chloride, the weight of pesticides applied decreased by<br />
73% compared with 1999, mainly due to no recorded use of soil sterilants on this crop group in 2003, but increased by<br />
167% compared with 1991. <strong>The</strong> average application rate of insecticides fell from 0.28 kg of active substance per hectare<br />
in 1991 to 0.07 kg/ha in 2003. Similarly, fungicide rates of application fell from 1.00 kg/ha in 1991 to 0.60 kg/ha in<br />
2003. Although herbicide rates rose from 1.12 kg/ha in 1999 to 1.27 kg/ha in 2003, the rate used in 2003 was little<br />
different from that used in 1991.<br />
<strong>The</strong> charts below illustrate an overall increase in the number of sprays, products <strong>and</strong> active substances applied to other<br />
outdoor vegetables between 1991 <strong>and</strong> 1999, but a fall between 1999 <strong>and</strong> 2003. This is possibly due to the increased area<br />
of baby-leaf vegetables, which by their very nature only have a limited time during which sprays can be applied.<br />
Numbers of applications<br />
8<br />
7<br />
6<br />
5<br />
4<br />
3<br />
2<br />
1<br />
0<br />
Summary of the number of pesticide sprays, products <strong>and</strong> active substances applied to<br />
Other outdoor vegetables 1991 - 2003<br />
1991 1995 1999 2003<br />
88<br />
Sprays<br />
Products<br />
Active substances
Other outdoor vegetables – Herbicides<br />
Herbicide usage, in terms of area treated, increased by 65% between 1999 <strong>and</strong> 2003, <strong>and</strong> more than doubled between<br />
1991 <strong>and</strong> 2003. By weight applied, herbicide usage increased by 86% compared with 1999, <strong>and</strong> by 132% compared with<br />
1991. Glyphosate was the principal herbicide in both 1999 <strong>and</strong> 2003, replacing linuron, which was the principal<br />
herbicide in 1995.<br />
Changes in the area treated (ha) for the top five herbicides in 2003 used on other outdoor vegetables over the period 1991 – 2003<br />
(figures in parentheses refer to position in previous years)<br />
Herbicide 2003 1999 1995 1991<br />
Glyphosate 1,849 1,638 (1) 190 (11) 483 (4)<br />
Linuron 1,445 589 (6) 788 (1) 766 (3)<br />
Diquat/paraquat 1,387 621 (5) 185 (12) 74 (258)<br />
Metamitron 1,161 111 (259) 46 (262)<br />
Pendimethalin 956 153 (14) 46 (259) 431 (5)<br />
Other outdoor vegetables – Fungicides<br />
In terms of area treated, fungicide usage had increased by almost three times compared with 1999, <strong>and</strong> by almost seven<br />
times compared with 1991. By weight applied, fungicide usage in 2003 was more than double that recorded in 1999 <strong>and</strong><br />
four times greater than in 1991. Azoxystrobin, recorded for the first time in 2003, replaced tebuconazole, the principal<br />
active substance in 1999, as the principal active substance in the current survey.<br />
Changes in the area treated (ha) for the top five fungicides in 2003 used on other outdoor vegetables over the period 1991 – 2003<br />
(figures in parentheses refer to position in previous years)<br />
Fungicide 2003 1999 1995 1991<br />
Azoxystrobin 1,010<br />
Tebuconazole 711 437 (1)<br />
Fosetyl-aluminium 486 130 (6)<br />
Mancozeb/metalaxyl-M 446<br />
Iprodione 348 30 (10) 59 (4) 34 (6)<br />
Other outdoor vegetables – Insecticides<br />
<strong>The</strong>re was no recorded use of organophosphates in 2003, but the area treated with pyrethroids was more than double that<br />
recorded in 1999, <strong>and</strong> four times greater than in 1991. Usage of carbamates more than doubled between 1999 <strong>and</strong> 2003,<br />
<strong>and</strong> the area treated was almost ten times greater than that recorded in 1991. Usage of the pyrethroids deltamethrin <strong>and</strong><br />
lambda-cyhalothrin has continued to increase over the period of comparison, whilst that of cypermethrin declined.<br />
Changes in the area treated (ha) for the top five insecticides in 2003 used on other outdoor vegetables over the period 1991 – 2003<br />
(figures in parentheses refer to position in previous years)<br />
Insecticide 2003 1999 1995 1991<br />
Deltamethrin 3,628 510 (3) 899 (3) 863 (1)<br />
Pirimicarb 2,276 888 (2) 1,162 (1) 281 (6)<br />
Lambda-cyhalothrin 1,137 59 (8) 55 (9)<br />
Cypermethrin 1,035 2,333 (1) 328 (5) 453 (5)<br />
Lambda-cyhalothrin/pirimicarb 727 306 (4)<br />
89
Table 27 Comparison of pesticide usage in other outdoor vegetables, 1991 - 2003, area treated (ha) <strong>and</strong> amount used (t)<br />
Chemical 1991 1995 1999 2003<br />
ha t ha t ha t ha t<br />
Insecticides<br />
Carbamates 289 0.05 1,162 0.22 888 0.13 2,277 0.35<br />
Organochlorines 114 0.01 28 0.02 . . . .<br />
Organophosphates 1,850 0.99 2,161 1.38 340 0.19 . .<br />
Pyrethroids 1,536 0.02 1,282 0.01 2,903 0.06 6,017 0.06<br />
Other insecticides . . . . 472 0.05 1,710 0.27<br />
Total - all insecticides 3,789 1.07 4,631 1.63 4,603 0.43 10,004 0.68<br />
Registered biological control agents . . . . . . 98 < 0.01<br />
Fungicides 507 0.51 776 0.54 1,341 0.94 3,512 2.10<br />
Sulphur 2 0.02 . . . . 99 0.38<br />
Herbicides 6,483 8.05 4,628 5.82 8,941 10.04 14,747 18.68<br />
Sodium chloride 1<br />
. . . . 176 154.87 187 54.76<br />
Molluscicides 107 0.01 496 0.15 391 0.10 382 0.12<br />
Soil sterilants . . . . 77 71.65 . .<br />
Physical control agents . . . . . . 208 0.22<br />
Total - all registered pesticides 10,890 9.67 10,531 8.13 15,530 238.03 29,236 76.94<br />
Area grown 4,625 3,088 4,861 5,122<br />
1 data on use of sodium chloride was not collected in 1991 or 1995<br />
90
Table 28 Comparison of pesticide usage in other outdoor vegetables, 1991 - 2003, treated area as a percentage of area grown <strong>and</strong> average rate applied<br />
(kg a.s./ha)<br />
Chemical 1991 1995 1999 2003<br />
Area treated Average Area treated Average Area treated Average Area treated Average<br />
as % of area appln. rate as % of area appln. rate as % of area appln. rate as % of area appln. rate<br />
grown (kg a.s./ha) grown (kg a.s./ha) grown (kg a.s./ha) grown (kg a.s./ha)<br />
Insecticides<br />
Carbamates 6 0.17 38 0.19 18 0.15 44 0.15<br />
Organochlorines 2 0.08 1 0.84 . . . .<br />
Organophosphates 40 0.54 70 0.64 7 0.56 . .<br />
Pyrethroids 33 0.01 42 0.01 60 0.02 117 0.01<br />
Other insecticides . . . . 10 0.11 33 0.16<br />
Total - all insecticides 82 0.28 150 0.35 95 0.09 195 0.07<br />
Registered biological control agents . . . . . . 2 0.03<br />
Fungicides 11 1.00 25 0.69 28 0.70 69 0.60<br />
Sulphur < 1 10.77 . . < 1 8.00 2 3.87<br />
Herbicides 140 1.24 150 1.26 184 1.12 288 1.27<br />
Sodium chloride 1<br />
. . . . 4 878.00 4 293.52<br />
Molluscicides 2 0.12 16 0.30 8 0.25 7 0.30<br />
Soil sterilants . . . . 2 933.85 . .<br />
Physical control agents . . . . . . 4 1.04<br />
All registered pesticides 235 0.89 341 0.77 319 15.33 571 2.63<br />
1 data on use of sodium chloride was not collected in 1991 or 1995<br />
91
COMPARISON OF PESTICIDE USAGE ON ALL VEGETABLE CROPS (Tables 29 & 30)<br />
In 2003, there were reductions of 8% <strong>and</strong> 20% in the area of all vegetable crops grown compared with 1999 <strong>and</strong> 1991<br />
respectively. However, there has been a one percent increase in the area treated compared with 1999 <strong>and</strong> 23% compared<br />
with 1991. By contrast, the weights applied decreased by 31% compared with 1999, <strong>and</strong> by 8% over the last thirteen<br />
years.<br />
Herbicides were the major area of pesticide usage in 2003. <strong>The</strong> area treated showed little change on that found in 1999,<br />
but increased by 23% compared with 1991. <strong>The</strong>re was a decrease in the weight applied compared with the previous<br />
survey of 31%, <strong>and</strong> a 8% decrease between 1991 <strong>and</strong> the current survey. If the rates of application per treatment are<br />
compared these show a decrease from 1.37 kg/ha being applied in 1991 to 0.94 kg/ha in the current survey.<br />
Insecticides have been an important group of pesticides in each survey over the last thirteen years. However, there was a<br />
9% reduction in the insecticide-treated area compared with 1999, <strong>and</strong> a 13% reduction compared with 1991. In contrast,<br />
there were reductions in the weight applied of 52% compared with 1999 <strong>and</strong> 76% compared with 1991. This reflected a<br />
move away from organophosphates <strong>and</strong> carbamates to an increased usage of pyrethroids over the last thirteen years <strong>and</strong>,<br />
because of their lower rates of application, a corresponding decrease in weight applied. <strong>The</strong> rate of application of<br />
insecticides fell from 0.44 kg/ha in 1991 to 0.12 kg/ha in 2003.<br />
Pyrethroids were the most important insecticide group used in 2003. However, their use had decreased by 2% in terms of<br />
area treated compared with 1999, though they showed a 69% increase in use compared with 1991. <strong>The</strong> weight of<br />
pyrethroids applied decreased by 17% compared with 1999 <strong>and</strong> by 12% compared with 1991.<br />
Organophosphates have been one of the most important insecticide groups used over the last decade <strong>and</strong> were the<br />
principal insecticide group used between 1991 <strong>and</strong> 1995. However, their use declined by 87% compared with 1999 <strong>and</strong><br />
by 94% compared with 1991. By weight applied, the organophosphates had declined by 86% <strong>and</strong> 95% respectively<br />
compared with 1999 <strong>and</strong> 1991.<br />
Carbamate insecticide usage increased by 20% compared with 1999, <strong>and</strong> by 19% compared with 1991. <strong>The</strong> weight<br />
applied had decreased by 12% compared with 1999, <strong>and</strong> by 13% compared with 1991.<br />
<strong>The</strong> use of “other” insecticides, in particular formulated products containing carbamates <strong>and</strong> pyrethroids, had more than<br />
doubled compared with 1999 <strong>and</strong> was more than fifty times the area treated in 1991 because of new products being<br />
introduced.<br />
Fungicide use increased in terms of area treated by 24% compared with 1999 <strong>and</strong> was double that of 1991. <strong>The</strong> weight<br />
of fungicides applied increased by 11% compared with 1999, <strong>and</strong> by 2% compared with 1991. Nonetheless, the average<br />
rate of fungicide applications decreased from 1.39 kg/ha in 1991 to 0.67 kg /ha in 2003.<br />
<strong>The</strong> molluscicide treated area increased by 15% compared with 1999 <strong>and</strong> was almost six times greater than the area<br />
treated in 1991. <strong>The</strong> weight applied in 2003 was 36% greater than that applied in 1999, <strong>and</strong> eleven times greater than in<br />
1991. Usage of vertebrate repellents, mainly for bird control, was not recorded in 2003.<br />
Usage of sulphur decreased in terms of area treated, by 30% compared with 1999, but was almost three times greater than<br />
the area treated in 1991. <strong>The</strong> weight of sulphur applied decreased by 27% compared with 1999 but was almost four times<br />
greater than that applied in 1991.<br />
92
Growth regulator usage decreased by 31% in terms of area treated compared with 1999, <strong>and</strong> by 10% compared with<br />
1991. In terms of the weight applied, growth regulator usage declined by 29% compared with 1999 <strong>and</strong> by 32%<br />
compared with 1991.<br />
Biological control usage, registered <strong>and</strong> non-registered, was minimal over the last thirteen years, <strong>and</strong> despite a 33%<br />
increase in the area treated with all biological control agents between 1995 <strong>and</strong> 1999, there was a fall of 31% compared<br />
with 1991.<br />
Usage of soil sterilants decreased by 57% between 1999 <strong>and</strong> 2003, but the area treated in the current survey was eleven<br />
times greater than that recorded in 1991. In terms of weight applied, use of soil sterilants had fallen by 78% compared<br />
with 1999, but was thirteen times greater than in 1991.<br />
All outdoor vegetables – number of pesticide applications<br />
<strong>The</strong> chart below shows a slight increase in the number of sprays applied to vegetable crops since 1991, from five to six,<br />
but larger increases in the number of products applied from six to ten, <strong>and</strong> active substances from eight to eleven. Much<br />
of this is due to an increased use of fungicides on the crop groups onions & leeks <strong>and</strong> peas & beans.<br />
Number of applications<br />
12<br />
10<br />
8<br />
6<br />
4<br />
2<br />
0<br />
Summary of the number of pesticide sprays, products <strong>and</strong> active substances applied to all<br />
crops 1991 - 2003<br />
1991 1995 1999 2003<br />
93<br />
Sprays<br />
Products<br />
Active substances
Table 29 Comparison of pesticide usage on vegetable crops, 1991 - 2003, area treated (ha) <strong>and</strong> amount used (t)<br />
Chemical 1991 1995 1999 2003<br />
ha t ha t ha t ha t<br />
Acaricides . . 38 0.01 . . . .<br />
Insecticides<br />
Benzoylureas 936 0.09 . . 96 < 0.01 282 0.02<br />
Carbamates 79,994 28.43 104,092 30.47 79,256 28.26 95,195 24.79<br />
Organochlorines 397 0.16 767 0.34 8 < 0.01 1 < 0.01<br />
Organophosphates 225,309 154.29 201,185 113.31 107,324 58.49 14,062 8.41<br />
Pyrethroids 110,243 2.17 187,025 3.53 190,298 2.29 186,526 1.91<br />
Other insecticides 1,265 0.16 7,821 1.02 23,813 3.51 67,263 9.21<br />
Total insecticides 418,144 185.3 500,891 148.67 400,794 92.56 363,329 44.34<br />
Registered biological control agents 773 0.19 644 0.06 395 0.07 281 0.01<br />
Fungicides 138,155 187.86 171,048 183.48 224,433 164.32 277,552 183.17<br />
Sulphur 3,160 12.25 9,018 37.16 12,783 61.88 8,992 44.97<br />
Growth regulators 3,837 10.88 4,616 11.85 4,995 10.44 3,445 7.39<br />
Herbicides 351,513 483.48 410,566 504.32 449,423 445.90 449,436 420.83<br />
Sodium chloride 1<br />
. . . . 244 222.49 195 56.04<br />
Molluscicides 5,293 1.25 9,082 3.05 27,156 10.19 31,124 13.86<br />
Repellents 169 0.06 242 0.25 5 0.02 . .<br />
Soil sterilants 8 2.75 36 13.78 206 163.85 88 36.31<br />
Physical control agents . . . . . . 1,205 2.81<br />
Growth stimulants . . . . . . 116 0.12<br />
Total - all registered pesticides 921,051 884.02 1,106,180 902.63 1,120,434 1,171.72 1,135,764 809.87<br />
Non-registered biological control agents . . 346 . 7 . 252 0.44<br />
Are grown (hectares) 152,701 142,342 131,766 121,725<br />
1 data on use of sodium chloride was not collected in 1991 or 1995<br />
94
Table 30 Comparison of pesticide usage on all vegetables 1991 - 2003, treated area as a percentage of area grown <strong>and</strong> average rate applied (kg a.s./ha)<br />
Chemical 1991 1995 1999 2003<br />
Area treated Average Area treated Average Area treated Average Area treated Average<br />
as % of area appln. rate as % of area appln. rate as % of area appln. rate as % of area appln. rate<br />
grown (kg a.s./ha) grown (kg a.s./ha) grown (kg a.s./ha) grown (kg a.s./ha)<br />
Acaricides . . < 1 0.16 . . . .<br />
Insecticides<br />
Benzoylureas 1 0.09 . . < 1 0.02 < 1 < 0.01<br />
Carbamates 48 0.32 68 0.26 55 0.34 75 0.26<br />
Organochlorines < 1 0.42 1 0.45 0 0.28 < 1 0.42<br />
Organophosphates 139 0.69 132 0.56 76 0.55 11 0.6<br />
Pyrethroids 68 0.02 128 0.02 139 0.01 145 0.01<br />
Other insecticides 1 0.14 4 0.14 17 0.15 54 0.14<br />
Total insecticides 257 0.44 332 0.29 287 0.23 284 0.12<br />
Registered biological control agents 1 0.24 < 1 0.1 < 1 0.18 0 0.04<br />
Fungicides 82 1.39 114 1.05 160 0.75 215 0.67<br />
Sulphur 1 5.11 5 4.42 8 5.12 6 5.22<br />
Growth regulators 3 2.84 3 2.57 4 2.09 3 2.15<br />
Herbicides 216 1.37 271 1.19 320 0.99 349 0.94<br />
Sodium chloride 1<br />
. . . . < 1 911.81 < 1 287.12<br />
Molluscicides 2 0.3 5 0.35 18 0.39 22 0.43<br />
Repellents < 1 0.36 < 1 1.04 < 1 3.2 . .<br />
Soil sterilants < 1 364.62 < 1 389.08 < 1 795.36 < 1 410.58<br />
Physical control agents . . . . . . 1 2.33<br />
Growth stimulants . . . . . . < 1 1<br />
All registered pesticides 561 0.96 732 0.78 798 1.07 880 0.72<br />
Non-registered biological control agents . .
VEGETABLE SEED TREATMENTS<br />
Data collected on seed treatments were raised to estimate the total area sown with each vegetable seed treatment in Great<br />
Britain during 2003.<br />
Some of the active substances encountered <strong>and</strong> included in this report are not registered in this country <strong>and</strong> are imported<br />
on seeds from Europe where they have Approval.<br />
Approximately 66% of the total area of vegetable crops was grown from seed, the remainder being either produced as<br />
transplants or perennial crops. Over 90% of peas & beans, sweetcorn, other root vegetables, root crucifers <strong>and</strong> carrots,<br />
parsnips etc. were grown directly in the ground from seed. In contrast only one percent of lettuce, endive etc. <strong>and</strong> 8% of<br />
brassicas were grown directly in the ground from seed, the majority being produced using seed sown into modular trays<br />
or blocks in glasshouses <strong>and</strong> then transplanted to the field when required.<br />
<strong>The</strong> majority of seed was treated, with only 10% of the total area of all crops sown with untreated seed.<br />
Single fungicide treatments or fungicide/insecticide formulations accounted for 77% of the total area of all seed<br />
treatments used. <strong>The</strong> formulation cymoxanil/fludioxonil/metalaxyl-M, used on peas & beans <strong>and</strong> carrots, parsnips etc<br />
<strong>and</strong> thiram, used across the range of crops, were the most popular fungicide seed treatments overall, accounting for 49%<br />
<strong>and</strong> 14% respectively of the total seed treatment area. Other important formulations included thiabendazole/thiram,<br />
iprodione, metalaxyl <strong>and</strong> metalaxyl/thiabendazole. Insecticidal seed treatments, primarily tefluthrin on onions & leeks<br />
<strong>and</strong> carrots etc., accounted for 9% of the total seed treatment area.<br />
Brassicas etc.<br />
<strong>The</strong> principal seed treatment formulation used on brassicas was thiram, accounting for 32% of the treated seed area, with<br />
carbendazim/chlorpyrifos/iprodione/thiram comprising a further 16%. Imadacloprid was used on only this crop group,<br />
accounting for 9% of the area sown.<br />
Root crucifers<br />
Thiram accounted for 54% of root crucifer seed treatments, whilst iprodione alone <strong>and</strong> gamma-HCH/thiram accounted<br />
for the remaining 41% <strong>and</strong> 3% respectively. Forty-five percent of the area grown from seed remained untreated.<br />
Peas <strong>and</strong> beans<br />
Seventy-six percent of the total area of peas <strong>and</strong> beans grown were sown with cymoxanil/fludioxonil/metalaxyl-M treated<br />
seed, with thiram-treated seed being used on 10% of the area sown. Chlorpyrifos as a seed dressing was encountered<br />
exclusively on peas & beans <strong>and</strong> was used on 2% of the area sown.<br />
96
Onions & leeks<br />
Thiram alone was the most common seed treatment formulation used on onions & leeks, accounting for 35% of all<br />
fungicide seed treatments. Tefluthrin was the only insecticide encountered on onions & leeks, being used on 24% of the<br />
area grown from seed.<br />
Carrots, parsnips etc.<br />
Fungicide formulations were the principal seed treatments used on carrots, with cymoxanil/fludioxonil/metalaxyl-M<br />
accounting for 65% of the total area sown. Tefluthrin was the most widely used insecticide, applied to 35% of the area<br />
sown.<br />
Lettuce, endive etc.<br />
<strong>The</strong> only recorded seed treatment formulations used on lettuce, endive etc. contained thiram, accounting for 98% of the<br />
total area directly sown, but only 1% of the total area grown. <strong>The</strong> remaining area, grown from glasshouse-raised modular<br />
plants, is covered under surveys of protected crops.<br />
Sweetcorn<br />
Thiram was the principal seed treatment used on sweetcorn, applied alone, accounting for 46% of the total area grown.<br />
Captan was found exclusively on sweetcorn <strong>and</strong> was used on 7% of the area sown. Unspecified seed treatments<br />
accounted for 84% of the total area grown, some of which were used in combination with thiram. Unfortunately no<br />
further data were available on this imported seed.<br />
Other root vegetables<br />
Thiram alone was the principal seed treatment formulation used on other root vegetables, accounting for 94% of the seed<br />
treatment area, with iprodione comprising a further 3%.<br />
Cucurbits<br />
Most cucurbits were grown from transplanted crops with only 19% being grown directly from seed. Thiram was the only<br />
seed treatment formulation recorded <strong>and</strong> it accounted for 61% of the area sown.<br />
Other vegetables<br />
Sixty four percent of other vegetables were grown from seed. Of these, 61% remained untreated, with thiram alone<br />
accounting for 42% of the treated area <strong>and</strong> tefluthrin a further 14%.<br />
97
98<br />
Table 31 Usage of seed treatments on vegetable crops grown in Great Britain, 2003 (sown hectares)<br />
Brassicas etc. Root Peas & Onions & Carrots, Lettuce Sweetcorn Other root Cucurbits Other All<br />
crucifers beans leeks parsnips etc. endive etc. vegetables vegetables crops<br />
Fungicide/insecticide seed treatments<br />
Carbendazim/chlorpyrifos/iprodione/thiram 628 . . . . . . . . . 628<br />
Dichlofenthion/thiram . . 444 . . . . . . . 444<br />
Gamma-HCH/thiram . 67 . . . . . . . . 67<br />
All fungicide/insecticide seed treatments 628 67 444 . . . . . . . 1,139<br />
Fungicide seed treatments<br />
Captan . . . . . . 79 . . . 79<br />
Carbendazim 159 . 57 195 52 . . . . 22 486<br />
Carbendazim/cymoxanil/oxadixyl/thiram . . 395 . . . . . . . 395<br />
Carbendazim/thiram 158 . 28 796 . . . . . . 982<br />
Cymoxanil/fludioxonil/metalaxyl-M . . 35,008 . 7,961 . . . . . 42,970<br />
Iprodione 424 824 . . 640 . . 75 . 196 2,160<br />
Metalaxyl 457 . . 263 238 . . . . 370 1,328<br />
Metalaxyl-M . . . 377 147 . 79 . . 31 635<br />
Metalaxyl/thiabendazole . . . . 1,107 . . . . . 1,107<br />
Metalaxyl/thiabendazole/thiram . . 518 . . . . . . 14 532<br />
Tebuconazole . . . 791 . . . . . . 791<br />
Thiabendazole/thiram . . . 2,869 . . . . . . 2,869<br />
Thiram 1,239 1,092 3,209 2,901 725 54 508 2,073 127 815 12,743<br />
All fungicide seed treatments 2,437 1,916 39,216 8,192 10,871 54 666 2,149 127 1,449 67,076<br />
Insecticide seed treatments<br />
Chlorpyrifos . . 909 . . . . . . . 909<br />
Imidacloprid 218 . . . . . . . . . 218<br />
Tefluthrin . . . 2,416 4,324 . . . . 267 7,008<br />
All insecticide seed treatments 218 . 909 2,416 4,324 . . . . 267 8,135<br />
Unspecified seed treatments 538 45 6,249 2,689 1,161 3 920 47 73 240 11,965<br />
All seed treatments 1 3,821 2,028 46,818 13,297 16,356 57 1,586 2,196 200 1,956 88,315<br />
Not treated 84 1,105 485 2,612 1,289 2 86 196 10 2,001 7,869<br />
Area grown from seed 2,454 2,458 46,045 10,023 12,292 55 1,086 2,207 209 3,299 80,128<br />
1 note: the sum of multiple seed treatments to the same seed may give rise to treated areas apparently in excess of the area grown
99<br />
Table 32 Usage of seed treatments on vegetable crops grown in Great Britain, 2003 (kg active substance applied)<br />
Brassicas etc. Root Peas & Onions & Carrots etc. Lettuce Sweetcorn Other root Cucurbits Other All<br />
crucifers beans leeks endive etc. vegetables vegetables crops<br />
Fungicide/insecticide seed treatments<br />
Carbendazim/chlorpyrifos/iprodione/thiram 2 . . . . . . . . . 2<br />
Dichlofenthion/thiram . . 88 . . . . . . . 88<br />
Gamma-HCH/thiram . 2 . . . . . . . . 2<br />
All fungicide/insecticide seed treatments 2 2 88 . . . . . . . 92<br />
Fungicide seed treatments<br />
Captan . . . . . . 58 . . . 58<br />
Carbendazim
TREATMENT OF VEGETABLES DURING STORAGE<br />
Of the 602 holdings visited in this survey, 96 stored vegetables after harvest. Bulb onions were stored on 68 holdings,<br />
white cabbage on 20 holdings, beetroot on 8 holdings <strong>and</strong> red cabbage on 7 holdings. Other crops encountered included<br />
shallots, celeriac, squashes <strong>and</strong> chicory.<br />
An estimated 78% of the total production of dry bulb onions in Engl<strong>and</strong> <strong>and</strong> Wales went into storage in 2003, 84% of the<br />
white cabbage <strong>and</strong> 48% of beetroot. Estimates of the total tonnage of vegetables entering store were based on figures<br />
provided by Defra Statistics (Horticultural Commodities) Division. No data were available on the total production of red<br />
cabbage.<br />
As Table 33 shows, the majority of onions, 82%, were bulk stored, as were 82% of beetroot, the remainder being stored<br />
in boxes. In contrast, all of the cabbage, red <strong>and</strong> white, were stored in boxes. Other vegetables were somewhat evenly<br />
stored between the two methods.<br />
Onions were stored predominantly in ventilated stores (54%), with the rest spread between refrigerated stores (42%) <strong>and</strong><br />
unventilated stores (4%). In 2003, 80% of beetroot was stored in outdoor clamps, 18% in refrigerated stores, <strong>and</strong> the<br />
remaining two percent in ventilated stores. <strong>The</strong> majority of white cabbage was stored in refrigerated stores (93%), with<br />
the remainder in either ventilated stores (5%), or unventilated stores (1%). Over ninety nine percent of red cabbage was<br />
stored in refrigerated stores, with the remainder in ventilated stores (Table 34).<br />
No onions or beetroot received a pesticide application in store.<br />
Approximately 55% of white cabbage was treated with metalaxyl–M, with a further 42% of the basic tonnage stored<br />
received an additional application of iprodione, while 45% remained untreated.<br />
In 2003, approximately 35% of red cabbage remained untreated. Sixty five percent was treated with metalaxyl-M, 58%<br />
of which also received an additional application of iprodione.<br />
In 1999, as in 2003, no pesticide applications were made to onions or beetroot in store. In contrast to 2003, only 8% of<br />
red cabbage remained untreated in 1999, 92% being treated with iprodione <strong>and</strong> 98% of this also receiving an application<br />
of carbendazim <strong>and</strong> metalaxyl. In 1999, while 41% of white cabbage remained untreated, approximately 57% was<br />
treated with iprodione, a further 50% of the basic tonnage stored receiving an additional application of<br />
carbendazim/metalaxyl, with 3% receiving an application of carbendazim.<br />
100
Table 33 Total tonnes of vegetables stored <strong>and</strong> method of storage<br />
Crop Bulk storage Boxed storage Total<br />
Beetroot 31,043 6,737 37,780<br />
Cabbage - red . 2,935 2,935<br />
Cabbage - white . 85,578 85,578<br />
Onion - dry 238,264 50,553 288,817<br />
Other stored vegetables 1<br />
1,687 1,800 3,487<br />
Total 270,994 147,603 418,597<br />
Table 34 Storage type used <strong>and</strong> vegetables stored (tonnes)<br />
Crop Outdoor Unventilated Ventilated Refrigerated Controlled Total<br />
clamp store store store atmosphere<br />
Beetroot 30,389 . 654 6,737 . 37,780<br />
Cabbage - red . . 10 2,925 . 2,935<br />
Cabbage - white . 1,225 4,626 79,727 . 85,578<br />
Onion - dry . 10,578 156,740 121,499 . 288,817<br />
Other stored vegetables 1<br />
. . 300 1,587 1,600 3,487<br />
Total 30,389 11,802 162,330 212,476 1,600 418,597<br />
Table 35 Pesticide usage on vegetables in store - tonnes treated <strong>and</strong> amount of active substance used (kg)<br />
Active substance Cabbage - white Cabbage - red Onion - dry Beetroot Other stored vegetables 1<br />
Tonnes Weight a.s.<br />
treated (kg)<br />
Tonnes Weight a.s.<br />
treated (kg)<br />
101<br />
Tonnes Weight a.s.<br />
treated (kg)<br />
Tonnes Weight a.s.<br />
treated (kg)<br />
Tonnes Weight a.s.<br />
treated (kg)<br />
Iprodione 35,712 14,054 1,095 547 . . . . 1,080 5,487<br />
Metalaxyl-M 47,041 1,968 1,903 95 . . . . . .<br />
Total - all fungicides 82,753 16,023 2,998 642 . . . 3,487 5,487<br />
Untreated 38,538 1,032 288,817 37,780 2,407<br />
1 Other stored vegetables includes celeriac, chicory, pumpkin <strong>and</strong> shallot
ACKNOWLEDGEMENTS<br />
Thanks are due to all of the growers who willingly participated in this survey, providing invaluable information upon<br />
which this report is based. Many thanks are also due to Jeremy Snowden <strong>and</strong> Louis Thomas for their invaluable role in<br />
collecting the data, as well as to Gillian Parrish <strong>and</strong> Lynda Smith for their able assistance in data collation <strong>and</strong> to Emma<br />
Maidment for her invaluable work in maintaining the pesticide product database.<br />
REFERENCES<br />
Anon. (2003a) Agricultural Statistics in Engl<strong>and</strong> <strong>and</strong> Wales 2002. London: HMSO<br />
Anon. (2003b) Agricultural Statistics, Scotl<strong>and</strong> 2002. Edinburgh: HMSO<br />
Anon. (2004a) Agricultural Statistics in Engl<strong>and</strong> <strong>and</strong> Wales 2003. London: HMSO<br />
Anon. (2004b) Agricultural Statistics in Scotl<strong>and</strong> 2003. Edinburgh: HMSO<br />
Anon. (2004c) Survey of vegetables <strong>and</strong> Flowers, January 2003 Engl<strong>and</strong> & Wales: York: HMSO<br />
Bowen, H.M., Thomas, L.A., Snowden, J.P. <strong>and</strong> Dickson, J.M. (1986) Pesticide Usage Survey Report 98 - Vegetables<br />
for Human Consumption 1991, Scotl<strong>and</strong>. Edinburgh: DAFS<br />
Brodie, J.A. & Wood, J. (1986) Pesticide Usage Survey Report 19 - Vegetables for Human Consumption 1982,<br />
Scotl<strong>and</strong>. Edinburgh: DAFS<br />
Garthwaite, D.G., Chapman, P.J. & Thomas, M.R. (1990) Pesticide Usage Survey Report 64 - Vegetables for human<br />
consumption 1986. London: MAFF<br />
Garthwaite, D.G., Thomas, M.R., Hart, M.J. & Wild, S. (1997) Pesticide Usage Survey Report 134 - Vegetables for<br />
human consumption 1995. London: MAFF<br />
Garthwaite, D.G., Thomas, M.R. & Wild, S. (2001) Pesticide Usage Survey Report 163 - Vegetables for human<br />
consumption 1999. London: MAFF<br />
Shave, P.R. & Dickson, J.M. (1991) Pesticide Usage Survey Report 83 - Vegetables for Human Consumption 1989,<br />
Scotl<strong>and</strong>. Edinburgh: DAFS<br />
Sly, J.M.A. (1972) Pesticide Usage Survey Report 3 - Vegetables for human consumption 1966 <strong>and</strong> 1969. London:<br />
MAFF<br />
Sly, J.M.A. (1985) Pesticide Usage Survey Report 29 - Vegetables for human consumption 1981. London: MAFF<br />
Thomas, M.R., Davis, R.P. & Garthwaite, D.G. (1992) Pesticide Usage Survey Report 101 - Vegetables for human<br />
consumption 1991. London: MAFF<br />
Thomas, M.R. (2001) Pesticide usage monitoring in the United Kingdom. Annals of Occupational Hygiene,<br />
45 (supplement 1): S87-S93.<br />
Umpleby, R.A. & Sly, J.M.A. (1972) Pesticide Usage Survey Report 9 - Vegetables for human consumption 1972.<br />
London: MAFF<br />
Umpleby, R.A., Sly, J.M.A., Cutler, J.R. & Symonds, W. (1982) Pesticide Usage Survey Report1 9 - Vegetables for<br />
human consumption 1977. London: MAFF<br />
102
CROPS ENCOUNTERED DURING THE 2003 OUTDOOR VEGETABLE CROPS SURVEY APPENDIX 1<br />
Brassicas etc. borecole Root crucifers radish<br />
kale swede<br />
broccoli turnips<br />
calabrese<br />
Brussels sprouts Sweetcorn sweetcorn<br />
autumn cabbage<br />
black cabbage Other vegetables<br />
red cabbage Stems asparagus<br />
savoy cabbage rhubarb<br />
spring cabbage Flowers globe artichoke<br />
summer cabbage Seeds mustard<br />
white cabbage Fruit tomatoes<br />
winter cabbage Baby leaf vegetables baby leaf veg. (unspecified)<br />
cauliflower-autumn/summer chard - baby leaf<br />
cauliflower-winter d<strong>and</strong>elion - baby leaf<br />
kohlrabi lettuce - baby leaf<br />
mizuna - baby leaf<br />
Carrots, parsnips, celery carrots mustard - baby leaf<br />
celery red chard - baby leaf<br />
parsnips red mustard - baby leaf<br />
rocket - baby leaf<br />
Cucurbits courgette sorrel - baby leaf<br />
cucumber spinach - baby leaf<br />
gherkin Chinese vegetables Chinese veg. (unspecified)<br />
marrow mibuna<br />
melon mizuna<br />
pumpkin pak choi<br />
squash tatsoi<br />
Herbs barge<br />
Lettuce, endive etc. lettuce - iceberg types basil<br />
lettuce – other types celery leaf<br />
cabbage-Chinese chervil<br />
endive chives<br />
cori<strong>and</strong>er<br />
Onions & leeks garlic dill<br />
leek fennel<br />
dry onions fenugreek<br />
red onions garlic chives<br />
shallots lemon thyme<br />
salad onions lemon verbena<br />
marjoram<br />
Other root vegetables beetroot mint<br />
celeriac oregano<br />
chicory parsley<br />
Jerusalem artichoke rocket<br />
horseradish rosemary<br />
scorzonera sage<br />
sweet potato tarragon<br />
thyme<br />
Peas <strong>and</strong> beans broad beans Leafy vegetables chard<br />
French beans l<strong>and</strong> cress<br />
runner beans leaf beet<br />
peas-picking for fresh market Lepidium (cress)<br />
peas-vining radicchio<br />
spinach<br />
watercress<br />
103
PESTICIDE USAGE SURVEY REPORTS APPENDIX 2<br />
Surveys which include data relating to Scotl<strong>and</strong> are marked with *<br />
Surveys which include data relating to Northern Irel<strong>and</strong> are marked with #<br />
PUBLISHED REPORTS 1<br />
150 Review of usage of pesticides in agriculture & horticulture throughout Great Britain 1986-1996* PB 4188 £2.00<br />
151 Grassl<strong>and</strong> & fodder crops in Great Britain 1997* PB 4189 £3.00<br />
152 Hardy Nursery Stock in Great Britain 1997* PB 4280 £3.00<br />
153 Outdoor bulbs & flowers in Great Britain 1997* PB 4244 £2.00<br />
154 Rodenticide usage on farms in Great Britain growing grassl<strong>and</strong> <strong>and</strong> fodder crops 1997* PB 4739 £2.00<br />
155 Rodenticide usage by Local Authorities in Great Britain 1997* PB 5411 £3.00<br />
156 Grassl<strong>and</strong> <strong>and</strong> fodder crops, Northern Irel<strong>and</strong> 1997 # ISBN 1 85527 506 6<br />
157 Sheep treatments, Northern Irel<strong>and</strong> 1997 # ISBN 1 85527 425 6<br />
158 Aerial applications, Great Britain 1998* PB 4552 £3.00<br />
159 Arable farm crops in Great Britain 1998* PB 4808 £4.50<br />
160 Soft fruit in Great Britain 1998* PB 5412 £3.50<br />
161 Potato stores in Great Britain 1998* PB 5413 £2.50<br />
162 Rodenticide usage on farms in Great Britain growing arable crops 1998* PB 5946 £2.50<br />
163 Outdoor vegetable crops in Great Britain 1999* PB 5947 £3.50<br />
164 Protected crops (edible <strong>and</strong> ornamental) in Great Britain 1999* PB 6166 £3.50<br />
165 Mushroom crops in Great Britain 1999* PB 6167 £1.00<br />
166 Aerial applications, Great Britain 1999* PB 8151 £1.50<br />
167 Soft fruit crops, Northern Irel<strong>and</strong> 1998 # ISBN 1 85527 540 6<br />
168 Arable crops, Northern Irel<strong>and</strong> 1998 # ISBN 1 85527 536 8<br />
169 Vegetable crops, Northern Irel<strong>and</strong> 1999 # ISBN 1 85527 561 9<br />
170 Mushroom crops, Northern Irel<strong>and</strong> 1999 # ISBN 1 85527 549 X<br />
171 Arable farm crops in Great Britain 2000* PB 8014 £2.00<br />
172 Orchards <strong>and</strong> fruit stores in Great Britain 2000* PB 6168 £1.50<br />
173 Hops in Great Britain 2000 PB 6169 £1.00<br />
174 Potato stores in Great Britain 2000* PB 8015 £1.50<br />
175 Rodenticide usage on farms in Great Britain growing arable crops 2000* PB 8016 £1.50<br />
176 Aerial applications, Great Britain 2000* PB 8152 £1.50<br />
177 Arable crops, Northern Irel<strong>and</strong> 2000 # ISBN 1 85527 670 4<br />
178 Top fruit crops, Northern Irel<strong>and</strong> 2002 # ISBN 1 85527 618 6<br />
179 Farm grain stores in Great Britain 1998/99* PB 6170 £1.00<br />
180 Commercial grain stores in Great Britain 1998/99* PB 6171 £1.00<br />
181 Soft fruit crops in Great Britain 2001* PB 8017 £1.50<br />
182 Hardy nursery stock in Great Britain 2001* PB 8177 £1.50<br />
183 Outdoor bulbs <strong>and</strong> flowers in Great Britain 2001* PB 8153 £2.00<br />
184 Aerial applications, Great Britain 2001* PB 8154 £1.50<br />
185 Rodenticide usage by Local Authorities in Great Britain 2001* PB 10194 £2.50<br />
186 Aerial applications, Great Britain 2002* PB 8176 £1.50<br />
187 Arable crops in Great Britain 2002* PB 9148 £4.00<br />
188 Grassl<strong>and</strong> & fodder crops in Great Britain 2002* PB 10195 £3.00<br />
189 Potato stores in Great Britain 2002* PB 10196 £1.50<br />
Copies of reports categorised PB may be purchased from Defra Publications, Admail 6000, London SW1A 2XX<br />
Tel: 08459 556000<br />
Copies of reports categorised ISBN may be obtained through Her Majesty’s Stationery Office.<br />
1 For information on reports prior to number 150 consult our website at:<br />
www.csl.gov.uk/prodserv/cons/pesticide/intell/reports.cfm<br />
104