Etudes par pays volume 2, PDF, 346 p., 1,4 Mo - Femise
Etudes par pays volume 2, PDF, 346 p., 1,4 Mo - Femise Etudes par pays volume 2, PDF, 346 p., 1,4 Mo - Femise
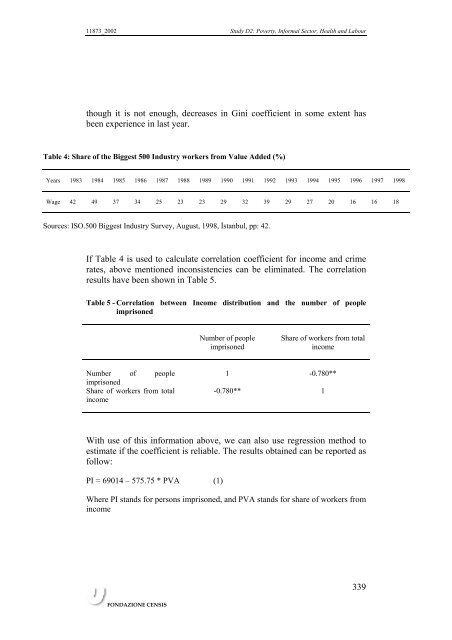
11873_2002 Study D2: Poverty, Informal Sector, Health and Labour though it is not enough, decreases in Gini coefficient in some extent has been experience in last year. Table 4: Share of the Biggest 500 Industry workers from Value Added (%) Years 1983 1984 1985 1986 1987 1988 1989 1990 1991 1992 1993 1994 1995 1996 1997 1998 Wage 42 49 37 34 25 23 23 29 32 39 29 27 20 16 16 18 Sources: ISO.500 Biggest Industry Survey, August, 1998, İstanbul, pp: 42. If Table 4 is used to calculate correlation coefficient for income and crime rates, above mentioned inconsistencies can be eliminated. The correlation results have been shown in Table 5. Table 5 - Correlation between Income distribution and the number of people imprisoned Number imprisoned of people Share of workers from total income FONDAZIONE CENSIS Number of people imprisoned Share of workers from total income 1 -0.780** -0.780** 1 With use of this information above, we can also use regression method to estimate if the coefficient is reliable. The results obtained can be reported as follow: PI = 69014 – 575.75 * PVA (1) Where PI stands for persons imprisoned, and PVA stands for share of workers from income 339
11873_2002 Study D2: Poverty, Informal Sector, Health and Labour T Statistics: (13.72) (-2.92) P value: (000) (0.04) R 2 : 0.68, F: 8.57, P value: (000) In words, above statistical terms indicate that if the share of workers from income increases by 1%, persons imprisoned decreases by 57%. This rate looks a little high, but it could be the case in economic terms. A positive correlation between the number of unemployed and the number of people imprisoned also strengthen empirical results above. A regression analysis between these two variables are shown below: PI = 4450 + 30.88 * U, where U stands for unemployed people (-2) (2) T Statistics: (2.52) (-2,18) P Value: (0,03) (0.06) R 2 : 0.40, F: 4,78, P value: (0.06) In equation (2), a high level of autocorrelation between these two variables has been detected. Thus, we took the first differences. Also, we used Schwarz information criterion to know the lag value of unemployment. Our test showed that the effect of unemployment on people imprisoned is can be seen with lag of two periods. Equation (2) also can be interpreted as equation (1). FONDAZIONE CENSIS 340
- Page 294 and 295: 11873_2002 Study D2: Poverty, Infor
- Page 296 and 297: TURKEY Selahattin Bekmez, Ph.D. - C
- Page 298 and 299: 11873_2002 Study D2: Poverty, Infor
- Page 300 and 301: Table 3: Turkish Citizen Working an
- Page 302 and 303: 11873_2002 Study D2: Poverty, Infor
- Page 304 and 305: Table 5: Real GNP by Main Kind of E
- Page 306 and 307: Table :7 İmport-Export Values (mil
- Page 308 and 309: 11873_2002 Study D2: Poverty, Infor
- Page 310 and 311: 11873_2002 Study D2: Poverty, Infor
- Page 312 and 313: Table 1: Existing Status and Object
- Page 314 and 315: Table 2: Number of Doctors an numbe
- Page 316 and 317: Table 3: Heath Expenditures per yea
- Page 318 and 319: Table 7: Distribution of Cancer Cas
- Page 320 and 321: 11873_2002 Study D2: Poverty, Infor
- Page 322 and 323: 11873_2002 Study D2: Poverty, Infor
- Page 324 and 325: 11873_2002 Study D2: Poverty, Infor
- Page 326 and 327: 11873_2002 Study D2: Poverty, Infor
- Page 328 and 329: 11873_2002 Study D2: Poverty, Infor
- Page 330 and 331: 11873_2002 Study D2: Poverty, Infor
- Page 332 and 333: 11873_2002 Study D2: Poverty, Infor
- Page 334 and 335: 11873_2002 Study D2: Poverty, Infor
- Page 336 and 337: TABLE II - Sentenced Juveniles Rece
- Page 338 and 339: 11873_2002 Study D2: Poverty, Infor
- Page 340 and 341: 11873_2002 Study D2: Poverty, Infor
- Page 342 and 343: 11873_2002 Study D2: Poverty, Infor
- Page 346: 11873_2002 Study D2: Poverty, Infor
11873_2002 Study D2: Poverty, Informal Sector, Health and Labour<br />
though it is not enough, decreases in Gini coefficient in some extent has<br />
been experience in last year.<br />
Table 4: Share of the Biggest 500 Industry workers from Value Added (%)<br />
Years 1983 1984 1985 1986 1987 1988 1989 1990 1991 1992 1993 1994 1995 1996 1997 1998<br />
Wage 42 49 37 34 25 23 23 29 32 39 29 27 20 16 16 18<br />
Sources: ISO.500 Biggest Industry Survey, August, 1998, İstanbul, pp: 42.<br />
If Table 4 is used to calculate correlation coefficient for income and crime<br />
rates, above mentioned inconsistencies can be eliminated. The correlation<br />
results have been shown in Table 5.<br />
Table 5 - Correlation between Income distribution and the number of people<br />
imprisoned<br />
Number<br />
imprisoned<br />
of people<br />
Share of workers from total<br />
income<br />
FONDAZIONE CENSIS<br />
Number of people<br />
imprisoned<br />
Share of workers from total<br />
income<br />
1 -0.780**<br />
-0.780** 1<br />
With use of this information above, we can also use regression method to<br />
estimate if the coefficient is reliable. The results obtained can be reported as<br />
follow:<br />
PI = 69014 – 575.75 * PVA (1)<br />
Where PI stands for persons imprisoned, and PVA stands for share of workers from<br />
income<br />
339


