

Dairy's role in sustaining New Zealand - Fonterra
Dairy's role in sustaining New Zealand - Fonterra
Dairy's role in sustaining New Zealand - Fonterra

Create successful ePaper yourself
Turn your PDF publications into a flip-book with our unique Google optimized e-Paper software.
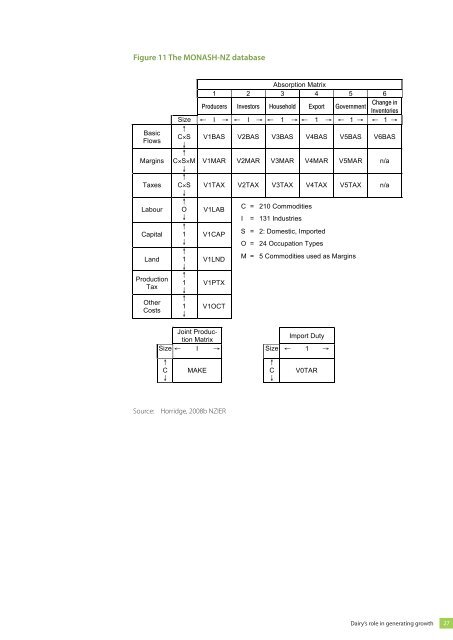
Figure 11 The MONASH-NZ database<br />
Figure 11 The MONASH-NZ database<br />
Basic<br />
Flows<br />
Marg<strong>in</strong>s<br />
Taxes<br />
Labour<br />
Capital<br />
Land<br />
Production<br />
Tax<br />
Other<br />
Costs<br />
Source: Horridge, 2008b NZIER<br />
NZIER – Dairy’s <strong>role</strong> <strong>in</strong> generat<strong>in</strong>g growth<br />
F<strong>in</strong>al report - 16 November 2010<br />
Absorption Matrix<br />
1 2 3 4 5 6<br />
Producers Investors Household Export<br />
Change <strong>in</strong><br />
Government<br />
Inventories<br />
Size<br />
↑<br />
← I → ← I → ← 1 → ← 1 → ← 1 → ← 1 →<br />
C×S<br />
↓<br />
↑<br />
V1BAS V2BAS V3BAS V4BAS V5BAS V6BAS<br />
C×S×M<br />
↓<br />
↑<br />
V1MAR V2MAR V3MAR V4MAR V5MAR n/a<br />
C×S<br />
↓<br />
V1TAX V2TAX V3TAX V4TAX V5TAX n/a<br />
↑<br />
O V1LAB<br />
C = 210 Commodities<br />
↓<br />
I = 131 Industries<br />
↑<br />
1 V1CAP<br />
S = 2: Domestic, Imported<br />
↓<br />
O = 24 Occupation Types<br />
↑<br />
1<br />
↓<br />
↑<br />
V1LND<br />
M = 5 Commodities used as Marg<strong>in</strong>s<br />
1<br />
↓<br />
↑<br />
V1PTX<br />
1<br />
↓<br />
V1OCT<br />
Jo<strong>in</strong>t Production<br />
Matrix<br />
Import Duty<br />
Size ← I → Size ← 1 →<br />
↑<br />
C<br />
↓<br />
MAKE<br />
Source: Horridge, 2008b; NZIER<br />
↑<br />
C<br />
↓<br />
V0TAR<br />
A.4 Production structure (Horridge, 2008b)<br />
The production structure of the model is presented <strong>in</strong> Figure 12. Each <strong>in</strong>dustry can<br />
produce a number of different commodities. Production <strong>in</strong>puts are <strong>in</strong>termediate<br />
commodities, both domestic and imported, and primary factors labour, land and<br />
capital. Work<strong>in</strong>g from bottom to top, we see constant elasticity of substitution (CES)<br />
production nests for occupations, primary factors and the choice between imported<br />
and domestic commodities. In this case, an <strong>in</strong>crease <strong>in</strong> price moves sourc<strong>in</strong>g<br />
towards another <strong>in</strong>put, for example, if the price of imports <strong>in</strong>creases, more domestic<br />
commodities are demanded <strong>in</strong> the <strong>in</strong>termediate sourc<strong>in</strong>g CES nest.<br />
31<br />
Dairy’s <strong>role</strong> <strong>in</strong> generat<strong>in</strong>g growth<br />
27


