

Dairy's role in sustaining New Zealand - Fonterra
Dairy's role in sustaining New Zealand - Fonterra
Dairy's role in sustaining New Zealand - Fonterra

You also want an ePaper? Increase the reach of your titles
YUMPU automatically turns print PDFs into web optimized ePapers that Google loves.
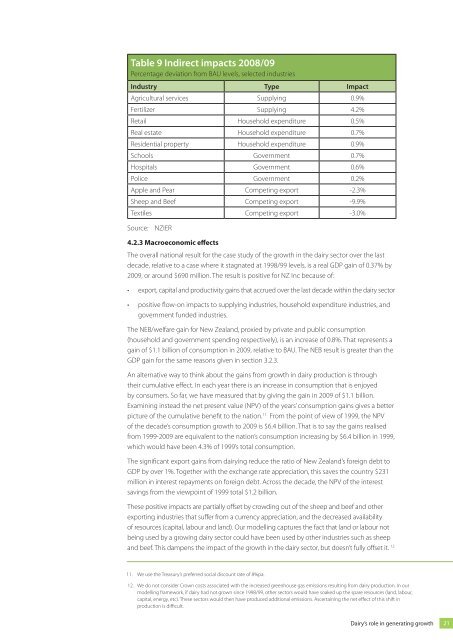
Table 9 Indirect impacts 2008/09<br />
Percentage deviation from BAU levels, selected <strong>in</strong>dustries<br />
Industry Type Impact<br />
Agricultural services Supply<strong>in</strong>g 0.9%<br />
Fertilizer Supply<strong>in</strong>g 4.2%<br />
Retail Household expenditure 0.5%<br />
Real estate Household expenditure 0.7%<br />
Residential property Household expenditure 0.9%<br />
Schools Government 0.7%<br />
Hospitals Government 0.6%<br />
Police Government 0.2%<br />
Apple and Pear Compet<strong>in</strong>g export -2.3%<br />
Sheep and Beef Compet<strong>in</strong>g export -9.9%<br />
Textiles Compet<strong>in</strong>g export -3.0%<br />
Source: NZIER<br />
4.2.3 Macroeconomic effects<br />
The overall national result for the case study of the growth <strong>in</strong> the dairy sector over the last<br />
decade, relative to a case where it stagnated at 1998/99 levels, is a real GDP ga<strong>in</strong> of 0.37% by<br />
2009, or around $690 million. The result is positive for NZ Inc because of:<br />
• export, capital and productivity ga<strong>in</strong>s that accrued over the last decade with<strong>in</strong> the dairy sector<br />
• positive flow-on impacts to supply<strong>in</strong>g <strong>in</strong>dustries, household expenditure <strong>in</strong>dustries, and<br />
government funded <strong>in</strong>dustries.<br />
The NEB/welfare ga<strong>in</strong> for <strong>New</strong> <strong>Zealand</strong>, proxied by private and public consumption<br />
(household and government spend<strong>in</strong>g respectively), is an <strong>in</strong>crease of 0.8%. That represents a<br />
ga<strong>in</strong> of $1.1 billion of consumption <strong>in</strong> 2009, relative to BAU. The NEB result is greater than the<br />
GDP ga<strong>in</strong> for the same reasons given <strong>in</strong> section 3.2.3.<br />
An alternative way to th<strong>in</strong>k about the ga<strong>in</strong>s from growth <strong>in</strong> dairy production is through<br />
their cumulative effect. In each year there is an <strong>in</strong>crease <strong>in</strong> consumption that is enjoyed<br />
by consumers. So far, we have measured that by giv<strong>in</strong>g the ga<strong>in</strong> <strong>in</strong> 2009 of $1.1 billion.<br />
Exam<strong>in</strong><strong>in</strong>g <strong>in</strong>stead the net present value (NPV) of the years’consumption ga<strong>in</strong>s gives a better<br />
picture of the cumulative benefit to the nation. 11 From the po<strong>in</strong>t of view of 1999, the NPV<br />
of the decade’s consumption growth to 2009 is $6.4 billion. That is to say the ga<strong>in</strong>s realised<br />
from 1999-2009 are equivalent to the nation’s consumption <strong>in</strong>creas<strong>in</strong>g by $6.4 billion <strong>in</strong> 1999,<br />
which would have been 4.3% of 1999’s total consumption.<br />
The significant export ga<strong>in</strong>s from dairy<strong>in</strong>g reduce the ratio of <strong>New</strong> <strong>Zealand</strong>’s foreign debt to<br />
GDP by over 1%. Together with the exchange rate appreciation, this saves the country $231<br />
million <strong>in</strong> <strong>in</strong>terest repayments on foreign debt. Across the decade, the NPV of the <strong>in</strong>terest<br />
sav<strong>in</strong>gs from the viewpo<strong>in</strong>t of 1999 total $1.2 billion.<br />
These positive impacts are partially offset by crowd<strong>in</strong>g out of the sheep and beef and other<br />
export<strong>in</strong>g <strong>in</strong>dustries that suffer from a currency appreciation, and the decreased availability<br />
of resources (capital, labour and land). Our modell<strong>in</strong>g captures the fact that land or labour not<br />
be<strong>in</strong>g used by a grow<strong>in</strong>g dairy sector could have been used by other <strong>in</strong>dustries such as sheep<br />
and beef. This dampens the impact of the growth <strong>in</strong> the dairy sector, but doesn’t fully offset it. 12<br />
11. We use the Treasury’s preferred social discount rate of 8%pa.<br />
12. We do not consider Crown costs associated with the <strong>in</strong>creased greenhouse gas emissions result<strong>in</strong>g from dairy production. In our<br />
modell<strong>in</strong>g framework, if dairy had not grown s<strong>in</strong>ce 1998/99, other sectors would have soaked up the spare resources (land, labour,<br />
capital, energy, etc). These sectors would then have produced additional emissions. Ascerta<strong>in</strong><strong>in</strong>g the net effect of this shift <strong>in</strong><br />
production is difficult.<br />
Dairy’s <strong>role</strong> <strong>in</strong> generat<strong>in</strong>g growth<br />
21


