

New Zealand Dairy Statistics 2010-11 - LIC
New Zealand Dairy Statistics 2010-11 - LIC
New Zealand Dairy Statistics 2010-11 - LIC

Create successful ePaper yourself
Turn your PDF publications into a flip-book with our unique Google optimized e-Paper software.
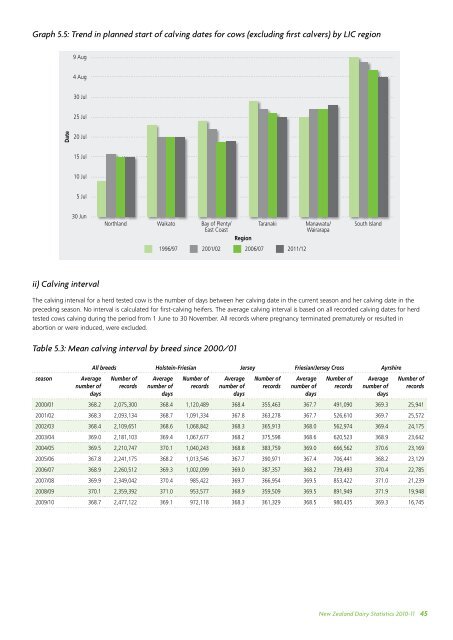
Graph 5.5: Trend in planned start of calving dates for cows (excluding fi rst calvers) by <strong>LIC</strong> region<br />
Date<br />
9 Aug<br />
4 Aug<br />
30 Jul<br />
25 Jul<br />
20 Jul<br />
15 Jul<br />
10 Jul<br />
5 Jul<br />
30 Jun<br />
ii) Calving interval<br />
The calving interval for a herd tested cow is the number of days between her calving date in the current season and her calving date in the<br />
preceding season. No interval is calculated for fi rst-calving heifers. The average calving interval is based on all recorded calving dates for herd<br />
tested cows calving during the period from 1 June to 30 November. All records where pregnancy terminated prematurely or resulted in<br />
abortion or were induced, were excluded.<br />
Table 5.3: Mean calving interval by breed since 2000/01<br />
season Average<br />
number of<br />
days<br />
Northland Waikato Bay of Plenty/<br />
East Coast<br />
All breeds Holstein-Friesian Jersey Friesian/Jersey Cross Ayrshire<br />
Number of<br />
records<br />
Average<br />
number of<br />
days<br />
Number of<br />
records<br />
Average<br />
number of<br />
days<br />
Taranaki Manawatu/<br />
Wairarapa<br />
Number of<br />
records<br />
Average<br />
number of<br />
days<br />
Number of<br />
records<br />
South Island<br />
Average<br />
number of<br />
days<br />
Number of<br />
records<br />
2000/01 368.2 2,075,300 368.4 1,120,489 368.4 355,463 367.7 491,090 369.3 25,941<br />
2001/02 368.3 2,093,134 368.7 1,091,334 367.8 363,278 367.7 526,610 369.7 25,572<br />
2002/03 368.4 2,109,651 368.6 1,068,842 368.3 365,913 368.0 562,974 369.4 24,175<br />
2003/04 369.0 2,181,103 369.4 1,067,677 368.2 375,598 368.6 620,523 368.9 23,642<br />
2004/05 369.5 2,210,747 370.1 1,040,243 368.8 383,759 369.0 666,562 370.6 23,169<br />
2005/06 367.8 2,241,175 368.2 1,013,546 367.7 390,971 367.4 706,441 368.2 23,129<br />
2006/07 368.9 2,260,512 369.3 1,002,099 369.0 387,357 368.2 739,493 370.4 22,785<br />
2007/08 369.9 2,349,042 370.4 985,422 369.7 366,954 369.5 853,422 371.0 21,239<br />
2008/09 370.1 2,359,392 371.0 953,577 368.9 359,509 369.5 891,949 371.9 19,948<br />
2009/10 368.7 2,477,122 369.1 972,<strong>11</strong>8 368.3 361,329 368.5 980,435 369.3 16,745<br />
Region<br />
1996/97 2001/02 2006/07 20<strong>11</strong>/12<br />
<strong>New</strong> <strong>Zealand</strong> <strong>Dairy</strong> <strong>Statistics</strong> <strong>2010</strong>-<strong>11</strong> 45


