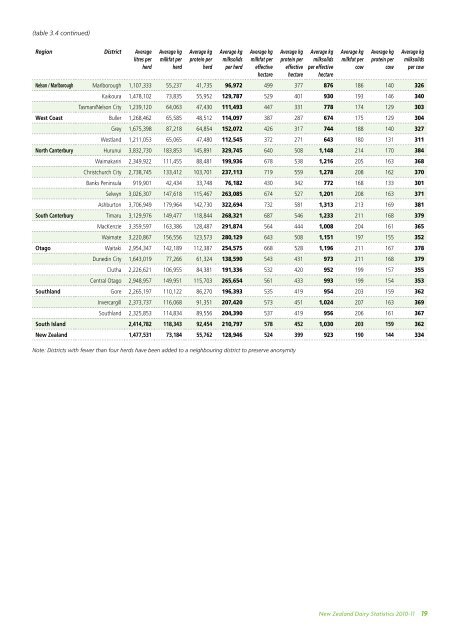
Hurunui district has the highest average production per herd with 329,745 kilograms of milksolids (Table 3.4). Ashburton had the highest average kilograms of milksolids per effective hectare (1,313). Hurunui district recorded the highest production per cow (384 kg of milksolids). The North Island district that has the highest milksolids production per herd is Taupo with an average of 227,373 kilograms of milksolids. On a per-hectare basis Matamata-Piako produced the highest average kilograms of milksolids (1,027), while at a per-cow basis, Masterton produced the highest average kilograms of milksolids (371). Table 3.4: Herd production analysis by district in <strong>2010</strong>/<strong>11</strong> Region District Average litres per herd 18 <strong>New</strong> <strong>Zealand</strong> <strong>Dairy</strong> <strong>Statistics</strong> <strong>2010</strong>-<strong>11</strong> Average kg milkfat per herd Average kg protein per herd Average kg milksolids per herd Average kg milkfat per effective hectare Average kg protein per effective hectare Average kg milksolids per effective hectare Average kg milkfat per cow Average kg protein per cow Average kg milksolids per cow Northland Far North 903,187 43,7<strong>11</strong> 33,082 76,792 335 254 589 158 120 278 Whangarei 1,078,668 54,003 40,143 94,146 390 290 680 170 126 296 Kaipara 963,595 46,801 35,490 82,291 342 259 602 161 122 283 Auckland Rodney 857,608 42,349 31,836 74,185 358 269 627 160 120 280 Manukau City 784,166 36,135 28,176 64,3<strong>11</strong> 450 351 800 167 130 297 Papakura 533,835 24,718 19,238 43,956 369 287 656 162 126 288 Franklin 895,572 42,498 32,727 75,225 429 330 759 176 136 312 Waikato Waikato 1,172,329 57,521 43,217 100,737 502 377 879 179 134 313 Hamilton City 954,151 47,279 35,437 82,717 573 430 1,003 190 142 332 Waipa 1,264,675 63,178 47,221 <strong>11</strong>0,399 575 430 1,005 187 140 328 Otorohanga 1,277,904 63,955 47,860 <strong>11</strong>1,815 514 384 898 180 135 315 Thames-Coromandel 1,008,815 49,991 37,531 87,522 460 346 806 175 131 306 Hauraki 1,004,222 49,515 37,400 86,915 488 369 857 180 136 316 Matamata-Piako 1,095,140 55,019 41,179 96,198 588 440 1,027 188 141 329 South Waikato 1,478,192 72,800 54,891 127,691 559 421 980 195 147 343 Bay of Plenty Western Bay of Plenty 1,184,712 58,681 43,697 102,378 495 369 864 174 129 303 Tauranga 861,969 42,006 32,026 74,033 285 218 503 146 <strong>11</strong>1 257 Kawerau/Whakatane 1,187,916 56,982 43,013 99,996 500 377 877 183 138 321 Opotiki 1,054,544 51,<strong>11</strong>1 38,635 89,746 439 332 771 162 123 285 Central Plateau Taupo 2,601,238 130,337 97,036 227,373 467 348 815 183 136 319 Rotorua 1,589,961 78,525 58,249 136,774 494 366 860 185 137 323 Western Uplands Waitomo 1,480,124 75,280 55,929 131,209 387 287 674 155 <strong>11</strong>5 270 Ruapehu 1,505,443 76,<strong>11</strong>3 56,536 132,649 439 326 766 165 122 287 East Coast Gisborne / Wairoa 1,381,693 65,976 50,664 <strong>11</strong>6,640 304 234 538 125 96 221 Hawkes Bay Napier/Hastings 2,103,182 101,388 77,443 178,831 485 370 856 170 130 299 Central Hawkes Bay 2,647,317 126,2<strong>11</strong> 99,282 225,493 482 379 862 179 141 320 Taranaki <strong>New</strong> Plymouth 898,352 46,815 34,474 81,289 488 359 847 186 137 323 Stratford 900,028 46,416 34,570 80,986 503 375 878 192 143 334 South Taranaki 1,103,093 58,253 42,925 101,178 571 421 992 195 143 338 Manawatu Wanganui 1,306,692 60,031 47,029 107,060 370 290 660 148 <strong>11</strong>6 264 Rangitikei 1,693,777 81,821 62,815 144,637 543 417 960 190 146 337 Manawatu 1,362,707 65,801 50,306 <strong>11</strong>6,107 490 374 864 182 139 322 Palmerston North City 1,350,721 65,208 49,993 <strong>11</strong>5,201 506 388 893 186 143 328 Horowhenua 1,546,221 73,655 56,569 130,224 521 400 921 190 146 336 Kapiti Coast / Upper Hutt 1,058,532 49,403 38,168 87,572 434 336 770 180 139 318 Wairarapa Tararua 1,<strong>11</strong>0,180 56,545 42,145 98,690 478 356 834 178 132 310 Masterton 1,878,303 91,632 70,035 161,667 564 431 996 210 161 371 Carterton 1,352,050 66,204 50,465 <strong>11</strong>6,669 461 351 812 181 138 318 South Wairarapa 1,599,529 78,981 60,254 139,235 501 382 883 179 137 316 North Island 1,185,472 59,<strong>11</strong>2 44,328 103,440 495 371 866 182 136 319
(table 3.4 continued) Region District Average litres per herd Average kg milkfat per herd Average kg protein per herd Average kg milksolids per herd Average kg milkfat per effective hectare Average kg protein per effective hectare Average kg milksolids per effective hectare Average kg milkfat per cow Average kg protein per cow Average kg milksolids per cow Nelson / Marlborough Marlborough 1,107,333 55,237 41,735 96,972 499 377 876 186 140 326 Kaikoura 1,478,102 73,835 55,952 129,787 529 401 930 193 146 340 Tasman/Nelson City 1,239,120 64,063 47,430 <strong>11</strong>1,493 447 331 778 174 129 303 West Coast Buller 1,268,462 65,585 48,512 <strong>11</strong>4,097 387 287 674 175 129 304 Grey 1,675,398 87,218 64,854 152,072 426 317 744 188 140 327 Westland 1,2<strong>11</strong>,053 65,065 47,480 <strong>11</strong>2,545 372 271 643 180 131 3<strong>11</strong> North Canterbury Hurunui 3,832,730 183,853 145,891 329,745 640 508 1,148 214 170 384 Waimakariri 2,349,922 <strong>11</strong>1,455 88,481 199,936 678 538 1,216 205 163 368 Christchurch City 2,738,745 133,412 103,701 237,<strong>11</strong>3 719 559 1,278 208 162 370 Banks Peninsula 919,901 42,434 33,748 76,182 430 342 772 168 133 301 Selwyn 3,026,307 147,618 <strong>11</strong>5,467 263,085 674 527 1,201 208 163 371 Ashburton 3,706,949 179,964 142,730 322,694 732 581 1,313 213 169 381 South Canterbury Timaru 3,129,976 149,477 <strong>11</strong>8,844 268,321 687 546 1,233 2<strong>11</strong> 168 379 MacKenzie 3,359,597 163,386 128,487 291,874 564 444 1,008 204 161 365 Waimate 3,220,867 156,556 123,573 280,129 643 508 1,151 197 155 352 Otago Waitaki 2,954,347 142,189 <strong>11</strong>2,387 254,575 668 528 1,196 2<strong>11</strong> 167 378 Dunedin City 1,643,019 77,266 61,324 138,590 543 431 973 2<strong>11</strong> 168 379 Clutha 2,226,621 106,955 84,381 191,336 532 420 952 199 157 355 Central Otago 2,948,957 149,951 <strong>11</strong>5,703 265,654 561 433 993 199 154 353 Southland Gore 2,265,197 <strong>11</strong>0,122 86,270 196,393 535 419 954 203 159 362 Invercargill 2,373,737 <strong>11</strong>6,068 91,351 207,420 573 451 1,024 207 163 369 Southland 2,325,853 <strong>11</strong>4,834 89,556 204,390 537 419 956 206 161 367 South Island 2,414,782 <strong>11</strong>8,343 92,454 210,797 578 452 1,030 203 159 362 <strong>New</strong> <strong>Zealand</strong> 1,477,531 73,184 55,762 128,946 524 399 923 190 144 334 Note: Districts with fewer than four herds have been added to a neighbouring district to preserve anonymity <strong>New</strong> <strong>Zealand</strong> <strong>Dairy</strong> <strong>Statistics</strong> <strong>2010</strong>-<strong>11</strong> 19