

New Zealand Dairy Statistics 2010-11 - LIC
New Zealand Dairy Statistics 2010-11 - LIC
New Zealand Dairy Statistics 2010-11 - LIC

Create successful ePaper yourself
Turn your PDF publications into a flip-book with our unique Google optimized e-Paper software.
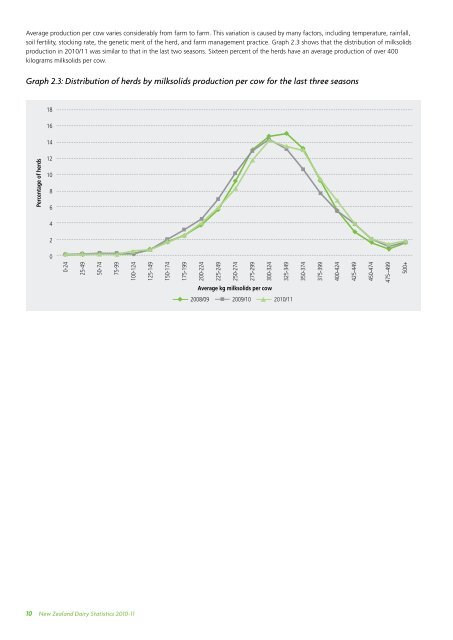
Average production per cow varies considerably from farm to farm. This variation is caused by many factors, including temperature, rainfall,<br />
soil fertility, stocking rate, the genetic merit of the herd, and farm management practice. Graph 2.3 shows that the distribution of milksolids<br />
production in <strong>2010</strong>/<strong>11</strong> was similar to that in the last two seasons. Sixteen percent of the herds have an average production of over 400<br />
kilograms milksolids per cow.<br />
Graph 2.3: Distribution of herds by milksolids production per cow for the last three seasons<br />
10<br />
Percentage of herds<br />
18<br />
16<br />
14<br />
12<br />
10<br />
8<br />
6<br />
4<br />
2<br />
0<br />
0-24<br />
25-49<br />
50-74<br />
75-99<br />
100-124<br />
<strong>New</strong> <strong>Zealand</strong> <strong>Dairy</strong> <strong>Statistics</strong> <strong>2010</strong>-<strong>11</strong><br />
125-149<br />
150-174<br />
175-199<br />
200-224<br />
225-249<br />
250-274<br />
275-299<br />
300-324<br />
325-349<br />
Average kg milksolids per cow<br />
2008/09 2009/10 <strong>2010</strong>/<strong>11</strong><br />
350-374<br />
375-399<br />
400-424<br />
425-449<br />
450-474<br />
475--499<br />
500+


