About the Journal - Cities Institute
About the Journal - Cities Institute
About the Journal - Cities Institute

Create successful ePaper yourself
Turn your PDF publications into a flip-book with our unique Google optimized e-Paper software.
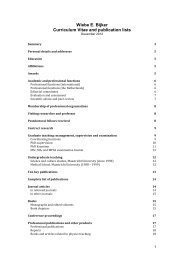
Figure 2 Scatterplot Loss vs. Free Kicks Taken (Team A)<br />
So, when more free kicks are awarded to team A, <strong>the</strong>re is a higher probability<br />
of a win. Conversely, as <strong>the</strong> number of free kicks awarded decreases <strong>the</strong><br />
probability of a loss increases.<br />
What makes this type of analysis all <strong>the</strong> more revealing and significant is that<br />
<strong>the</strong> outputs show that <strong>the</strong>re are variables – in this instance free kicks – that are<br />
significantly related to <strong>the</strong> outcome of a game. There is scope here for<br />
teams with this information to determine how to best take a strategic<br />
approach to counter teams <strong>the</strong>y are playing that have a proven capability<br />
in <strong>the</strong>ir success in this regard. For example, for team A in this instance, <strong>the</strong>re is<br />
scope to look at how it may maximise its advantage in this area and also an<br />
opportunity to both enhance its performance and look to broaden its<br />
capability in o<strong>the</strong>r areas of <strong>the</strong> field.<br />
In <strong>the</strong> example given for Team B in Figures 3 and 4, <strong>the</strong> outputs from <strong>the</strong><br />
ordinal model are given after <strong>the</strong> stepwise process has been completed. The<br />
most significant factors and <strong>the</strong>ir associated p-values are highlighted in <strong>the</strong><br />
footnote at <strong>the</strong> end of <strong>the</strong> paper. In <strong>the</strong> following figure, a plot of <strong>the</strong> event<br />
probabilities is <strong>the</strong>n outlined showing how those event probabilities relate to<br />
free kicks.<br />
25