

production of selected secondary metabolites in transformed ...
production of selected secondary metabolites in transformed ...
production of selected secondary metabolites in transformed ...

Create successful ePaper yourself
Turn your PDF publications into a flip-book with our unique Google optimized e-Paper software.
microenvironment polarity is well known and described (Aguiar 2003). We evaluated<br />
experimental data us<strong>in</strong>g non-l<strong>in</strong>ear fitt<strong>in</strong>g with Boltzman’s curve with four parameters –<br />
maximum (a), m<strong>in</strong>imum (b), <strong>in</strong>flex po<strong>in</strong>t (x0), and width <strong>of</strong> the gradient (Δx) (Equation 1).<br />
We voted and subsequently confirmed the “x-coord<strong>in</strong>ate” <strong>of</strong> the <strong>in</strong>flex po<strong>in</strong>t as the cac value.<br />
For the confirmation we used the perylene’s fluorescence measurements.<br />
a − b<br />
y = + b<br />
1)<br />
( 0<br />
x − x )<br />
Δx<br />
1+<br />
e<br />
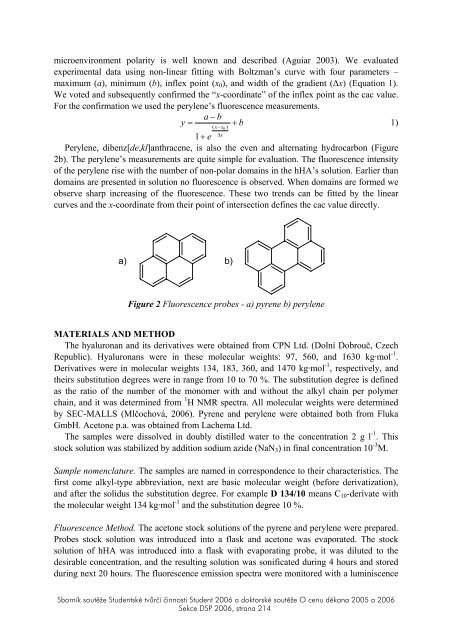
Perylene, dibenz[de,kl]anthracene, is also the even and alternat<strong>in</strong>g hydrocarbon (Figure<br />
2b). The perylene’s measurements are quite simple for evaluation. The fluorescence <strong>in</strong>tensity<br />
<strong>of</strong> the perylene rise with the number <strong>of</strong> non-polar doma<strong>in</strong>s <strong>in</strong> the hHA’s solution. Earlier than<br />
doma<strong>in</strong>s are presented <strong>in</strong> solution no fluorescence is observed. When doma<strong>in</strong>s are formed we<br />
observe sharp <strong>in</strong>creas<strong>in</strong>g <strong>of</strong> the fluorescence. These two trends can be fitted by the l<strong>in</strong>ear<br />
curves and the x-coord<strong>in</strong>ate from their po<strong>in</strong>t <strong>of</strong> <strong>in</strong>tersection def<strong>in</strong>es the cac value directly.<br />
a) b)<br />
Figure 2 Fluorescence probes - a) pyrene b) perylene<br />
MATERIALS AND METHOD<br />
The hyaluronan and its derivatives were obta<strong>in</strong>ed from CPN Ltd. (Dolní Dobrouč, Czech<br />
Republic). Hyaluronans were <strong>in</strong> these molecular weights: 97, 560, and 1630 kg·mol -1 .<br />
Derivatives were <strong>in</strong> molecular weights 134, 183, 360, and 1470 kg·mol -1 , respectively, and<br />
theirs substitution degrees were <strong>in</strong> range from 10 to 70 %. The substitution degree is def<strong>in</strong>ed<br />
as the ratio <strong>of</strong> the number <strong>of</strong> the monomer with and without the alkyl cha<strong>in</strong> per polymer<br />
cha<strong>in</strong>, and it was determ<strong>in</strong>ed from 1 H NMR spectra. All molecular weights were determ<strong>in</strong>ed<br />
by SEC-MALLS (Mlčochová, 2006). Pyrene and perylene were obta<strong>in</strong>ed both from Fluka<br />
GmbH. Acetone p.a. was obta<strong>in</strong>ed from Lachema Ltd.<br />
The samples were dissolved <strong>in</strong> doubly distilled water to the concentration 2 g l -1 . This<br />
stock solution was stabilized by addition sodium azide (NaN3) <strong>in</strong> f<strong>in</strong>al concentration 10 -3 M.<br />
Sample nomenclature. The samples are named <strong>in</strong> correspondence to their characteristics. The<br />
first come alkyl-type abbreviation, next are basic molecular weight (before derivatization),<br />
and after the solidus the substitution degree. For example D 134/10 means C10-derivate with<br />
the molecular weight 134 kg·mol -1 and the substitution degree 10 %.<br />
Fluorescence Method. The acetone stock solutions <strong>of</strong> the pyrene and perylene were prepared.<br />
Probes stock solution was <strong>in</strong>troduced <strong>in</strong>to a flask and acetone was evaporated. The stock<br />
solution <strong>of</strong> hHA was <strong>in</strong>troduced <strong>in</strong>to a flask with evaporat<strong>in</strong>g probe, it was diluted to the<br />
desirable concentration, and the result<strong>in</strong>g solution was sonificated dur<strong>in</strong>g 4 hours and stored<br />
dur<strong>in</strong>g next 20 hours. The fluorescence emission spectra were monitored with a lum<strong>in</strong>iscence<br />
Sborník soutěže Studentské tvůrčí č<strong>in</strong>nosti Student 2006 a doktorské soutěže O cenu děkana 2005 a 2006<br />
Sekce DSP 2006, strana 214


