

2. ENVIRONMENTAL ChEMISTRy & TEChNOLOGy 2.1. Lectures
2. ENVIRONMENTAL ChEMISTRy & TEChNOLOGy 2.1. Lectures
2. ENVIRONMENTAL ChEMISTRy & TEChNOLOGy 2.1. Lectures

You also want an ePaper? Increase the reach of your titles
YUMPU automatically turns print PDFs into web optimized ePapers that Google loves.
Chem. Listy, 102, s265–s1311 (2008) Environmental Chemistry & Technology<br />
P15 ATMOSPhERICAL DEPOSITION AND<br />
IMMISSION SITuATION IN THE NIŽNÁ<br />
SLANÁ AREA<br />
ERIKA FEDOROVá, JOZEF HAnČUľáK, OľGA<br />
ŠESTInOVá, Ján BREHUV and TOMISLAV ŠPALDOn<br />
Institute of Geotechnice of the Slovak Academy of Sciences,<br />
Watsonova 45, 043 53 Košice,<br />
fedorova@saske.sk<br />
Introduction<br />
Owing the positive results of geological survey, the<br />
nižná Slaná region has become during last 35 years the most<br />
important basis of Fe-ore. Potential of industrial siderite is<br />
63 mil. t 1,2 .<br />
The biggest of the polution sources is the chimney which<br />
is 120 m high. The dust fallout was monitored by means of<br />
17 sampling points located maximally up to 8 km from main<br />
source of pollution. The pollutants have municipal as well as<br />
industrial origin 5 . The range of plant emission by chemical<br />
data processing and by their comparision with dust deposition<br />
was investigated. In the present time the communal and<br />
the natural sphere causes the air pollution 3,7 .<br />
Experimental<br />
Samples of the dust deposition were taken in monthly<br />
intervals from seventeen sampling places in the intervals of<br />
30 ± 3 days. To take the samples of the dust deposition plastic<br />
sedimentation containers having a cylinder shape with the<br />
internal diameter of 1<strong>2.</strong>5 cm were used and located on two<br />
holders in the height of <strong>2.</strong>5 to 3 m 1,4,7 . The containers were<br />
filled with 250 ml of distilled water with additives of substances<br />
preventing creation of algae in the summer period and<br />
antifreeze additives in the winter period. After sampling the<br />
content of the containers was quantitatively transferred to the<br />
evaporating dishes and evaporated. To remove the organic<br />
mass the evaporation residue was annealed at the temperature<br />
of 450 ºC. The temperature was selected not to cause degradation<br />
of present carbonates and so possible distortion of<br />
gravimetry of the dust deposition. The gravimetry was made<br />
separately for each of the containers 6 . The result for each<br />
month and individual sampling places is calculated in units of<br />
g m –2 (30 days) –1 and it is the average of alues from two exposed<br />
containers. The inorganic part from twelve months set by<br />
annealing was cumulated into one sample and after mineralization<br />
analysed for individual monitored elements using the<br />
AAS method and the SpectrAA – 30 VARIAn unit 4,7 .<br />
Results<br />
Localisation of the sampling places of deposition is<br />
shown in Table I.<br />
The results are the values acquired from deposition<br />
samples after drying and annealing. The specific values of<br />
dust fallout are shown on Table II. As it is evident from these<br />
results, the highest values of the dust fallout were recorded<br />
in summer months and the vegetation period and that is<br />
s363<br />
Table I<br />
Localisation and the samples quantity in the year of 2007<br />
number of<br />
The samples<br />
Locality<br />
locality quantity<br />
1 Vlachovo – swimming pool 12<br />
2 Gočovo – playground 11<br />
3 n. Slaná – colony 12<br />
4 Above plant 12<br />
5 Before plant 12<br />
6 n. Slaná – agrarian cooperative 12<br />
7 n. Slaná – playground 12<br />
8 Direction to Kobeliarovo 12<br />
9 Crossroad – Štítnik 11<br />
10 Henckovce – before village 12<br />
11 Henckovce – upper part 12<br />
12 Henckovce – cemetary 12<br />
13 Henckovce – near railway 12<br />
14 Henckovce – lower part 12<br />
15 Between H. a G. Polomou 11<br />
16 Gemerská Poloma 12<br />
17 Betliar 12<br />
reflected in the percentage representation of the annealed<br />
organic part.<br />
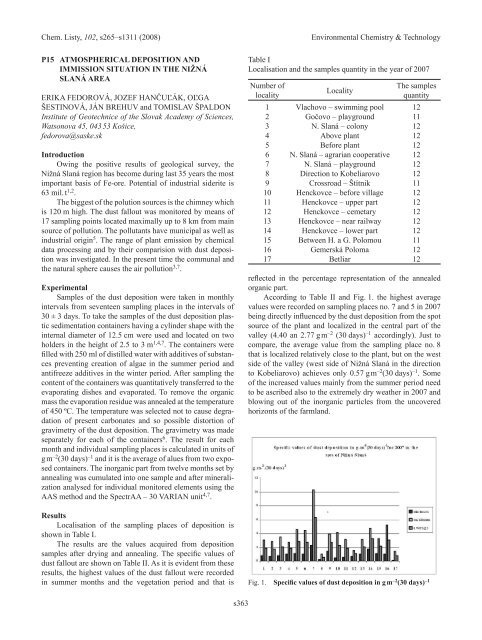
According to Table II and Fig. 1. the highest average<br />
values were recorded on sampling places no. 7 and 5 in 2007<br />
being directly influenced by the dust deposition from the spot<br />
source of the plant and localized in the central part of the<br />
valley (4.40 an <strong>2.</strong>77 g m –2 (30 days) –1 accordingly). Just to<br />
compare, the average value from the sampling place no. 8<br />
that is localized relatively close to the plant, but on the west<br />
side of the valley (west side of nižná Slaná in the direction<br />
to Kobeliarovo) achieves only 0.57 g m –2 (30 days) –1 . Some<br />
of the increased values mainly from the summer period need<br />
to be ascribed also to the extremely dry weather in 2007 and<br />
blowing out of the inorganic particles from the uncovered<br />
horizonts of the farmland.<br />
Fig. 1. Specific values of dust deposition in g m –2 (30 days) –1


