

2. ENVIRONMENTAL ChEMISTRy & TEChNOLOGy 2.1. Lectures
2. ENVIRONMENTAL ChEMISTRy & TEChNOLOGy 2.1. Lectures
2. ENVIRONMENTAL ChEMISTRy & TEChNOLOGy 2.1. Lectures

Create successful ePaper yourself
Turn your PDF publications into a flip-book with our unique Google optimized e-Paper software.
Chem. Listy, 102, s265–s1311 (2008) Environmental Chemistry & Technology<br />
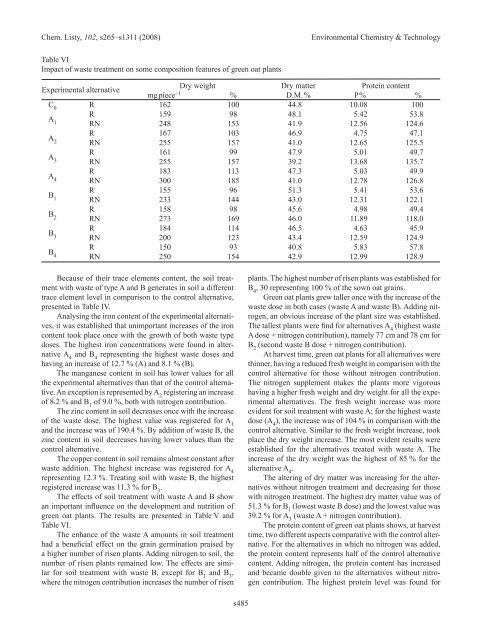
Table VI<br />
Impact of waste treatment on some composition features of green oat plants<br />
Experimental alternative<br />
Dry weight<br />
mg piece<br />
Dry matter Protein content<br />
–1 % D.M. % P % %<br />
C0 A1<br />
R<br />
R<br />
Rn<br />
162<br />
159<br />
248<br />
100<br />
98<br />
153<br />
44.8<br />
48.1<br />
41.9<br />
10.08<br />
5.42<br />
1<strong>2.</strong>56<br />
100<br />
53.8<br />
124.6<br />
A2<br />
R<br />
Rn<br />
167<br />
255<br />
103<br />
157<br />
46.9<br />
41.0<br />
4.75<br />
1<strong>2.</strong>65<br />
47.1<br />
125.5<br />
A3<br />
R<br />
Rn<br />
161<br />
255<br />
99<br />
157<br />
47.9<br />
39.2<br />
5.01<br />
13.68<br />
49.7<br />
135.7<br />
A4<br />
R<br />
Rn<br />
183<br />
300<br />
113<br />
185<br />
47.3<br />
41.0<br />
5.03<br />
1<strong>2.</strong>78<br />
49.9<br />
126.8<br />
B1<br />
R<br />
Rn<br />
155<br />
233<br />
96<br />
144<br />
51.3<br />
43.0<br />
5.41<br />
1<strong>2.</strong>31<br />
53.6<br />
12<strong>2.</strong>1<br />
B2<br />
R<br />
Rn<br />
158<br />
273<br />
98<br />
169<br />
45.6<br />
46.0<br />
4.98<br />
11.89<br />
49.4<br />
118.0<br />
R 184 114 46.5 4.63 45.9<br />
B3<br />
B4<br />
Rn 200 123 43.4 1<strong>2.</strong>59 124.9<br />
R 150 93 40.8 5.83 57.8<br />
Rn 250 154 4<strong>2.</strong>9 1<strong>2.</strong>99 128.9<br />
Because of their trace elements content, the soil treatment<br />
with waste of type A and B generates in soil a different<br />
trace element level in comparison to the control alternative,<br />
presented in Table IV.<br />
Analysing the iron content of the experimental alternatives,<br />
it was established that unimportant increases of the iron<br />
content took place once with the growth of both waste type<br />
doses. The highest iron concentrations were found in alternative<br />
A 4 and B 4 representing the highest waste doses and<br />
having an increase of 1<strong>2.</strong>7 % (A) and 8.1 % (B).<br />
The manganese content in soil has lower values for all<br />
the experimental alternatives than that of the control alternative.<br />
An exception is represented by A 2 registering an increase<br />
of 8.2 % and B 1 of 9.0 %, both with nitrogen contribution.<br />
The zinc content in soil decreases once with the increase<br />
of the waste dose. The highest value was registered for A 1<br />
and the increase was of 190.4 %. By addition of waste B, the<br />
zinc content in soil decreases having lower values than the<br />
control alternative.<br />
The copper content in soil remains almost constant after<br />
waste addition. The highest increase was registered for A 4<br />
representing 1<strong>2.</strong>3 %. Treating soil with waste B, the highest<br />
registered increase was 11.3 % for B 3 .<br />
The effects of soil treatment with waste A and B show<br />
an important influence on the development and nutrition of<br />
green oat plants. The results are presented in Table V and<br />
Table VI.<br />
The enhance of the waste A amounts in soil treatment<br />
had a beneficial effect on the grain germination praised by<br />
a higher number of risen plants. Adding nitrogen to soil, the<br />
number of risen plants remained low. The effects are similar<br />
for soil treatment with waste B, except for B 1 and B 3 ,<br />
where the nitrogen contribution increases the number of risen<br />
s485<br />
plants. The highest number of risen plants was established for<br />
B 4 , 30 representing 100 % of the sown oat grains.<br />
Green oat plants grew taller once with the increase of the<br />
waste dose in both cases (waste A and waste B). Adding nitrogen,<br />
an obvious increase of the plant size was established.<br />
The tallest plants were find for alternatives A 4 (highest waste<br />
A dose + nitrogen contribution), namely 77 cm and 78 cm for<br />
B 2 (second waste B dose + nitrogen contribution).<br />
At harvest time, green oat plants for all alternatives were<br />
thinner, having a reduced fresh weight in comparison with the<br />
control alternative for those without nitrogen contribution.<br />
The nitrogen supplement makes the plants more vigorous<br />
having a higher fresh weight and dry weight for all the experimental<br />
alternatives. The fresh weight increase was more<br />
evident for soil treatment with waste A; for the highest waste<br />
dose (A 4 ), the increase was of 104 % in comparison with the<br />
control alternative. Similar to the fresh weight increase, took<br />
place the dry weight increase. The most evident results were<br />
established for the alternatives treated with waste A. The<br />
increase of the dry weight was the highest of 85 % for the<br />
alternative A 4 .<br />
The altering of dry matter was increasing for the alternatives<br />
without nitrogen treatment and decreasing for those<br />
with nitrogen treatment. The highest dry matter value was of<br />
51.3 % for B 1 (lowest waste B dose) and the lowest value was<br />
39.2 % for A 3 (waste A + nitrogen contribution).<br />
The protein content of green oat plants shows, at harvest<br />
time, two different aspects comparative with the control alternative.<br />
For the alternatives in which no nitrogen was added,<br />
the protein content represents half of the control alternative<br />
content. Adding nitrogen, the protein content has increased<br />
and became double given to the alternatives without nitrogen<br />
contribution. The highest protein level was found for


