

2. ENVIRONMENTAL ChEMISTRy & TEChNOLOGy 2.1. Lectures
2. ENVIRONMENTAL ChEMISTRy & TEChNOLOGy 2.1. Lectures
2. ENVIRONMENTAL ChEMISTRy & TEChNOLOGy 2.1. Lectures

You also want an ePaper? Increase the reach of your titles
YUMPU automatically turns print PDFs into web optimized ePapers that Google loves.
Chem. Listy, 102, s265–s1311 (2008) Environmental Chemistry & Technology<br />
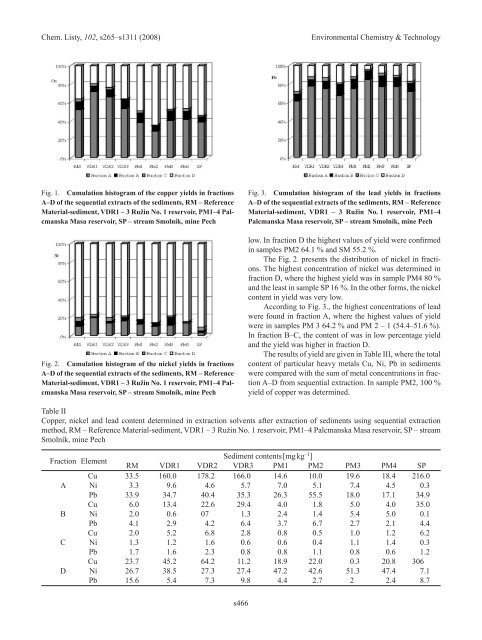
Fig. 1. Cumulation histogram of the copper yields in fractions<br />
A–D of the sequential extracts of the sediments, RM – Reference<br />
Material-sediment, VDR1 – 3 Ružin No. 1 reservoir, PM1–4 Palcmanska<br />
Masa reservoir, SP – stream Smolník, mine Pech<br />
Fig. <strong>2.</strong> Cumulation histogram of the nickel yields in fractions<br />
A–D of the sequential extracts of the sediments, RM – Reference<br />
Material-sediment, VDR1 – 3 Ružin No. 1 reservoir, PM1–4 Palcmanska<br />
Masa reservoir, SP – stream Smolník, mine Pech<br />
s466<br />
Fig. 3. Cumulation histogram of the lead yields in fractions<br />
A–D of the sequential extracts of the sediments, RM – Reference<br />
Material-sediment, VDR1 – 3 Ružin No. 1 reservoir, PM1–4<br />
Palcmanska Masa reservoir, SP – stream Smolník, mine Pech<br />
low. In fraction D the highest values of yield were confirmed<br />
in samples PM2 64.1 % and SM 55.2 %.<br />
The Fig. <strong>2.</strong> presents the distribution of nickel in fractions.<br />
The highest concentration of nickel was determined in<br />
fraction D, where the highest yield was in sample PM4 80 %<br />
and the least in sample SP 16 %. In the other forms, the nickel<br />
content in yield was very low.<br />
According to Fig. 3., the highest concentrations of lead<br />
were found in fraction A, where the highest values of yield<br />
were in samples PM 3 64.2 % and PM 2 – 1 (54.4–51.6 %).<br />
In fraction B–C, the content of was in low percentage yield<br />
and the yield was higher in fraction D.<br />
The results of yield are given in Table III, where the total<br />
content of particular heavy metals Cu, ni, Pb in sediments<br />
were compared with the sum of metal concentrations in fraction<br />
A–D from sequential extraction. In sample PM2, 100 %<br />
yield of copper was determined.<br />
Table II<br />
Copper, nickel and lead content determined in extraction solvents after extraction of sediments using sequential extraction<br />
method, RM – Reference Material-sediment, VDR1 – 3 Ružin no. 1 reservoir, PM1–4 Palcmanska Masa reservoir, SP – stream<br />
Smolník, mine Pech<br />
Fraction Element Sediment contents [mg kg –1 ]<br />
RM VDR1 VDR2 VDR3 PM1 PM2 PM3 PM4 SP<br />
Cu 33.5 160.0 178.2 166.0 14.6 10.0 19.6 18.4 216.0<br />
A ni 3.3 9.6 4.6 5.7 7.0 5.1 7.4 4.5 0.3<br />
Pb 33.9 34.7 40.4 35.3 26.3 55.5 18.0 17.1 34.9<br />
Cu 6.0 13.4 2<strong>2.</strong>6 29.4 4.0 1.8 5.0 4.0 35.0<br />
B ni <strong>2.</strong>0 0.6 07 1.3 <strong>2.</strong>4 1.4 5.4 5.0 0.1<br />
Pb 4.1 <strong>2.</strong>9 4.2 6.4 3.7 6.7 <strong>2.</strong>7 <strong>2.</strong>1 4.4<br />
Cu <strong>2.</strong>0 5.2 6.8 <strong>2.</strong>8 0.8 0.5 1.0 1.2 6.2<br />
C ni 1.3 1.2 1.6 0.6 0.6 0.4 1.1 1.4 0.3<br />
Pb 1.7 1.6 <strong>2.</strong>3 0.8 0.8 1.1 0.8 0.6 1.2<br />
Cu 23.7 45.2 64.2 11.2 18.9 2<strong>2.</strong>0 0.3 20.8 306<br />
D ni 26.7 38.5 27.3 27.4 47.2 4<strong>2.</strong>6 51.3 47.4 7.1<br />
Pb 15.6 5.4 7.3 9.8 4.4 <strong>2.</strong>7 2 <strong>2.</strong>4 8.7


