

2. ENVIRONMENTAL ChEMISTRy & TEChNOLOGy 2.1. Lectures
2. ENVIRONMENTAL ChEMISTRy & TEChNOLOGy 2.1. Lectures
2. ENVIRONMENTAL ChEMISTRy & TEChNOLOGy 2.1. Lectures

You also want an ePaper? Increase the reach of your titles
YUMPU automatically turns print PDFs into web optimized ePapers that Google loves.
Chem. Listy, 102, s265–s1311 (2008) Environmental Chemistry & Technology<br />
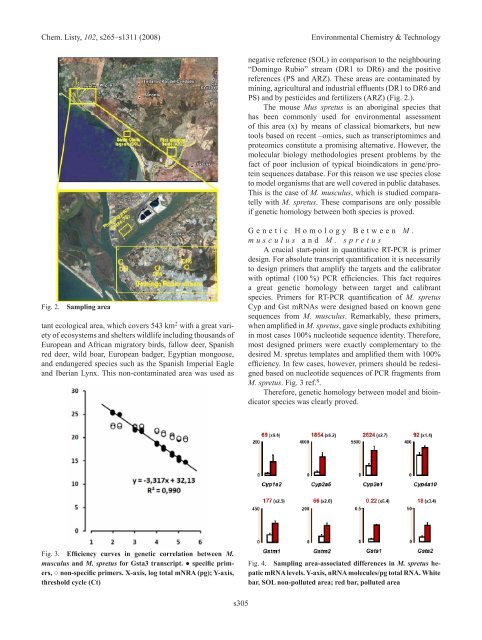
Fig. <strong>2.</strong> Sampling area<br />
tant ecological area, which covers 543 km 2 with a great variety<br />
of ecosystems and shelters wildlife including thousands of<br />
European and African migratory birds, fallow deer, Spanish<br />
red deer, wild boar, European badger, Egyptian mongoose,<br />
and endangered species such as the Spanish Imperial Eagle<br />
and Iberian Lynx. This non-contaminated area was used as<br />
Fig. 3. Efficiency curves in genetic correlation between M.<br />
musculus and M. spretus for Gsta3 transcript. ● specific primers,<br />
○ non-specific primers. X-axis, log total mNRA (pg); Y-axis,<br />
threshold cycle (Ct)<br />
s305<br />
negative reference (SOL) in comparison to the neighbouring<br />
“Domingo Rubio” stream (DR1 to DR6) and the positive<br />
references (PS and ARZ). These areas are contaminated by<br />
mining, agricultural and industrial effluents (DR1 to DR6 and<br />
PS) and by pesticides and fertilizers (ARZ) (Fig. <strong>2.</strong>).<br />
The mouse Mus spretus is an aboriginal species that<br />
has been commonly used for environmental assessment<br />
of this area (x) by means of classical biomarkers, but new<br />
tools based on recent –omics, such as transcriptomimcs and<br />
proteomics constitute a promising alternative. However, the<br />
molecular biology methodologies present problems by the<br />
fact of poor inclusion of typical bioindicators in gene/protein<br />
sequences database. For this reason we use species close<br />
to model organisms that are well covered in public databases.<br />
This is the case of M. musculus, which is studied comparatelly<br />
with M. spretus. These comparisons are only possible<br />
if genetic homology between both species is proved.<br />
G e n e t i c H o m o l o g y B e t w e e n M .<br />
m u s c u l u s a n d M . s p r e t u s<br />
A crucial start-point in quantitative RT-PCR is primer<br />
design. For absolute transcript quantification it is necessarily<br />
to design primers that amplify the targets and the calibrator<br />
with optimal (100 %) PCR efficiencies. This fact requires<br />
a great genetic homology between target and calibrant<br />
species. Primers for RT-PCR quantification of M. spretus<br />
Cyp and Gst mRnAs were designed based on known gene<br />
sequences from M. musculus. Remarkably, these primers,<br />
when amplified in M. spretus, gave single products exhibiting<br />
in most cases 100% nucleotide sequence identity. Therefore,<br />
most designed primers were exactly complementary to the<br />
desired M. spretus templates and amplified them with 100%<br />
efficiency. In few cases, however, primers should be redesigned<br />
based on nucleotide sequences of PCR fragments from<br />
M. spretus. Fig. 3 ref. 8 .<br />
Therefore, genetic homology between model and bioindicator<br />
species was clearly proved.<br />
Fig. 4. Sampling area-associated differences in M. spretus hepatic<br />
mRNA levels. y-axis, nRNA molecules/pg total RNA. white<br />
bar, SOL non-polluted area; red bar, polluted area


