

2. ENVIRONMENTAL ChEMISTRy & TEChNOLOGy 2.1. Lectures
2. ENVIRONMENTAL ChEMISTRy & TEChNOLOGy 2.1. Lectures
2. ENVIRONMENTAL ChEMISTRy & TEChNOLOGy 2.1. Lectures

You also want an ePaper? Increase the reach of your titles
YUMPU automatically turns print PDFs into web optimized ePapers that Google loves.
Chem. Listy, 102, s265–s1311 (2008) Environmental Chemistry & Technology<br />
Table I<br />
LODs of individual PBDE congeners [ng ml –1 isooctane] for the GC/MS techniques tested<br />
•<br />
•<br />
GC/MS (EI) GC/MS (nCI)<br />
Analyte PTV–GC/MS (EI) PTV–GC/MS GC/TOFMS (EI) PTV–GC/TOFMS<br />
(splitless) (splitless) (nCI)<br />
BDE 28 1.0 0.05 0.1 0.01 <strong>2.</strong>3 0.3<br />
BDE 47 1.0 0.1 0.1 0.01 3.1 0.6<br />
BDE 49 1.0 0.1 0.1 0.01 <strong>2.</strong>5 0.4<br />
BDE 66 1.0 0.1 0.1 0.01 3.7 0.6<br />
BDE 85 <strong>2.</strong>0 0.2 0.3 0.01 1.3 0.7<br />
BDE 99 1.5 0.1 0.3 0.01 3.0 0.4<br />
BDE 100 1.5 0.1 0.1 0.01 0.6 0.6<br />
BDE 153 5.0 0.1 0.6 0.02 3.2 0.9<br />
BDE 154 3.5 0.1 0.3 0.02 <strong>2.</strong>5 0.7<br />
BDE 183 3.0 0.2 0.2 0.06 7.1 1.5<br />
injection volume: multiple injection 2 × 10 μl<br />
splitless period: 2 min.<br />
The repeatability of the PTV–GC/MS injection,<br />
expressed as a relative standard deviation (RSD, n = 10)<br />
ranged from 3.8 to 6.3 % and 3.8 to 10.3 % for nCI and EI<br />
mode, respectively. Similar RSD values for multiple injections<br />
were obtained (3.8–9.2 % and 1.7–10.8 % for nCI and<br />
EI mode, resp.) were determined for spiked fish lipid extract<br />
(1 ng g –1 lipid weight).<br />
LODs calculated as a quantity of analyte that generates<br />
a response 3-time higher than the noise level of the detection<br />
system (based on the injection of solvent standard solution<br />
mixture) are summarized in Table I. LOQs were the minimum<br />
concentrations of analytes that was possible to quantify<br />
with acceptable accuracy and precision. Under these conditions,<br />
the LOQ was the lowest calibration level and corresponded<br />
for particular analyte to 3 × LOD. Generally, in nCI<br />
mode, significantly lower LODs were obtained compared to<br />
EI mode. On the other hand, the identification of individual<br />
PBDEs was only based on their retention times. PBDEs are<br />
eluted in order of increasing bromine number and intensity<br />
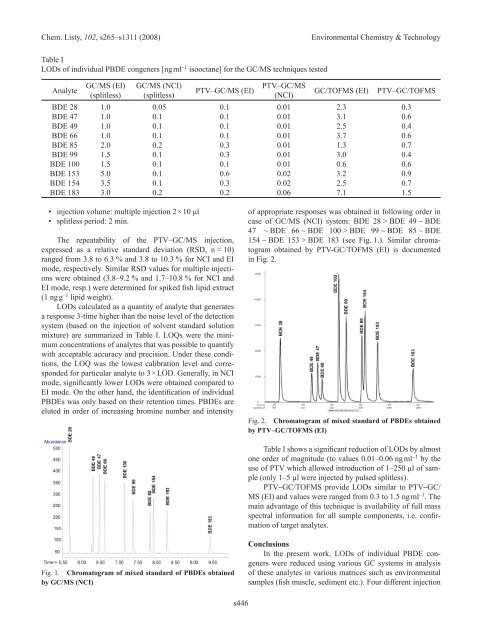
Fig. 1. Chromatogram of mixed standard of PbDEs obtained<br />
by GC/MS (NCI)<br />
s446<br />
of appropriate responses was obtained in following order in<br />
case of GC/MS (nCI) system: BDE 28 > BDE 49 ~ BDE<br />
47 ~ BDE 66 ~ BDE 100 > BDE 99 ~ BDE 85 ~ BDE<br />
154 ~ BDE 153 > BDE 183 (see Fig. 1.). Similar chromatogram<br />
obtained by PTV-GC/TOFMS (EI) is documented<br />
in Fig. <strong>2.</strong><br />
Fig. <strong>2.</strong> Chromatogram of mixed standard of PbDEs obtained<br />
by PTV–GC/TOFMS (EI)<br />
Table I shows a significant reduction of LODs by almost<br />
one order of magnitude (to values 0.01–0.06 ng ml –1 by the<br />
use of PTV which allowed introduction of 1–250 µl of sample<br />
(only 1–5 µl were injected by pulsed splitless).<br />
PTV–GC/TOFMS provide LODs similar to PTV–GC/<br />
MS (EI) and values were ranged from 0.3 to 1.5 ng ml –1 . The<br />
main advantage of this technique is availability of full mass<br />
spectral information for all sample components, i.e. confirmation<br />
of target analytes.<br />
Conclusions<br />
In the present work, LODs of individual PBDE congeners<br />
were reduced using various GC systems in analysis<br />
of these analytes in various matrices such as environmental<br />
samples (fish muscle, sediment etc.). Four different injection


