

2. ENVIRONMENTAL ChEMISTRy & TEChNOLOGy 2.1. Lectures
2. ENVIRONMENTAL ChEMISTRy & TEChNOLOGy 2.1. Lectures
2. ENVIRONMENTAL ChEMISTRy & TEChNOLOGy 2.1. Lectures

Create successful ePaper yourself
Turn your PDF publications into a flip-book with our unique Google optimized e-Paper software.
Chem. Listy, 102, s265–s1311 (2008) Environmental Chemistry & Technology<br />
<strong>2.</strong> <strong>ENVIRONMENTAL</strong> <strong>ChEMISTRy</strong><br />
& <strong>TEChNOLOGy</strong><br />
<strong>2.</strong>1. <strong>Lectures</strong><br />
L02 DEGRADATION PRODuCTS OF<br />
SyNThETIC POLyMERS AS EMERGING<br />
<strong>ENVIRONMENTAL</strong> CONTAMINANTS<br />
JOSEF ČáSLAVSKý, MILADA VáVROVá, DAnIELA<br />
MáCOVá and LUDMILA MRAVCOVá<br />
Institute of Chemistry and Technology of Environmental Protection,<br />
Faculty of Chemistry, Purkyňova 118, 612 00 Brno,<br />
Czech Republic,<br />
caslavsky@fch.vutbr.cz<br />
Introduction<br />
Synthetic polymers belong to attributes of modern life; it<br />
is hard to imagine contemporary lifestyle without them.<br />
These materials came into existence before almost 200<br />
years. In 1811 french pharmacist Henry Braconnot prepared<br />
the first man-made material by treating of wood and cotton<br />
by concentrated nitric acid. This material was called “xyloidin”<br />
and it hasn’t found any practical use. The term “polymer”<br />
was proposed later in 1833 by Jöns Jakob Berzelius.<br />
The first semi-synthetic polymer, vulcanized rubber, was<br />
synthesized by Charles Goodyear in 1839. Very popular and<br />
widely used celluloid was discovered in 1870 by John Wesley<br />
Hyatt; it was prepared from nitrocellulose and camphor. All<br />
these polymers were based on raw materials of natural origin.<br />
The first fully synthetic (and also very popular) polymer was<br />
bakelite, which was prepared between years 1907–1909 by<br />
Belgian chemist Leo Baekeland.<br />
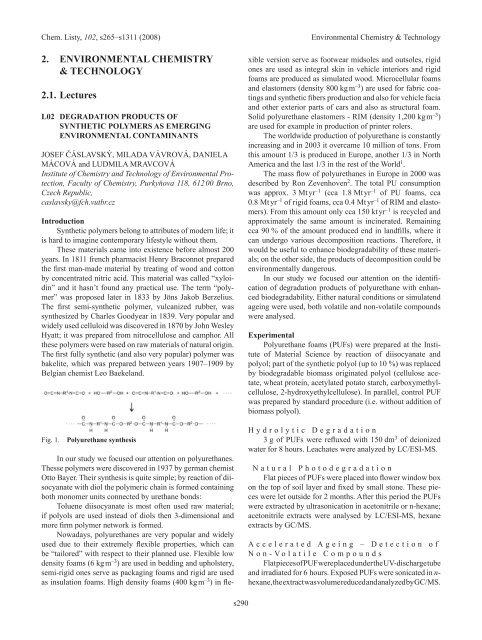
Fig. 1. Polyurethane synthesis<br />
In our study we focused our attention on polyurethanes.<br />
Thesse polymers were discovered in 1937 by german chemist<br />
Otto Bayer. Their synthesis is quite simple; by reaction of diisocyanate<br />
with diol the polymeric chain is formed containing<br />
both monomer units connected by urethane bonds:<br />
Toluene diisocyanate is most often used raw material;<br />
if polyols are used instead of diols then 3-dimensional and<br />
more firm polymer network is formed.<br />
nowadays, polyurethanes are very popular and widely<br />
used due to their extremely flexible properties, which can<br />
be “tailored” with respect to their planned use. Flexible low<br />
density foams (6 kg m –3 ) are used in bedding and upholstery,<br />
semi-rigid ones serve as packaging foams and rigid are used<br />
as insulation foams. High density foams (400 kg m –3 ) in fle-<br />
s290<br />
xible version serve as footwear midsoles and outsoles, rigid<br />
ones are used as integral skin in vehicle interiors and rigid<br />
foams are produced as simulated wood. Microcellular foams<br />
and elastomers (density 800 kg m –3 ) are used for fabric coatings<br />
and synthetic fibers production and also for vehicle facia<br />
and other exterior parts of cars and also as structural foam.<br />
Solid polyurethane elastomers - RIM (density 1,200 kg m –3 )<br />
are used for example in production of printer rolers.<br />
The worldwide production of polyurethane is constantly<br />
increasing and in 2003 it overcame 10 million of tons. From<br />
this amount 1/3 is produced in Europe, another 1/3 in north<br />
America and the last 1/3 in the rest of the World 1 .<br />
The mass flow of polyurethanes in Europe in 2000 was<br />
described by Ron Zevenhoven 2 . The total PU consumption<br />
was approx. 3 Mt yr –1 (cca 1.8 Mt yr –1 of PU foams, cca<br />
0.8 Mt yr –1 of rigid foams, cca 0.4 Mt yr –1 of RIM and elastomers).<br />
From this amount only cca 150 kt yr –1 is recycled and<br />
approximately the same amount is incinerated. Remaining<br />
cca 90 % of the amount produced end in landfills, where it<br />
can undergo various decomposition reactions. Therefore, it<br />
would be useful to enhance biodegradability of these materials;<br />
on the other side, the products of decomposition could be<br />
environmentally dangerous.<br />
In our study we focused our attention on the identification<br />
of degradation products of polyurethane with enhanced<br />
biodegradability. Either natural conditions or simulatend<br />
ageing were used, both volatile and non-volatile compounds<br />
were analysed.<br />
Experimental<br />
Polyurethane foams (PUFs) were prepared at the Institute<br />
of Material Science by reaction of diisocyanate and<br />
polyol; part of the synthetic polyol (up to 10 %) was replaced<br />
by biodegradable biomass originated polyol (cellulose acetate,<br />
wheat protein, acetylated potato starch, carboxymethylcellulose,<br />
2-hydroxyethylcellulose). In parallel, control PUF<br />
was prepared by standard procedure (i.e. without addition of<br />
biomass polyol).<br />
H y d r o l y t i c D e g r a d a t i o n<br />
3 g of PUFs were refluxed with 150 dm 3 of deionized<br />
water for 8 hours. Leachates were analyzed by LC/ESI-MS.<br />
n a t u r a l P h o t o d e g r a d a t i o n<br />
Flat pieces of PUFs were placed into flower window box<br />
on the top of soil layer and fixed by small stone. These pieces<br />
were let outside for 2 months. After this period the PUFs<br />
were extracted by ultrasonication in acetonitrile or n-hexane;<br />
acetonitrile extracts were analysed by LC/ESI-MS, hexane<br />
extracts by GC/MS.<br />
A c c e l e r a t e d A g e i n g – D e t e c t i o n o f<br />
n o n - V o l a t i l e C o m p o u n d s<br />
Flat pieces of PUF were placed under the UV-discharge tube<br />
and irradiated for 6 hours. Exposed PUFs were sonicated in nhexane,<br />
the extract was volume reduced and analyzed by GC/MS.
Chem. Listy, 102, s265–s1311 (2008) Environmental Chemistry & Technology<br />
A c c e l e r a t e d A g e i n g – D e t e c t i o n o f<br />
V o l a t i l e C o m p o u n d s<br />
Flat pieces of PUFs were placed into accelerated ageing<br />
device (Fig. <strong>2.</strong>) composed of quartz tube open on one end<br />
(length 24.5 cm, I.D. 3.5 cm) with input tubing and Teflon<br />
cover. The device was placed under UV discharge tube.<br />
Two SPME devices were inserted into both input and output<br />
tubing (the first with polydimethylsiloxane fibre, the second<br />
with polyacrylate fibre) and the ends of the device together<br />
with SPME holders were covered by aluminium foil to protect<br />
them against the UV light. The irradiation tooks place<br />
for 6 hours. After this period, SPME devices were directly<br />
analyzed by GC/MS.<br />
Fig. <strong>2.</strong> Accelerated ageing device<br />
H P L C / M S<br />
For HPLC/MS the Esquire-LC instrument (Bruker Daltonics,<br />
Bremem, Germany) was used. This system consists<br />
of the Agilent HPLC 1100 Series with binary gradient pump,<br />
electrospray ion source and spherical ion trap analyzer. A Supelcosil<br />
LC-18DB column (<strong>2.</strong>1 × 250 mm, 5 µm particles)<br />
was used (Supelco, USA). Gradient elution from 30 to 100 %<br />
acetonitrile in water in 30 min was used at constant flow rate<br />
of 0.25 ml min –1 . For the detection both UV-VIS detector of<br />
DAD type, and mass spectrometry were used. Drying temperature<br />
in electrospray was 350 °C, nebuilizing gas (n 2 ) pressure<br />
was 50 psi, and drying gas (n 2 ) flow was 14 dm 3 min –1 .<br />
Both positive and negative ions were registered (in separate<br />
runs).<br />
G C / M S<br />
System Agilent 6890n GC/5973 MSD (Agilent Technologies,<br />
Waldbronn, Germany) was employed. The column<br />
was HP-5MS 5 m × 0.25 mm × 0.25 µm, helium at a flow of<br />
1 ml min –1 was used as carrier gas in constant flow mode.<br />
Temperature program was as follows: 50 °C for 1 min, then<br />
to 280 °C at 5 °C min –1 , final isotherm 5 min. 1 µl of sample<br />
was injected in splitless mode at a temperature of 280 °C with<br />
Fig. 3. Structure of PuF hydrolytic degradation product<br />
s291<br />
splitless time of 1 min. Interface temperature was 260 °C,<br />
temperature of ion source and quadrupole 230 and 150 °C,<br />
respectively. Electron ionization at 70 eV electron energy<br />
was used, spectra were registered in scan mode within the<br />
range of 50–450 amu. nIST 05 spectral library was used for<br />
the identification of separated compounds.<br />
Fig. 4. PuF non-volatile degradation products. Compound<br />
identification: 1: bis(2-ethylhexyl) ester of hexanedioic acid;<br />
2: di-tolyl-isocyanate<br />
Results<br />
Typical LC chromatogams of PUF extract show only<br />
two peaks at the beginning. Using the LC/MS/MS experiments<br />
and MS n with direct insfusion of the sample, the probable<br />
structure of main degradation product was proposed (see<br />
Fig. 3.).<br />
This structure is evidently a fragment of polyurethane<br />
polymer chain.<br />
Fig. 4. shows the chromatogram of hexane extract of<br />
polyurethane after UV irradiation. Using the database search<br />
several peaks were successfully identified, but in many cases<br />
the identification was unsuccesfull, in spite of the fact that the<br />
experimental spectrum was of good quality. The most probable<br />
explanation is that the nIST05 database doesn’t contain<br />
Fig. 5. Volati1e degradation products (PDMS fibre). Compound<br />
identification: 1: 2-methyl-1,3-dioxane; 2: 2,6-diisocyanatotoluene;<br />
3: 6,10-dimethyl-5,9-undecadiene-2-one; 4: 2,5-diterc-butyl-1,4-benzochinone;<br />
5: pentadecane; 6: hexadecane; 7:<br />
2,6-bis(1,1-dimethyethyl)-4-(1-oxopropyl)phenol; 8: dodecanoic<br />
acid methylester; 9: 4-decyl-morpholine; 10: heptadecane; 11:<br />
2,6,10,14-tetramethyl-pentadecane; 12: ?? (isoprenoid alkane);<br />
13: tetradecanoic acid isopropylester; 14: 4-undecyl-morpholine;<br />
15: N,N-dimethyl-1-hexadecanamine; 16: 4-tetradecylmorpholine;<br />
17: squalene; 18: 4-hexadecyl-morpholine
Chem. Listy, 102, s265–s1311 (2008) Environmental Chemistry & Technology<br />
Fig. 6. Volati1e degradation products (PA fibre). Compound<br />
identification: 1: 2-(2-ethoxyethoxy)-ethanol; 2: 2-ethylhexanoic<br />
acid; 3: 1,3-dioxane; 4: 2-methyl-1,3-dioxolane; 5:<br />
2-methyl-1,3-diisocyanatobenzene; 6: 2,6-bis(1,1-dimethyethyl)-4-(1-oxopropyl)phenol;<br />
7: 4-decyl-morpholine; 8: 4-undecyl-morpholine;<br />
9: N,N-dimethyl-1-hexadecanamine; 10: 4-tetradecyl-morpholine;<br />
11: 4-hexadecyl-morpholine<br />
mass spectra of compounds of this type. The only possibility<br />
of structure revealing in these cases remains the manual interpretation<br />
using the common fragmentation rules 3 .<br />
Fig. 5. shows the chromatogram of volatile degradation<br />
products of PUF with addition of hydroxyethylcellulose<br />
adsorbed by SPME on PDMS fibre. Various classes of compounds<br />
were found – alkanes, esters of fatty acids, morpholine<br />
derivatives, but also poisonous 2,6-diisocyanatotoluene.<br />
Fig. 6. depicts the same degradation products adsorbed on<br />
polyacrylate fibre. In this case more polar compounds are<br />
preferred like morpholine derivatives, but again toxic 2,6-diisocyanatotoluene<br />
(compound 2) was found.<br />
Composition of the degradation products also depends<br />
on the type of biodegradable filler. Toluene diisocyanate was<br />
found only when hydroxyethylcellulose and cellulose acetate<br />
were applied.<br />
s292<br />
Conclusions<br />
Degradation products of polyurethane foams with enhanced<br />
biodegradability were studied. Both degradation under<br />
natural conditions and accelerated ageing were used, both<br />
non-volatile and volatile compounds were analysed using<br />
liquid and gas chromatography interfaced to mass spectrometry.<br />
The composition of degradation products was influenced<br />
by the type of biodegradable filler used instead of 5 % of<br />
polyether polyol in the polyurethane synthesis. When modified<br />
cellulose was used, poisonous toluene diisocyanate was<br />
identified as volatile degradation product. The identification<br />
of products separated by GC by library search was unsuccesfull<br />
in many cases; the reason is problably caused by the fact<br />
that the used MS library is commonly oriented and doesn’t<br />
contain the spectra of PUF degradation products.<br />
Following research will be focused on the quantitative<br />
analysis of PUF degradation products, either using SPME<br />
and suitable surrogates, or using adsorption tubes with suitable<br />
adsorbent.<br />
The finantial support from the project no.MSM<br />
0021630501 from Ministry of Education, Youth and Sport of<br />
the CR is greatly acknowledged.<br />
REFEREnCES<br />
1 http://www.poliuretanos.com.br/Ingles/Chapter1/<br />
11Market.htm<br />
<strong>2.</strong> Zevenhoven R., Ph.D. Thesis, Helsinki University of<br />
Technology, Helsinki, Finland, 2004<br />
3. McLafferty F., Tureček F.: Interpretation of Mass<br />
Spectra. University Science Books, USA, 1993.
Chem. Listy, 102, s265–s1311 (2008) Environmental Chemistry & Technology<br />
L03 uSAGE OF GAS ChROMATOGRAPhy<br />
AND IMS DETECTION FOR EVALuATION<br />
OF POLyMER bARRIER MATERIAL<br />
PROPERTIES<br />
JAnA DVOřáKOVáa and IVAn MAŠEKb aVOP-026 Šternberk, s.p., division VTÚO Brno, Veslařská<br />
230, 637 00 Brno, Czech Republic,<br />
bFaculty of Chemistry, VUT, Purkyňova 118, 612 00 Brno,<br />
Czech Republic,<br />
dvorakova.j@vtuo.cz<br />
Introduction<br />
The protective properties are the most important parameters<br />
for selection of well-suited materials for construction<br />
of individual protective equipment (IPE). These properties<br />
determine ability of a given IPE against the highly toxic<br />
agents and industrial harmful substances under short time<br />
and/or long time contamination in the gaseous and liquid<br />
phases.<br />
The most frequently used protective materials for IPE<br />
are polymer barrier materials. Their numerous advantages<br />
such as easy availability, possibility of mass production,<br />
relative low cost as well as the broad range of manufactured<br />
qualities determine their use for different protective purposes.<br />
Single-layer or laminated polymers and textile with polymeric<br />
or elastomeric layer are used as barrier materials. It is<br />
possible to use metallic film, PET sheet with layer of SiOx<br />
(e.g. material CERAMIX from company ALCAn) or other<br />
nanolayers, adsorption textile (e.g. SARATOGA with spherical<br />
sorbent or Charcoal Cloth made from activated carbon<br />
fibres) eventually special membranes (e.g. nAFIOn, GORE-<br />
TEX, POROTEX, PURTEX etc.) with specific diffusion properties<br />
for toxic agents.<br />
Resistance of polymer barrier materials against harmful<br />
substances is defined as parameter called breakthrough<br />
time (BT) 1,2,3,4 . Breakthrough time is the most widespread<br />
way of barrier materials evaluation in term of constructional<br />
usage of materials, their manufacture and conditions of their<br />
selection.<br />
Experimental<br />
The procedures for evaluation of protective properties<br />
are elaborated in accordance with the Czech Technical Standard<br />
ČSn ISO En 6529 (October 2001) which results from<br />
American Standard ASTM F 739-99a (August 1999)5,6. The<br />
above-mentioned standard describes experimental methods<br />
used for testing of barrier materials resistance against permeation<br />
of liquid and gaseous substances and, among other<br />
things (e.g. conditions of measurement for closed-loop or<br />
open-loop, continual and discontinual measurement, preparation<br />
of samples etc.) recommends suitable analytical techniques<br />
for evaluation of permeation toxic vapors. The gas<br />
chromatography (GC) is one of these techniques which is<br />
commonly used for detection and identification of chemical<br />
warfare agents (CWA) as well as ion mobility spectrome-<br />
s293<br />
try (IMS)7,8,9,10. The 2, 2’-dichlorodiethylsulfide (sulphur<br />
mustard, HD) was used for measurement of permeation as<br />
testing chemical. The double-sided butyl rubber polyamide<br />
fabric was used as the used tested material.<br />
P e r m e a t i o n M e t h o d<br />
The following methods were selected for evaluation of<br />
barrier properties of polymer materials11,12,14,15. The principle<br />
of these methods is illustrated by visual demonstration<br />
on Fig. 1. where the scheme of alternative permeation cell<br />
that is used for measurement at aerodynamics conditions.<br />
The alternative permeation cell respects requirements of<br />
standard ČSn En ISO 6529. This cell is made from stainless<br />
steel. The clamping system is solved by the one central<br />
withdrawal nut (see scheme on Fig. 1.) that makes possible<br />
not only quick clamping and exchange of tested materials but<br />
also total obturation of samples. The tested material separates<br />
the alternative cell into two parts. Upside of cell contains<br />
testing chemical (here sulphur mustard) and on the other side<br />
the permeating gas or vapor is swept away into the carrier gas<br />
leading to detector. The carrier gas and agent vapors mixture<br />
is then analyzed by suitable detection techniques.<br />
Fig. 1. Scheme of alternative permeation cell used for measurement<br />
at aerodynamics conditions<br />
C o m p o s i t i o n o f E x p e r i m e n t a l<br />
S y s t e m<br />
The experimental system for permeation measurement<br />
of toxic agents was designed in accordance with the standard<br />
ČSn En ISO 6529. The clean air comes through drying<br />
column (the clean air is represented by blue arrows) washes<br />
lower part of tested material. The air stream carry away permeating<br />
vapors of testing chemical to the given detector (the<br />
air containing vapors of testing chemical is represents by red<br />
arrow). This system was modified according to the used kind<br />
of detection (see scheme on Fig. <strong>2.</strong>).<br />
GC and IMS detector GID-3 were used for analysis of<br />
permeating sulfur mustard vapors. The GC equipped with<br />
FID detector, Agilent 6890, was used for separation of gases<br />
and vapors between mobile and stationary phase. The components<br />
are separated on the basis of holding ability of the<br />
stationary phase into the chromatographic column. This analytical<br />
method enables evaluation of taken samples using
Chem. Listy, 102, s265–s1311 (2008) Environmental Chemistry & Technology<br />
Fig. <strong>2.</strong> Composition of usable experimental system for measurement<br />
of permeation of toxic agent through protection barrier<br />
materials<br />
thermal desorption from solid phase sorbent (Tenax TA),<br />
direct solvent liquid extraction (n-hexane) and solid phase<br />
extraction (SPE) method. The IMS detector GID-3 operates<br />
on the basis of the different mobility of ions in gaseous phase<br />
in the homogeneous electric field.<br />
The investigated barrier material sample was fixed<br />
inside the alternative permeation cell (see scheme on Fig. 1.)<br />
and contaminated from the upper side with defined amount of<br />
liquid HD agent. The permeating agent vapors were sampled<br />
from the permeation cell space under the material sample<br />
by the IMS detector. The air-drying column was connected<br />
at the front end of the permeation cell inlet to protect IMS<br />
detector against moisture. IMS detector was connected to the<br />
PC where the measured data was continually acquired, saved<br />
and graphically evaluated (see chart on Fig. 3. and Fig. 4.)<br />
with using the software BarieraSW2006 especially designed<br />
for this purpose.<br />
The scheme of LI/GC and TD/GC testing system is<br />
shown on Fig. <strong>2.</strong> The same configuration of permeation cell<br />
including the investigated material sample placing and contamination<br />
procedure was used. The special sampling device<br />
equipped with a controlled air pump and flow meter was used<br />
for permeating agent sampling by the solid phase extraction<br />
ASSET-32 tubes, direct solvent liquid extraction (DSLE)<br />
by n-hexane (for GC, ≥ 99.0 %) and DAAMS Tenax thermal<br />
desorption tubes. Air flow of 100 mL/min was set up.<br />
Agilent GC equipped with FID detector was used for analysis<br />
of liquid sample.<br />
Results<br />
The results of sulphur mustard permeation through tested<br />
materials obtained by IMS detector and GC (thermal desorption,<br />
direct liquid extraction and solid phase extraction) are<br />
compared in the chart on Fig. 3. and Fig. 4. Observed concentration<br />
shift shown in the chart is probably caused by different<br />
sensitivity of used methods. SPE method is more sensitive<br />
than direct solvent liquid extraction and direct solvent<br />
liquid extraction method is more sensitive than IMS method.<br />
s294<br />
Fig. 3. he IMS and LI/GC techniques (direct solvent liquid<br />
extraction and solid phase extraction) results comparison<br />
Fig. 4. The IMS and TD/GC techniques (thermal desorption)<br />
results comparison<br />
Breakthrough time of HD was determined on the basis<br />
of graphical analysis of permeation curves called time-lag.<br />
The permeation curve was interlayed by line13–19. The point<br />
where the line is crossing the x-axis represents the HD breakthrough<br />
time of investigated material (see Table I).<br />
Table I<br />
The values of HD breakthrough time obtain time-lag method<br />
The used Breakthorough time of HD<br />
techniques minutes hours<br />
IMS 350 5 : 50<br />
TD-GC 310 5 : 10<br />
LI-GC (SPE) 270 4 : 30<br />
LI-GC (DSLE) 300 5 : 00<br />
Basically the breakthrough time is dependent also on the<br />
other factors then the used analytical method. Temperature<br />
is one of the most important factors, which strongly influences<br />
the permeation process. The following experiments, held<br />
under the same conditions, have been performed to quantify<br />
the temperature dependence. The course of permeation was<br />
monitoring by the IMS detector GID-3, which is preferable<br />
for long continual measurement. The measurement was proceeded<br />
in temperature range from 15 °C to 40 °C by 5 °C. The<br />
lower range limit was defined by freezing point of sulphur<br />
mustard, which is 14.5 °C. The upper limit was restricted by
Chem. Listy, 102, s265–s1311 (2008) Environmental Chemistry & Technology<br />
tolerable ness of protection means. The fatal overheating of<br />
human body can happen at the temperatures over 40 °C.<br />
The charts of all permeation curves are shown on Fig. 5.<br />
The permeation of HD agent through polymer membrane is<br />
faster with increasing temperature and permeation will be<br />
sharper course.<br />
Fig. 5. The comparison of permeation curves obtained at different<br />
temperatures<br />
The related values of breakthrough times evaluated with<br />
using time lag method are presented in Table II.<br />
Table II<br />
The values of HD breakthrough time obtained with using the<br />
time-lag method for measurement under various temperatures<br />
by IMS detector<br />
Temperature Breakthorough time of HD<br />
minutes hours<br />
15 °C 1485 22 : 20<br />
20 °C 600 12 : 00<br />
25 °C 440 7 : 20<br />
30 °C 285 4 : 45<br />
35 °C 150 2 : 30<br />
40 °C 90 1 : 30<br />
The dependence of HD breakthrough time on temperature<br />
is plotted in chart shown on Fig. 6. The points in the<br />
chart were interlaced by exponential curve and this curve was<br />
expressed by regression equation. The exponential equation<br />
can be used for breakthrough time on temperature depen-<br />
Fig. 6. The chart of hD breakthrough time dependence on the<br />
temperature<br />
s295<br />
dence quantification and the parameters could be used for<br />
different materials resistance comparison.<br />
Conclusions<br />
The main purpose of this measurement was to compare<br />
the analytical methods and/or detection techniques used for<br />
the breakthrough time’s evaluation. On the basis of obtained<br />
results comparison it is possible to submit that the value of<br />
HD breakthrough time is strongly dependent on sensitivity of<br />
used analytical method. The IMS detector enables to perform<br />
the continual measurement of permeation HD in real time.<br />
The result is permeation curve represented by increase of permeating<br />
vapors amount in time. The GC method providing<br />
an exact determination of kind and amount of permeating<br />
compound and products of interaction between tested polymer<br />
and permeating toxic agent, i.e. qualitative a quantitative<br />
analysis in contrast to IMS. However, the GC method does<br />
not enable to perform the continual measurement and is not<br />
so suitable for long term measurement. Otherwise, the IMS<br />
method indicates course of permeation vapor through polymer<br />
membrane but is not able to determine kind and amount<br />
of permeated compound.<br />
But simultaneous use of both detection methods used<br />
simultaneously enable to perform the more exact definition<br />
of tested polymer barrier material character.<br />
References<br />
1. Slabotinský J.: Dissertation, VÚ 070 Brno, 1981.<br />
<strong>2.</strong> Rozsíval V.: Dissertation, VAAZ Brno, 1961.<br />
3. Obšel, V., Dvořáková, J.: Průběžná zpráva, VTÚO Brno,<br />
2006.<br />
4. Obšel, V., Dvořáková, J.: Průběžná zpráva, VTÚO Brno,<br />
2007.<br />
5. ASTM F 739-99a: Standard Test Method for Resistance<br />
of Protective Clothing Materials to Permeation by<br />
Liquids or Gases Under Conditions of Continuous Contact<br />
(August 1999)<br />
6. ČSn En ISO 6529: Ochranné oděvy – Ochrana proti<br />
chemikáliím – Stanovení odolnosti materiálů ochranných<br />
oděvů proti permeaci kapalin a plynů (říjen 2002).<br />
7. Hill, H. H., Martin, Jr. and S. J.: Pure Appl. Chem. 74,<br />
2281 (2002).<br />
8. Lancaster, P. A.: Gas chromatography analysis of sulfur<br />
mustard in diethyl phthalate. Melbourne, Australia,<br />
1998.<br />
9. Jareman, F.: Master`s Thesis. , Lulea University of technology,<br />
1999<br />
10. Gary D. Sides Detection<br />
of chemical warfare agents, IUPAC Workshop,<br />
Croatia [on line]. 2007, 16.8.2007 [cit. 20.09.2007].<br />
Dostupný z: .
Chem. Listy, 102, s265–s1311 (2008) Environmental Chemistry & Technology<br />
11. Duncan, B., Urquhart, J., Roberts, S.: Review of Measurement<br />
and Modelling of Permeation and Diffusion in<br />
Polymers. nP Laboratory, UK, 2005.<br />
1<strong>2.</strong> Rozsíval, V.: Habilitační práce, Brno 1966.<br />
13. Ye, X., Lv, L., Zhao, X. S., Wang, K.: J. Membr. Sci.<br />
283, 425 (2006).<br />
14. Crank, J.: The Mathematics of Diffusion, Clarendon<br />
press, Oxford, 1956.<br />
15. Dhingra, S. S.: Mixed Gas Transport Study through<br />
Polymeric Membranes: A novel technique. Faculty of<br />
the Virginia Polytechnic Institute and State University,<br />
Blacksburg, Virginia, 1997.<br />
s296<br />
16. Laot, Ch.M.: Gas Transport Properties in Polycarbonate.<br />
Faculty of the Virginia Polytechnic Institute and<br />
State University Blacksburg, Virginia, 2001.<br />
17. Flaconneche, B., Martin, J., Klopffer, M. H.: Oil Gas<br />
Sci. Technol, 56, 261 (2001).<br />
18. Wang, P., Schneider n. S., Sung n.: J. Appl. Polym. Sci.<br />
71, 1525 (1999).<br />
19. Holzmuller, W., Alternburg, K.: Fyzika polymerů. Praha,<br />
SnTL, 1966.
Chem. Listy, 102, s265–s1311 (2008) Environmental Chemistry & Technology<br />
L04 COMPLEx ESSESSMENT OF<br />
ORGANOPhOSPhATES LOw DOSE<br />
ChRONIC ExPOSuRE ON ENDOThELIuM,<br />
MACROPhAGES, PLATELETS AND<br />
ESTERASES<br />
e. ERMOLAEVA, n. GOnCHAROV, A. RADILOV,<br />
L. GLASHKInA, I. MInDUKSHEVa , P. AVDOnInb ,<br />
I. DOBRYLKO and V. REMBOVSKIY<br />
Research Institute of Hygiene, Occupational Pathology and<br />
Human Ecology, Saint-Petersburg, Russia,<br />
aI. M.Sechenov Institute of Evolutionary Physiology and Biochemistry,<br />
Saint-Petersburg, Russia,<br />
bN. K. Koltzov Institute of Developmental Biology, Moscow,<br />
Russia,<br />
nvgoncharov@mail.ru<br />
Introduction<br />
Morphofunctional disturbances of circulation in rat<br />
embryos intoxicated by derivatives of organophosphates<br />
(OP), a role of endothelium directly affected by OP under<br />
acute intoxications 1,2 , and various data on the role of endothelium<br />
in development of peripheral neuropathies of various<br />
genesis 3,4,5 were the basis for consideration of endothelium<br />
as one of the main targets under chronic intoxication with OP.<br />
In this research work, an attempt has been undertaken to clarify<br />
an impact of circulatory disturbances, the cellular component<br />
of haemostasis, and neuropathy target esterase (nTE)<br />
activity upon reaction of rat organism under intoxication with<br />
low doses of OP.<br />
Materials and Methods<br />
In these experiments diisopropylfluorophosphate (DFP),<br />
which can induce the delayed polyneuropathy, and paraoxon<br />
s297<br />
which has no such effect, were applied with drinking water<br />
at doses 10 –2 mg kg –1 (1/100 LD 50 ) and 10 –4 mg kg –1 (1/10,000<br />
LD 50 ). The intoxication was conducted daily 5 times in a week<br />
for 3 months. Esterases of choline and non-choline substrate specificity<br />
6,7,8,9 were studied; for rat brain, the enzyme activity was<br />
calculated per mg of protein 10 . To investigate the OP effects upon<br />
nADPH-oxidase system, we used the functional state of peritoneal<br />
macrophages with fluorescent microscope and fluorescent<br />
probe dichlorfluorescein diacetate (DCF) 11 . Kinetic parameters<br />
of platelet aggregation were studied by low angle light scattering<br />
technique 12 . The functional activity of endothelium under OP<br />
intoxication was studied with rat aorta by method of endotheliumdependent<br />
relaxation 13,14 . The results obtained were processed by<br />
variation statistics and MS Exсel software.<br />
Results and Discussion<br />
Comparing the level of inhibition of esterases in blood<br />
plasma after 3 months’ intoxication with the OP, we have<br />
found that the residual activity of nTE was much lower than<br />
that of red blood cells’ acetylcholine esterase (AChE). Inhibition<br />
of nTE activity in rat brain 2 months after stopping<br />
intoxication with DFP gives an indirect evidence for development<br />
of neurotoxic effects. Activity of esterases after chronic<br />
intoxication demonstrates a switch of inhibition from one<br />
enzyme to another, embracing both choline specific and nonspecific<br />
esterases. It is noticeable that the most prolonged<br />
neurotoxic effect (20–30 % reduction of nTE activity after<br />
6 months’ period of the post-intoxication recovery) remained<br />
in the platelet-rich plasma (PRP).<br />
The next method demonstrating its efficacy for diagnostics<br />
of the low dose intoxication with OP was estimation<br />
of the level of generation of reactive oxygen species<br />
(ROS) during “respiratory burst” by professional phagocytes<br />
(macrophages). It is a widely known fact that macrophages<br />
Fig. 1. Generation of ROS by mice macrophages after 3 months’ chronic intoxication and 2 and 4 months after cessation of the intoxication<br />
with paraoxon and DFP at doses 10 –4 mg kg –1 (min) and 10 –2 mg kg –1 (max)
Chem. Listy, 102, s265–s1311 (2008) Environmental Chemistry & Technology<br />
are not only scavengers and alarm cells but they also have<br />
important functions to occupy key positions in every kind of<br />
immune response: production of antibodies, induction of cell<br />
immune reactions, development of immunologic memory<br />
and tolerability, thus correctly being named “dispatcher<br />
cells”. In our experiments, the functional activity of mouse<br />
macrophages was activated under intoxication with OP at<br />
10 –4 mg kg –1 (Fig. 1.). Activation of phagocytes affected by<br />
low doses of OP leads to production of ROS (hydrogen peroxide,<br />
superoxide anion, singlet oxygen and hydroxyl anions),<br />
which cause modification of tissue and serum proteins and<br />
lipids to further cause their obtaining of antigenic properties.<br />
Thus, activation of phagocytes is an autocatalytic process and<br />
can lead to formation of the vicious circle. On the other hand,<br />
absence of macrophages’ activation under exposure to large<br />
doses of OP indicates a suppression of antigen-presenting<br />
function of these cells; it is also known that chemical agents<br />
inhibiting this function in most cases cause suppression of<br />
immune response 16 .<br />
The animals’ immune status was further tested with low<br />
angle light scattering technique and studies of functional activity<br />
of blood platelets. Besides of a leading role in haemostasis,<br />
blood platelets play also an important role in immune<br />
reactions being a mediator between these two physiologic<br />
systems 17,18 . For the expense of binding with C1q receptor,<br />
the platelets can adhere to endothelium of capillaries, where<br />
local interaction of platelets with activating agents can take<br />
place 19,20 .<br />
Peroral chronic administration of DFP and paraoxon to<br />
laboratory animals for 3 months with the following examination<br />
at 2, 4 and 5 months after cessation of the intoxication<br />
demonstrated that in both cases a pronounced disturbance of<br />
the functional activity of platelets was observed, followed by<br />
a prolonged period of recovery of kinetic parameters of platelet<br />
aggregation (Fig. <strong>2.</strong>). In 3 months of chronic intoxication<br />
with DFP a marked increase of EC 50 was registered, similar<br />
to the case with Russian VX 21 . In contrast to DFP and RVX,<br />
paraoxon did not have a visible effect on sensitivity of platelets,<br />
but affected the maximal velocity of aggregation to the<br />
greater extent.<br />
Investigation of blood vessel endothelium revealed that<br />
s298<br />
Fig. 3. Relative excess over control (100 %) of the blood vessel<br />
contracting force in 3 months of intoxication with DFP and<br />
paraoxon at doses 10 –2 and 10 –4 mg kg –1 (carbachol was administered<br />
at the background of pre-constriction with norepinephrine)<br />
under chronic intoxication with OP an inhibition of endothelium-dependent<br />
relaxation occurs with both DFP and paraoxon,<br />
though the former was more potent at the same doses<br />
(Fig. 3.). Moreover, the level of pre-constriction with epinephrine<br />
under exposure to DFP was significantly different<br />
from that observed under exposure to paraoxon. So not only<br />
the level of relaxation following pre-constriction did change<br />
but also the background tonus of blood vessels and dynamics<br />
of the pre-constriction per se. In 2 months after cessation of<br />
the intoxication, inhibition of the endothelial function was<br />
nevertheless rather pronounced in both groups of rats that were<br />
exposed to DFP and paraoxon at 10 –2 mg kg –1 . In 5 months,<br />
there were significant changes only in rats exposed to DFP,<br />
being at the same level in both groups of intoxicated rats<br />
administered to DFP at doses 10 –4 and 10 –2 mg kg –1 .<br />
Conclusions<br />
Esterases of various geneses, localization and functional<br />
specialization should be molecular targets for OP.<br />
Fig. <strong>2.</strong> Relative changes of the medium effective concentration of activator (EC50) and maximal velocity of platelet aggregation<br />
(umax) after peroral administration of DFP (A) and paraoxon (b) at doses 1 × 10 –2 (max) and 1 × 10 –4 (min) mg kg –1 : after 3 months of<br />
intoxication, then at 2, 4 and 5 months of the “recovery period”; (# – Р < 0.1; * Р < 0.05)
Chem. Listy, 102, s265–s1311 (2008) Environmental Chemistry & Technology<br />
Changes in activity of esterases under prolonged exposure<br />
have a phase character with predominant inhibition of<br />
nTE as a delayed effect.<br />
Endothelium should be one of the main tissue targets in<br />
case of chronic low dose intoxication with OP.<br />
Blood platelets and phagocytes could be sensitive testing<br />
models to estimating effects of the low level exposure to OP.<br />
The pathogenesis of low dose chronic intoxication with<br />
OP is probably based upon the two complementary factors:<br />
development of immunoreactivity and tissue/circulatory<br />
hypoxia.<br />
REFEREnCES<br />
1. Прозоровский В. Б., Скопичев В. Г.:<br />
Экспериментальная и клиническая фармакология №<br />
3, 64 (2005с).<br />
<strong>2.</strong> Carvalho F. A., Graca L. M., Martins-Silva J., Saldanha<br />
C.:FEBS J. 272, 5584 (2005).<br />
3. Myers R. R., Powell H. C., Shapiro H. M., Costello M.<br />
L., and Lampert P. W.: Ann. neurol. 8, 392 (1980).<br />
4. Low P. A., Tuck R. R., Dyck P. J., Schmelzer J. D., Yao<br />
J. K.: Proc. natl. Acad. Sci. U S A 81, 6894 (1984).<br />
5. Ollson Y. Peripheral neuropathy P. 1984, 579.<br />
6. Ellman G. L., Courtney D. K., Andres V. Jr., Featherstone<br />
R. M.: Biochem. Pharmacol. 7, 88 (1961).<br />
7. Johnson M. K.: Biochem. J. 111, 487 (1969).<br />
8. Johnson M. K., Glynn P.: Toxicol. Lett. 82–83, 459<br />
(1995).<br />
s299<br />
9. Брик И. Л., Мандельштам Ю. Е, Немец В. И.: Химия<br />
в сельском хозяйстве. 15, 40 (1977).<br />
10. Досон Р., Элиот Д., Эддиот У., Джонс К. Справочник<br />
биохимика. – М.: Мир. 1991, 544.<br />
11. Гамалей И. А., Каулин А. Б., Кирпичникова К. М.:<br />
Цитология. 30, 1426 (1988).<br />
1<strong>2.</strong> Деркачев Э.Ф., Миндукшев И. В., Кривченко А. И.,<br />
Крашенинников А. А.: Патент RU 2108579 C1 6 G01<br />
n 33/49, Б.И. №10 (II). С.29 (1998).<br />
13. Mulvany M. J., Halpern W.: Circ. Res. 41, 19 (1977).<br />
14. Angus J. A., Broughton A., Mulvany M. J.: J. Physiol.<br />
(Lond.). 403, 495 (1988).<br />
15. Дранник Г. Н.: Курс лекций. 2007. http://immuno.<br />
health-ua.com/article/9.html<br />
16. Hamrah P., Dana M. R.: Chem. Immunol. Allergy. 92,<br />
70 (2007).<br />
17. Spycher M. O., nydegger U. E.: Infusionsther. Transfusionsmed.<br />
22, 36 (1995).<br />
18. Mindukshev I., Goncharov n., Shabanova E., Ermolaeva<br />
E., Mironova М.,Radilov А., Jenkins R., Krivchenko A.:<br />
Spectroscopy. 20, 57 (2006).<br />
19. Galdal K. S.: Haemostasis.14, 378 (1984).<br />
20. Козинец Г. И., Макарова В. А. Исследование системы<br />
крови в клинической практике. - М.1998, 480.<br />
21. Ермолаева Е. Е., Гончаров Н. В., Радилов А. С.,<br />
Глашкина Л. М., Кузнецов А. В., Миндукшев И. В.,<br />
Авдонин П. В., Добрылко И. А., Рембовский В. Р.:<br />
Токсикологический вестник. № <strong>2.</strong>, С. 3 (2008).
Chem. Listy, 102, s265–s1311 (2008) Environmental Chemistry & Technology<br />
L05 INFLuENCE OF CLIMATE CONDITIONS<br />
AND AIR CONTAMINATION ON VILLAGE<br />
INhAbITANTS hEALTh<br />
SLAVOMíRA KAŠIAROVá a and MELánIA<br />
FESZTEROVá b<br />
a Trenčín University of A. Dubček, Department of Public<br />
Management, Študentská 2, 911 50 Trenčín,<br />
b Constantine the Philosopher University, Faculty of Natural<br />
Sciences, Department of Chemistry, Tr. A. Hlinku 1, 949 74<br />
Nitra,<br />
kasiarovas@azet.sk<br />
Introduction<br />
The understanding of health as a main component of<br />
environment quality accrues from the Agenda 21 concerning<br />
the right of human beings to healthy and productive life 1 . Air,<br />
one of the components of environment, is polluted primarily<br />
by anthropogenic factors. Generally, the countryside is considered<br />
a healthy environment 2 . However, there are very few<br />
studies to prove this assumption since the air monitoring is<br />
a long-term and expensive method and therefore carried out<br />
only on a few monitoring points 3 .<br />
The aim of the study was to assess the state of climatic<br />
conditions and state of air quality in relation to the rate of<br />
diseases among the inhabitants of Královce-Krnišov village<br />
by a simple method, based on a comparison of potential conditions<br />
of contamination with real state of population health.<br />
The Southern Sitno micro region is important for tourism<br />
development and geographical conditions.<br />
Experiment and Methods<br />
Using the reconnaissance of the place was carried out<br />
terrain research. Information and sources of contaminants<br />
were observed together with the perception of problems<br />
related to air quality and environmental health. The obtained<br />
data were further processed by the statistical method of contingential<br />
tables, on the basis of which the individual mutual<br />
relations were evaluated, at the free scope degree of 1 and the<br />
level of importance 0.01 (χ quadrate). An assessment of the<br />
state and movement of air required the analysis of the relief<br />
as well as sunshine input as well as the regional state and<br />
movement of air for which GIS tools (geomedia) were used.<br />
Contamination was interpreted from the map of the secondary<br />
landscape structure and sources of contaminants. The<br />
relation between movement and quality of air and environmental<br />
health was worked out on the basis of the basic data<br />
parametric analysis with the subsequent table synthesis and<br />
mathematic statistics<br />
Results and Discussion<br />
On the territory of the Kráľovce–Krnišov village (the<br />
Štiavnické Mountains) cold, mild warm and warm mountain<br />
climate prevails. The average yearly temperature spans are<br />
from 5.5 °C to 8 °C. The average cloud amount is around<br />
62 %. The number of sunny days is around 48 a year and<br />
s300<br />
the number of cloudy days is around 125. The territory is<br />
characterized by regional northern, north-west air circulation<br />
with a low year and day amplitudes prevailing all the year<br />
round. There are frequent temperature inversions during the<br />
radiation weather with a depression circulation. There is also<br />
an intensive effect of a “temperature island” with a distinctive<br />
increase of day amplitudes supported by the effect of winds<br />
of low intensity. negative influences on environmental health<br />
are diseases caused by contamination from regional emissions<br />
resulting from the type of climate and skin diseases as a<br />
consequence of contamination of anthropogenic and natural<br />
factors – frequent and concentrated air circulation especially<br />
in winter time. Frequent skin diseases and flu are typical for<br />
inversion type of weather. Respiratory diseases and diseases<br />
related to increased stress conditions due to the amplitudes<br />
changes, such as blood pressure disorders, stress and cardiovascular<br />
diseases, were confirmed. The increase of the all<br />
above diseases was statistically confirmed.<br />
The territory of the Southern Sitno micro region is exposed<br />
to the influence of industry confirmed by the considerable<br />
damage of the environment by pollutants distributed in conditions<br />
of mesoclimate. The contamination of the regional<br />
type concerns mainly average annual nO2 and SO2 concentrations.<br />
The contamination in the settlement is therefore of<br />
integrated character from the following sources:<br />
• transport related emissions – the contamination intensity<br />
is lower in winter and spring season, no statistical<br />
importance with any disease was shown;<br />
• heating related emissions – at inversion type of weather<br />
there is an increased intensity of contamination especially<br />
during the winter season (most inhabitants use<br />
wood for heating, some of them waste and electricity),<br />
an influence on the occurrence of blood pressure disorders<br />
was confirmed;<br />
• radiation (high volume activity of radon from the geological<br />
background, radon is considered the carcinogenic<br />
element causing lung cancer and respiratory diseases);<br />
• emissions from rural zone (agriculture – a smell from<br />
the animal husbandry, excrements of animals, liquid<br />
manure).<br />
A demographic structure of Kráľovce – Krnišov village<br />
population represents a regressive type, lift the biggest age<br />
groups in the village between 20–40 and 40–60. Based on<br />
the analysis of microclimate, mesoclimate and macroclimate,<br />
contamination and illness rate considering the statistic importance,<br />
the population group and factors originating from the<br />
environment. The occurrence of health problems (Statistically<br />
important relations illustrated in Tables I, II, III, IV)<br />
could be specified as follow:<br />
•<br />
an increased occurrence of the blood pressure disorders<br />
in the local population: people using electricity for heating,<br />
people using electric appliances at home, women<br />
and children, age group over 60, inhabitants suffering<br />
from obesity, cardiovascular diseases, occupational<br />
diseases and people living mainly on the slopes exposed
Chem. Listy, 102, s265–s1311 (2008) Environmental Chemistry & Technology<br />
Table I<br />
The relation of the diseases occurrence to the sex and age of Kráľovce – Krnišov village population (χ quadrant)<br />
Age/Sex/Affections Man/age [years] Woman/age [years] Child/age [years]<br />
20–40 41–60 Over 60 20–40 41–60 Over 60 0–0.5 0.5–12 13–19<br />
Blood pressure disorders 0.76 0.08 0.76 6.17 d 0.11 10.05 c 0 0 0<br />
Stress 0.08 0.08 0.76 4.16 e 0.03 0.50 0.05 0.05 20 c<br />
Influenza 0.04 0.04 0.33 1.39 0.06 1.08 0.45 0.16 0.01<br />
Eczema 0.04 0.04 0.33 0.67 0.33 <strong>2.</strong>49 0.19 0.06 0.01<br />
Bronchitis 0 1.37 0.52 0.01 <strong>2.</strong>27 3.40 0.12 0.09 0.22<br />
Affection from work 0.08 0.08 0.76 1.22 3.26 0.69 0 0 0<br />
Cardiovascular disease 0.83 1.37 0.15 <strong>2.</strong>67 0.20 1.76 0 0 0<br />
Asthma 0.83 1.37 0.15 0 0 0 0 0 0<br />
Allergies 0 0 0 0 0 0 0.05 0.70 0.57<br />
c Relation is at statistically high level of significance (degrees of free1), χ quadrant = 6.63 <<br />
d Relation is at statistically medium level of significance (degrees of free1), χ quadrant = 5.02–6.63<br />
e Relation is at statistically low level of significance (degrees of free1), χ quadrant = 3.84–5.02<br />
Table II<br />
The relation of the diseases occurrence in Kráľovce – Krnišov village (χ quadrant)<br />
Affections<br />
Blood<br />
pressure<br />
disorders<br />
Stress<br />
Infl uenza<br />
s301<br />
eczema<br />
Bronchitis<br />
Affection<br />
from work<br />
Cardiovascular<br />
disease<br />
Blood pressure disorders – 0.09 1.81 1.66 1.33 8.84 d 19.44 d 0.28 0.28<br />
Stress 0.03 – 0.07 0.99 1.65 0.33 0.00 3.99 e 0.28<br />
Influenza 1.81 0.07 – 0.00 <strong>2.</strong>46 0.34 1.14 0.22 0.21<br />
Eczema 1.66 0.99 0.00 – 1.56 8.75 d <strong>2.</strong>67 0.18 0.18<br />
Bronchitis 1.33 1.64 <strong>2.</strong>46 1.57 – 1.09 0.47 8.36 d 8.36 d<br />
Affection from work 8.84 d 0.33 0.34 8.75 d 1.09 – 13.45 d 0.12 0.12<br />
Cardiovascular disease 19.44 d 0.00 1.14 <strong>2.</strong>68 0.47 13.45 d – 0.07 0.07<br />
Asthma 0.28 3.99 e 0.22 0.18 8.36 d 0.12 0.07 – 0.01<br />
Allergies 0.28 0.28 0.22 0.18 8.36 d 0.12 0.07 0.01 –<br />
Table III<br />
The relation of the diseases occurrence to type of dwelling of Kráľovce – Krnišov village pollution (χ quadrant)<br />
Physical,<br />
in<br />
chemical,<br />
biological<br />
hazards/<br />
affections Chemicals<br />
work<br />
Manures<br />
Dry toilet<br />
Moisture of<br />
house<br />
electrical<br />
applicances<br />
Blood pressure<br />
0.09 1.74 4.61e 0.30 10.78c 1<strong>2.</strong>86c 5.07d 4.08e disorders<br />
0.09 <strong>2.</strong>25<br />
Stress 4.06e 3.13 5.78d 4.80e 1.36 1.84 <strong>2.</strong>30 0 0.39 0.27<br />
Influenza 0.00 6.09d 4.80e 6.09d 1.14 3.68 0.03 7.06c 0.64 1.54<br />
Eczema 0.04 0.09 0.04 <strong>2.</strong>12 <strong>2.</strong>67 0.58 0.47 0.09 0.11 0.39<br />
Bronchitis 1.74 4.30e 1.05 <strong>2.</strong>32 0.65 0.24 0 0.89 0.73 0.90<br />
Affection from work 7.53c 4.30e 0.05 0.62 13.45c 11.11c 0.51 0.33 0.04 0.99<br />
Cardiovascular disease 0.06 0.37 0.09 0.01 1.49 5.90d 0.03 0.94 0.94 0.08<br />
Asthma 0.20 0.48 1.59 1.66 0.07 0.24 1.76 0.69 5.81d 1.19<br />
Allergies 0.19 0.48 0.51 0.62 0.07 0.24 0.58 0.69 0. 18 1.19<br />
electrical<br />
Asthma<br />
Allergies<br />
Heating Mateiral of house<br />
Waste<br />
Coal<br />
Stone<br />
Brick
Chem. Listy, 102, s265–s1311 (2008) Environmental Chemistry & Technology<br />
Table IV<br />
The relation of the diseases occurrence to the nutrition and physical work of Kráľovce – Krnišov village population<br />
(χ quadrant)<br />
•<br />
•<br />
•<br />
•<br />
Various/Affections Finish food Finish food Medicine (ache) Physicalwork Sucklening<br />
Smoke<br />
Blood pressure disorders 4.47 e 1.17 5.57 d 0.67 3.16<br />
Stress 0.00 16.63 c 0.16 <strong>2.</strong>28 0.99<br />
Influenza 1.08 0.90 0.00 0.34 6.60 d<br />
Eczema 0.00 0.74 4.54 e 0.73 0.32<br />
Bronchitis <strong>2.</strong>40 0.51 <strong>2.</strong>45 1.09 0.56<br />
Affection from work 0.96 0.51 <strong>2.</strong>45 0.03 0.63<br />
Cardiovascular disease 0.13 0.30 3.26 0.47 0.72<br />
Asthma <strong>2.</strong>74 0.06 0.62 0.12 0.62<br />
Allergies 0.37 0.06 1.66 0.12 1.66<br />
to the south and on the territory of the “thermal island“<br />
effect;<br />
an increased occurrence of frequent flu in the local population:<br />
people living on the slopes exposed, to the age<br />
group of children 0–5 months, store-bought meat and<br />
house produced eggs consumers;<br />
an increased occurrence of skin diseases in the local<br />
population: the age group of children 0–5 months, adults<br />
of the age group 20–40, people living on the places with<br />
frequent valley circulation, and people living on the territory<br />
with the top climate as a result of the regional air<br />
pollution; - an increased occurrence of respiratory diseases<br />
in thelocal population: people living on the slopes<br />
exposed to the north, on the places with valley climate<br />
with important changes of amplitudes and places exposed<br />
to the transport emissions, especially with regard to<br />
people suffering from allergies, asthma, frequent injuries,<br />
radon radiation from the geological background;<br />
an increased occurrence of cardiovascular diseases in the<br />
local population: people living on the slopes exposed to<br />
the south, on the territory of “the thermal island “effect,<br />
on the territory with the strong changes of amplitudes in<br />
the valley climate, people suffering from blood pressure<br />
disorders and occupational diseases;<br />
an increased occurrence of occupational diseases in the<br />
local population: people who are in contact with toxic<br />
stuff at their workplace and people suffering from blood<br />
pressure disorders, skin diseases and cardiovascular<br />
diseases.<br />
s302<br />
Conclusions<br />
To determine the relation between climatic conditions<br />
and environmental health of the inhabitants of the Královce<br />
- Krnišov model village in the Štiavnické Mountains, a new<br />
method based on confrontation of potential conditions of<br />
selected factors of an environment – climate and real state of<br />
the environmental health – was used. Statistical results have<br />
shown the relation, which had been theoretically assumed.<br />
After the additional implementation and verification,<br />
the model can be considered as a good, quick, cheap and<br />
informative method for the assessment of the environmental<br />
health in rural settlements.<br />
This work has been supported by grant VEGA<br />
1/3276/06<br />
REFEREnCES<br />
1. Hilbert H.: Action Plan for the environment and health<br />
of population of the Slovak Republic II. Ministry of<br />
Health Care SR Bratislava 2000.<br />
<strong>2.</strong> Kukkonen E., Sklret E., Sundell J., Valbjrn O.: Indoor<br />
Climate Problems -Investigation and Remedial Measures.nT<br />
Techn. Report 204, nordtest, Espoo, Finland<br />
1993.<br />
3. Samešová D., Ladomerský J.: Evaluation environmentalaspects.<br />
Mech. Acta 2-B,150 (2005).
Chem. Listy, 102, s265–s1311 (2008) Environmental Chemistry & Technology<br />
L06 INTEGRATION METALLOMICS,<br />
PROTEOMICS AND TRANSCRIPTOMICS<br />
IN <strong>ENVIRONMENTAL</strong> ISSuES<br />
JOSE LUIS GóMEZ-ARIZA, MACAREnA GOnZALEZ-<br />
FERnAnDEZ, TAMARA GARCIA-BARRERA, JUAn<br />
LOPEZ-BAREA and CARMEn PUEYO<br />
Universidad de Huelva, Departamento de Química y Ciencia<br />
de los Materiales; Facultad de Ciencias Experimentales;<br />
Campus de El Carmen; 21007-Huelva (Spain),<br />
ariza@uhu.es<br />
Introduction<br />
Metallomics is one of most recent -omics whose importance<br />
is associated to the presence of metals or any other<br />
heteroelement (e.g. elements different of C, H, n, or O) in<br />
biomolecules. These metal-linked molecules play important<br />
roles in the cells and by extension in the biological behaviour<br />
of the organisms.<br />
Some of these elements are essential for life, marked in<br />
green in the Fig. 1, other are non-essential or toxic, marked<br />
in red. This is the case of transition elements, such as Fe in<br />
Cytochrome P450, a superfamily of enzymes that regulate the<br />
metabolism of pollutants, drugs and steroids. As well as Fe in<br />
transferrin, that transport and deliver this element. Cobalt is<br />
the key-element of B12 vitamin and ni in urease (the enzyme<br />
for urea hydrolysis into carbon hydroxide and ammonia).<br />
Other transition elements such as Cu and Zn are responsible<br />
for the activity of the superoxide dismutase, which is involved<br />
in the elimination of superoxide radical.<br />
Fig. 1. Essential (green) and non-essential (red) elements<br />
Together with elements linked to these proteinous<br />
molecules other non-proteinous molecules of high molecular<br />
weigh, such as DnA is characterized by the presence of phosphorus,<br />
or boron in polysaccharides from vegetal cell walls.<br />
Therefore, the chemistry of a cell and by extension of<br />
living tissues and biological fluids can be characterized, not<br />
only by its typical genome and proteome, but also by the<br />
metallome, the distribution of metals and metalloids among<br />
the different biomolecules. The metallome describes, per<br />
analogy with genome and proteome, the entirety of metal and<br />
metalloid species within a cell or tissue type. 1–4 The scope of<br />
metallomics is very broad, focusing on developments of new<br />
analytical techniques and instruments, as well as innovative<br />
applications focused on environmental, food or health issues.<br />
s303<br />
I n s t r u m e n t a l A p p r o a c h e s i n M e t a l -<br />
l o m i c s<br />
Three-dimensional systems should be at least used<br />
in Metallomics: (i) a separation component by gel electrophoresis<br />
or HPLC; (ii) an very sensitive elemental monitoring<br />
system, for metal or non-metal quantification, mainly<br />
ICP-MS; and (iii) a component for the structural characterization<br />
of the molecules, generally based on mass spectrometry.<br />
Therefore, the metal or heteroelement act as tag of the<br />
experiment, heteroatom-tagged proteomics 5 .<br />
I n t e r e s t o f – o m i c s I n t e g r a t i o n<br />
The benefit that Metallomics produces due to the simplification<br />
introduced by the metal tag can be insufficient when<br />
an overall appraisal of complex real problems, such as those<br />
related to environmental, food or health issues is considered.<br />
If we consider a contamination problem, genetic responses<br />
to stress conditions are often regulated at transcriptional<br />
level that can be checked by using the microarray technology<br />
to generate genome-wide transcriptional profiles. The changes<br />
detected by microarrays can be confirmed by RT-PCR<br />
(reverse transcription–PCR). In addition, modifications in<br />
the proteome can also used as markers of pollution as consequence<br />
of protein expression alteration triggered by contamination.<br />
However, these changes in proteins profiles can<br />
not necessarily reflect alterations in gene expression at the<br />
transcript level, but changes from post –transductional modifications.<br />
Therefore, the three -omics are complementary and integration<br />
among them is advisable. However, the difficulties in<br />
integrating data from different -omics technologies in nonlaboratory<br />
strains should not be under-estimated, and the use<br />
of non-inbred strains/species induce a variety of confusing<br />
factors can complicate interpretation. To avoid these problems<br />
in environmental studies we propose the use in parallel<br />
of sequenced model species and proved bioindicators with<br />
gentic sequence homologous to the model. In the present<br />
study we have selected two mouse species: (i) a model organism<br />
used in many studies in the laboratory, whose genetic<br />
sequence can be easily obtaine from database, Mus musculus,<br />
and (ii) an aboriginal species checked as useful sentinel organism<br />
in monitoring programs, Mus spretus 6 .<br />
In the present work a combined application of transcriptomics,<br />
proteomics and metallomics approaches has been<br />
performed in Doñana natural Park, one of the most important<br />
European biological reserves, in which millions of migrating<br />
birds land each year in their way to/from Africa. The couple<br />
M. musculus/M. Spretus was used for this integration.<br />
Experimental<br />
S a m p l i n g A r e a s<br />
Mice were collected in February 2004 at six sites from<br />
Doñana surroundings and the Domingo Rubio Stream, both<br />
at Huelva province (Fig. <strong>2.</strong>). Animals were captured with live<br />
traps and taken alive to the nearest laboratory (Huelva University<br />
or Doñana Biological Reserve-CSIC). Their sex and
Chem. Listy, 102, s265–s1311 (2008) Environmental Chemistry & Technology<br />
weight were determined and those of 11–12 g were killed by<br />
cervical dislocation and dissected. Individual livers and kidneys<br />
were frozen in liquid nitrogen and stored at –80 °C.<br />
T r a n s c r i p t Q u a n t i f i c a t i o n s<br />
Primer design, RnA preparation, reverse transcription,<br />
and absolute quantification by real-time PCR. Briefly, PCR<br />
reactions were performed in quadruplicate. no primer dimers<br />
were detected. Primers showed optimal (~ 100%) PCR efficiencies<br />
in the range of 20 to 2 × 10 5 pg of total RnA input<br />
with high linearity (r > 0.99). An absolute calibration curve<br />
was constructed with an external standard in the range<br />
of 10 2 to 10 9 RnA molecules. The number of mRnA<br />
molecules was calculated from the linear regression of the<br />
calibration curve (y = –3.326x + 39.693; r = 0.998).<br />
Microarray-based transcript quantification was performed<br />
by using the “Whole Mouse Genome Oligo Microarray<br />
Kit” (Agilent), which includes 60-mer oligonucleotide<br />
probes representing all known genes and transcripts<br />
(~ 41,000) of the model M. musculus species. Approximately,<br />
20 μg of total RnA were converted to fluorescently<br />
labelled cDnA (with Cy3-dCTP or Cy5-dCTP) following the<br />
“Agilent Fluorescent Direct Label Kit” instructions. Hybridization<br />
was carried out in Agilent’s SureHyb Hybridization<br />
Chambers at 65 °C for 17 hours using the Agilent’s “Gene<br />
Expression Hybridization Kit”. The hybridized microarrays<br />
were then disassembled and washed at room temperature,<br />
as described in the Agilent Microarray Based Gene<br />
Expression Analysis protocol. To eliminate dye-bias, dye<br />
swap replicates were performed. Microarrays were scanned<br />
at 532 and 635 nm using a confocal scanner (Axon 4000B).<br />
The ratio of Cy5 to Cy3 was adjusted to 1 varying PMT gain<br />
as a global normalization of each array. The images were analysed<br />
using GenePix Pro v4.1 software (Axon) and data were<br />
subsequently input to Genespring v7.3 software (Agilent) for<br />
further analysis.<br />
2 - D E A n a l y s i s a n d P r o t e i n<br />
I d e n t i f i c a t i o n<br />
Around 50 mg of livers from four male mice/site were<br />
pooled and homogenized in 20 mM Tris-HCl, pH 7.6, with<br />
0.5 M sucrose, 0.15 M KCl, 20 mM DTT (Dithiothreitol),<br />
1 mM PMSF (phenylmethanesulfonyl fluoride), and protease<br />
inhibitors, at a ratio of 3 ml g –1 . Cell debris was cleared by<br />
centrifugation, and the supernatant treated with benzonase<br />
and ultracentrifuged. Protein extract (115 µg) was incubated<br />
30 min in 450 µl rehydration buffer (7M urea, 2% CHAPS,<br />
20 mM DTT, 0.5% Pharmalyte 3–10, bromophenol blue traces),<br />
spun and loaded on 24 cm (pH 4–7) Amersham Immobiline<br />
Dry-Strips ® . After 6 h passive and 6 h active (50 V) rehydration<br />
in a BioRad Protean IEF cell (20 °C, 50 mA strip –1 ),<br />
the voltage was raised until obtain ootimum separation. After<br />
freezing at –80 °C, the strips were soaked 20 min in equilibration<br />
mix (50 mM Tris-HCl, pH 8.8, 6M urea, 30% glycerol,<br />
2% SDS, bromophenol blue traces) with 65 mM DTT,<br />
drained and again soaked 20 min in this mix with 25 mM<br />
s304<br />
iodoacetamide. SDS-PAGE was done in 1<strong>2.</strong>5% gels using<br />
the BioRad Protean ® Plus Dodeca cell (20 °C) at <strong>2.</strong>5 W gel –1 ,<br />
10 min, and 10 W gel –1 until separation was finished. Gels<br />
were silver-stained following a standard protocol compatible<br />
with MS analysis. Analytical quality chemicals and Milli-Q<br />
water (Millipore ® ) were used throughout.<br />
Gel images of three replicates/sample were obtained<br />
with a BioRad GS-800 densitometer. Spot volumes were<br />
quantitated using the PDQuest software (v7.1, BioRad). Initially,<br />
only spots exhibiting in “Santa Olalla” lagoon (SOL)<br />
an over/underexpression ratio of at least threefold with<br />
respect to any other sampling site were considered. One-way<br />
analysis of variance followed by the Student–newman–Keuls<br />
post-test was then used for a definitive selection of the spots<br />
showing altered expression patterns between the different<br />
animal groups. Differentially expressed spots were manually<br />
excised, reduced (10 mM DTT), alkylated (55 mM iodoacetamide),<br />
digested overnight at 30 °C with trypsin (Promega)<br />
and the peptides extracted with ACn/TFA (Acetonitrile/<br />
Trifluoroacetic acid). Aliquots of 0.5 µl were analyzed by<br />
MALDI-TOF-PMF (Matrix Assisted Laser Desorption- Time<br />
of Flight-Peptide Mass Fingerprint) in a Voyager DE-PRO<br />
instrument (Applied Biosystems) in reflectron mode. PMF<br />
data were contrasted against mammalian sequences included<br />
at Swiss-Prot (EBI, Heidelberg, Germany) and nonredundant<br />
nCBI (Bethesda, MD, USA) databases using ProteinProspector<br />
(California University, San Francisco, CA, USA) and<br />
MASCOT (Matrix Science, London, UK) softwares.<br />
A n a l y s i s o f E x t r a c t s b y S E C<br />
C o u p l e d w i t h I C P - M S<br />
Extracts were twofold diluted with the mobile phase and<br />
centrifuged at (11,000 rpm) 15.5572 × 1g for 1 h at 4 °C, and<br />
latterly filtered through Iso-Disc poly(vinylidene difluoride)<br />
filters (25-mm diameter, 0.2-μm pore size) to avoid column<br />
overloading or clogging. Elemental fractionation profiles<br />
were obtained by size exclusion chromatography (SEC)<br />
coupled to ICP-MS as detector. Two columns were used in<br />
the experiment: Hiload 26/60 Superdex 30 Prep column for a<br />
separation range below 10 kDa (low molecular mass, LMM)<br />
and a Superdex 75 Prep column for a separation range of<br />
3–70 kDa (high molecular mass, HMM), both from Amersham<br />
Biosciences (Uppsala, Sweden). These columns were<br />
calibrated using standards of known molecular mass, such as<br />
bovine serum albumin (67 kDa), metallothionein I (7 kDa),<br />
gastrin rat I (2,126 Da) and Gly6 (360 Da) for LMW column,<br />
and bovine serum albumin (67 kDa), chymotrypsinogen A<br />
(25 kDa), ribonuclease A (13.7 kDa) and metallothionein I<br />
(7 kDa) for HMW column. The void retention time was estimated<br />
with bovine serum albumin (67 kDa) and blue dextran<br />
(2,000 kDa), for LMW and HMW, respectively.<br />
Results<br />
The three -omics approaches (transcriptomics, proteomics<br />
and metallomics) have been applied to Doñana<br />
natural Park and the surrounding areas. Doñana is an impor-
Chem. Listy, 102, s265–s1311 (2008) Environmental Chemistry & Technology<br />
Fig. <strong>2.</strong> Sampling area<br />
tant ecological area, which covers 543 km 2 with a great variety<br />
of ecosystems and shelters wildlife including thousands of<br />
European and African migratory birds, fallow deer, Spanish<br />
red deer, wild boar, European badger, Egyptian mongoose,<br />
and endangered species such as the Spanish Imperial Eagle<br />
and Iberian Lynx. This non-contaminated area was used as<br />
Fig. 3. Efficiency curves in genetic correlation between M.<br />
musculus and M. spretus for Gsta3 transcript. ● specific primers,<br />
○ non-specific primers. X-axis, log total mNRA (pg); Y-axis,<br />
threshold cycle (Ct)<br />
s305<br />
negative reference (SOL) in comparison to the neighbouring<br />
“Domingo Rubio” stream (DR1 to DR6) and the positive<br />
references (PS and ARZ). These areas are contaminated by<br />
mining, agricultural and industrial effluents (DR1 to DR6 and<br />
PS) and by pesticides and fertilizers (ARZ) (Fig. <strong>2.</strong>).<br />
The mouse Mus spretus is an aboriginal species that<br />
has been commonly used for environmental assessment<br />
of this area (x) by means of classical biomarkers, but new<br />
tools based on recent –omics, such as transcriptomimcs and<br />
proteomics constitute a promising alternative. However, the<br />
molecular biology methodologies present problems by the<br />
fact of poor inclusion of typical bioindicators in gene/protein<br />
sequences database. For this reason we use species close<br />
to model organisms that are well covered in public databases.<br />
This is the case of M. musculus, which is studied comparatelly<br />
with M. spretus. These comparisons are only possible<br />
if genetic homology between both species is proved.<br />
G e n e t i c H o m o l o g y B e t w e e n M .<br />
m u s c u l u s a n d M . s p r e t u s<br />
A crucial start-point in quantitative RT-PCR is primer<br />
design. For absolute transcript quantification it is necessarily<br />
to design primers that amplify the targets and the calibrator<br />
with optimal (100 %) PCR efficiencies. This fact requires<br />
a great genetic homology between target and calibrant<br />
species. Primers for RT-PCR quantification of M. spretus<br />
Cyp and Gst mRnAs were designed based on known gene<br />
sequences from M. musculus. Remarkably, these primers,<br />
when amplified in M. spretus, gave single products exhibiting<br />
in most cases 100% nucleotide sequence identity. Therefore,<br />
most designed primers were exactly complementary to the<br />
desired M. spretus templates and amplified them with 100%<br />
efficiency. In few cases, however, primers should be redesigned<br />
based on nucleotide sequences of PCR fragments from<br />
M. spretus. Fig. 3 ref. 8 .<br />
Therefore, genetic homology between model and bioindicator<br />
species was clearly proved.<br />
Fig. 4. Sampling area-associated differences in M. spretus hepatic<br />
mRNA levels. y-axis, nRNA molecules/pg total RNA. white<br />
bar, SOL non-polluted area; red bar, polluted area
Chem. Listy, 102, s265–s1311 (2008) Environmental Chemistry & Technology<br />
M u s S p r e t u s T r a n s c r i p t E x p r e s s i o n<br />
S i g n a t u r e s i n C o n t a m i n a e d A r e a s<br />
We have used the absolute measurement of mRnA<br />
levels from selected key genes (CYPs and GSTs) to biomonitoring<br />
the exposure and biological effects of pollutants on<br />
free-living nonmodel M. spretus. For this purpose the mRnA<br />
molecules of genes coding for different cytochrome P450 and<br />
glutathione transferases were quantified in mice dwelling at<br />
both the non-contaminated point SOL and contaminated area<br />
PS.<br />
As an example, Fig. 4. shows the concomitant up-regulation<br />
of some Cyp transcripts in M. spretus PS population, as<br />
compared to that at SOL in the Doñana Biological Reserve.<br />
The possibilities of transcription quantification to assess the<br />
level of contamination are clearly demonstrated. In addition,<br />
the absolute Cyp transcript expression signature is depending<br />
on the type of contaminant (Fig. 5.), which can use to identify<br />
the nature of contamination under consideration.<br />
Fig. 5. Transcripts expression signature related to the type of<br />
contaminants. y-axis, nRNA molecules/pg total RNA<br />
Fig. 6. Protein expression of liver cytosolic extract from Mus<br />
spretus<br />
P r o t e o m i c s S t u d y o f M u s s p r e t u s<br />
The homology between M. musculus and M. spretus,<br />
at DnA sequence level allows the proteomics evaluation of<br />
s306<br />
protein expression differences caused by contamination episodes<br />
in Mus spretus, but usinf the gnetinc sequence of Mus<br />
musculus in protein identificacion by MALDI-TOF-PMF. A<br />
comparative study at proteomic level of cytosolic fractions<br />
of liver from M. spretus sampled in Doñana and Domingo<br />
Rubio stream were performed analysing the extracts by 2-DE<br />
and searching the protein expression differences. Over 2500<br />
spots were resolved in the pH range 4–7 and 14–70 kDa M r .<br />
Image analysis of the gels yielded 36 spots with significantly<br />
altered expression. Of them, 16 proteins were identified by<br />
MALDI-TOF-PMF and heterologous search against Mus<br />
musculus databases. When this approach is applied to contaminated<br />
and non-contaminated points a clear diference in<br />
spots intensities corresponding to differentially expressed<br />
protreins was observed, which can be used for the environmental<br />
pollution assessment of proteomics.<br />
M e t a l l o m i c s A p p r o x i m a t i o n t o t h e<br />
M o u s e M u s m u s c u l u s<br />
In this study the presence of unknown metallobiomolecules<br />
in M. musculus was studied for the first time. Firstable,<br />
a general evaluation of the presence of total concentration of<br />
metal in different organs of the mouse (lung, liver, spleen,<br />
kidney, brain, testicle, heart and muscle) was performed.The<br />
experiments were carried out on inbred M. musculus specimens.<br />
An you can see the elements considered. Fe is the element<br />
most abundant in the different organs with an averaged<br />
concentration of 7,500 µg dm –3 in thecytosolic extracts. Other<br />
elements are Zn (about 2,300 µg dm –3 ), Cu (550 µg dm –3 ),<br />
ni (165 µg dm –3 ), Se (145 µg dm –3 ), and a toxic element such<br />
as Pb (26 µg dm –3 ). These elements are differentially distributed<br />
in the organs, for example, Cu and Zn are mainly present<br />
in the liver, but Pb in the muscle. An similar comments<br />
can be addressed to the other elements.<br />
Metal-biomolecules profiles was obtained with ICP-MS<br />
as metal tracer, using couplings with size exclusion chroma-<br />
Fig. 7. SEC-ICP-MS metal profiles in Mus musculus corresponding<br />
to Cu and Pb. hMM size exclusion column for 3,000 to<br />
70,000 Da; LMM, size exclusion column for 300 to 10,000 Da
Chem. Listy, 102, s265–s1311 (2008) Environmental Chemistry & Technology<br />
tography to characterize metalbiomolecules molecular mass<br />
profile, and subsequently in series, on the fractions isolated in<br />
the previous separation, reverse phase chromatography for a<br />
further purification of the extracts and biomolecule isolation.<br />
Two SEC columns were used to discriminate molecules with<br />
molecular mass range under 10,000 (360 to 10,000 Da) and<br />
between 3,000 and 70,000 Da. The results for Cu and Pb, this<br />
latter as example of toxic are shown as examples in Fig. 7.<br />
The results obtained for Cu and Pb can be summarized<br />
in the following items:<br />
• All extracts showed peaks in the range of 300 and<br />
2,000 Da whatever metal or organ considered.<br />
• A peak was observed in the void volume of the LMM<br />
column (Mr < 10 kDa) for all profiles, although they<br />
showed low intensities except for Cu that was studied<br />
in more detail.<br />
• A Cu-containing fraction (7–10 kDa) was found in the<br />
brain which was absent in all other M. musculus organs.<br />
Other elements, e.g. Pb, do not have peaks equivalent in<br />
that range of masses. Therefore, further studies involving<br />
subsequent purification by another chromatography<br />
technique and isolation of this Cu-bound biomolecule<br />
for MS identification is being considered.<br />
• The Cu and Pb fractions resolved in the HMM column<br />
were mainly associated with molecules with molecular<br />
masses from 25 to 67 kDa, which are present in all the<br />
organs for Cu and only in liver for Pb.<br />
• A chromatographic peak associated to Cu was detected<br />
in the molecular mass range 67 to 70 kDa for the lung<br />
extract, and in liver and kidneys for Pb.<br />
• A Cu-peak can be observed in liver extract at the void<br />
volume of the HMM column.<br />
In Fig. 8. is shown the chromatograms correponding to<br />
the cytosolic extracts. The main fraction is associated to liver<br />
and is eluted in the void volume of HMM column. Additional<br />
experiments with reverse phase chromatography of this<br />
isolated fraction and ICP-MS detection reveal that tow peaks<br />
can result from additional purification of this fraction.<br />
Fig. 8. Chromatographic profiles with HMM column (3,000 to<br />
70,000 Da)<br />
s307<br />
I n t e g r a t i o n o f M e t a l l o m i c s w i t h<br />
P r o t e o m i c s a n d T r a n s c r i p t o m i c s<br />
The complementary character of the different approaches<br />
presented in relation to Mus musculus/Mus spretus and<br />
the environmental assessment considered prevously claims<br />
for the integration of these three -omics.<br />
The availability of the complete sequence of an increasing<br />
number of genomes allows the developments in proteomics,<br />
which can be achieved by electrospray and MALDI-<br />
TOF mass spectrometry. However, many proteins can be<br />
sensitively detected by ICP-MS due to the presence of ICPionizable<br />
elements (heteroelements). Therefore the three -<br />
omics are complementary, and in this context the combination<br />
of validated metallomic data with the transcriptome and<br />
proteome knowledge of a cell is one of the largest challenges<br />
for future research in this topic.<br />
A crucial question is that better established -omics (transcriptomics<br />
and proteomics) support their studies on model<br />
organisms whose gene/protein sequence are well collected<br />
in databases. On the contrary, bioindicators currently used in<br />
environmental studies are non-model organisms absent from<br />
public databases. The design of primers that allows the confirmation<br />
of homology in gene expression at the transcript<br />
level between bioindicators used in environmental studies<br />
and sequenced model specimens is a very good tool to perform<br />
environmental metallomics and proteomics.<br />
This new triple-omics approach (MEPROTRAnS-triple-OMICS)<br />
is being applied to the M. musculus-M. spretus<br />
couple in Doñana natural Park for environmental assessment,<br />
following the steps listed below:<br />
•<br />
•<br />
•<br />
•<br />
•<br />
Extraction of RnA for transcriptomic and of proteins for<br />
proteomic and metallomic analyses.<br />
Quantification of changes at the transcriptome level by<br />
means of commercially available microarrays and further<br />
validation of selected microarray results by absolute<br />
quantification using real-time RT-PCR.<br />
Quantification of changes at the proteome level<br />
by 2-DE analysis and subsequent protein identification<br />
by MALDI-TOF-PMF.<br />
Integration of transcriptomic and proteomic results to<br />
distinguish transcriptional from post-transcriptional<br />
changes.<br />
Isolation of heteroatom-tagged molecules by size exclusion<br />
chromatography fractionation of tissue extracts<br />
guided by ICP-MS (First Dimension) and further purification<br />
by reverse phase and/or ion exchange chromatography<br />
with ICP-MS on the previous selected fractions<br />
(Second Dimension). This metallomic scheme will be<br />
assisted by 2-DE analysis to reveal the complexity of<br />
the successive sub-proteomes. The purification steps<br />
involving metallomics and proteomics will be repeated<br />
until the final isolation of target metal-biomolecules for<br />
identification by tandem mass spectrometry.
Chem. Listy, 102, s265–s1311 (2008) Environmental Chemistry & Technology<br />
•<br />
•<br />
Validation of metallomic results by Western hybridization<br />
and/or enzymatic assays, and by absolute quantification<br />
of transcripts coding the identified metalloproteins.<br />
Integrative multidisplinary decision on the optimal<br />
assay (high sensitivity, low cost and easy to perform)<br />
to be recommend for routine assessment of differentially<br />
expressed metalloproteins as novel biomarker in<br />
ecotoxicological studies.<br />
Conclusions<br />
The study of complex systems related with living organisms,<br />
such as the environment or health, in which many<br />
variables are involved, requires multidisciplinary tools for<br />
a comprehensive assessment of these issues.<br />
Several –omics, such as transcriptomics, proteomics and<br />
metallomics, offer a valuable alternative in environmental<br />
studies since they provide massive information about biomolecules<br />
in cells and organisms that help to overcome these<br />
problems. An overall evaluation of changes that contaminants<br />
induce in cells is only possible by integration of -omics:<br />
• Transcripts induced by pollutants (transcriptomics)<br />
encode proteins with altered expression profiles, which<br />
undergo post-traductional modifications (proteomics).<br />
• Many proteins related to enviromental issues are bound<br />
to metals (i.e. CYPs, SODs, GPXs, metallothioneins)<br />
that make advisable the use of metal-tagged techniques<br />
(metallomics) as preliminary step to simplify proteomic<br />
and transcriptomic approaches.<br />
Proteomics can guide metallomics by checking the presence<br />
of molecules in extracts obtained with the chromatography-ICPMS<br />
couplings:<br />
• This assists metal biomolecules isolation for mass<br />
spectrometry identification.<br />
• 2D analysis provide an image of the number of molecules<br />
in the extract and their molecular mass<br />
s308<br />
This triple -omic approach (MEPROTRAn-triple-<br />
OMICS) is a very useful and comprehensive alternative in<br />
the study of environmental issues and the diagnosis of contamination<br />
problems. In addition, MEPROTRAnS-triple-<br />
OMICS can assist in the validation of traditional biomarkers<br />
and a more simple cheap and fast assessment of environmental<br />
issues.<br />
This work has been supported by the Grant CTM2006-<br />
08960-C02-01( Ministerio de Educación y Ciencia-Spain<br />
and project FQM-348 from the Consejería de Innovación,<br />
Ciencia y Empresa (Junta de Andalucía).<br />
REFEREnCES<br />
1. Haraguchi H., Matsura H.: In: Enomoto S (rd) Bitrel,<br />
Wako (Saitama). Fujiyoshida (Yamanashi), Japan,<br />
2003.<br />
<strong>2.</strong> Szpunar J., Lobinski R., Prange A. Appl. Spectros. 57,<br />
102 (2003).<br />
3. Szpunar J.: Anal. Bioanal. Chem. 378, 54 (2004).<br />
4. Gómez-Ariza J. L., Garcia Barrera T., Lorenzo F., Bernal<br />
V., Villegas M. J., Oliveiras V.: Anal. Chim. Acta.<br />
524, 15 (2004).<br />
5. Sanz-Medel A.: Anal. Bioanal. 381, 1 (2005).<br />
6. Bonilla-Valverde D., Ruiz-Laguna J., Muñoz A., Ballesteros<br />
J., Lorenzo F., Gómez-Ariza J. L., López-Barea<br />
J.: Toxicology 197, 123 (2004).<br />
7. Ruiz-Laguna J., Garcia-Alfonso C., Peinado J., Moreno<br />
S., Leradi L., Cristaldi M., López-Barea J.: Biomarkers<br />
6, 146 (2001).<br />
8. Ruiz-Laguna J., Abril n., García-Barrera T., Gómez-<br />
Ariza J. L., López-Barea J., Pueyo C.: Environ. Sci.<br />
Technol. 40, 3646 (2006).
Chem. Listy, 102, s265–s1311 (2008) Environmental Chemistry & Technology<br />
L07 hEAVy METALS IN SOLID IMMISIONS IN<br />
ThE VICINITy OF IRON ORE MINING AND<br />
PROCESSING PLANT IN NIŽNÁ SLANÁ<br />
JOZEF HAnČUľáK, ERIKA FEDOROVá, OľGA<br />
ŠESTInOVá, TOMISLAV ŠPALDOn, Ján BREHUV and<br />
PAVeL SLAnČO<br />
Institute of Geotechnics of the Slovak Academy of Sciences<br />
Watsonova 45, 043 53 Košice, Slovak Republic,<br />
hanculak@saske.sk<br />
Introduction<br />
The content of hazardous substances in atmospheric<br />
deposition significantly contributes to the pollution of<br />
environment. A lot of studies deals with the research of<br />
atmospheric deposition, mostly using methods monitoring<br />
wet deposition, wet and dry deposition (bulk deposition),<br />
but also methods using fog and low cloud sampling 1 . The<br />
solid emissions from the technologies of ores and industrial<br />
minerals processing by their specific composition influence<br />
constitution of atmospheric deposition, especially in the areas<br />
of processing plants. The main emission source in the area<br />
of nižná Slaná is iron-ore mining and processing plant. The<br />
plant exploits the siderite ore. The run-off-mine ore is through<br />
several technological centres processed into the blast furnace<br />
pellets as a final product of the plant. The contribution deals<br />
with the evaluation of results obtained from monitoring of<br />
atmospheric deposition in the form of dust fallout (modified<br />
method bulk deposition). The research was carried out by the<br />
Institute of Geotechnics of the SAS in the area of the Siderite,<br />
Ltd. from 2001 to 2007, predominantly from viewpoint<br />
of heavy metals deposition (Fe, Mn, Zn, Pb, Cu, Cr, Cd, and<br />
As).<br />
Characteristics of the Plant<br />
The plant is situated in the Slaná river valley in the Slovak<br />
Republic. The valley has an orientation of north-south<br />
and northwest-southeast, respectively. The wind circs are<br />
influencing by an orography of given territory. Distribution<br />
of wind directions and the occurrence of calm in the near-by<br />
Rožňava town are shown in Table I.<br />
Exploited deposit is located in the Revúca upland Mts.,<br />
the Dobšiná foothill belt Mts. of the Slovak Ore Mts. Utility<br />
mineral is siderite. The average content of iron and manganese<br />
in ore is 33.5 % and <strong>2.</strong>8 %, respectively. Manganese<br />
is bonded isomorfically in the siderite lattice. There are also<br />
unfavourable elements (As, S, Pb, Zn) that occur as, sulphides,<br />
sulphates, sulphosalts and oxides. The most significant<br />
unacceptable impurity is arsenic that is present in the form of<br />
arsenopyrite. The average content of As in the run-off-mine<br />
ore is approximately of 0.01–0.1 %. Ore processing consists<br />
of crushing, magnetizing roasting, wet milling, magnetic<br />
separation and pelletizing. Primarily, thermal technologies,<br />
i.e. pelletizing and magnetizing roasting are responsible for<br />
the amount of dust outlet. Flue gases are exhausted to the<br />
environmental air through 120-meter high chimney after<br />
s309<br />
several stages of dedusting. Table II presents the average concentrations<br />
of the selected elements in the dust outlet from<br />
pelletizing plant and rotary furnaces. The emissions of solid<br />
pollutants from 1998 to 2007 are shown in the Table III.<br />
Material and Methods<br />
The samples of dust fallout were taken in the 30 days<br />
( ± 3 days) intervals from the seventeen sampling stations.<br />
The cylindrical plastic sedimentation containers (inside diameter<br />
– 1<strong>2.</strong>5 cm), put in two support stands in the height of<br />
<strong>2.</strong>5 to 3 m, were used for the sampling. The containers were<br />
filled with 250 ml of pure water with addition of isopropanol.<br />
After sampling, the content of containers was quantitatively<br />
located to evaporating dishes and evaporated. The organic<br />
mass was removed by annealing of dry matter at 450 °C. The<br />
chosen temperature prevented carbonate degradation and in<br />
such way enables to avoid the misinterpretation of dust fallout<br />
gravimetry results. The samples were gravimetrically evaluated<br />
before and after annealing, in the mass units recalculated<br />
for the area and the respective time period. Inorganic<br />
portion determined by annealing from twelve month period<br />
was cumulated to the one sample and after mineralization it<br />
was analysed using AAS (SpectrAA – 30 VARIAn). On the<br />
basis of these chemical analyses and mass yield of the dust<br />
fallout, the average annual depositions by observed heavy<br />
metals were calculated for each of the seventeen sampling<br />
points. The localization of sampling stations is illustrated in<br />
Fig. 1.<br />
Fig. 1. Sampling locations in the area of Nižná Slaná<br />
Results and Discussion<br />
The average year values of total deposition for whole<br />
monitored period determined for individual sampling points
Chem. Listy, 102, s265–s1311 (2008) Environmental Chemistry & Technology<br />
Table I<br />
Percentage of the wind directions and calm in the Rožňava town [%]<br />
n n-E E S-E S S-W W n-W Calm<br />
38 8 6 2 25 2 3 6 10<br />
Table II<br />
The content of the selected elements in the solid dust outlets from thermal technologies<br />
Technologies<br />
Fe Mn Zn Pb Cu Cr Cd As<br />
[%] [ppm]<br />
Pelletizing 30.4 3.48 94 3<strong>2.</strong>6 99 39 25 636<br />
Rotary furnaces 27.8 <strong>2.</strong>12 200 127 170 63 24 176<br />
Table III<br />
The emissions of solid pollutants from the plant (1998–2007) [t year –1 ]<br />
1998 1999 2000 2001 2002 2003 2004 2005 2006 2007<br />
156.4 116.3 116.9 86.7 3<strong>2.</strong>9 63.3 63.8 121.5 155.8 148.4<br />
Table IV<br />
The average deposition of selected heavy metals and total deposition in the area of nižná Slaná (2001–2007)<br />
Parameter<br />
Total dep. Fe Mn Zn Pb Cu Cr Cd As<br />
[mg m –2 year –1 ]<br />
Minimum 8,621.0 1,221.0 60.9 9.54 0.35 1.67 1.09 0.033 1.49<br />
Maximum 32,537.0 9,636.0 631.3 63.12 <strong>2.</strong>81 5.73 4.36 0.078 28.84<br />
Average (n = 17) 18,155.0 4,543.0 27<strong>2.</strong>7 23.34 0.93 3.38 <strong>2.</strong>58 0.050 11.07<br />
Median 17,173.0 4,423.0 265.0 17.68 0.68 3.27 <strong>2.</strong>59 0.048 8.77<br />
SD 6,996.0 2,288.0 160.6 16.59 0.65 1.05 1.05 0.012 7.50<br />
were in the interval 8.6–3<strong>2.</strong>5 g m –2 y –1 . In most of sampling<br />
points a significant increase of solid pollutant emissions in<br />
2005 till 2007 comparing with previous years was not detected<br />
(total dust fallout). On the other hand, the significant<br />
increases of Fe, Mn and As deposition values were recorded<br />
using dust fallout analysis in the most of sampling stations.<br />
The samples of dust fallout were also subjected to X-ray<br />
diffraction (XRD) analysis. Thus, minerals such as quartz,<br />
chlorite, siderite, ankerite were detected. These minerals<br />
come from raw ore handling but also as a result of aeolation<br />
from surrounding environment. On the other side hand there<br />
are minerals, namely hematite, maghemite, magnetite and<br />
wüstite coming from the thermal technologies of the plant 2 .<br />
Table IV presents average values of deposition of<br />
selected heavy metals and basic statistic parameters for the<br />
whole monitored period and all sampling points. Qualitative<br />
composition of dust fallout unlike of its quantity significantly<br />
contributed to the ecological load of the individual sampling<br />
points that was caused by plant activities. Between various<br />
sampling points high differences in the deposition were<br />
determined mainly for Fe, Mn and As. There were not so high<br />
differences in the deposition with others elements. The most<br />
s310<br />
ecological load was situated in the south of the plant, in the<br />
central part of the valley. The statistical dependence between<br />
emissions of solid pollutants and deposition of observed<br />
metals (annual median) in the individual years by correlation<br />
analysis was evaluated. Relatively high positive values<br />
of correlation coefficient were calculated for manganese, iron<br />
and arsenic, namely 0.794, 0.764 and 0.749, respectively.<br />
Correlation coefficients for other elements were relatively<br />
low. The development of selected metal deposition (median)<br />
and the emissions of solid pollutants for the whole monitoring<br />
period is showed in Fig. <strong>2.</strong><br />
In the Slovak Republic there are not determined allowable<br />
limits for heavy metals deposition from dust fallout.<br />
That is the reason why relative comparison of heavy metal<br />
depositions for different localities is used for assessment of<br />
immission load.<br />
In the nižná Slaná locality, Fe deposition achieves high<br />
values because of solid pollutants emissions consist mainly<br />
of iron minerals. Fe depositions monitored in the individual<br />
stations were in the range from 1.221 to 9.636 mg m –2 y –1 .<br />
In Košice town with metallurgy industry, the values varied<br />
from 232 to 7.568 mg m –2 y –1 (ref. 3 ). In the Czech Republic
Chem. Listy, 102, s265–s1311 (2008) Environmental Chemistry & Technology<br />
Fig. <strong>2.</strong> Development of selected metal deposition (median) and<br />
the emissions of solid pollutants (2001–2007)<br />
in 2005 (measured for subsystems of basic and contaminated<br />
areas), ten times lower Fe deposition was determined in<br />
comparison with area of nižná Slaná (69–1,002 mg m –2 y –1 )<br />
(ref. 4 ).<br />
The highest contents of manganese in dust fallout were<br />
detected in the area of nižná Slaná and Jelšava with maximum<br />
deposition values of Mn 631.3 and 406.4 mg m –2 y –1 ,<br />
respectively 3 . Average values exceeded 200 mg m –2 y –1 .<br />
In past, the most manganese loaded territory was the locality<br />
Dolný Kubín that is located nearby iron-alloy factories<br />
Istebné, where the maximum deposition Mn value from dust<br />
fallout was 668 mg m –2 y –1 (ref. 5 ). In other parts of Slovakia,<br />
average deposition of Mn from dust fallout were 3.6 and<br />
34.4 mg m –2 y –1 in the Slovak Paradise and Košice, respectively<br />
3 . In the case of nižná Slaná and Jelšava, the main manganese<br />
sources were iron-ore mining factories, magnesite<br />
factories and raw materials (siderite, magnesite) treated in<br />
these factories. In the Czech Republic in the monitored territories<br />
the average deposition of Mn was 13.6 mg m –2 y –1 and<br />
the maximum deposition was 68.3 mg m –2 per year 4 .<br />
The deposition values of Zn in the nižná Slaná area<br />
were in the interval 9.5–63.1 mg m –2 y –1 with the average<br />
value of 23.3 mg m –2 y –1 . In general, these values are not very<br />
high. In the Czech Republic, the average atmospheric depositions<br />
of Zn were 50.6 and 54.3 mg m –2 y –1 and the maximum<br />
was 206 mg m –2 y –1 (ref. 4 ). In the agricultural area Austria<br />
and England, the measured values of zinc deposition were<br />
s311<br />
in range from 21.4 to 48.9 mg m –2 y –1 respectively 2<strong>2.</strong>1 to<br />
35.6 mg m –2 y –1 (refs. 6,7 ).<br />
The deposition of Pb was relatively low (0.11–<br />
<strong>2.</strong>44 mg m –2 y –1 ) in the locality of nižná Slaná. The maximum<br />
content of Pb (21.89 mg m –2 y –1 ) from dust fallout was<br />
measured in Krompachy, while the main source of solid<br />
pollutions was cooper smeltery 3 . In past, in Slovakia, there<br />
was determined the maximum content of Pb in dust fallout<br />
(380 mg m –2 y –1 ) in the locality of Prievidza, that was caused<br />
by steam brown coal combustion 5 . The deposition of Pb was<br />
5.4 to 13.9 mg m –2 y –1 in England and Wales 6 . In Austria, the<br />
measured values were 1.90–5.44 mg m –2 y –1 (ref. 7 ).<br />
The deposition of Cu achieved low values in nižná<br />
Slaná (1.74-5.68 mg m –2 y –1 ). High copper deposition<br />
(128.26 mg m –2 y –1 ) was measured in Krompachy 3 . The<br />
values in Austria and England were in range from 6.24 up to<br />
14.70 respectively 2<strong>2.</strong>1 to 35.6 mg m –2 y –1 (refs. 6,7 ) .<br />
The average depositions of chromium in nižná Slaná<br />
were in the interval from 1.19 to 4.77 mg m –2 y –1 . The average<br />
depositions of chromium from dust fallout in the Slovak Paradise<br />
and Jelšava were 0.64 and 10.52 mg m –2 y –1 , respectively.<br />
The maximum measured value was detected in Košice<br />
(14.62 mg m –2 y –1 )(ref. 3 ). In the Czech Republic, atmospheric<br />
deposition monitoring revealed values in the range from 0.21<br />
to <strong>2.</strong>81 mg m –2 y –1 and in Austria in the interval from 0.72 to<br />
1.95 mg m –2 y –1 (refs. 4,7 ). In England and Wales, the Cr values<br />
were in range from 0.75 to 2 mg m –2 y –1 (ref. 6 ).<br />
The deposition values of cadmium in the nižná Slaná<br />
were in the range from 0.033 to 0.084 mg m –2 y –1 . This is relatively<br />
low value. In Košice and Jelšava, the measured average<br />
values were 0.678 and 0.742 mg m –2 y –1 , respectively 3 . In the<br />
Czech Republic, the atmospheric deposition monitoring detected<br />
values in the range from 0.025 to 1.230 mg m –2 y –1<br />
and n Austria in the interval 0.146–0.325 mg m –2 y –1 (refs. 4,7 ).<br />
The deposition of Cd was 0.19 to 0.61 mg m –2 y –1 in England<br />
and Wales 6 .<br />
Relatively high values of arsenic deposition were registered<br />
in the locality of nižná Slaná. The average values in<br />
the monitored areas were in the interval of 1.28–29.28 mg m –<br />
2 y –1 . The source of arsenic is arsenopyrite that is present<br />
in siderite batch. The maximum arsenic value was detected<br />
from sampling station no.5 that is close to the factory. This<br />
value is two fold times higher that the maximum value from<br />
Krompachy, where the measured value was 14.588 mg m –<br />
2 y –1 (ref. 3 ). In the relative pure area of Slovak Paradise, the<br />
recorded values of arsenic deposition were from 0.044 to<br />
0.155 mg m –2 y –1 (ref. 3 ). The atmospheric deposition monitoring<br />
in the Czech Republic registered values from 0.21<br />
to <strong>2.</strong>81 mg m –2 y –1 (ref. 4 ). In past, in the Slovak Republic,<br />
maximum content of As in dust fallout was 35 mg m –2 y –1 in<br />
the locality of Prievidza (effect of steam brown coal combustion<br />
with high concentration of As) 5 . The average values<br />
for atmospheric deposition in the Czech Republic were<br />
0.50–0.67 mg m –2 y –1 and maximum arsenic value was<br />
<strong>2.</strong>11 mg m –2 y –1 in 2005(ref. 4 ). In England and Wales, the As<br />
values were in range from 0.31 to 1 mg m –2 y –1 (ref. 6 ).
Chem. Listy, 102, s265–s1311 (2008) Environmental Chemistry & Technology<br />
Conclusions<br />
The detailed analysis of dust fallout from the locality of<br />
Siderite, Ltd. factory revealed the extent of ecological load.<br />
In comparison with others localities, this area is the most<br />
influenced with heavy metals (iron, manganese and arsenic).<br />
This fact reflects the composition of siderite and applied technological<br />
treatments of siderite ore in the factory. Although<br />
relatively small territory was monitored, the significant differences<br />
are detected. There are many different factors, for<br />
example: meteorological, orographic, emissive, binding and<br />
particle sedimentation mechanisms with linkage to impurities<br />
and also others factors. Although the method of measuring<br />
of dust fallout is laborious with some mistakes, the relative<br />
evaluation of individual localities imission load provides<br />
applicable results.<br />
This work has been supported by Slovak grant agency VEGA<br />
project No. 2/0131/08.<br />
s312<br />
REFEREnCES<br />
1. Fišák J., Tesař M., řezáčová D., Eliáš V., Weignerová<br />
V., Fottová, D.: Atmos. Res., 64, 75 (2002).<br />
<strong>2.</strong> Baluchová B., Fejdi P., Bobro M.: Mineralia Slovaca,<br />
36, 357 (2004).<br />
3. Hančuľák J., Bobro M., Brehuv J., Slančo P.: Acta Montanistica<br />
Slovaca, 10, 246 (2005).<br />
4. Prášková L., Kubík, L., Malý, S.: Annual report 2005.<br />
Central institute for supervising and testing in agriculture.<br />
Brno 2006.<br />
5. Ursíniová M., Vaňová R., Paľušová O.: Acta Hygienica<br />
et Epidemiologica et Microbiologica. Praha, 21, 1<br />
(1992).<br />
6. nicholson F. A., Smith S. R, Alloway B. J., Carlton-<br />
Smith C., Chambers B. J.: Sci. Total Environ. 311, 205<br />
(2003).<br />
7. Spiegel H., Böhm K.E., Roth K. Sager M.: Proceedings<br />
7th Intern. Conf. on the Biogeochem. of Trace Elements;<br />
Uppsala ’03, 15 -19 June 2003 (Gobran G., Lepp n.,<br />
ed.), p.19, Uppsala 2003.
Chem. Listy, 102, s265–s1311 (2008) Environmental Chemistry & Technology<br />
L08 COMPARISON OF ENERGy DISPERSIVE<br />
x-RAy FLuORESCENCE SPECTROMETRy,<br />
INDuCTIVELy COuPLED PLASMA OPTICAL<br />
EMISSION SPECTROMETRy AND LASER<br />
AbLATION wITh PLASMA SPECTROMETRy<br />
IN ThE ELEMENTAL ANALySIS OF SOILS<br />
IVOnA HUBOVá a , MARKéTA HOLá a , VLASTIMIL<br />
KUBáň b , ILSE STEFFAn c and VIKTOR KAnICKý a<br />
a Laboratory of Atomic Spectrochemistry, Department of Chemistry,<br />
Faculty of Science, Masaryk University, Brno 611 37,<br />
Czech Republic,<br />
b Department of Chemistry and Biochemistry, Faculty of<br />
Agronomy, Mendel University of Agriculture and Forestry,<br />
Brno 613 00, Czech Republic,<br />
c Department of Analytical Chemistry and Food Chemistry,<br />
Faculty of Chemistry, University of Vienna, Vienna 1090,<br />
Austria,<br />
41396@mail.muni.cz<br />
Introduction<br />
Agricultural soils represent complex multiphase multicomponent<br />
material which requires adequate methods of<br />
chemical analysis. Content of elements represents important<br />
parametre which relates to nutrition of plants on one side and<br />
a contamination with toxic elements on the other side. For<br />
intake of elements by plants only selected elemental forms<br />
(species) are bioavailable. Speciation or fractionation based<br />
on selective leaching of particular species followed by atomic<br />
absorption spectrometry or inductively coupled plasma<br />
optical/mass spectrometry (ICP-OES, ICP-MS) analyses of<br />
resulting solutions are employed for this purpose. nevertheless,<br />
total elemental contents, which comprise also elemental<br />
forms that are insoluble in leaching media or by the action of<br />
plants, might be interesting for overall characterisation of a<br />
particular soil. In this case, total sample decomposition procedures<br />
based on the action of a mixture of mineral acids or<br />
a sample fusion with a suitable melt are applied to dissolve<br />
resistant minerals and desintegrate possibly present silicate<br />
lattice.<br />
However, some methods for direct analysis of solids<br />
are more advantageous because of elimination of possible<br />
analytes losses and minimization of risk of contamination.<br />
For this purpose, X-ray fluorescence (XRF) spectrometry 1 is<br />
frequently and routinely used. Laser-assised plasma spectrometry<br />
techniques, such as laser induced breakdown spectroscopy<br />
2 , and ICP-OES or ICP-MS in connection with laser<br />
ablation (LA) seem to be promising tool for soil analysis. 3–7<br />
The aim of this work consists in establishing new<br />
methods of soil elemental analysis using LA-ICP-OES/MS.<br />
Artificially intentionally contaminated archive soil samples<br />
were employed. Toxic metals Cr, ni, Cu, Zn and Pb were<br />
considered in the method developement. For the method<br />
validation, these soil samples were subjected to ICP-OES<br />
analysis of solutions obtained by total decomposition using<br />
mineral acids. Seleted soil standard reference materials were<br />
s313<br />
also analyzed. Independent results acquired by XRF analysis<br />
of soil sample pellets were used for confirmation of accuracy<br />
of solution analysis by ICP-OES.<br />
Besides the total elemental content determination,<br />
selected soils were characterized by means of the five-step<br />
extraction procedure to asses elemental fractions bound to<br />
particular soil phases. This information might be important<br />
for explanation of possible matrix effects associated with<br />
processes of LA.<br />
A selection and preparation of a suitable binder represents<br />
the indispensable step in the development of ablation<br />
– based methods. In our work we investigated a silica solgel<br />
matter preparation and its mixing with soil samples. The<br />
binder was then successfully applied in LA-ICP-OES/MS<br />
methods. The accuracy of the developed methods was confirmed<br />
by analysis of certified reference materials of soils<br />
(GBW07405 – 07).<br />
Experimental<br />
S o i l S a m p l e s<br />
Experimentally contaminated agricultural soils representing<br />
various soil types belong to archived materials of the<br />
Central Institute for Supervising and Testing in Agriculture<br />
(UKZUZ), Brno, Czech Republic.<br />
Studied trace elements Cr, ni, Cu, Zn, Pb occur in the<br />
concentration ranges as shown in Table I.<br />
The soil samples were ground in a ball mill and dried<br />
to constant weight. The particle size of ground samples was<br />
measured by laser diffractometry and the particle diameter<br />
did not exceed 30 µm.<br />
Table I<br />
Concentration range of tested soils and RSD values for<br />
Pn-ICP-OES<br />
Element C range [mg kg –1 ] RSD [%]<br />
Cr 21–590 3.7–1.7<br />
ni 3.5–262 14–0.9<br />
Cu 11–242 <strong>2.</strong>5–3.2<br />
Zn 51–1355 <strong>2.</strong>7–0.5<br />
Pb 22–1015 <strong>2.</strong>7–1.6<br />
The solution analysis by ICP with pneumatic nebulization,<br />
(Pn-ICP-OES) was carried out after the sample decomposition<br />
with a mixture of HF and HClO 4 (ref. 5 ) The soil-wax<br />
pellets for XRF analysis were prepared as a mixture of 4 g<br />
of a soil powder and 0.9 g of wax. The mixture was homogenized<br />
in a ball mill and then pressed by a hydraulic press<br />
to a pellet with a diameter of 32 mm. Sequential extraction<br />
was performed using five reagents with a different strength<br />
(Table II) 8,9 . The sol-gel method, allowing homogenous dispersion<br />
of internal standard (Sc) and analytes in calibration<br />
pellets, was applied for analysis of tested soils by LA-ICP-<br />
MS 10 .
Chem. Listy, 102, s265–s1311 (2008) Environmental Chemistry & Technology<br />
Table II<br />
Sequential extraction procedure<br />
Step Metal phase Reagent<br />
1 Exchangeable 1 M naOAc (pH = 8.2)<br />
2 Carbonate 1 M naOAc (pH = 5)<br />
3 Mn-Fe oxides 0.04 M nH 2 OH . HCl<br />
in 25 % HOAc<br />
4 Organic 0.02 M HnO 3 , 30% H 2 O 2 (pH = 2),<br />
3.2 M nH 4 OAc in 20% HnO 3<br />
5 Residual conc. HF, HClO 4 , HCl<br />
S o l - G e l T e c h n i q u e<br />
Sol-gel is an amorphous solid prepared via sol-gel processing,<br />
in which a colloidal suspension (sol) is first formed<br />
by mixing a silicon (e.g. tetraethoxysilane-TEOS) alkoxide<br />
precursor, water, a co-solvent and an acid or base catalyst.<br />
Alkoxyl groups are removed by acid- or base-catalysed hydrolysis<br />
reactions (Eq. (1)), and networks of O – Si – O linkages<br />
(gel) are formed in subsequent condensation reactions, which<br />
can produce either water or alcohol as shown in equations<br />
(2) and (3), involving hydroxyl groups 11 . Internal standard is<br />
integrated with the sample during gelation process.<br />
Hydrolysis:<br />
Si(OR) 4 + H 2 O → Si(OR) 3 OH + ROH (1)<br />
Condensation:<br />
X 3 SiOH + HOSiX’ 3 → X 3 Si – O – SiX’ 3 + H 2 O (2)<br />
X 3 SiOR + HOSiX’ 3 → X 3 Si – O – SiX’ 3 + ROH (3)<br />
An archive soil sample with the lowest content of Cr, ni,<br />
Cu, Zn and Pb spiked with solutions of elements of interest<br />
was used for the preparation of calibration samples. Twentytwo<br />
soil samples and three certified reference material of soils<br />
(GBW07405 – 07) were analyzed by developed LA-ICP-MS<br />
method and the obtained contents were compared with results<br />
of independent methods (XRF, ICP-OES).<br />
The real soil samples were treated by the following<br />
procedure: 1.2 g of soil was weighed into a 50 ml beaker<br />
and 3 ml of TEOS, 6 ml of ethanol, 1.5 ml of water, 20 µl<br />
of the Sc standard solution (100 mg ml –1 ) and two drops of<br />
0.01 mol dm –3 HnO 3 were added. The beakers were put into<br />
a thermostated water bath maintained at ~ 75 °C under ultrasonic<br />
stirring for ~ 1.5 h to reach the complete gelation. After<br />
20 min., 5 ml of water was added. The gelled materials were<br />
dried overnight in an oven at 110 °C. The sol-gel samples<br />
were manually ground and pressed into pellets with 12 mm<br />
in diameter and 1 mm thickness 10 .<br />
I n s t r u m e n t a t i o n<br />
A Jobin Yvon 170 Ultrace with laterally viewed ICP<br />
was used for solution analysis. The ICP system combines a<br />
s314<br />
monochromator and a polychromator. The monochromator<br />
was set on the Pb II 220.353 nm line and other four studied<br />
analytes were measured with the polychromator of a Paschen<br />
Runge montage using analytical lines Cr II 267.720 nm,<br />
ni II 231.608 nm, Cu II 324.759 nm and Zn I 213.860 nm.<br />
The XRF analysis was performed on an energy-dispersive<br />
XRF spectrometer (SPECTRO XEPOS) by polarized<br />
radiation, equipped with a Pd X-ray tube and a Si-detector.<br />
The real unknown samples were analyzed by the TUR-<br />
BOQUAnT method, which is able to analyze the elements<br />
na-U.<br />
The LA-ICP-MS was performed with a laser ablation<br />
system UP 213 (new Wave, USA) and an ICP-MS spectrometer<br />
Agilent 7500 CE (Agilent, Japan). A commercial Qswitched<br />
nd:YAG laser, operated at the wavelength of 213<br />
nm with the 5 th harmonic frequency, was used for ablation.<br />
The ablation device is equipped with programmable XYZstages<br />
that allowed sample movements during the ablation<br />
process. The samples were placed into the SuperCell (new<br />
Wave, USA) and were ablated by the laser beam, which was<br />
focused onto the sample surface through a quartz window.<br />
The ablated material was transported by flowing He to the<br />
ICP.<br />
Results<br />
The total contents of trace elements were determined<br />
using ICP-OES after total decomposition. XRF spectrometry<br />
was chosen for result comparison. Relative standard deviation<br />
of the total decomposition method and concentration range<br />
of tested soils can be found in Table I. Higher RSD value<br />
might be due to sample inhomogeneity and uncertainty of<br />
the measurement at low element concentration. Satisfactory<br />
agreement was found for ICP-OES solution analysis and<br />
XRF spectrometry. Correlation coefficient r values exceeded<br />
0.994. Comparison of Pn-ICP-OES and XRF determination<br />
of zinc as an easily leachable element is presented in Fig. 1.<br />
A five-stage sequential extraction procedure was used<br />
for the determination of the speciation of extractable heavy<br />
Fig. 1. Comparison of results obtained by xRF analysis and<br />
PN-ICP-OES of soil extracts for Zn I 213.860 nm
Chem. Listy, 102, s265–s1311 (2008) Environmental Chemistry & Technology<br />
Table III<br />
Comparison of efficiency of extraction by Pn-ICP-OES to<br />
XRF analysis<br />
Element Efficiency [%]<br />
Cr 63<br />
ni 82<br />
Cu 80<br />
Zn 102<br />
Pb 96<br />
metals by Pn-ICP-OES. The results as a sum of the five<br />
extraction steps were compared with those obtained after<br />
total decomposition and by XRF spectrometry. Efficiency<br />
of soil extracts to pressed pellets together with correlation<br />
coefficients are presented in Table III. The best efficienty of<br />
extraction can be observed for lead and zinc. Efficiency of<br />
extraction depends on the binding to minerals with different<br />
solubility. Low efficiency of chromium can be explained by<br />
binding to poorly soluble chromspinels and chromite 12,13 .<br />
The soil samples were analysed to evaluate the possibility<br />
of quantitative elemental analysis by laser ablation. The<br />
results for LA-ICP-MS were compared with the results of<br />
XRF as a method representing another type of direct analysis<br />
and with the results of solution analysis by ICP-OES as an<br />
ordinary method. In the case of Cr, slightly lower concentration<br />
values were yielded for the total decomposition using<br />
Pn-ICP-OES than for both direct analysis methods, which<br />
can be caused by the incomplete decomposition of Cr in acids<br />
(Fig. <strong>2.</strong>).<br />
Fig. <strong>2.</strong> Comparison of LA-ICP-MS and PN-ICP-OES after total<br />
decomposition results for Cr as a barely leachable element<br />
The calibration was performed using spiked sample pellets.<br />
The soil with a low content of elements of interest was<br />
spiked with seven concentration levels to obtain a calibrated<br />
range from 24 to 965 mg kg –1 . The calibration curves were<br />
fitted by a computer program WinStat. All calibration plots<br />
were linear over the whole concentration range. Intercepts of<br />
the regression lines were tested by t-test and were statistically<br />
insignificant (t a < t 0.05;n-2 ) for all studied elements. Correla-<br />
s315<br />
Table IV<br />
Comparison of CRM GBW07407 soil analysis results by<br />
LA-ICP-MS and certified values; the uncertainty intervals<br />
are calculated on a 95 % confidence level<br />
Method [mg kg–1 ] LA-ICP-MS Certified value<br />
Cr 432 ± 28 410 ± 23<br />
ni 269 ± 27 276 ± 15<br />
Cu 84 ± 8 97 ± 6<br />
Zn 139 ± 15 142 ± 11<br />
Pb 15 ± 3 14 ± 3<br />
tion coefficient r values were in the range of 0.997–0.999.<br />
Calibration line for copper with scandium as internal standard<br />
is presented in Fig. 3.<br />
Repeatability of ablation was described as RSD % which<br />
was calculated from three measurements of ablation signal on<br />
the different locations of each pellet. The RSD values did not<br />
exceed 8%.<br />
The accuracy of the method was confirmed by analysis<br />
of three CRM soils. Results of CRM GBW 7407 by LA-ICP-<br />
MS and certified values are given in Table IV.<br />
Fig. 3. Calibration graph for Cu with internal standardization<br />
by Sc<br />
Conclusions<br />
Monitoring of the heavy metals in agricultural soils is gaining<br />
the importance because these elements can be accumulated<br />
by plants and thus enter the food chain. To obtain total<br />
elemental content of Cr, ni, Cu, Zn, Pb the decomposition<br />
with HF and HClO 4 by ICP-OES was used. The sequential<br />
extraction procedure providing more information than total<br />
concentration determination was used to study bioavailability<br />
of metals. Methods of total decomposition are very lengthy<br />
and sometimes even not fully efficient therefore direct<br />
methods are more convenient in such a case. XRF analysis<br />
of soil pellets prepared with a wax binder and LA-ICP-MS<br />
of perfectly homogenized pellets using sol-gel method represented<br />
the direct methods.<br />
The results of direct methods were compared with those<br />
obtained by Pn-ICP-OES. A satisfactory agreement was
Chem. Listy, 102, s265–s1311 (2008) Environmental Chemistry & Technology<br />
found for all three methods applied to the studied elements,<br />
except for chromium as was mentioned.<br />
I. H. and M. H. gratefully acknowledge the Ministry of<br />
Education, Youth and Sports of the Czech Republic for support<br />
of the research project MSM0021622412, V.K.gratefully<br />
acknowledges the Ministry of Education, Youth and Sports<br />
of the Czech Republic for support of the research project<br />
MSM0021622410. The authors acknowledge Dr. Jiří Zbíral<br />
from the Central Institute for Supervising and Testing in Agriculture<br />
for providing the soil samples and Dr. Petr Kolečkář<br />
from SPECTRO CS for consultations and assistence at measurements<br />
with XRF spectrometer.<br />
REFEREnCES<br />
1. dos Anjos M. J., Lopes R. T., de Jesus E. F. O., Assis J.<br />
T., Cesareo R., Barradas C. A. A.: Spectrochim. Acta B<br />
55, 1189 (2000).<br />
<strong>2.</strong> Capitelli F., Colao F., Provenzano M. R., Fantoni R.,<br />
Brunetti G., Senesi n.: Ž. Geoderma 106, 45 (2002).<br />
3. Kanicky V., Mermet J. M.: Fresenius’ J. Anal. Chem.<br />
363, 294 (1999).<br />
s316<br />
4. Musil P., Otruba V., Kanicky V., Mermet J. M.: Spectrochim.<br />
Acta B 55, 1747 (2000).<br />
5. Mikoláš J., Musil P., Stuchliková V., novotný K., Otruba<br />
V., Kanický V.: Anal. Bioanal. Chem. 374, 244 (2002).<br />
6. Lee Y. L., Chang Ch. Ch., Jiang S. J.: Spectrochim. Acta<br />
B 58, 523 (2003).<br />
7. Baker S. A., Bi M., Aucelio R. Q., Smith B. W., Winefordner<br />
J. D.: J. Anal. At. Spectrom. 14, 19 (1999).<br />
8. Hlavay J., Prohaska T., Weisz M., Wenzel W. W., Stingeder<br />
G. J.: Pure Appl. Chem. 76, 415 (2004).<br />
9. Mester Z., Cremisini C., Ghiara E., Morabito R.: AnalyticaChimica<br />
Acta 359, 133 (1998).<br />
10. Hubová I.: J. Anal. At. Spectrom. 22, 1 (2007).<br />
11. Wright J. D., Sommerdijk A. J. M.: Sol-Gel Materials<br />
Chemistry and applications, 2001.<br />
1<strong>2.</strong> Medved J., Sterško V., Kubová J., Polakovičová J.: Fresenius´<br />
J. Anal. Chem. 360, 219 (1998).<br />
13. Doležal J., Povondra P., Šulcek Z.: Rozklady základních<br />
anorganických surovin, SnTL Praha, 1966.
Chem. Listy, 102, s265–s1311 (2008) Environmental Chemistry & Technology<br />
L09 TISSuE-SPECIFIC DISTRIbuTION AND<br />
ACCuMuLATION OF ORGANOChLORINE<br />
POLLuTANTS IN SELECTED RAPTOR<br />
SPECIES FROM ThE CZECh REPubLIC<br />
RADIM LánA a , MILADA VáVROVá a,b , VLADIMíR<br />
VEČEřEK b and STAnISLAV KRáČMAR c<br />
a ICTEP, Faculty of Chemistry, Brno University of Technology,<br />
Purkyňova 118, 612 00 Brno, Czech Republic,<br />
b University of Veterinary and Pharmaceutical Science Brno,<br />
Palackého 1–3, 612 42 Brno, Czech Republic,<br />
c Mendel University of Agriculture and Forestry in Brno,<br />
Zemědělská 1, 613 00 Brno, Czech Republic,<br />
lana@fch.vutbr.cz<br />
Introduction<br />
Organochlorine compounds such as polychlorinated<br />
biphenyls (PCBs) or organochlorine pesticides (OCPs) are<br />
known as persistent organic pollutants (POPs). Despite the<br />
ban on production or restrictions on use many years ago the<br />
POPs still continue to be found in various samples from the<br />
environment and accumulate through the food chains. For<br />
their top position within the food chain and the sensitivity<br />
to environmental changes birds of prey are very suitable bioaccumulation<br />
markers. The amount of pollutants accumulating<br />
in the raptors’ tissues is related not only to their diet and<br />
corresponding trophic position, but also to the differences in<br />
accumulation among habitats and ecosystems (aquatic vs.<br />
terrestrial) 1 . Moreover, sensitivity also varies greatly between<br />
compound and species 2 .<br />
However, it is difficult to use birds for the assessment<br />
of pollutant transfers within the food web, except for those<br />
species partly associated with the aquatic habitats where the<br />
transfer can be documented in some measure. For instance<br />
the cormorant or heron are fish feeders and top predators in<br />
aquatic ecosystems, have relatively high levels of POPs in the<br />
adipose tissue, and hence are suitable bioindication species 3 .<br />
Because practical and ethical reasons, low numbers and<br />
often legal protection inhibit the sacrifice of free-living animals,<br />
methods for non-destructive biomonitoring have been<br />
developed. Whereas many studies have previously focused<br />
on the use of eggs or hair, feathers, on the other hand, have an<br />
advantage that they can be collected irrespective of season,<br />
age or sex 4 . Another simple approach consists in the use of<br />
specimens found dead.<br />
In the Czech Republic, the levels of PCBs in unhatched<br />
eggs from raptors were monitored. no intra- or interspecies<br />
differences were found and the findings corresponded to<br />
those from Germany, Canda or the USA, where the CB 153<br />
was the most abundant congener 5 .<br />
This study deals with the levels of organochlorine pollutants<br />
in various tissues of raptor species from the Czech<br />
Republic and compares the results with those from foreign<br />
surveys.<br />
s317<br />
Experimental<br />
The sampling area as well as the raptor and fish species<br />
and their detailed description have already been published 6 .<br />
Selected tissue samples of investigated specimens were<br />
homogenized and dessicated by activated anhydrous sodium<br />
sulphate. Two different extraction techniques were employed<br />
for the isolation of lipids from the tissues. The samples of<br />
muscles, kidneys and liver were extracted by petrolether<br />
(SupraSolv, Merck) by means of accelerated solvent extraction<br />
(140 °C, 12 MPa, 3 × 5 min static extraction + n 2 purge).<br />
The samples of brain, skin, feathers and intestinal content<br />
were extracted by petrolether:acetone (1 : 1, v/v) for 6 h in<br />
a Soxtec apparatus. The removal of lipids from raw extracts<br />
was carried out on an adsorption column packed with Florisil<br />
(5 g; 60/100 mesh, Sigma-Aldrich, activated at 600 °C for<br />
6 h). The samples were then eluted with 90 ml of n-hexane:<br />
diethylethere (94 : 6, v/v), evaporated to dryness using a<br />
rotary evaporator, and dissolved in 1 ml of n-hexane.<br />
The quanification of target analytes was carried out<br />
by HP 6890n high resolution gas chromatograph with two<br />
micro-electron capture detectors (63 ni m-ECD) and two<br />
capillary columns (HT-8 and DB-17ms) operated in parallel<br />
(H 2 as the carrier gas). nine-point calibration curves in a<br />
linear range from 0.5 to 1,000 ng ml –1 were used and the limit<br />
of quantification (LOQ) for all analytes was calculated as<br />
<strong>2.</strong>5 ng g –1 of lipids (i.e. about 0.13 ng g –1 d.w. for 4% lipid<br />
content in a tissue).<br />
Results<br />
The levels of organochlorine pollutants found in the<br />
muscle tissue of cormorants from the Záhlinice area (2007)<br />
Fig. 1. Organochlorine pollutants in muscle tissue of common<br />
cormorant from the Záhlinice area (n = 8). Horizontal lines represent<br />
median, rectangles delimit the 1 st and 3 rd quartiles, and<br />
error bars represent the min/max values. Outlying values are<br />
marked as “+” (2007).
Chem. Listy, 102, s265–s1311 (2008) Environmental Chemistry & Technology<br />
are presented in Fig. 1. PCB congeners 138, 153 and 180,<br />
and the p,p’-DDE were the most abundant compounds. As<br />
can be read in this graph, there are significant differences in<br />
the levels of organochlorines in samples of different specimens.<br />
Due to its higher content of lipids, compared with the<br />
other tissues, skin was by far “the most contaminated” tissue<br />
(approx. five times higher levels of PCBs and OCPs).<br />
Extreme values exceeded 5,000 ng g –1 w.w. for the sum of<br />
7 PCB congeners, and DDT and its metabolites reached even<br />
higher levels. Interspecies differences in the concentrations<br />
of POPs are shown in Fig. <strong>2.</strong><br />
Fig. <strong>2.</strong> PCBs in muscle tissue of species from the Záhlinice<br />
area. horizontal lines represent median, rectangles delimit the<br />
1 st and 3 rd quartiles, and error bars represent min/max values.<br />
Outlying values are marked as “+” (2003).<br />
s318<br />
Comparison of fish and raptors’ tissues from the Záhlinice<br />
area showed an increase in the concentrations of POPs<br />
towards higher levels of the food chain and the process of<br />
accumulation of POPs was clearly illustrated.<br />
Conclusions<br />
Investigated raptor species including cormorant, grey<br />
heron and buzzard lived up to their reputation of being the<br />
most contaminated members of food chains. Cormorants and<br />
grey heron top the aquatic food chain and hence the levels of<br />
organochlorines found in their tissues were significantly higher<br />
than those in their fish prey. The results can be well compared<br />
with other findings not only within the Czech Republic<br />
a prove fish and birds of prey to be suitable bioaccumulation<br />
markers.<br />
Financial support from the Ministry of Education,<br />
Youth and Physical Training of the Czech Republic under the<br />
research project MSM 6215712402 is greatly appreciated.<br />
REFEREnCES<br />
1. Borgå K., Fisk A.T., Hoekstra P.F., Muir D.C.G.:<br />
Environ. Toxicol. Chem. 23, 2367 (2004).<br />
<strong>2.</strong> Hoffman D.J., Melancon M.J., Klein P.n., Eisemann<br />
J.D., Spann J.W.: Environ. Toxicol. Chem. 17, 747<br />
(1998).<br />
3. Ryckman D.P., Weseloh D.V., Hamp P. et al: Environ.<br />
Monitor. Assess. 53, 169 (1998).<br />
4. Dauwe T., Jaspers V., Covaci A., Schepens P., Eens.:<br />
Environ. Toxicol. Chem. 24, 442 (2005).<br />
5. Kubištová I.: Dissertation. University of Veterinary and<br />
Pharmaceutical Sciences Brno, Brno, Czech Republic,<br />
200<strong>2.</strong><br />
6. Houserova P., Kubáň V., Kráčmar S., Sitko J.: Environ<br />
Pollution 145, 185 (2007).
Chem. Listy, 102, s265–s1311 (2008) Environmental Chemistry & Technology<br />
L11 POTENTIAL APPLICAbILITy OF A<br />
hIGh PERFORMANCE ChELATION ION<br />
ChROMATOGRAPhIC METhOD TO ThE<br />
DETERMINATION OF ALuMINIuM IN<br />
ANTARCTIC SuRFACE SEAwATER<br />
JULIETTE TRIA, PAUL R. HADDAD and PAVeL<br />
nESTEREnKO<br />
Australia Centre for Research on Separation Science<br />
(ACROSS), School of Chemistry, University of Tasmania,<br />
Private Bag 75, Hobart, Tasmania, Australia, 7001,<br />
jtria@utas.edu.au<br />
Introduction<br />
In oceanography, aluminium is used as a tracer to fingerprint<br />
the location and magnitude of atmospheric dust deposition.<br />
Aluminium is particularly suitable as a tracer because<br />
of its short residence time in surface seawater, its relatively<br />
simple seawater chemistry and the fact that primary input to<br />
the open ocean is by atmospheric deposition. The information<br />
supplied by surface aluminium concentrations is vitally<br />
important to understanding the role that aeolian deposition<br />
plays in supplying trace elements to the surface ocean and<br />
subsequent effects on biological processes. The information<br />
is especially important for furthering knowledge of the biogeochemistry<br />
of iron. Iron is of particular interest because<br />
it is an essential element for the growth and metabolism of<br />
all marine organisms despite only being available in extremely<br />
low concentrations (0.1–0.5 nM) 1 . Iron has been shown<br />
to limit phytoplankton growth, which in turn may have<br />
implications on global climate through drawdown of gases<br />
used in photosynthesis, such as carbon dioxide. An accurate<br />
and robust method for determining aluminium is thus<br />
vital for continuing studies into atmospheric deposition and<br />
subsequently climate control.<br />
Flow injection analysis (FIA), has typically been used<br />
for the quantification of aluminium in seawater, due to its<br />
portability for shipboard use, suitable limit of detection and<br />
relative ease of use. However, this technique still requires<br />
preconcentration of as much as 10 ml of seawater in order to<br />
achieve the required sensitivity 2 . Other common techniques<br />
for the determination of trace concentrations of aluminium,<br />
such as ICP-MS, are unsuitable for use at sea due to the size<br />
of the instrumentation as well as the amount of sample pretreatment<br />
required.<br />
Chromatographic techniques have become increasingly<br />
popular for the quantification of aluminium in recent years.<br />
Ion chromatography has successfully been used for the separation<br />
of aluminium in a selection of matrices including natural<br />
waters 3–6 and biological samples 7 . The technique is relatively<br />
simple and can be coupled with a variety of detection<br />
methods such as UV-VIS and mass spectrometry, allowing<br />
for both high selectivity and sensitivity.<br />
Chelation ion chromatography (CIC) offers an alternative<br />
to traditional ion-exchange IC, particularly for samples<br />
of high ionic strength. CIC functions by retaining metal ions<br />
s319<br />
according to the stability of the corresponding complexes and<br />
allows for the separation and preconcentration of aluminium<br />
in complex samples. In addition, CIC also offers the advantages<br />
of using only one type of material for both preconcentration/matrix<br />
elimination and separation and also the ability<br />
to acquire a simplified chromatogram identifying only kinetically-labile<br />
and chemically inert species 8,9 . Ion-exchange<br />
interactions are likely to occur simultaneously; however, high<br />
ionic strength eluents are typically used to ensure chelation is<br />
the dominant mechanism.<br />
The iminodiacetic acid functional group has been shown<br />
to be a highly promising ligand for the separation of metal<br />
ions by CIC 10 . Our previous work has shown the applicability<br />
of iminodiacetic acid functionalised silica (IDAS) to<br />
the determination of aluminium in paper mill process water 11 .<br />
This work detailed the optimised separation conditions of an<br />
IDAS packed column including eluent composition, flowrate<br />
and column temperature. Good separation in a complex<br />
matrix was achieved, with high column efficiency.<br />
The most commonly used method for the detection of<br />
aluminium at low concentrations is the highly sensitive fluorescent<br />
detection of its lumogallion complex. This approach<br />
has been applied successfully to the determination of aluminium<br />
in a wide range of samples, including those with a high<br />
salt content, e.g. saline water and body fluids. nishikawa<br />
and co-workers were the first to describe application of the<br />
technique to seawater and the batch method has since been<br />
incorporated into FIA systems 12 . The limit of detection for<br />
the technique has been improved through the addition of surfactants<br />
and through optimisation of conditions such as pH<br />
and temperature.<br />
This paper is a continuation of our work with IDAS but<br />
for the specific purpose of the direct determination of aluminium<br />
in seawater. The determination of Al in seawater poses<br />
a myriad of potential problems including sample matrix interferences<br />
and extremely low concentrations. We have developed<br />
a HPCIC method coupled with fluorescent detection of<br />
the aluminium-lumogallion complex. The system has been<br />
successfully applied to seawater samples obtained in the Ross<br />
Sea, Antarctica.<br />
Experimental<br />
A p p a r a t u s<br />
A Metrohm 844 UV/VIS Compact IC was used for all<br />
analyses. The system delivered the eluent at 0.3 ml min –1 and<br />
was set up with a post-column reactor, consisting of a 2 m<br />
PTFE reaction coil (1/16” × 0.02”). This reactor was immersed<br />
in a water bath for heating above room temperature. Peristaltic<br />
pump tubing delivered the PCR reagent at a constant<br />
flow-rate of 0.36 ml min –1 . A 20 µl sample loop was used<br />
unless specified.<br />
A column heater set to 71 °C housed a 200 × 4 mm i.d.<br />
column packed with 5 µm IDAS (JPP Chromatography Ltd,<br />
UK). Detection was carried out using a Varian Prostar 363<br />
fluorescence detector fitted with a xenon lamp. The excitation<br />
and emission wavelengths were set to 500 and 550 nm
Chem. Listy, 102, s265–s1311 (2008) Environmental Chemistry & Technology<br />
respectively. The detector and Compact IC were connected<br />
through a Metrohm 830 IC Interface.<br />
R e a g e n t s<br />
All reagents were of an analytical grade. A naCl-HnO 3<br />
eluent (unless otherwise indicated) was made from stock<br />
2M and 1M solutions respectively. All solutions were prepared<br />
from a Milli-Q Element purification system, (Millipore,<br />
north Ryde, nSW, Australia). A stock 1M MES<br />
(Sigma, Castle Hill, nSW, Australia) buffer was made and<br />
pH adjusted to 6.05 (unless otherwise stated) with concentrated<br />
naOH. A stock 2M nH 4 OAc buffer was prepared from<br />
trace metal grade concentrated acetic acid (GFS Chemicals,<br />
Powell, Ohio, USA) and ammonia solution (isopiestic distilled<br />
concentrated nH 4 OH) and pH adjusted to 6.8. A stock<br />
3mM lumogallion (Pfaltz and Bauer, Waterbury, CT, USA)<br />
solution was prepared and refrigerated in dark conditions for<br />
up to 2 months. Working lumogallion buffers were prepared<br />
daily as were aluminium standards.<br />
S a m p l e s<br />
Surface seawater was collected aboard the Research<br />
Vessel nathaniel B Palmer (USA) by means of a towed fish.<br />
Samples were collected at a depth of approximately 7 m<br />
using trace metal clean procedures. The seawater was filtered<br />
(0.25 µm) and acidified to pH 2 using trace metal clean HCl.<br />
Results<br />
S e p a r a t i o n C o n d i t i o n s<br />
Optimum operating conditions for the separation of aluminium<br />
in complex matrices using IDAS have previously<br />
been detailed elsewhere 11 . The only modification to these<br />
conditions was the use of naCl rather than KCl in the eluent.<br />
The reason for this was the availability of high grade chemical<br />
reagent in order to ensure low background fluorescence.<br />
In summary these conditions were a 0.25M naCl–40mM<br />
HnO 3 eluent delivered at 0.3 ml min –1 with separation on a<br />
200 × 4 mm i.d. column packed with 5 µm IDAS at 71 °C.<br />
B a c k g r o u n d F l u o r e s c e n c e<br />
A significant dip in fluorescence away from the baseline<br />
before the elution of aluminium was observed in preliminary<br />
experiments. This dip was up to one fifth the size of the peak<br />
of a 0.1 ppm aluminium standard. It was decided that the<br />
probable cause was high background fluorescence due to the<br />
reagents used to prepare the eluent, in particular the chloride<br />
salt. Initially, KCl was used for the preparation of the eluent<br />
and despite choosing an analytical grade KCl, the level of<br />
aluminium contamination was obviously high. A solution to<br />
this was the addition of a trap column positioned before the<br />
separation column. The column was packed with Eichrom<br />
Diphonix ® resin (particle size 100–200 mesh). This resin has<br />
diphosphonic and sulfonic acid groups bonded to a polystyrene/divinylbenzene<br />
matrix. It is capable of extraction of a<br />
range of metals from both neutral and highly acidic solutions.<br />
The column, measuring 250 × 4 mm i.d., effectively removed<br />
s320<br />
the majority of the aluminium from the eluent, reducing the<br />
dip by a factor of 25. In addition, trace metal grade sodium<br />
chloride and nitric acid were used in the eluent for subsequent<br />
experiments.<br />
O p t i m i s a t i o n o f L u m o g a l l i o n<br />
C h e m i s t r y<br />
buffer and ph<br />
Work by Howard and co-workers 13 previously reported<br />
the optimum pH of the aluminium-lumogallion reaction to<br />
be between 4 and 5.5. Resing and Measures later found the<br />
maximum response to be in a much narrower range between<br />
pH 5 and 5.5(ref. 12 ). Based on this fact, MES was chosen<br />
as the buffer for initial experiments given its pK a of 6.27 at<br />
25 °C and subsequent useful buffering range 14 . Although initial<br />
chromatograms of a 1 ppm aluminium standard, using a<br />
40mM MES solution at pH 6.2, were promising in terms of<br />
sensitivity and efficiency, the pH of the effluent was found<br />
to be only <strong>2.</strong>9. Increasing the MES concentration to 120mM<br />
served to improve this situation, but also resulted in an increase<br />
in baseline noise and reduction in both sensitivity and efficiency.<br />
Consequently, it was decided to continue investigations<br />
using ammonium acetate, a buffer extensively used for<br />
the aluminium-lumogallion reaction.<br />
Firstly, the effect of varying the concentration of the<br />
ammonium acetate buffer on sensitivity was observed. This<br />
was carried out by diluting a stock 3M buffer (pH 6.7) to<br />
0.25. 0.5 and 1 M. The results indicated that a concentration<br />
of 0.25 M gave the best result in terms of peak area and also<br />
for achieving an effluent pH closest to optimum for the lumogallion<br />
reaction. It was shown that peak area of a 0.1 ppm<br />
aluminium standard increased almost 1 times through the use<br />
of 0.25M compared with 1M ammonium acetate and over<br />
8 fold compared with 40mM MES.<br />
Seawater samples intended for quantification of aluminium<br />
require acidification to between pH 1.8–<strong>2.</strong> Consequently,<br />
the buffer utilised in the lumogallion reaction<br />
needs to be able to maintain an optimum pH even on mixing<br />
with the acidified sample. The 0.25M ammonium acetate buffer<br />
was shown to have insufficient buffering capacity when<br />
mixed with an acidified sample. not only did the retention<br />
time decrease but a loss in sensitivity also resulted. Given<br />
that a decrease in sensitivity was also previously observed<br />
with an increase in buffer concentration for ammonium acetate,<br />
the only alternative was to increase the pH of the buffer.<br />
This was attempted but it appeared that even increasing the<br />
buffer pH to 8 resulted in little improvement. This meant that<br />
short of sacrificing sensitivity for buffering capacity, ammonium<br />
acetate was not the best choice for the analysis of acidified<br />
seawater.<br />
The choice of buffers capable of maintaining a pH of<br />
approximately 5.5 is fairly limited. This led to the decision<br />
to reinvestigate MES. For comparative proposes, a 0.25M<br />
solution of MES (pH adjusted to 6.05 with naOH) was firstly<br />
trialed. The result was an equivalent sensitivity to ammonium<br />
acetate but with the added advantage of no loss in sensitivity
Chem. Listy, 102, s265–s1311 (2008) Environmental Chemistry & Technology<br />
between acidified and non-acidified samples. Similarly, changes<br />
in retention times were negligible. The remaining issue<br />
with the use of MES was the increase in baseline noise and<br />
subsequent increase in detection limits. This problem was<br />
overcome by pre-cleaning the buffer using a column packed<br />
with Eichrom Diphonix ® resin. The resulting baseline noise<br />
reduced approximately three times and the corresponding<br />
background fluorescence was almost seven times less.<br />
It was thus determined that a pre-cleaned buffer of<br />
0.25M MES adjusted to a pH of 6.05 with naOH, was the<br />
optimum choice for the determination of aluminium in acidified<br />
seawater samples.<br />
Temperature<br />
The response of the reaction between aluminium and<br />
lumogallion has been investigated in both batch techniques<br />
and flow systems. In the batch method, an optimal temperature<br />
of 80 °C is generally accepted 13,15 , whereas FIA methods<br />
tend to use 50 °C. The latter is based on investigations carried<br />
out by Resing and Measures which concluded that most of<br />
the temperature-based reaction rate gain had been achieved<br />
by this temperature 12 . Independent investigation into the effect<br />
of temperature on the rate of reaction was undertaken by<br />
us due to the fact a different buffer was used. It was found<br />
that the highest response, in terms of peak area, was obtained<br />
at temperatures between 65 and 75 °C (Fig. 1.). Based on this<br />
response, 70 °C was chosen as the temperature at which to<br />
operate the post column reactor for all subsequent anlyses.<br />
Fig. 1. Dependence of fluorescence response on temperature<br />
Lumogallion and Reaction Coil<br />
The extent of chemical reaction needs not be complete<br />
for an analytical technique to be valid. However, it is desirable<br />
to obtain as high a reaction yield as possible in order<br />
to ensure the technique has good precision. For the reaction<br />
between aluminium and lumogallion, the concentration of<br />
post-column reagent may be changed, along with temperature<br />
and reaction time, in order to control the extent of reaction.<br />
Three concentrations of lumogallion (0.03, 0.04 and<br />
s321<br />
0.05 mM) were tested in order to exhaust possible improvements<br />
to the system via this approach. The concentrations<br />
chosen were based on those used in flow systems. It was<br />
found that at concentrations higher than 0.03 mM, no significant<br />
improvements were achived. Additionally, the effect of<br />
increasing the length of the post column reaction coil from<br />
2m to 4m was also studied. The result, however, was a slight<br />
reduction in fluorescence. A MES buffer containing 0.03 mM<br />
lumogallion together with a 2m reaction coil were thus used<br />
in all subsequent analyses.<br />
Surfactant<br />
Howard and co-workers reported an increase in the fluorescence<br />
intensity of the aluminium-lumogallion complex<br />
of as much as 5-fold through the addition of a non-ionic<br />
surfactant 13 . Further investigation has been carried out by<br />
Resing and Measures 12 , which showed that Brij-35 enhanced<br />
fluorescence to a greater extent than other surfactants, such as<br />
Triton X-100 and cetylammonium bromide (CTAB). In order<br />
to ensure the lowest limit of detection was achieved for this<br />
system, an investigation into the effect of surfactants was also<br />
carried out. The results differed substantially from those discussed<br />
earlier. It was found that although the addition of Brij-<br />
35 enhanced fluorescence marginally, a simultaneous increase<br />
in baseline noise negated any improvement achieved.<br />
Interestingly, when CTAB was tested, the aluminium peak<br />
disappeared altogether. This was considered to be an effect<br />
of the surfactant adhering to the tubing walls and effectively<br />
stripping the aluminium from the reagent stream. The system<br />
required flushing with methanol in order to resume normal<br />
operation. Consequently, further investigation into the<br />
possible use of surfactants was abandoned, with the decision<br />
to explore other approaches to lowering the detection limit<br />
being deemed more favourable.<br />
S a m p l e V o l u m e<br />
A more attractive approach for achieving a low LOD<br />
was increasing the sample loop volume. All previous experiments<br />
had been carried out using a volume of 20 µl. The<br />
response of the system to higher volumes was investigated<br />
and the results are depicted in Fig. <strong>2.</strong> It can be seen that for<br />
volumes between 20 and 500 µl, the system follows a linear<br />
response, as expected. It was also noteworthy that no reduction<br />
in column efficiency was experienced at higher volumes.<br />
The highest efficiency was achieved for a 100 µl sample<br />
loop, which was unexpected considering that band broadening<br />
is generally associated with increased sample size and<br />
is often responsible for an observed reduction in performance<br />
of the chromatographic column as injection volume is increased.<br />
Another unexpected result of increasing the sample<br />
volume was an increase in retention time. Generally, a decrease<br />
in retention time would be expected due to competition<br />
from other analytes for chelation sites, especially in such a<br />
complex matrix as seawater. This was shown not to be the<br />
case for IDAS and may be explained in terms of the forma-
Chem. Listy, 102, s265–s1311 (2008) Environmental Chemistry & Technology<br />
tion of negatively charged aluminium complexes in seawater<br />
(e.g. fluoro complexes) and the high ionic strength of the eluent.<br />
The effect of ionic strength has been reported to affect<br />
the retention of ions in chelation IC 8,16 . In an environment<br />
of sufficiently high ionic strength the repulsion between<br />
negatively charged aluminium species and the iminodiacetic<br />
acid functional groups may be reduced. This can result<br />
in a subsequent increase in retention time as observed in our<br />
studies. This response is actually considered favourable as it<br />
allows for additional stabilisation of the baseline between the<br />
minor dip in fluorescence and elution of the aluminium.<br />
Fig. <strong>2.</strong> Effect of increasing sample volume on column performance<br />
and fluorescence response<br />
S e a w a t e r S a m p l e s<br />
At this stage, the optimised HPCIC system coupled with<br />
fluorescence detection had been shown to be applicable to the<br />
determination of aluminium in acidified standards prepared<br />
in Milli-Q water. Previous work by us has shown that IDAS<br />
can be successfully applied to the analysis of samples with a<br />
complex matrix but it had not yet been used for the detection<br />
of aluminium in seawater. Seawater is difficult to analyse not<br />
only in terms of the high salt content, but also due to the<br />
number of other potentially interfering ions, such as iron and<br />
magnesium. However, preliminary chromatograms showed<br />
no co-elution problems and there was only one additional<br />
peak (at ~ 8 min) other than aluminium. Based on previous<br />
findings this peak is likely to be due to iron and/or a mixture<br />
other analytes e.g. sodium and calcium.<br />
Calibration of the system using a 500 µl sample loop<br />
was carried out by means of standard addition to an Antarctic<br />
seawater sample containing low levels of aluminium. The<br />
limit of detection was determined from the standard deviation<br />
of clean seawater and determining the signal equivalent to<br />
three times this value (i.e. 3σ). A LOD of 0.39 nM was achieved<br />
using a 500 µl sample loop. Good linearity of the system<br />
was observed between 1.8 and 36 nM.<br />
Chromatograms of Antarctic seawater for different injection<br />
volumes are given in Fig. 3.<br />
s322<br />
Fig. 3. Chromatogram of Antarctic seawater for different injection<br />
volumes<br />
Conclusions<br />
The optimised HPCIC system with fluorescence detection<br />
of the aluminium-lumogallion complex shows<br />
promise for the quantification of aluminium in Antarctic<br />
seawater. The IDAS chromatographic column does not suffer<br />
from issues such as co-elution of species with aluminium and<br />
produces peaks of good efficiency in a reasonable timescale.<br />
The response of the system to standard addition is linear and<br />
is applicable over a concentration range valid to seawater<br />
analysis. Additionally, the LOD achievable with the system<br />
means it should be capable of handling the low concentrations<br />
of aluminium expected in Antarctic seawater.<br />
At this stage, the system has not been successfully<br />
applied to the quantification of aluminium in a seawater<br />
sample. The method currently suffers from an enhanced<br />
fluorescent response most likely due to matix interferences<br />
of seawater. It is difficult to determine the extent of this<br />
enhancement since there is not a certified seawater reference<br />
material for aluminium; but it is believed that, at present, the<br />
system produces a response approximately three times higher<br />
than the true value. Studies are underway to eliminate<br />
this problem and are currently focusing on the removal or<br />
adequate separation of aluminium from the remainder of the<br />
seawater matrix.<br />
REFEREnCES<br />
1. Johnson K. S., Gordon R. M., Coale K. H.: Mar. Chem.<br />
57, 137 (1997).<br />
<strong>2.</strong> Brown M. T., Bruland K. W.: Limnol. Oceanogr.:<br />
Methods. 6, 87 (2008).<br />
3. Drabek O., Mladkova L., Boruvka L., Szakova J.,<br />
nikodem A., nemecek K.: J. Inorg. Biochem. 99, 1788<br />
(2005).<br />
4. Mitrovic B., Milacic R., Pihlar B., Simoncic P.: Analusis.<br />
26, 381 (1998).<br />
5. Fairman B., Sanz-Medel A., Jones P., Evans E. H.: Analyst.<br />
123, 699 (1998).
Chem. Listy, 102, s265–s1311 (2008) Environmental Chemistry & Technology<br />
6. Kozuh n., Milacic R., Gorenc B., Abollino O., Sarzanini<br />
C.: Int. J. Enviro. Anal. Chem. 67, 27 (1997).<br />
7. Lian H. Z., Kang Y. F., Bi S. P., Yasin A., Shao D. L.,<br />
Chen Y. J., Dai L. M., Tian L. C.: Anal. Bioanal. Chem.<br />
376, 542 (2003).<br />
8. Jones P., nesterenko P. n.: J. Chrom. A. 789, 413<br />
(1997).<br />
9. nesterenko P. n., Jones P.: J. Sep. Sci. 30, 1773 (2007).<br />
10. nesterenko P. n., Shpigun O. A.: Russ. J. Coord. Chem.<br />
28, 726 (2002).<br />
11. Tria J., Butler E. C. V., Haddad P. R., Bowie A. R.: Anal.<br />
Chim. Acta. 588, 153 (2007).<br />
s323<br />
1<strong>2.</strong> Resing J. A., Measures C.I.: Anal. Chem. 66, 4105<br />
(1994).<br />
13. Howard A. G., Coxhead A. J., Potter I. A., Watt A. P.:<br />
Analyst. 111, 1379 (1986).<br />
14. Martell A. E., Smith R. M.: nIST Critically selected<br />
stability constants of metal complexes database. Version<br />
8.0. Texas A & M University, Texas 1998.<br />
15. Hydes D. J., Liss P. S.: Analyst. 101, 922 (1976).<br />
16. Saldadze K. M., Kopylova-Valova V. D.: Kompleksoobrazyushie<br />
Ionity (Complexing Ion Exchangers). Khimiya,<br />
Moscow 1980.
Chem. Listy, 102, s265–s1311 (2008) Environmental Chemistry & Technology<br />
L12 DIRECT ANALySIS IN REAL TIME – TIME-<br />
OF-FLIGhT MASS SPECTROMETRy:<br />
ANALySIS OF PESTICIDE RESIDuES AND<br />
<strong>ENVIRONMENTAL</strong> CONTAMINANTS<br />
LUKአVáCLAVíK, JAKUB SCHůREK, TOMáŠ<br />
ČAJKA and JAnA HAJŠLOVá<br />
Department of Food Chemistry and Analysis, Institute of<br />
Chemical Technology Prague, Technicka 5,166 28 Prague 6<br />
– Dejvice, Czech Republic,<br />
lukas.vaclavik@vscht.cz<br />
Introduction<br />
Ambient desorption ionization mass spectrometry (MS)<br />
is a rapidly growing area representing an attractive alternative<br />
to conventional analytic approaches. Recently introduced<br />
ionization techniques, such as direct analysis in real<br />
time (DART) 1 , desorption electrospray ionization (DESI) 2 or<br />
atmospheric pressure solids analysis probe (ASAP) 3 , allow<br />
direct examination of various types of samples in the open<br />
atmosphere and at ground potential. Little or no sample treatment<br />
prior to analysis is required. Additionally, time-consuming<br />
separation of sample components, which is usually<br />
employed by chromatographic methods, can be omitted with<br />
ambient MS. 4<br />
The ionization process with DART is based on interactions<br />
of metastable atoms of gas with atmosphere (H 2 O, O 2 )<br />
and sample components. The gas (usually helium) flows through<br />
a tube divided into several compartments. In a discharge<br />
chamber, ions, electrons and metastables are formed. In the<br />
next step, charged species are removed from the gas stream<br />
and heated gas promotes the desorption process. Ionization<br />
of the sample occurs in the area between the ion source and a<br />
mass spectrometer inlet (sampling gap). DART provides relatively<br />
simple mass spectra characterized mainly by [M + H] +<br />
and [M] + in positive-ion mode or [M – H] – and [M] – in negative-ion<br />
mode. 1 It is worth to notice, that DART technique<br />
has common features with atmospheric pressure chemical<br />
ionization (APCI) as the formation of metastables take place<br />
in an electrical discharge. 1,4<br />
DART ion source can be hyphenated to any type of mass<br />
spectrometer. However, when coupled to a high-resolution<br />
time-of-flight mass spectrometer (TOFMS), accurate mass<br />
measurement is enabled, allowing the confirmation of target<br />
analyte identity and calculations of elemental compositions<br />
of “unknowns”. For correct identification of “unknowns”, it<br />
is essential to gain knowledge about the examined matrix to<br />
allow discrimination of potential compounds suggested by<br />
the software.<br />
Until now, very few papers dealing with applications of<br />
DART have been published. 5-9 In following examples, the<br />
potential of DART–TOFMS technique for qualitative and<br />
quantitative analysis of (i) pesticide residues, in particular<br />
case, strobilurins in wheat grains, (ii) thiabendazole on cutflower<br />
leaves, and (iii) rapid screening of brominated flame<br />
s324<br />
retardants (BFRs) in in-door dust extract, will be demonstrated.<br />
Experimental<br />
C h e m i c a l s<br />
Pesticide standards (≥ 99 %) were obtained from Dr.<br />
Ehrenstorfer (Germany), decabromodiphenyl ether (BDE-<br />
209) standard (≥ 98 %) was provided by Cambridge Isotope<br />
Laboratories (USA). Solvents used for sample extractions<br />
and preparations of standard solutions were HPLC-grade.<br />
Poly(ethylene glycol) 600 was from Sigma-Aldrich (Germany),<br />
anhydrous na 2 SO 4 was supplied by Merck (Germany).<br />
S a m p l e P r e p a r a t i o n<br />
(i) An amount of 1<strong>2.</strong>5 g of milled wheat grains was<br />
spiked with an internal standard (prochloraz) at a concentration<br />
of 250 ng g –1 and extracted by shaking with 50 ml of<br />
ethyl acetate and 10 g of anhydrous na 2 SO 4 . The suspension<br />
was filtered and the volume was reduced by evaporation to<br />
25 ml. Similarly, wheat grain extracts spiked with strobilurins<br />
(azoxystrobin, kresoxim methyl, pyraclostrobin, trifloxystrobin,<br />
dimoxystrobin and picoxystrobin) in the range from 12<br />
to 1200 ng g –1 were prepared. Wheat grains with incurred<br />
residues of azoxystrobin, kresoxim methyl and pyraclostrobin<br />
(reference material) were processed as described above.<br />
(ii) Flowers (roses) were purchased from local florists<br />
shop. The leaf was separated from the rest of flower and its<br />
surface was directly analyzed.<br />
(iii) In-door dust containing BFRs (mainly BDE-209)<br />
was extracted using ASE 300 pressurized liquid extraction<br />
system (Dionex, USA): a hexane–acetone (1 : 1, v/v) mixture<br />
was used for extraction. The residues of extract were dissolved<br />
in isooctane.<br />
D A R T – T O F M S A n a l y s i s<br />
For DART–TOFMS analyses, the system consisting of<br />
a DART ion source (IonSense, USA), a JEOL AccuTOF LP<br />
high-resolution mass spectrometer [JEOL (Europe) SAS,<br />
France], and an AutoDART HTC PAL autosampler (Leap<br />
Technologies, USA) was used. Helium gas was flowed at<br />
<strong>2.</strong>9 dm 3 min –1 , discharge needle voltage was ± 3000 V, while<br />
perforated and grid electrode voltages were set to ± 150 V<br />
and ± 250 V, for positive and negative-ion mode, respectively.<br />
Other system parameter settings were changed depending<br />
on examined analytes, as summarized in Table I. To<br />
monitor bromine fragment ions originated from BDE-209,<br />
the cone voltage of the mass spectrometer was adjusted as<br />
described in results section.<br />
Automated introduction of liquid samples was carried<br />
out with the use of Dip-it tips (IonSense, USA). Solid samples<br />
(flower leaves) were introduced manually by placing<br />
them in front of DART source. Poly(ethylene glycol) 600<br />
solution (200 μg ml –1 ) was introduced at the end of each<br />
sample analysis to perform internal mass calibration (mass<br />
drift compensation). The mass resolution of the instrument
Chem. Listy, 102, s265–s1311 (2008) Environmental Chemistry & Technology<br />
Table I<br />
DART–TOFMS parameter settings<br />
Analytes Polarity<br />
Beam Ion guide<br />
temp. [°C] voltage [V]<br />
Strobilurins Positive 300 1000<br />
Thiabendazole Positive 150 800<br />
BDE-209 negative 300 600<br />
Bromine ions negative 350 400<br />
during the measurements was typically 6,000 full width at<br />
half maximum (fwhm).<br />
Results<br />
A n a l y s i s o f S t r o b i l u r i n s<br />
The strobilurins and prochloraz (internal standard) were<br />
detected as [M + H] + ions (see Fig. 1.). A high mass resolving<br />
power of TOFMS instrument enabled the identity confirmation<br />
of target analytes on the basis of elemental composition<br />
calculations; the differences between measured (accurate) and<br />
calculated (exact) masses ranged from –<strong>2.</strong>27 to 5.10 ppm.<br />
Fig. <strong>2.</strong> shows the total ion current (TIC) record of six<br />
injections of wheat grain extract spiked with strobilurins<br />
(240 ng g –1 ) and prochloraz (250 ng g –1 ). Unfortunately, the<br />
Fig. 1. Dart positive mass spectrum of wheat grain extract<br />
spiked with strobilurins (240 ng g –1 ) and prochloraz (250 ng g –1 );<br />
(1) Kresoxim methyl, (2) Dimoxystrobin, (3) Picoxystrobin, (4)<br />
Prochloraz, (5) Pyraclostrobin, (6) Azoxystrobin, (7) Trifloxystrobin<br />
Fig. 2 TIC chromatogram of six repeated wheat grain extract<br />
introductions [(1)–(6)] followed by PEG 600 solution (7)<br />
s325<br />
Fig. 3. Examples of calibration curves of matrix-matched strobilurin<br />
standards<br />
absolute response of the detector, even when employing<br />
autosampler, was poorly repeatable because of the dependence<br />
of position of the sampling tip and the sampling gap.<br />
Therefore, an internal standard had to be used for quantification<br />
of strobilurin residues. Calibration plots obtained by<br />
analyses of matrix-matched standards (see Fig. 3.) were constructed<br />
by plotting the ratio of analyte/internal standard ion<br />
intensity vs. concentration of particular analyte. Acceptable<br />
linearity was obtained for tested concentration range, regression<br />
coefficients of calibration curves were higher than 0.99.<br />
In the next step, basic performance characteristics of the<br />
method were estimated using spiked samples. The repeatability<br />
was in the range from 8 to 15 % (n = 6, 60 ng g –1 ), LOQs<br />
(limits of quantification) ranged from 12 to 30 ng g –1 . Considering<br />
the European regulation requirements, this method<br />
can be useful for rapid control of strobilurin residues in wheat<br />
grains 10 . For comparative purposes, wheat grain sample containing<br />
incurred residues of strobilurins was analyzed using<br />
Table II<br />
DART–TOFMS and LC–MS/MS methods: Analysis of incurred<br />
residues in wheat grains<br />
Analyte Concentration[ng g–1 ]<br />
DART–TOFMS LC–MS/MS<br />
Azoxystrobin 445 429<br />
Kresoxim methyl 45 52<br />
Pyraclostrobin 202 190
Chem. Listy, 102, s265–s1311 (2008) Environmental Chemistry & Technology<br />
in-house validated method employing liquid chromatography–tandem<br />
mass spectrometry (LC–MS/MS). A good agreement<br />
of the results generated by two alternative approaches is<br />
documented in Table II.<br />
D i r e c t D e t e c t i o n o f T h i a b e n d a z o l e<br />
i n P l a n t L e a f<br />
In this experiment, the possibility to monitor pesticide<br />
residues directly from the surface of the flower leaf was examined.<br />
For this purpose, the temperature of gas beam was<br />
decreased to 150 °C. Fig. 4.(A) shows positive mass spectrum<br />
of the leaf surface obtained by DART–TOFMS. In zoomed<br />
mass spectrum (Fig. 4.(B)), ion m/z 20<strong>2.</strong>04410 corresponding<br />
to protonated thiabendazole molecule [C 10 H 8 n 3 S] + (theoretical<br />
mass m/z 20<strong>2.</strong>04389) was observed. no other pesticide<br />
compounds were detected in examined sample.<br />
Fig. 4. DART positive mass spectrum of flower leaf; (A) m/z<br />
50–600, (b) m/z 200–206. The ion m/z 20<strong>2.</strong>04410 corresponds to<br />
thiabendazole<br />
S c r e e n i n g o f B F R s i n I n - D o o r D u s t<br />
The most common methods used in analysis of BFRs<br />
employ gas chromatography coupled to mass spectrometry<br />
(GC–MS) operated in negative chemical ionization mode<br />
(nCI) 11 . The ions [ 79 Br] – and [ 81 Br] – are typically the base<br />
peaks in nCI mass spectra of these compounds and due to<br />
their selectivity they are frequently used for quantification<br />
purposes 12 . Supposing some similarity of BFRs fragmentation<br />
under nCI conditions in GC–MS and negative APCI,<br />
Fig. 5. DART negative mass spectrum of bDE-209 standard<br />
solution (50 μg ml –1 ); (A) beam temp.: 300 °C, cone volt.: –20 V,<br />
(b) beam temp.: 350 °C, cone volt.: –140 V<br />
s326<br />
DART–TOFMS was proposed as a suitable approach for<br />
rapid screening of BFRs.<br />
In the first phase of this experiment, the ionization of<br />
BDE-209 by DART was investigated. As documented in<br />
Fig. 5.(A), phenolate anions resulting from the cleavage of<br />
the ether bridge and anions resulting from bromine abstraction<br />
were observed after introduction of BDE-209 standard<br />
solution. To induce fragmentation, the cone voltage was<br />
decreased from -20 V to -140 V. Under these conditions,<br />
intensive [ 79 Br] – and [ 81 Br] – ions were the only ions in recorded<br />
mass spectrum (Fig. 5.(B)).<br />
Fig. 6. DART negative mass spectrum of in-door dust extract;<br />
(A) cone volt.: –140 V, (b) cone volt.: –200 V, (C) cone volt.:–<br />
240 V<br />
While it was not possible to detect BFRs in dust extract<br />
due to high chemical noise, both bromine ions were distinctly<br />
recognized when fragmentation was induced (Fig. 6.(A)). To<br />
remove interfering ion with a mass close to [ 79 Br] – , an attempt<br />
to induce its fragmentation was undertaken. As shown in<br />
Fig. 6.(B) and Fig. 6.(C) this was achieved by further decrease<br />
of cone voltage value.<br />
Conclusions<br />
DART–TOFMS technique can be used for determination<br />
of strobilurin fungicides in milled wheat grain extracts<br />
obtained by simple extraction procedure without time-consuming<br />
chromatographic separation. This method withstands<br />
the regulation demands of the European Union for the control<br />
of pesticide residues; moreover, simplified workflow enables<br />
examination of many samples within a short time period.
Chem. Listy, 102, s265–s1311 (2008) Environmental Chemistry & Technology<br />
Qualitative analysis of solid samples without any sample<br />
preparation is a challenging application of this novel<br />
technique. DART–TOFMS was shown to be a useful tool<br />
enabling rapid examination of plant surface and detection of<br />
pesticide used for flower treatment.<br />
Preliminary results indicate the potential to introduce<br />
new concepts into rapid screening of BFRs by employing<br />
DART–TOFMS. In addition, the information provided by<br />
both negative and positive mass spectra should be exploited<br />
with the aim to detect the presence of other contaminants.<br />
Of course, more follow-up research is needed, with a special<br />
focus on quantification of target compounds and identification<br />
of unknowns.<br />
This study was undertaken within the project MSM<br />
6046137305 supported by the Ministry of Education, Youth<br />
and Sport of the Czech Republic. The authors wish to thank to<br />
JEOL (Europe) SAS for a loan of the JEOL AccuTOF DART<br />
system for testing purpose.<br />
REFEREnCES<br />
1. Cody R. B., Laramee J. A., Durst H. D.: Anal. Chem 77,<br />
2297 (2005).<br />
<strong>2.</strong> Takats Z, Wiseman J. M., Gologan B., Cooks R. G.:<br />
Science 306, 471 (2004).<br />
s327<br />
3. McEwen C. n., McKay R. G., Larsen B., S.: Anal.<br />
Chem. 77, 7826 (2005).<br />
4. Venter A., nefliu M., Cooks R. G.: Trends Anal. Chem.<br />
in press (2008).<br />
5. Williams J. P., Patel V. J., Holland R., Scrivens J. H.:<br />
Rapid Commun. Mass Spectrom. 20, 1447 (2006).<br />
6. Petucci C., Diffendal J., Kaufman D., Mekonnen B.,<br />
Terefenko G., Musselman B.: Anal. Chem. 79, 5064<br />
(2007).<br />
7. Haefliger O. P., Jeckelmann n.: Rapid Commun. Mass<br />
Spectrom. 21, 1361 (2007).<br />
8. Morlock G., Ueda Y.: J. Chromatogr. A 1143, 243<br />
(2007).<br />
9. Cajka T., Vaclavik L., Riddellova K., Hajslova J.: LC<br />
GC Eur. 21, 250 (2008).<br />
10. EC (European Communities), Council directive 97/57/<br />
EC establishing Annex VI to directive 91/414/EC concerning<br />
the placing of plant protection products on the<br />
market Off. J. Eur.Commun. L265 (1997).<br />
11. Xie Z., Ebinghaus R.: Anal. Chim. Acta 610, 156<br />
(2008).<br />
1<strong>2.</strong> Cajka T., Hajslova J., Kazda R., Poustka J.: J. Sep. Sci.<br />
28, 601 (2005).
Chem. Listy, 102, s265–s1311 (2008) Environmental Chemistry & Technology<br />
L13 APPLICATION OF NEEDLES AS<br />
bIOINDICATORS FOR ThE EVALuATION<br />
OF PERSISTENT ORGANIC POLLuTANTS<br />
<strong>ENVIRONMENTAL</strong> CONTAMINATION LEVEL<br />
M. VáVROVá a,b , R. LánA a , M. HROCH a , J.<br />
ČáSLAVSKý a , I. HLAVáČKOVá a and B. TREMLOVá b<br />
a Brno University of Technology, Faculty of Chemistry; Purkyňova<br />
118, 612 00 Brno, Czech Republic<br />
b University of Veterinary and Pharmaceutical Sciences Brno,<br />
Faculty of Veterinary Hygiene and Ecology,<br />
vavrova@fch.vutbr.cz<br />
Introduction<br />
Bioindicators are living organisms in which concentrations<br />
of organic pollutants considerably exceed those found<br />
in air, water, sediments, or soil. Bioindicators, which are<br />
frequently used in monitoring studies and screenings, should<br />
allow selective and specific determination of contaminants<br />
not only in all compartments of the environment, but also<br />
in all links of food chains of species living in the area under<br />
study. Contaminants detectable by the use of bioindicators<br />
include also PCB indicator congeners 28, 52, 101, 118, 138,<br />
153, 180 which rank with priority pollutants monitored in the<br />
Czech Republic 1 . Plant bioindicators are used in environmental<br />
studies of agrarian ecosystems in our country where they<br />
can yield information for both conventional monitoring and<br />
biomonitoring. The most frequently used plant species are<br />
alfalfa, cereals, and oil plants 2 . The source of contamination<br />
is of great importance. Monitoring of PCBs can often identify<br />
long-distance transport as one of the contamination sources.<br />
Airborne volatile PCBs can originate from various sources<br />
including agricultural production 3 . Thus, PCBs penetrate into<br />
plant tissues and influence the contamination level. Papers<br />
dealing with the contamination of crops by xenobiotics are<br />
rather scarce. Most of the respective investigations were carried<br />
out in fodder plants and were oriented rather on effects of<br />
feeding of contaminated crops to farm animals 1 .<br />
Of all above-mentioned plant bioindicators, coniferous<br />
plants except for larch have the greatest informative value<br />
when the leaf analysis method is used. needles do not fall<br />
off every year as compared to deciduous trees, and one may<br />
monitor a degree of burden using different methods such<br />
as the discoloration of assimilatory organs, sudden changes<br />
in coloration, excessive leaf-fall, crown thinning, partial or<br />
complete dieback of trees, and particularly the above-mentioned<br />
methods of leaf analysis.<br />
Knowledge of the level of contamination of this link of<br />
the food chain is therefore necessary for studies of xenobiotic<br />
transfer 1,4 . Comprehensive studies of plant contamination<br />
were completed in Moravian areas affected by disastrous floods<br />
in 1997 and 1998. Effects of floods on the contamination<br />
of soil and vegetation by persistent organic substances are<br />
summarized in the „Report on the 1998 Monitoring Results<br />
- Hazardous Substances within Food Chains and Influencing<br />
s328<br />
Imputes published by the Ministry of Agriculture of the<br />
Czech Republic in 1998 2 .<br />
Synthetic xenobiotics are included in persistent organic<br />
pollutants (POPs) group; they represented a significant risk to<br />
the environment owing to their physico-chemical and toxicological<br />
properties.<br />
PBDEs are aromatic substances whose structures resemble<br />
that of PCBs (see Fig. 1.).<br />
Fig. 1. PbDEs and PCbs<br />
The numbering of individual PBDE congeners, whose<br />
total sum is 209, complies with the IUPAC nomenclature<br />
used in the numbering of PCBs.<br />
P h y s i c o c h e m i c a l P r o p e r t i e s o f<br />
P B D E s<br />
Tri- (major congener 28), tetra- (47), penta- (99, 100),<br />
hexa- (153, 154), hepta- (183) and deka-(209) are the most<br />
commonly used PBDE groups which also occur most<br />
frequently in the environment.<br />
PBDEs are lipophilic and persistent substances that<br />
show low solubility in water. Because of their high resistance<br />
against acids, bases, heat, light, and redox reactions, they<br />
pose a significant risk to the environment. When they enter<br />
the environment, they remain there for a prolonged period<br />
of time due to their physical-chemical properties. The octanol/water<br />
partition coefficient (log K ow ) is another important<br />
characteristic of these compounds. The values of their log K ow<br />
vary in a range of 5.98 (28)–9.97 (209), which indicates that<br />
these substances are highly hydrophobic.<br />
Upon excessive heating and burning, PBDEs will<br />
decompose to very toxic substances such as polybrominated<br />
dibenzo-p-dioxins (PBDD) and dibenzofuranes (PBDF).<br />
The melting point of PBDEs varies from 64 °C (BDE 28) to<br />
30<strong>2.</strong>5 °C (BDE 209) whereas many congeners are liquids at<br />
standard conditions.<br />
PBDEs are used as fire retardants. In this application the<br />
ideal situation is when a retardant decomposes at a temperature<br />
by about 50 °C lower than that of a polymer – PBDEs<br />
meet this requirement with a number of polymers.<br />
P r o d u c t i o n<br />
The industrial synthesis of PBDEs usually proceeds through<br />
catalytic reaction between a diphenyl ether and bromine,<br />
yielding a mixture of different isomers. Alternatively,<br />
PBDE may also be prepared from phenolate and bromobenzene<br />
or by allowing diphenyliodonium salt to react with bromophenolate.
Chem. Listy, 102, s265–s1311 (2008) Environmental Chemistry & Technology<br />
novel synthetic procedures have been recently developed.<br />
One of the most significant developed procedures uses<br />
2,5-dibromo-4-fluoronitrobenzene as a precursor to produce<br />
congeners 153 and 154 or employs a modified Sinaki reaction<br />
to prepare congener 81.<br />
I n d u s t r i a l U s e o f P B D E s<br />
DekabDE<br />
This compound is extensively used in “high-impact”<br />
polystyrenes, thermoplastic polyester resins, acrylonitrilebutadiene-styrene<br />
rubber, nylon, PVC, and elastomers. BDE<br />
209 is also widely used in isolation materials for electric<br />
cables. There is a large number of commercial products based<br />
on BDE 209 such as widely used Bromkal 81, DE 83, FR-<br />
1210, Chemflam 011, Hexcel PF1.<br />
OktabDE<br />
OktaBDE congeners are mainly used in computer components<br />
and the components of office instruments. Furthermore,<br />
they are also known to be used in various thermoplastics,<br />
adhesives and coating compositions. Bromkal 79-8 DE,<br />
FR 143, Tardex 80, etc. are commercial names of widely used<br />
mixtures.<br />
HexabDE<br />
HexaBDE together with pentaBDE congeners are contained<br />
in commercial mixtures (for example BR 33 A).<br />
PentabDE<br />
Commercial mixtures are used as additives in epoxyresins,<br />
phenol resins, and textiles. This particularly applies to<br />
DE 71, FR 1205/1210, Bromkal 70, Bromkal 61. The Bromkal<br />
70-5 DE mixture (34 % tetraBDE, 60 % pentaBDE and<br />
6 % hexaBDE) was widely used in the past.<br />
TetrabDE<br />
TetraBDE congeners have identical applications as pen-<br />
Table I<br />
Polychlorinated biphenyls in needles<br />
s329<br />
taBDE. The average levels of congeners in the commercially<br />
used mixture are as follows: 41 % of tetraBDE congeners,<br />
45 % pentaBDE congeners, 6 % hexaBDE congeners, and<br />
about 8 % of PBDE of unknown structure. Some groups of<br />
BDEs are not produced individually but occur as impurities in<br />
commercial mixtures (for example nonaBDE or heptaBDE).<br />
The least brominated classes of congeners such as triBDE,<br />
diBDE, and monoBDE, are neither produced commercially,<br />
nor used otherwise.<br />
General use of bDEs<br />
More than one half of PBDEs is used in the production<br />
of electric and electronic devices and components, with<br />
DekaBDE, OktaBDE and PentaBDE being used most widely,<br />
as mentioned above. The highest levels of PBDEs occur<br />
in domestic appliances. The reason is that the devices of this<br />
kind (TV sets, vacuum cleaners) contain the highest portion<br />
of plastics, as compared to other above-mentioned classes of<br />
devices, with fire retardants being usually bound to such plastic<br />
materials.<br />
Experimental<br />
Samples were taken in several locations. Organochlorine<br />
pesticides (DDT and its metabolites, γ-HCH and HCB),<br />
polychlorobiphenyls (PCB) and polybromodiphenylethers<br />
(PBDE) were selected for analysis. The isolation of tracked<br />
analytes from plant matrices was performed by the means<br />
of extraction processes, namely via sonication and Soxhlet<br />
extraction, extract purification was realized by column<br />
chromatography. The final determination was performed by<br />
gas chromatography with μECD detection and the confirmation<br />
analyses by gas chromatography and mass spectrometric<br />
detection.The procedure is summarized in following<br />
Scheme 1.<br />
Concentration [ng g –1 ]<br />
CB 28 CB 52 CB 101 CB 118 CB 138 CB 153 CB 180<br />
Pine 0.25 0.10 0.07 0.06 0.06 0.07 –<br />
Fir 0.33 0.12 0.09 0.10 0.07 0.12 0.05<br />
Blue Spruce 0.30 0.09 0.07 0.08 0.10 0.09 0.04<br />
Table II<br />
Organochlorinated pesticides in needles<br />
Concentration [ng g –1 ]<br />
4,4’-DDT 4,4’-DDE 4,4’-DDD 2,4’-DDT 2,4’-DDE 2,4’-DDD γ-HCH HCB<br />
Pine 0.08 0.17 < LOQ < LOQ nD nD 0.15 0.15<br />
Fir 0.21 0.24 0.07 0.14 < LOQ nD 0.12 0.09<br />
Blue Spruce 0.11 0.11 0.04 0.11 nD nD 0.13 < LOQ
Chem. Listy, 102, s265–s1311 (2008) Environmental Chemistry & Technology<br />
Table III<br />
Polybrominated diphenyl ethers in needles<br />
Concentration [ng g –1 ]<br />
BDE 3 BDE 15 BDE 28 BDE 47 BDE 99 BDE 100 BDE 118 BDE 153 BDE 154 BDE 183<br />
Pine 0.80 0.40 4.50 1.50 nD < LOQ 1.20 1.00 1.60 1.70<br />
Fir 1.30 nD <strong>2.</strong>20 < LOQ 0.70 nD nD < LOQ nD nD<br />
Blue Spruce 0.50 nD 1.80 1.40 <strong>2.</strong>50 1.20 0.80 0.80 <strong>2.</strong>10 < LOQ<br />
Collecting needles<br />
(10 g each sample)<br />
↓<br />
Grounding/extraction<br />
3 × 20 min. with n-hexane-acetone (3 : 2)<br />
↓<br />
Clean-up on Florisil column<br />
elution with n-hexane-acetone (94 : 6)<br />
↓<br />
GC/μECD analysis of extracts<br />
Scheme 1<br />
Results<br />
The study submitted deals with problems of the utilization<br />
of spruce, pine and fir needles for the evaluation of<br />
ecosystems’ primary organic pollutants (POPs) load.<br />
Tables I, II and III show the obtained results – concentrations<br />
of polychlorinated biphenyls, organochlorinated<br />
pesticides and polybrominated diphenyl ethers in needles,<br />
respectively.<br />
On the basis of acquired results, it could be stated that<br />
level of needles contamination is not negligible. Within the<br />
group of PCBs the highest concentrations were found at PCB<br />
28 with highest volatility. Pesticide 4,4’-DDT and 4,4’- DDE,<br />
γ-HCH and HCB were dominant from study groups of organochlorinated<br />
compounds. It was surprise that PBDE levels<br />
were considerably higher than those of other POPs, especially<br />
BDE 28.<br />
s330<br />
Conclusions<br />
needles of pine, fir and blue spruce were used as bioindicators<br />
of the atmospheric contamination by persistent<br />
organic pollutants. These needles are covered by waxy layer,<br />
which effectively concentrates the vapour phase pollutants<br />
from surrounding atmosphere. The results proved the suitability<br />
of the conifera needles for the estimation of atmospheric<br />
contamination by persistent organic pollutants.<br />
This work has been supported by Ministry of Education,<br />
Youth and Sports under MSM 6215712402 is greatly appreciated).<br />
REFEREnCES<br />
1. Zima S., Vávrová M.: Project Monitoring of Food<br />
Chains (transfer study “Feeding – snímal”). Veterinary<br />
and Pharmaceutical University Brno, 65 p. (1994) (in<br />
Czech).<br />
<strong>2.</strong> Ministry of Agriculture of the Czech Republic. Report<br />
on the 1998 monitoring results – hazardous substances<br />
within food chains and influencing inputs, Praha 1999,<br />
47 pp. (1999).<br />
3. Oehme M., Haugen J. E., Schlabach M.: Environmental<br />
Science and Technology, 30, 2294 (1996).<br />
4. Samuillah Z.: Global environment monitoring system.<br />
Biological monitoring of environmental contaminants.<br />
University of London, Technical report (1990).
Chem. Listy, 102, s265–s1311 (2008) Environmental Chemistry & Technology<br />
<strong>2.</strong><strong>2.</strong> Posters<br />
P01 uLTRATRACE DETERMINATION OF<br />
SILVER IN PRECONCENTRATED wATER<br />
SAMPLES by ELECTROThERMAL ATOMIC<br />
AbSORPTION SPECTROMETRy<br />
SEYED HAMID AHMADIa , JAVAD DIDEHVAR ASLa ,<br />
MOHAMMAD HASAn AMInIa and ROYA BAHADORIb aChemistry & Chemical Engineering Research Center of Iran<br />
P.O. Box 14335-186, Tehran, Iran,<br />
bResearch Center for Conservation of Cultural Relics,<br />
Tehran, Iran,<br />
ahmadi@ccerci.ac.ir<br />
Introduction<br />
Silver is one of the industrially important elements. It is<br />
used for the preparation of corrosion-resistance alloys and its<br />
compounds are extensively used in the processing of foods,<br />
drugs and beverages and in filters and other equipments to<br />
purify water. It also has an important role in electrical and<br />
electronic application, photographic film production and the<br />
manufacturing of fungicides 1,2 . These widespread applications<br />
have resulted in increased silver content of environmental<br />
water samples. In turns, owing to the toxicity of silver to<br />
many aquatic organisms even at low concentrations, the serious<br />
environmental problems may occur. Therefore, simple<br />
and highly sensitive methods are needed to monitor the Ag<br />
levels in water samples at ever decreasing concentrations.<br />
Several atomic spectrometric techniques such as flame<br />
and electrothermal atomic absorption spectrometry (FAAS<br />
and ETAAS) 3,4 , inductively coupled plasma atomic emission<br />
spectrometry (ICP-AES) 5 and inductively coupled plasma<br />
mass spectrometry (ICP-MS) 6 have been proposed for the<br />
determination of silver in different environmental samples.<br />
In order to improve the detection limit, various preconcentration<br />
procedures have also been used in combination with the<br />
above-mentioned techniques. These include solvent extraction<br />
7 , solid phase extraction 8 , precipitation 9 , adsorption on<br />
tungsten wire 10 and cloud point extraction 11 . However, most<br />
of these procedures are laborious, time-consuming and may<br />
cause sample contamination.<br />
Recently, Assadi and co-workers introduced a novel<br />
microextraction method called dispersive liquid–liquid microextraction<br />
(DLLME) as a highly sensitive, efficient and<br />
powerful method for the pre-concentration and determination<br />
of traces of organic and inorganic compounds in water<br />
samples 12,13 . In the present work, the DLLME was combined<br />
with ETAAS for determination of silver for the first time. In<br />
this method, an appropriate mixture of extraction solvent and<br />
disperser solvent is injected rapidly into an aqueous sample<br />
containing silver ions and sodium diethyldithiocarbamate<br />
(DDTC) by a syringe. Then, the resulting cloudy solution<br />
is centrifuged and the fine droplets sedimented in a fewμl<br />
volume at the bottom of the conical test tube are finally<br />
introduced into the ETAAS for the determination of its silver<br />
s331<br />
content. The applicability of this approach was validated for<br />
the determination of silver in water samples. The proposed<br />
method was also applied to the determination of silver in<br />
several water samples with satisfactory results.<br />
Experimental<br />
R e a g e n t s a n d S o l u t i o n s<br />
Reagent grade carbon disulfide, carbon tetrachloride and<br />
chloroform, as extraction solvents, and acetone, acetonitrile,<br />
methanol and ethanol as disperser solvents from Merck chemical<br />
company. Doubly distilled deionized water was used<br />
throughout. Analytical grade nitrate salts of silver and other<br />
cations (all from Merck) were of the highest purity available<br />
and used without any further purification except for vacuum<br />
drying. The stock solution of silver (1,000 mg dm −3 for atomic<br />
spectroscopy standard) was prepaed by dissolving 0.1575 g<br />
of silver nitrate (Merck) in deionized water containing 1 ml<br />
concentrated nitric acid (Merck) in a 100 mlvolumetric flask<br />
and diluting to mark with deionized water and stored in the<br />
dark. Working standard solutions were prepared by serial<br />
dilutions of the stock solution with ultrapure water prior to<br />
analysis. The chelating agent, 0.001M sodium diethyldithiocarbamate<br />
(DDTC) solution was prepared daily by dissolving<br />
the appropriate amount of DDTC (analytical grade, Merck)<br />
in methanol (suprasolv, Merck).<br />
Tap, underground and river water samples used for<br />
development of the method were collected in PTFE containers<br />
from the Tehran and added appreciated amount of HnO 3<br />
to adjust pH 3 and stored in dark at 4 °C and analyzed within<br />
48 h of collection without previous treatment or filtration.<br />
I n s t r u m e n t a t i o n<br />
The experiments were performed using a Perkin Elmer<br />
atomic absorption spectrometer (AA 1100B), equipped with a<br />
graphite furnace atomizer HGA-700. Deuterium background<br />
correction was employed to correct non-specific absorbances.<br />
All measurements were performed using the peak height.<br />
An Intensitron silver hollow cathode lamp and a pyrolytic<br />
coated graphite tube (Perkin Elmer) were used. The sample<br />
injection volume was 10 μl in all experiments. The instrumental<br />
parameters and temperature program for the graphite<br />
atomizer are listed in Table I. Argon gas with 99.95% purity<br />
was purchased from Roham Gas Co. (Tehran, Iran) was used<br />
as protected and purge gas. A Kendro 1020D centrifuge (Germany)<br />
was used for centrifugation. All 15-ml screw cap falcon<br />
test tubes with conical bottom (extraction vessel) were<br />
maintained into 0.1 mol dm −3 HnO 3 for cleaning of any inorganic<br />
compounds and washed with doubly deionized water<br />
and then with acetone for proper sedimentation of fine droplets<br />
of the extraction solvent in the centrifuging step.<br />
G e n e r a l P r o c e d u r e<br />
A 10.0 ml of aqueous solution contaning 0.2 ppm Ag and<br />
0.01mM DDTC was placed in a 15 ml screw cap falcon test<br />
tube with conic bottom. 0.8 ml methanol, as disperser solvent,<br />
containing 60 μl carbon tetrachloride, as extraction sol-
Chem. Listy, 102, s265–s1311 (2008) Environmental Chemistry & Technology<br />
vent, was injected rapidly into the sample solution by using a<br />
proper Hamilton syringe and the mixture was gently shaken.<br />
A cloudy solution (water/methanol/carbon tetrachloride) was<br />
formed in the test tube, Ag-DDTC complex is extracted into<br />
the fine droplets of carbon tetrachloride. The mixture was<br />
then centrifuged for 3 min at 3,500 rpm. After this process,<br />
the dispersed fine droplets of carbon tetrachloride were sedimented<br />
at the bottom of test tube (25 ± 1 μl). Finally, 10 μl<br />
of 0.05% Pd(nO 3 ) 2 , as chemical modifier, followed by 10 μl<br />
of the sedimented phase were consecutively pipetted into<br />
the same auto-sampler device and the content was injected<br />
into the graphite tube and the silver content is determined by<br />
electrothermal atomic absorption spectrometry<br />
Results<br />
S t u d y o f t h e E T A A S C o n d i t i o n s<br />
In order to reduce interferences and increase the accuracy,<br />
the use of a chemical modifier or a modifier mixture has<br />
become indispensable in ETAAS measurements. In the present<br />
work, we used Pd(nO 3 ) 2 as a chemical modifier. When<br />
the palladium modifier was not added, the analytical signal<br />
was gradually decreased until 50 % of the initial signal. The<br />
influence of the palladium modifier on the background level<br />
was also important. Based on the experimental results, addition<br />
of 0.05% (w/v) Pd(nO 3 ) 2 solution allowed increasing<br />
the analytical signal with considerable background reduction,<br />
without increasing the pyrolysis temperature. Because for<br />
portions larger than 10 μl the signals were not further improved,<br />
the palladium modifier injection volume was chosen as<br />
10 μl.<br />
The selection of an appropriate pyrolysis temperature is<br />
very important for removing as much the matrix as possible<br />
and preventing the pyrolysis loss of the analytes prior to atomization.<br />
The influence of pyrolysis temperature was studied<br />
on the absorbance, in the range of 300–1,100 °C. The maximum<br />
absorbance was achieved in the range of 300–450 °C<br />
in the presence of chemical modifier. However, when the<br />
pyrolysis temperature was over 500 °C, the signal of analyte<br />
decreased rapidly with the increase of the pyrolysis temperature.<br />
Therefore, 450 °C was selected as the optimized pyrolysis<br />
temperature for the determination of silver.<br />
In the selected pyrolysis temperature of 450 °C, the effect<br />
of pyrolysis time on the absorbance of Ag was investigated.<br />
The results showed that the absorbance was increased when<br />
the pyrolysis time was changing from 10 to 40 s and no<br />
appreciable improvements were observed for longer times.<br />
As a result, a pyrolysis time of 40 s was chosen.<br />
Using a pyrolysis temperature of 450 °C and pyrolysis<br />
time of 40 s, the effect of the atomization temperature, in<br />
the range of 1,000–1,500 °C, on analytical signal of Ag was<br />
also studied, The maximum signal . in the presence of chemical<br />
modifier was obtained at about 1,200 °C and remained<br />
unchanged with the further increasing of temperature up to<br />
1,500 °C. So, the atomization temperature of 1,300 °C was<br />
selected for the further experiments. The experimental results<br />
show that atomization time has little effect on the atomic sig-<br />
s332<br />
nal of Ag. Therefore, an atomization time of 3 s was selected.<br />
The unusual low pyrolysis and atomization temperatures<br />
used in this work is probably due to the fact that the components<br />
used in the dllme procedure are reducing the thermal<br />
stability of Ag.<br />
Table I<br />
The graphite furnace temperature program for silver determination<br />
Step<br />
Temperature Ramp Hold Argon<br />
flow rate<br />
[°C] time [s] time [s]<br />
[ml min−1 ]<br />
Drying 100 1 20 250<br />
Pyrolysis 400 5 30 250<br />
Atomization 1,400 0 3 0<br />
Cleaning 1,800 0 2 1,000<br />
E f f e c t o f T y p e a n d V o l u m e o f t h e<br />
E x t r a c t i o n S o l v e n t<br />
Careful attention should be paid to the selection of the<br />
extraction solvent. It should have higher density rather than<br />
water, extraction capability of the interested compounds and<br />
low solubility in water. Chloroform, carbon tetrachloride and<br />
carbon disulfide were compared in the extraction of silver. A<br />
series of sample solution were studied by using 500 μl methanol<br />
containing different volumes of the extraction solvent to<br />
achieve 25 μl volume of the sedimented phase. The solubility<br />
of the extraction solvents in water is different. Therefore to<br />
recover 25 μl volume of the sedimented phase at the bottom<br />
of the test tube, it is necessary to add an excess to account<br />
for this solubility. Thereby, 75, 50 and 60 μl of chloroform,<br />
carbon disulfide and carbon tetrachloride were used, respectively.<br />
In this experiment chloroform, carbon disulfide and carbon<br />
tetrachloride as extraction solvents obtained enrichment<br />
factors of 12<strong>2.</strong>9 ± 9.4, 119.1 ± 10.5 and 127.7 ± 6.7, respectively.<br />
According to these results, variations of the enrichment<br />
factors using different extraction solvents are not statistically<br />
significantly different. Carbon tetrachloride forms a well<br />
stable cloudy solution, its sedimented phase can easily be<br />
removed by sampler to be introduced into the graphite furnace<br />
and has less consumption volume, while chloroform forms an<br />
unstable cloudy solution and carbon disulfide is difficult to be<br />
removed by sampler. Therefore, carbon tetrachloride was the<br />
best to be used.<br />
To examine the effect of the extraction solvent volume,<br />
solutions containing different volumes of carbon tetrachloride<br />
were subjected to the same DLLME procedures. The experimental<br />
conditions were fixed and include the use of 500 μl<br />
methanol different volumes of carbon tetrachloride (40, 50,<br />
60, 70 and 80 μl). By increasing the volume of carbon tetrachloride<br />
from 40 to 80 μl, the volume of the sedimented phase<br />
increases from 20 to 50 μl. Enrichment factor decreases with<br />
increasing the volume of carbon tetrachloride, because of the<br />
volume of the sedimented phase increases. Subsequently, at
Chem. Listy, 102, s265–s1311 (2008) Environmental Chemistry & Technology<br />
low volume of the extraction solvent high enrichment factor<br />
was obtained. Thereby, the gain in sensitivity was achieved<br />
by using 60 μl of carbon tetrachloride.<br />
E f f e c t o f T y p e a n d V o l u m e o f t h e<br />
D i s p e r s e r S o l v e n t<br />
The main criterion for selection of the disperser solvent<br />
is its miscibility in the extraction solvent and aqueous sample.<br />
For this purpose, different solvents such as acetone, acetonitrile,<br />
methanol and ethanol were tested. A series of sample<br />
solutions were studied by using 800 μl of each disperser<br />
solvent containing 60 μl of carbon tetrachloride (extraction<br />
solvent). The enrichment factors obtained for acetonitrile,<br />
acetone, methanol and ethanol were 108.7 ± 9.1, 125.2 ± 8.8,<br />
120.4 ± 5.3 and 115.6 ± 7.5, respectively. The results show<br />
no statistical significant differences between disperser solvents;<br />
however, the solubility of DDTC in methanol makes<br />
it a better choice.<br />
The effect of the volume of methanol on the extraction<br />
recovery was also studied. Since, variation of the volume<br />
of methanol makes change in the volume of sedimented<br />
phase at constant volume of carbon tetrachloride (extraction<br />
solvent). Thereby, to avoid this matter and in order to<br />
achieve a constant volume of sedimented phase (25 μl) the<br />
volume of methanol and carbon tetrachloride were changed,<br />
simultaneously. The experimental conditions were fixed and<br />
include the use of different volumes of methanol 0.50, 0.8,<br />
1.00 and 1.50 ml containing 45, 60, 75 and 100 μl of carbon<br />
tetrachloride, respectively. Under these conditions, the<br />
volume of the sedimented phase was constant (25 ± 1 μl). It<br />
is clear that by increasing the volume of methanol, the solubility<br />
of complex in water increases. Therefore, the extraction<br />
recovery decreases. Thus, 800 μl of methanol was selected as<br />
optimum volume in order to achieve better and more stable<br />
cloudy solution.<br />
E f f e c t o f p H<br />
The separation of metal ions by dispersive liquid–liquid<br />
microextraction involves prior formation of a complex with<br />
sufficient hydrophobicity to be extracted into the small<br />
volume of the sedimented phase, thus, obtaining the desired<br />
preconcentration. pH plays a unique role on metal–chelate<br />
formation and subsequent extraction. The effect of pH on the<br />
complex formation and extraction of silver from water samples<br />
was studied in the range of 1–6 by using concentrated<br />
H 2 SO 4 solution( note that DDTC is a weak base). The results<br />
illustrated in Fig. 1. reveal that the absorbance is nearly constant<br />
in the pH range of 3.5–4.0. Therfore the pH 4 seems<br />
a proper choice. Moreover, to make pH 4 adjustment, the<br />
use of buffer (which are sources of contamination) is not<br />
necessary and sulfuric acid can simply be used to make the<br />
pH adjustment.<br />
E f f e c t o f D D T C C o n c e n t r a t i o n<br />
The effect of the DDTC concentration on the absorbace<br />
was studied in the range of 0.001-1mM of DDTC. The<br />
s333<br />
Fig. 1. Effect of ph on silver extraction<br />
absorbace was increased by increasing the DDTC concentration,<br />
which is well expected. It seems that slight reduction<br />
of extraction in high concentration of DDTC is due to the<br />
extraction of DDTC itself, which can easily saturate the<br />
small volume of extraction solvent. Also, at high concentration<br />
of DDTC (1mM) the background absorbance was increased.<br />
Therefore, the concentrationt of 0.01 mM DDTC was<br />
selected as the best choice to prevent any interference.<br />
E f f e c t o f S a l t<br />
For investigating the influence of ionic strength on performance<br />
of DLLME, various experiments were performed<br />
by adding different amount of nanO 3 (0–8 % (w/v)). Other<br />
experimental conditions were kept constant. By increasing<br />
the nanO 3 from 0 to 8 %, the volume of sedimented phase<br />
increases slightly from 25 to 27 μl. The results showed that<br />
salt addition has no significant effect on the enrichment factor.<br />
It is maybe because of two opposite effects of salt addition<br />
in DLLME of silver. One of them is increasing the volume<br />
Table II<br />
Effect of foreign ions on the pre-concentration and determination<br />
of silver (20 ng ml −1 )<br />
Ion Ion/Au ratio Extraction recovery [%]<br />
Li + 10,000 103.5 ± 3.7<br />
K + 10,000 103.8 ± 4.8<br />
Mg 2+ 10,000 94.3 ± 1.9<br />
Ca 2+ 10,000 10<strong>2.</strong>3 ± 7.3<br />
Mn 2+ 1,000 96.3 ± 4.7<br />
ni 2+ 1,000 89.7 ± 8.7<br />
Hg 2+ 1,000 104.5 ± 3.8<br />
Cu 2+ 1,000 93 ± 1.2<br />
Co 2+ 1,000 101.2 ± 4.0<br />
Cd 2+ 1,000 93.6 ± 3.8<br />
Pb 2+ 1,000 95.9 ± 1.3<br />
Bi 3+ 1,000 94.6 ± 3.7<br />
Cr 3+ 1,000 94.8 ± 5.0<br />
nO 3 − 1,000 105.8 ± 4.6<br />
SO 4 2− 1,000 101.0 ± 6.2<br />
Cl – 10,000 103.3 ± 4.6
Chem. Listy, 102, s265–s1311 (2008) Environmental Chemistry & Technology<br />
of sedimented phase that decreases the enrichment factor and<br />
another is salting-out effect that increases the enrichment<br />
factor. Therefore, the enrichment factor is nearly constant by<br />
increasing the amount of sodium nitrate. Therefore the experiments<br />
were performed in absence of the salt.<br />
E f f e c t o f C o e x i s t i n g I o n s<br />
The effects of common coexisting ions in natural water<br />
samples on the recovery of silver were studied. In these experiments,<br />
10.0 ml of solutions contains 20 ng ml −1 of silver and<br />
various amounts of interfering ions were treated according to<br />
the recommended procedure. A given spices was considered<br />
to interfere if it resulted in a ± 5 % variation of the AAS signal.<br />
The results obtained are given in Table II.<br />
F i g u r e s o f M e r i t<br />
Table. III summarizes the analytical characteristics of<br />
the optimized method, including linear range, limit of detection,<br />
reproducibility, and enhancement factor. The calibration<br />
graph was linear in the range of 6–120 ng ml −1 of<br />
silver. The limit of detection, defined as C L = 3 S B /m (where<br />
C L , S B and m are the limit of detection, standard deviation of<br />
the blank and slope of the calibration graph, respectively),<br />
was 1.2 ng ml −1 . The relative standard deviation (R.S.D.)<br />
for ten replicate measurements of 20 ng dm −3 Ag was 3.6 %.<br />
The enhancement factor was obtained from the slope ratio<br />
of calibration graph after and before extraction, which was<br />
about 66.<br />
Table III<br />
Analytical characteristics of DLLME-ETAAS for determination<br />
of Ag<br />
Element condition DLLME–ETAAS ETAAS<br />
Linear range [ng ml −1 ] 6–120 500–20,000<br />
Correlation coefficient (r) 0.995 0.997<br />
Slope <strong>2.</strong>65 0.04<br />
Enhancement factor a 66 –<br />
RSD [%], (n = 8) b 3.6 3.5<br />
LOD [ng ml −1 ] c 1.2 80<br />
a Calculated as the ratio of slope of pre-concentrated samples<br />
to that obtained without pre-concentration.<br />
b At a silver concentration of 20 ng ml −1 .<br />
c Determined as three times of the standard deviation of the<br />
blank signal, and slop of calibration curve after pre-concentration<br />
A n a l y s i s o f n a t u r a l W a t e r s<br />
The proposed DLLME–ETAAS methodology was<br />
applied to the determination of silver in several water samples.<br />
Tap, underground and river water were collected from<br />
the Tehran and were analyzed by DLLME combined with<br />
ETAAS for determination of silver. The concentration of<br />
silver in the tap, underground and river water samples were<br />
determined to be 17.2 ± 0.6 ng ml −1 , 24.7 ± 0.6 ng ml −1 and<br />
30.10 ± 0.4 ng ml −1 respectively (Table IV). The water sam-<br />
s334<br />
ples were spiked with silver standards to assess matrix effects.<br />
The relative recoveries of silver from these waters at<br />
spiking level of 10 and 20 ng ml −1 were 102, 98, and 100 %,<br />
respectively (Table IV). These results demonstrated that the<br />
tap, underground and river water samples matrices, in our<br />
present context, had little effect on DLLME of silver.<br />
Table IV<br />
Determination of Ag in real samples<br />
Sample<br />
Added Found<br />
[ng ml −1 ] [ng ml −1 ] a<br />
Recovery [%]<br />
– 17.2 ± 0.6 –<br />
Tap waterb 10 27.3 ± 0.4 101<br />
20 37.5 ± 0.6 103<br />
Underground<br />
water<br />
– 24.7 ± 0.5 –<br />
c 10 34.6 ± 0. 6 99<br />
River water d<br />
20 44.4 ± 0.5 97<br />
– 30.1 ± 0.4 –<br />
10 40.0 ± 0.5 99<br />
20 50.2 ± 0.8 101<br />
a Mean of three experiments ± standard deviation.<br />
b From drinking water system of Tehran, Iran.<br />
c Obtained from Vardavard, Iran.<br />
d From Karaj river, Iran.<br />
Conclusions<br />
In this paper we introduced a DLLME–ETAAS method<br />
for the analysis of ultra trace amounts of Ag in real samples<br />
such as tap water, river water and underground water. The<br />
important features of DLLME method are low cost, use of<br />
minimized toxic organic solvents, simplicity of operation,<br />
rapidity, high enrichment factor and high sensitivity and selectivity.<br />
High preconcentration factor was obtained easily through<br />
this method and a detection limit at ng ml −1 level was<br />
achieved with only 10.00 ml of sample. In this method sample<br />
preparation time as well as consumption of toxic organic<br />
solvents was minimized without affecting the sensitivity of<br />
the method..This method is characterized with simplicity,<br />
rapidity, reliability, safety and low cost, and is suitable for<br />
the determination of ultra-trace silver in environmental water<br />
samples.<br />
REFEREnCES<br />
1. Grayson M. : Kirk–Othmer Encyclopedia of Chemical<br />
Technology ,.(3 rd ed.), vol. 21, Wiley, new York 1980.<br />
<strong>2.</strong> Smith I.C., Carson B. L.:, Trace Metals in the Environment<br />
, vol. 2, Ann Arbor Science Publisher‘s Inc., Ann<br />
Arbor 1977.<br />
3. Šràmkovà J., Kotrlý S., Jakoubková P.: Anal. Chim.<br />
Acta 408, 183 (2000).<br />
4. Baron M. G., Herrin R. T., Armstrong D. E.: Analyst 25,<br />
123 (2000).<br />
5. Singh R. P., Pambid E. R.: Analyst 115, 301 (1990).<br />
6. ndung’u K., Ranville M. A., Franks R. P., Flegal A. R.:<br />
Mar. Chem. 98, 109 (2006).
Chem. Listy, 102, s265–s1311 (2008) Environmental Chemistry & Technology<br />
7. Koh T., Sugimoto T.: Anal. Chim. Acta 333, 167<br />
(1996).<br />
8. Dadfarnia S., Haji Shabani A. M, Gohari M.: Talanta 64,<br />
682 (2004).<br />
9. Sant’Ana O. D., Wagener A. L. R., Santelli R. E., Cassella<br />
R. J., Gallego M., Valcarcel M.: Talanta 56, 673<br />
(2002).<br />
10. Rahman M. A., Kaneco S., Amin M. n., Suzuki T., Ohta<br />
K.: Talanta 62, 1047 (2004).<br />
s335<br />
11. Stalikas C. D.: Trends Anal. Chem. 21, 343 (2002).<br />
1<strong>2.</strong> Rezaee M., Assadi Y., Milani Hosseini M. R., Aghaee<br />
E., Ahmadi F., Berijani S.: J. Chromatogr. A 1116, 1<br />
(2006).<br />
13. Zeini Jahromi E., Bidari A., Assadi Y., Milani Hosseini<br />
M. R., Jamali M. R.: Anal. Chim. Acta 585, 305 (2007).
Chem. Listy, 102, s265–s1311 (2008) Environmental Chemistry & Technology<br />
P02 REMOVAL OF 2-MERCAPTObENZOThIAZOLE<br />
FROM SyNThETIC<br />
wASTEwATER<br />
BEáTA ALMáSIOVá, Ján DERCO, AnGELIKA<br />
KASSAI and eVA HáSOVá<br />
Slovak University of Technology, Faculty of Chemical and<br />
Food Technology, Institute of Chemical and Environmental<br />
Engineering, Radlinského 9, 812 37 Bratislava 1, Slovak<br />
Republic,<br />
beata.almasiova@stuba.sk<br />
Introduction<br />
2-Mercaptobenzothiazole (MBT) is the most important<br />
member of the benzothiazole group of heterocyclic aromatic<br />
compounds. It is a pale yellow, crystalline substance with an<br />
unpleasant odor and a bitter taste . This xenobiotic compound<br />
is used mainly in the manufacture of rubber additive chemicals<br />
but also has other uses, notably as a corrosion inhibitor,<br />
antifreeze for automobiles. It is known as a toxic and poorly<br />
biodegradable pollutant. It is able to pass conventional treatment<br />
systems, widespread with surface and underground<br />
waters and enters into organisms 1 . Data concerning biodegradation<br />
of MBT are inconclusive. Some authors 2 have suggested<br />
it is recalcitrant to biodegradation.<br />
Genotoxicity investigations in bacterial and mammalian<br />
test systems provide some evidence indicating that MBT has<br />
the potential to induce mutations and chromosomal aberrations.<br />
Toxicity studies in rats and mice chronically exposed<br />
to MBT identified increases in various tumors 3 . Epidemiological<br />
investigations indicate that workers occupationally<br />
exposed to MBT have an increased risk of death from bladder<br />
cancer. MBT interfered with the nitrification processes and<br />
exhibited biocidal effects. MBT inhibits the degradation of<br />
easily degradable organics 4 .<br />
This work was aimed at study biodegradation of MBT<br />
and effect of this compound on activated sludge. Degradation<br />
of MBT by ozone was also studied.<br />
Experimental<br />
B i o d e g r a d a b i l i t y o f M B T<br />
Adaptation of activated sludge to MBT was carried out<br />
in semicontinuos bioreactor. We were adapted MBT with<br />
maximal concentration 25 and 50 mg dm –3 on the activated<br />
sludge. Time of adaptation was 3 weeks. During the adaptation<br />
Table I<br />
Specific sorptive capacity of activated sludge<br />
c MBT MTB decrease MTB decrease<br />
at solution by adsorption by adsorption<br />
[mg dm –3 ] [mg dm –3 ] [mg g –1 ]<br />
10 4.2 42<br />
20 5.9 59<br />
60 6.8 68<br />
s336<br />
we measured inhibition effect of MBT on the activated sludge<br />
by respirometric measurements.<br />
Adsorption tests were performed both with adapted and<br />
nonadapted activated sludge to MBT. Adsorption of MBT on<br />
activated sludge was studied at various concentration values<br />
of MBT. We were measured the specific sorptive capacity of<br />
sludge at low (10, 20 and 60 mg dm –3 ) and high concentration<br />
of MBT (100, 200 and 500 mg dm –3 ).<br />
O z o n a t i o n o f M B T<br />
The feasibility of utilisation of ozone for degradation<br />
of MBT was investigated in laboratory scale equipment. The<br />
experiments were performed in bubble ozonation column.<br />
The ozonation equipment consists of two glass columns,<br />
0.04 m diameter and 1.70 m height. The first column was<br />
filled with synthetic water with MBT, and the other one was<br />
filled with solution of potassium iodide to destroy residual<br />
ozone in the outlet of the first ozonation column. The system<br />
was operated in batch mode. Synthetic wastewater containing<br />
MBT was added into ozonation reactor at the beginning of<br />
trials. Continuous flow of oxygen 30 dm 3 h –1 was applied for<br />
generation of ozone. The Lifetech ozone generator with the<br />
maximum ozone production 5 g h -1 and Lifetech ozone UV<br />
detector were used. Ozonation trials were carried out at 70 %<br />
of the power maximum of ozone generator. Initial concentration<br />
of MBT in synthetic water was 50 mg dm –3 .<br />
Results<br />
MBT is not consumed by non adapted activated sludge.<br />
Decrease of respiration rate of non adapted activated sludge<br />
was observed with the increase of 2-MBTconcentration.<br />
Rapid decrease of respiration activity was observed for activated<br />
sludge after adaptation. The endogenous respirometric<br />
rate decreased by 6 % at concentration 25 mg dm –3 MBT in<br />
comparison with reference model. The endogenous respirometric<br />
rate decreased by 39 % at concentration 50 mg.dm –3<br />
MBT in comparison with reference model.<br />
The decrease of dissolved MBT concentration was<br />
observed at the low concentration levels. The value of COD<br />
and TOC increased after 10 days, which is caused by increase<br />
of concentration of MBT in solution.<br />
Table I shows the results of adsorption test carried out at<br />
lower concentration values of MBT. negligible adsorption of<br />
MBT on activated sludge was observed at MBT concentration<br />
higher than 100 mg dm –3 .<br />
According to results shown in the Fig. 1. the highest COD<br />
removal was observed during the first 20 minutes of ozonation.<br />
The initial COD value conversion achieved about 98 %<br />
after 50 minutes. The efficiency of TOC removal was 54 %<br />
after 50 minutes of ozonation. Almost total removal (96 %)<br />
of 2-MBT from the sample was achieved after 5 minutes of<br />
ozonation. Simultaneously the presence of benzothiazole was<br />
identified as ozonation intermediate. The presence of benzothiazole<br />
(BT) was identified in the sample after 50 minutes<br />
of ozonation. Fien et al. 5 show, that MBT and its breakdown<br />
products had a high affinity towards ozone as indicated by the
Chem. Listy, 102, s265–s1311 (2008) Environmental Chemistry & Technology<br />
rates for partial oxidation and mineralization. Benzothiazole<br />
was identified as the first ozonation product, reaching up to<br />
60 mol% of the original MBT concentration, followed by low<br />
concentration of 2(3-H) benzothiazolone.<br />
The results of absorption of ozone in the fresh water<br />
and in the synthetic wastewater containing MBT are given in<br />
Fig. <strong>2.</strong> The saturation concentration of ozone 23.1 mg dm –3<br />
was achieved in fresh water after 35 minutes. Specific ozone<br />
consumption values were 0.78 g g –1 for COD and 1.88 g g –1<br />
for TOC.<br />
Fig. 1. COD, TOC and MbT as a function of ozonation time at<br />
oxygen flow rate 30 dm 3 h –1 and W = 70 %<br />
Conclusions<br />
Respirometric tests confirmed that this compound is not<br />
biodegradable. Activated sludge showed adsorption affinity<br />
to MBT at concentration values up to 60 mg dm –3 . Significant<br />
decrease of MBT content was observed after five minutes<br />
of ozonation. Correspondent efficiency values for COD<br />
and TOC removal were 55 and 16 %. COD removal rate<br />
5.2 mg dm –3 min –1 was observed at 70 % of maximum ozone<br />
s337<br />
Fig. <strong>2.</strong> utilization of ozone in demineralised water and in synthetic<br />
wastewater contentaining MbT<br />
generator power. The presence of benzothiazole was identified<br />
as ozonation intermediate. It can be concluded that MBT<br />
is readily transformed by ozonation.<br />
This work has been supported by the Slovak Grant<br />
Agency for chemical and chemical-technological science<br />
(Grant No 1/0866/08).<br />
REFEREnCES<br />
1. De Wever H., Verachtert H.: Water Research 31, 2673<br />
(1997).<br />
<strong>2.</strong> Chudoba J., Tuček F., Zeis K:. Acta Hydrochim. Hydrobiolo.<br />
5, 495 (1977).<br />
3. Whittaker M. H., Gebhart A. M., Miller T. C., Hammer<br />
F.: Toxicol And Health. 2004, 49.<br />
4. Reemtsma T., Fiehn O., Kalnowski G. and Jekel M.:<br />
Environ. Scien. Technol. 29, 478 (1995).<br />
5. Fiehn O., Wegener G., Jochimsen J. and Jekel M.: Water<br />
Research 32, 1075 (1998).
Chem. Listy, 102, s265–s1311 (2008) Environmental Chemistry & Technology<br />
P03 hEALTh RISK ASSESSMENT by INDOOR AIR<br />
QuALITy MONITORING<br />
EKATERInA AnDREEVA, IVAn MAŠEK and MILADA<br />
VáVROVá<br />
Brno University of Technology, ICTEP, Czech Republic, Purkyňova<br />
118, 612 00 Brno, Czech Republic,<br />
xcandreeva@fch.vutbr.cz<br />
Introduction<br />
The risk is an inseparable part of working activity. That<br />
is why a general duty of employer is to ensure health and<br />
safety at work for all employees. They are protected by the<br />
main framework Directive 98/391/EEC, which basic principle<br />
is risk prevention, which requires risk assessment by the<br />
responsible employer.<br />
Dangerous substances can be found in many workplaces.<br />
A recent European survey shows that 16 % of workers<br />
reported handling hazardous products and 22 % being<br />
exposed to toxic vapours1 . As far as work accidents concern<br />
according to OSHA facts1 :<br />
• Every 3 and a half minutes somebody in the European<br />
Union dies from work-related causes<br />
• Every year 142,400 people in the EU die from occupational<br />
diseases and 8,900 from work-related accidents<br />
• Up to third of these 150,000 fatalities each year can be<br />
attributed to hazardous substances at work in the EU<br />
(including 21,000 to asbestos)<br />
Exposure to dangerous substance occurs at any industry<br />
workplace, on farms, in vehicles, especially at chemical<br />
plants and at smaller areas, such as high school, universities,<br />
in laboratories and also at home or in office.<br />
Dangerous substances affect human’s health by different<br />
ways. Some can cause cancer, affect the reproductive<br />
function or cause mutagenic effects. Other agents may cause<br />
brain damage, be harmful to the nervous system, respiratory<br />
airways or skin.<br />
Quality of workplace environment includes not only<br />
safety conditions at work, achieved by continual risk assessment<br />
and elimination of these risks, but also means a clean<br />
and healthy environment. The working environment is formed<br />
by different microclimatic conditions, such as level of noise,<br />
lighting, quality of indoor air, surrounding temperature, level<br />
of humidity etc. Each of these factors has a great influence on<br />
worker’s health and productivity of his work.<br />
Since many people spend a large part of their lives in<br />
closed areas – in an office, at school, in transport – clean air<br />
becomes essential for good health and this is especially true<br />
when speaking about indoor air.<br />
Posing the Problem<br />
As it was mentioned above among different workplaces,<br />
school’s environment can be found. nowadays school area<br />
consists of not only usual class-rooms, but also covers wide<br />
s338<br />
range of specialized working facilities, for example chemical<br />
laboratories.<br />
In this article we will focus on chemical hazards in the<br />
laboratories. People who work or study in a chemical laboratory<br />
are exposed to many kinds of hazards, e.g. chemical<br />
substances, mechanical hazards, biological agents, physical<br />
factors, psychological conditions and so on.<br />
Special feature of such work environment is that level<br />
of chemical threats rises steeply, since the quantity and<br />
range of chemicals are higher than in any other place of<br />
usual life. Many agents are highly flammable and explosive,<br />
their careless handling and storage may result in fire ignition<br />
and explosions. Toxic gases, fumes and liquids may be<br />
produced and cause poisoning or infection of personnel and<br />
students. Some chemical agents have carcinogenic or mutagenic<br />
properties.<br />
Indoor air quality is also one of the important factors<br />
in the working space and shouldn’t be underestimated.<br />
The influence of air quality which we breathe can be extended<br />
on two main problems: long-term health affection and<br />
work-related accidents. The first problem is connected with<br />
long-term exposure of workers and students to low concentrations<br />
of different substances in the air (the most followed<br />
are carbon and nitrogen oxides, radon and Volatile Organic<br />
Compounds – VOCs). Usually it can be solved by periodical<br />
measuring of concentration, assessing the possible risks<br />
of this exposure and taking correcting measures, for example<br />
improving ventilation, changing working regime, and using<br />
proper personal protective equipment.<br />
The second problem concerns working-related accidents.<br />
On the one hand any laboratory worker or student can be<br />
exposed to toxic gases and fumes, which may unexpectedly<br />
escape from their container or come out from the by-side effect<br />
of reaction. These substances in the air can cause diffe-<br />
rent effects:<br />
•<br />
•<br />
•<br />
Acute poisoning or injury of the organism<br />
Cause allergies<br />
Irritate eyes or breathing system<br />
Usually there are few people in laboratory at the same<br />
time. If one of them will lose self-control under certain conditions,<br />
such as bad vision, suffocation, pain, his behavior<br />
becomes dangerous for others and can lead to emerging other<br />
hazards for surrounding people.<br />
Objects of Research<br />
According to EC Directive 1999/13/EC (Solvent Emissions<br />
Directive), Volatile Organic Compounds (VOCs) are functionally<br />
defined as organic compounds having at 293.15 K<br />
(i.e., 20 °C) a vapor pressure of 0.01 kPa or more, or having a<br />
corresponding volatility under particular conditions of use.<br />
In a majority solvents need to be managed carefully<br />
due to their volatility and general flammability, in particular<br />
during loading and unloading, storage and when using large<br />
quantities.
Chem. Listy, 102, s265–s1311 (2008) Environmental Chemistry & Technology<br />
Commonly, producers enclose Safety Data Sheets to<br />
their products with necessary using, handling and storage<br />
recommendations:<br />
• Safe exposure limits and techniques for managing<br />
flammability<br />
• Information on the main hazards, how to protect against<br />
them and the steps to take in an emergency<br />
• Occupational exposure limits (OELs)<br />
• Handling, storage, transport, spills and disposal advice<br />
• Regulatory information such as classification and labeling<br />
• Toxicity and environmental information<br />
In chemical laboratory among other used chemicals<br />
one of the most famous are organic solvents, which usually<br />
referred to as group of Volatile Organic Compounds (VOCs).<br />
VOCs are compounds given off by a number of other indoor<br />
sources. Concentrations of most volatile organic compounds<br />
is higher in indoor than outdoor air. They commonly can be<br />
found in household, institutional, and industrial cleaning and<br />
maintenance products, and in building and finishing materials.<br />
Other sources of VOCs include the burning of fuels<br />
such as gas, wood and kerosene, as well as tobacco products.<br />
VOCs can also come from personal care products (perfume<br />
and hair spray), cleaning agents, dry cleaning fluid, paints,<br />
lacquers, varnishes, hobby supplies, and from copying and<br />
printing machines 2 .<br />
In enclosed spaces, VOCs can cause eye, nose, and<br />
throat irritation, dizziness, headache, memory and visual<br />
impairment. Higher concentrations may cause irritation of<br />
the lungs, as well as damage to the liver, kidney, or central<br />
nervous system. Some VOCs are suspected to cause cancer<br />
in humans and have been shown to cause cancer in animals.<br />
The health effects caused by VOCs depend on the level and<br />
length of exposure.<br />
The real concentrations of VOCs are usually orders of<br />
magnitude below the occupational threshold limit values<br />
(TLVs). However, some VOCs may be present above their<br />
human odor thresholds (OTs). Beside odor annoyance, VOCs<br />
at sub-TLV level may cause non-specific health effects such<br />
as eye and upper respiratory airway irritation, headache and<br />
increased weariness 3 .<br />
The main route of exposure to solvents is via inhalation.<br />
Occupational exposure limits (OELs) set the airborne<br />
concentration of a substance that workers can be exposed to,<br />
day after day without any adverse health effects. OELs are<br />
normally set for an 8 hour day –1 and a 40 hour week –1 and are<br />
continuously reviewed by national and EU authorities. OELs<br />
for the majority of hydrocarbon and oxygenated solvents are<br />
set between 10 and 1,000 parts per million depending on the<br />
volatility and toxicity of an individual substance 4 .<br />
According to what was stated above as objects of research<br />
were chosen some organic solvents which are frequently used<br />
in chemical laboratories of the Faculty of Chemistry, Brno<br />
University of Technology. Acquired data will be used for the<br />
following health risk assessment in chosen workplaces.<br />
s339<br />
Managing the Problem<br />
A four-step approach to risk assessment exists4 .<br />
• Make an inventory of the substances used in the processes<br />
in the workplace and those generated by the process<br />
such as welding fumes or wood dust.<br />
• Collect information about these substances, i.e. the harm<br />
they can do and how this can happen. Safety data sheets<br />
(SDS), which must be provided by the supplier of a chemical,<br />
are an important source of information.<br />
• Assess exposure to the identified dangerous substances,<br />
looking at the type, intensity, length, frequency and occurrence<br />
of exposure to workers, including combined<br />
effects of dangerous substances used together and the<br />
related risk.<br />
• Rank the severity of the established risks.<br />
As we can see from this list of steps, assess exposure is<br />
one of the important parts. Exactly, this direction was chosen<br />
to exposure prevent and control of the dangerous substances<br />
in chemical laboratories.<br />
The purpose of this study is to measure the concentration<br />
of VOCs, which are used in chosen chemical laboratories<br />
and to assess possible occupational health risks. The aim is<br />
to protect people who are supervising the practice work and<br />
working in the harmful environment for a long time (occasionally<br />
more than 8 hours). This research work is supposed to<br />
be conducted for a long-term period.<br />
The measurements will be taken in different working<br />
areas (for example laboratory of organic chemistry, storage<br />
area). For conducting the analysis a passive air sampling by<br />
Radiello cartridges with charcoal is chosen with followed<br />
CS 2 desorption and GC with FID or GC-MS analysis.<br />
Method used to sample collection and analysis, passive<br />
sampling (by means of new trade product Radiello ® ), is considered<br />
to be a simple and rather cost-effective. Unlike active<br />
sampling, passive samplers require no expensive pumps and<br />
are simple to use (no calibration is needed). Other advantages<br />
are:<br />
•<br />
•<br />
•<br />
•<br />
Compact, portable<br />
Offer indication of average pollution levels over time<br />
periods of 8 hour to weeks/months<br />
Relatively low-cost in compare with other methods<br />
Applicable for personal monitoring and indoor air analysis<br />
Conclusions<br />
Important point of view for assessing acceptable working<br />
place is its safety requirements and conditions which<br />
will surround the employees, what means working environment,<br />
which consists of physical, chemical and other factors.<br />
These factors can unfavorable affect worker’s health by their<br />
poor quality or quantity, as well as duration of this affection.<br />
Everybody wants to work in the safety and high-quality<br />
working environment. This statement enclosed in the<br />
European legislation and imposes some obligations on<br />
employers:
Chem. Listy, 102, s265–s1311 (2008) Environmental Chemistry & Technology<br />
•<br />
•<br />
•<br />
Assess the possible risks<br />
Take measures to eliminate or reduce the risks<br />
Effectiveness control of the preventive measures and<br />
their review<br />
A healthy work environment means the monitoring and<br />
maintenance of hygienic limits in the workplace, such as<br />
temperature, humidity of air, proper chemical composition,<br />
intensity of working process etc.<br />
University area with its laboratories is a special working<br />
environment. Students and other workers, who is working<br />
or studying in such laboratories, are exposed to many kinds<br />
of hazards. But the main difference is that laboratory work<br />
involves a greater variety of possible chemical hazards. There<br />
are many agents, which have flammable, explosive, toxic and<br />
other characteristics.<br />
Besides obvious risks, which can emerge during laboratory<br />
work, there are also non-evident ones, for example, air<br />
quality.<br />
Among different chemical agents, there is a group of the<br />
most used, such as organic solvents. Some of them could be<br />
very harmful for human’s health, but usually for assessing<br />
their affection it’simportant take into account their features,<br />
time of exposure and concentration during exposure.<br />
For this purpose the methodology of indoor air analysis<br />
is going to be developed, which is supposed to help in assessing<br />
possible occupational health risks, posed by quality of<br />
indoor air in chemical laboratories. The indoor air analysis is<br />
conducting by passive sampling with following GC with FID<br />
or GC-MS analysis on long-term conditions.<br />
s340<br />
REFEREnCES<br />
1. Statistics – OSHA – European Agency for Safety and<br />
Health at Work [online]. c1998–2008 , 06.06.2008 [cit.<br />
2008-06-07]. Available from : .<br />
<strong>2.</strong> Indoor Air Quality – Volatile Organic Compounds<br />
(VOC\’s) - BC HealthFile #65d [online]. c2006 , 07-<br />
2006 [cit. 2008-06-07]. Available from WWW: .<br />
3. Reiser, R., et al. Indoor air pollution by volatile organic<br />
compounds (voc) emitted from flooring material in a<br />
technical university in Switzerland. Proceedings: indoor<br />
air [online]. 2002 [cit. 2008-06-07], pp. 1004-1009.<br />
Available from www: .<br />
4. ESIG : Health & Safety – European Solvents Industry<br />
Group ESIG: Solvents industry in Europe [online]. 08-<br />
05-2008 , 08-05-2008 [cit. 2008-06-07]. Availabnnle<br />
from: .<br />
5. Factsheet – 33 – An introduction to dangerous substances<br />
in the workplace : Facts. Facts [online]. no. 33, (2003)<br />
[cit. 2008-06-07]. Available from WWW: .<br />
6. Radiello – The radial simmetry diffusive sampler [online].<br />
Fondazione Salvatore Maugeri IRCCS , 2006 , March 22th<br />
2007 [cit. 2007-06-07]. Available from WWW: .
Chem. Listy, 102, s265–s1311 (2008) Environmental Chemistry & Technology<br />
P04 NITROGEN IN bREEDING LAyING hENS AND<br />
ENVIRONMENT PROTECTION<br />
MáRIA AnGELOVIČOVá, MAREK AnGELOVIČ and<br />
MIROSLAVA KAČánIOVá<br />
Faculty of Biotechnology and Food Sciences, Slovak University<br />
of Agriculture, Tr. A.Hlinku 2, Nitra, 949 76 Slovakia,<br />
maria.angelovicova@uniag.sk<br />
Introduction<br />
At EU–15 level the gross nitrogen balance in 2000<br />
was calculated to be 55 kg ha –1 , which is 16 % lower than<br />
the balance estimate in 1990, which was 66 kg ha –1 . In 2000<br />
the gross nitrogen balance ranged from 37 kg ha –1 (Italy)<br />
to 226 kg ha –1 (the netherlands). All national gross nitrogen<br />
balances show a decline in estimates of the gross nitrogen<br />
balance (kg ha –1 ) between 1990 and 2000, apart from<br />
Ireland (22% increase) and Spain (47% increase). The following<br />
Member States showed organic fertilizer application<br />
rates greater than the threshold of 170 kg ha –1 specified by<br />
the nitrates Directive in 2000: the netherlands (206 kg ha –1 )<br />
and Belgium (204 kg ha –1 ). The general decline in nitrogen<br />
balance surpluses is due to a small decrease in nitrogen input<br />
rates (–1.0 %) and a significant increase in nitrogen output<br />
rates (10 %). The gross nutrient balance for nitrogen provides<br />
an indication of potential water pollution and identifies<br />
those agricultural areas and systems with very high nitrogen<br />
loadings. As the indicator integrates the most important agricultural<br />
parameters with regard to potential nitrogen surplus<br />
it is currently the best available approximation of agricultural<br />
pressures on water quality. High nutrient balances exert pressures<br />
on the environment in terms of an increased risk of leaching<br />
of nitrates to groundwater. The application of mineral<br />
and organic fertilizers can also lead to emissions to the atmosphere<br />
in the form of nitrous dioxide and ammonia, respectively.<br />
Gross nitrogen balances are above 100 kg per ha in the<br />
netherlands, Belgium, Luxembourg and Germany. They are<br />
particularly low in most Mediterranean countries given the<br />
overall lower livestock production in this part of Europe.<br />
It is currently not possible to provide gross nitrogen balance<br />
estimates for the new EU Member States and the accession<br />
as the relevant statistical data are under elaboration. national<br />
balances, however, can mask important regional differences<br />
in the gross nutrient balance that determine actual nitrogen<br />
leaching risk at regional or local level. Individual Member<br />
States can thus have acceptable gross nitrogen balances at<br />
national level but still experience significant nitrogen leaching<br />
in certain regions, for example in areas with high livestock<br />
concentrations. There are a number of regions where pig<br />
livestock units have increased by more than 25 % between<br />
1990 and 2000 (for example, north-western Denmark, northwestern<br />
France, north-eastern Spain and northern Belgium).<br />
These are likely to be regional ‘hotspots’ for high gross nitrogen<br />
balances that can lead to environmental pressures. Member<br />
States with high nitrogen balances are making efforts<br />
to reduce these pressures on the environment. These build<br />
s341<br />
on a range of different policy instruments, requiring considerable<br />
political effort to succeed given the significant social<br />
and economic consequences of reducing livestock production<br />
in many affected areas 3,4 .<br />
Experimental<br />
We realized experiments with laying hens Shaver<br />
Starcross 288, which ingested feed mixture with different<br />
protein content. In six experiments laying hens fed feed<br />
mixture with protein contents 173.10 g per kilogram and in<br />
four experiments were used feed mixture with protein contents<br />
146.12 or 146.68 g per kilogram. It is soya cereal type<br />
assigned for laying hens. The laying hens ingested fodder ad<br />
libitum.<br />
Within experiments were researched:<br />
protein contents in feed mixture in one kilogram (chemical<br />
analysis – Kjeldahl method and calculation),<br />
excreted nitrogen [g kg –1 •<br />
•<br />
] in dropping per bird and day<br />
(chemical analysis – Kjeldahl method and calculation).<br />
Results<br />
Higher protein contents 173.10 g per kilogram of feed<br />
mixture resulted in excreted dropping at laying hens higher<br />
nitrogen contents in compare with protein contents 146.40 g<br />
per kilogram feed mixture. After ingestion of feed mixture<br />
with protein content 173.10 g per kilogram was nitrogen<br />
content in dropping from 1.88 g per bird and day. The laying<br />
hens, which fed feed mixture with protein contents 146.40 g<br />
per kilogram, excreted the nitrogen in dropping 1.38 g per<br />
bird and day. From these results follows that near decrease<br />
protein contents in feed mixture from 173.10 to 146.40 g<br />
per kilogram is possibility of nitrogen decrease in excreted<br />
dropping at laying hens about 26.60 % per bird and day. This<br />
different of decrease of excreted nitrogen in dropping at layers<br />
is statistically significant (P < 0.001). Correlation coefficient<br />
between content of crude protein in feed mixture and content<br />
of nitrogen in dropping at layers has high level r = 0.99.<br />
Low-protein diet system for layers with addition of<br />
amino acids is beside biologically-cattle-breeding, economical<br />
and ecological too.<br />
Progressive decrease of proteins content to 146.0 g per<br />
1 kg feeding mixture set up the order of limiting amino acids<br />
for layers: methionine, lysine, tryptophane and threonine 5 .<br />
On bases of results model trials on layers were concluded<br />
that feeding, fat-enriched mixture supplied DL-methionine,<br />
choline chloride and vitamin B 2 by need of the effective<br />
Table I<br />
Excreted nitrogen [g kg –1 ] in dropping at laying hens, which<br />
ingestion of feed mixture with different protein contents<br />
Trial Index SD v % t-test<br />
1 st CP [g kg –1 ] 173.10 0.91 0.52 55.68 +++<br />
2 nd CP [g kg –1 ] 146.40 0.32 <strong>2.</strong>68<br />
1 st n [bird day –1 ] 1.88 0.005 0.22 18.52 +++<br />
2 nd n[bird day –1 ] 1.38 0.02 1.57
Chem. Listy, 102, s265–s1311 (2008) Environmental Chemistry & Technology<br />
substance possible reach adequate the laying, egg weight and<br />
their quality on the economical using of the feedstuff and<br />
lower environment load 1 . In order experiment autors confirmed<br />
results of decrease of excreted nitrogen in dropping<br />
at laying hens 2 .<br />
Conclusions<br />
The research results about nitrogen in breeding of laying<br />
hens in relationship to environment protection confirmed the<br />
possibility its decrease. One of the possibilities is decrease of<br />
protein contents in feed mixture. The decrease of crude protein<br />
content in feed mixture from 173.10 into 146.40 g per kilogram<br />
(about 15.43 %) is possibility of decrease of excreted<br />
nitrogen in dropping at laying hens about 26.60 %, which<br />
is statistically significant (P < 0.001). Correlation dependency<br />
between content of nitrogen in dropping at laying hens and<br />
content of crude protein is high, r = 0.99.<br />
s342<br />
This work was supported by Scientific Grant Agency<br />
under the contract No. VEGA 1/4420/07.<br />
REFEREnCES<br />
1. Angelovičová M.: Živočíšna výroba 42, 263 (1997).<br />
<strong>2.</strong> Angelovičová M., Angelovič M.: Proceedings of scientific<br />
conference Food Safety and Control, p. 153. nitra,<br />
2008.<br />
3. Van Grinsveen H., van Eerdt M., Willems J., Ulleneers<br />
E.: Paper presented at OECD workshop on evaluating<br />
agri-environmental policies, Paris, December 2004.<br />
4. Mikkelsen S., Iversen T.M., Kjaer S., Feenstra P.: Paper<br />
presented at OECD workshop on evaluating agrienvironmental<br />
policies, Paris, December 2004.<br />
5. Kočí Š.: Poultry 33, 117 (1991).
Chem. Listy, 102, s265–s1311 (2008) Environmental Chemistry & Technology<br />
P05 TESTING OF VARIOuS SORbENTS FOR<br />
COPPER REMOVAL FROM ACID MINE<br />
DRAINAGE<br />
MAGDALEnA BáLInTOVá and nATáLIA<br />
KOVALIKOVá<br />
Civil Engineering Faculty, Technical University of Košice,<br />
Vysokoškolská 4, 042 00 Košice,<br />
magdalena.balintova@tuke.sk<br />
Introduction<br />
The elimination of the consequences of mining activities<br />
belongs to the most serious environmental problems nowadays.<br />
Acid mine drainage (AMD) with high metal concentrations<br />
and usually with low value of the pH (about 2–4)<br />
is mainly a result of chemical oxidation of sulphides and<br />
other chemical processes in overflowed mines, mining waste<br />
dumps and tailings. This water may transfer various heavy<br />
metals in a dissolved form, such as Fe, Cu, Al.<br />
The abandoned Smolník mine is regarded as an environmental<br />
loading in the Central Europe region, where AMD is<br />
generated and discharged from abandoned mine and contaminates<br />
the Smolník Creek catchment. This acid mine drainage<br />
(AMD) with pH 3–4 contents high metal concentrations<br />
that vary in dependence on rainfall intensity (e.g. Fe<br />
500–400 mg dm –3 ; Cu 3–1 mg dm –3 ; Zn 13–8 mg dm –3 and<br />
Al 110–70 mg dm –3 ) (ref. 1 ).<br />
There are various physical-chemical methods of treatment<br />
such polluted water e.g. neutralisation, ion exchange,<br />
precipitation, sorption, membrane processes, filtration. The<br />
choice of the suitable methods is based not only on concentration<br />
of heavy metals in surface water but also on economical<br />
factors.<br />
Sorption belongs to effective and economically<br />
acceptable methods for heavy metals removal. Deorkar and<br />
Tavlarides 1 developed an adsorption process of inorganic<br />
chemically active adsorbents (ICAAs) to selectively recover<br />
Fe 3+ , Cu 2+ , Zn 2+ , Cd 2+ and Pb 2+ from AMD solutions without<br />
neutralization. More than 75 % of copper was removed from<br />
solutions by active carbon and biosorbents prepared from<br />
mosses, the highest sorption capacity had active carbon. On<br />
the other hand, pH values in the presence of active carbon<br />
increased almost to 9, thus copper was precipitated from the<br />
solution 3 .<br />
The paper deals with utilization of four types of sorbents<br />
(zeolite, active carbon and an atypical sorbents usually<br />
used for oil pollutants removal from surface water: turf brush<br />
PEATSORB – a hydrophobic material and universal crushed<br />
sorbent ECO-DRY) for cooper removal from AMD Smolník<br />
and presents influence of them on Cu decreasing under various<br />
conditions. The change of pH has been monitored, too.<br />
Experimental<br />
For study of Cu ions removal from acid mine drainage<br />
by adsorption, zeolites (granularity 0.5–1 mm, <strong>2.</strong>5–5 mm,<br />
4–8 mm) (Zeocem, a.s., Bystré, Slovakia), active carbon<br />
s343<br />
(granularity ≤ 0.1 mm), turf brush PEATSORB and universal<br />
crushed sorbent ECO-DRY (REO AMOS Slovakia) were<br />
used.<br />
Because the experiments were carried out using untreated<br />
AMD (shaft Pech, locality Smolník, Slovakia), which is<br />
very unstable, new sampling of AMD for every experiment<br />
was realised. Copper removal efficiency by sorptive materials<br />
was tested at laboratory temperature under static conditions.<br />
5 g zeolites, 1 g active coal, 5 g turf brush PEATSORB and<br />
5 g universal crushed sorbent ECO-DRY, were overflowed<br />
with 100 ml of raw AMD for 24 h, then the mixtures were<br />
filtrated.<br />
The dependence of Cu concentration decreasing on time<br />
(1; 3; 5; 10 min) was investigated under dynamic conditions<br />
using turf brush PEATSORB. In filtrate was determined pH<br />
(METTLER TOLEDO) and Cu by Bicinchoninate method<br />
(Colorimeter DR 890, HACH LAnGE). Test of Cu precipitation<br />
in AMD was carried out by raw AMD samples of 100 ml,<br />
each were titrated to pH end points ranging from 4 to 8 using<br />
naOH (0.5 mol dm –3 ). During titration, the AMD solution<br />
was continuously stirred and the pH was monitored. When<br />
the preset pH end point was reached, the titrated solution was<br />
filtered to remove precipitated metals. The filtrate was used<br />
for characterizaton of copper solubility as a function of pH.<br />
Results and Discussion<br />
The untreated AMD (pH 3.72, Cu <strong>2.</strong>22 mg dm –3 ) was<br />
taken for adsorption efficiency determination of various sorbents.<br />
In Table I efficiencies of used sorbents on Cu removal<br />
from AMD are presented. In case of zeolite (<strong>2.</strong>5–5.0 mm),<br />
there was irregularity obserwed because the best adsorption<br />
effect was expected in the finest one. This fact can be explained<br />
as the structure faillure of the finest zeolite by acidity of<br />
environment. Turf brush PEATSORB was the most efficient<br />
(54.5 %) from tested sorbents.<br />
Table I<br />
Efficiency of various sorbents on Cu removal<br />
adsorbent pH Cu [mg dm –3 ] efficiency [%]<br />
zeolite (0.5–1.0 mm) 3.5 1.94 1<strong>2.</strong>6<br />
zeolite (<strong>2.</strong>5–5.0 mm) 3.7 1.79 19.4<br />
zeolite (<strong>2.</strong>5–5.0 mm) 3.6 1.93 13.1<br />
active coal 4.3 1.98 10.8<br />
ECO DRY 3.7 <strong>2.</strong>17 <strong>2.</strong>2<br />
PEATSORB 3.1 1.01 54.5<br />
All used sorbents resulted in slightly pH decrease (exepting<br />
active coal) that was positive fact because as it is seen in<br />
Fig. 1. pH above 4 is connected with precipitation of copper<br />
(for AMD pH 3.92, Cu 1.38 mg dm –3 ).<br />
As Fig. <strong>2.</strong> shows 55.8 % of copper were removed after<br />
3 minutes and the longer time of stirring wasn’t efficient. The<br />
pH decreasing can be explained as ion exange process by<br />
humic acid in turf brush 4 .
Chem. Listy, 102, s265–s1311 (2008) Environmental Chemistry & Technology<br />
Fig. 1. Influence of pH on Cu precipitation from AMD<br />
Fig. <strong>2.</strong> Dependence of Cu removal from AMD versus adsorption<br />
time<br />
Conclusions<br />
This study shows possibility of the natural adsorbents<br />
utilisation for Cu removal from acid mine drainage. Turf<br />
brush PEATSORB was the most efficient for copper removal<br />
– decreasing of Cu concentration in AMD was about 54.5 %<br />
under static conditions and 55.8 % in stirred sample during<br />
s344<br />
Fig. 3. Dependence of ph change during Cu removal from<br />
AMD by PEATSORb<br />
3 minutes. Based on experimental results we can state that<br />
chosen adsorbents haven’t influenced pH increasing above 4<br />
excepting active coal hence the Cu removal can be the result<br />
of adsorption proces.<br />
This work has been supported by the Slovak Research<br />
and Development Agency under the contract No. APVV-51-<br />
027705<br />
REFEREnCES<br />
1. Lintnerová, O., et al: Geologica Carpathica. 57, 311<br />
(2006).<br />
<strong>2.</strong> Deorkar, n. V., Tavlarides, L .L.: Environ.Prog. 17, 120<br />
(1998).<br />
3. Kadukova, J., et al: Acta Metallurgica Slovaca. 12, 174<br />
(2006).<br />
4. Panday, A. K., et al: Ecotoxicology and Environmental<br />
Safety. 47, 195 (2000).
Chem. Listy, 102, s265–s1311 (2008) Environmental Chemistry & Technology<br />
P06 INFLuENCE OF ThE COMPOSITE SORbENT<br />
ON ThE CONTENT OF SELECTED ELEMENTS<br />
IN ThE SEDIMENT LOAD OF ThE wATER<br />
RESERVOIR AND SLuDGE bED<br />
Ján BREHUV, OľGA ŠESTInOVá, TOMISLAV<br />
ŠPALDOn, PAVEL SLAnČO, JOZEF HAnČUľáK and<br />
ERIKA FEDOROVá<br />
Institute of Geotechnics of Slovak Academy of Sciences, Watsonova<br />
45, 045 53 Košice,<br />
brehuv@saske.sk<br />
Introduction<br />
Sediment load of the streams and water reservoirs<br />
(hereinafter as WR) are a result of erosive and sedimentation<br />
processes of the respective basins. The term “sediment load”<br />
is used in hydrology according to the norm actually in force 1 .<br />
Geology and geochemistry 2 use the terms “river and bottom<br />
sediments”. The mining waste deposited in mine sludge beds 3<br />
constitute a residue of mining and treatment processes. Pollution<br />
of WR with sediment load causes problems in the decreasing<br />
of water content in the WR 4 aggravating the protection<br />
of the surrounding territory against floods, etc. That is why<br />
the sediment load (bottom sediments) need to be removed<br />
from the WR 5 . Due to great amounts of sediments it needs to<br />
be decided not only on how to extract the sediments, but also<br />
on how to store or dispose of them.<br />
Sludge beds are objects where waste created at mining<br />
extraction of raw materials and mainly created as a result of<br />
the following treatment technologies is deposited or sedimented.<br />
They are designed and built so that they do not constitute<br />
a danger for the surrounding environment. Despite the<br />
facts mentioned above the unwilling seepage of waters from<br />
the sludge beds to the ground water occurs. The waters from<br />
the sludge bed draining containing various elements flow<br />
into the surface streams. Depending on their level of contamination<br />
by various elements, mainly heavy metals (HM)<br />
the water in the surface streams and then their sediments are<br />
contaminated 6,7 .<br />
The sediment load of streams and reservoirs may be<br />
classified as hydromorphic, subhydric soils 8 . However, there<br />
is a difference resting in the method of their contamination<br />
by various elements. They are situated in a different aquatic<br />
environment and catch contaminants from several sources.<br />
They are contaminated by a wider spectrum of elements than<br />
soils what makes their use 9 or treatment more complicated.<br />
That is fully true also about the sediment load and the mining<br />
waster in the basins of the Hornád River (Fig. 1.) treatment<br />
of which is using a composite sorbent is the subject of this<br />
paper (poster).<br />
The literature proves that only the treatment of drinking<br />
waters 10 , industrial waters 10,11 and soils using natural zeolites<br />
was successful. There are published results of an experimental<br />
testing of other natural materials, but they relate to soil treatment<br />
12,13 only. However, it seems that there is a need to find<br />
a specific technological procedure with a specific sorbent 14<br />
s345<br />
Fig. 1. Situation map of the hornad river basin<br />
for the treatment of soil, sediment or mining waste deposited<br />
on the dumping sites (dumps) or sludge beds (Fig. <strong>2.</strong>) for<br />
a longer period of time.<br />
Fig. <strong>2.</strong> Situation map of the dumps localities in hornad river<br />
basin<br />
Experimental works<br />
The most suitable solution of the problem of HM contaminated<br />
sediments should be their extraction after previous<br />
solution of reduction of the content or stabilization of<br />
dangerous HM contained in the sediment load (bottom sediments).<br />
That is why the first laboratory experiments were<br />
carried out at the beginning of 2007 monitoring the impact<br />
of the inorganic composite sorbent to reduce the content or<br />
stabilization of the elements in the sediment load of the water<br />
reservoir “Ružín I”. According to the producer of this sorbent<br />
it is made from natural raw materials. It is mixture of atomically<br />
clays, smectite basalt tuffs, alginate, dolomite, gypsum,<br />
zeolite, coal and others. Proportion of individual components<br />
is trade secret. Qualitative mineralogical analysis of this<br />
sorbent was made by X-ray diffraction analysis. It contain<br />
amorphous phase, calcite ( > 15 %) as dominant minerals<br />
and quartz, sericite, chlorit-caolinite, dolomite (3–15 %)
Chem. Listy, 102, s265–s1311 (2008) Environmental Chemistry & Technology<br />
as accompanying minerals. The impact of the mentioned sorbent<br />
on the reduction of the Hn content in the sediment load<br />
was observed in laboratory conditions in compliance with the<br />
producer’s recommendation in form of a 120 and 333 days<br />
experiment<br />
The procedure of the 120-day experiment was as follows.<br />
First, 9.5 g of the sediment were weighted and 0.5 g<br />
of the sorbent added corresponding to 5 per cent by weight.<br />
The samples were put in 250 ml PVC bottles for 120 days and<br />
poured with 10 ml of the destilled water. After expiration of<br />
120 days to each of the samples a 100 ml of 2M HnO 3 were<br />
added as a leaching agent. Then, the samples were shaken for<br />
6 hours and sedimented for 1 hour.<br />
A similar procedure was carried out in connection with<br />
the 333 days experiment. First 9.5 g of the sediment were<br />
weighted and 0.5 g of the mentioned sorbent added corresponding<br />
to 5 per cent by weight in accordance with producer´s<br />
recommendation. The samples were put in 250 ml PVC bottles<br />
for 333 days and poured with 10 ml of the destilled water.<br />
After expiration of 333 days to each of the samples a 100 ml<br />
of 2M HnO 3 were added as a leaching agent. Then, the samples<br />
were shaken for 6 hours and sedimented for 1 hour.<br />
In both cases the contents of selected elements Cu, Cr,<br />
ni, Pb and Zn were ascertained using AAS methods. For<br />
determination of the content of Cu and Zn flame atomic<br />
absorption spectrometry and for Cr, ni and Pb graphite tube<br />
atomizer were used.<br />
Results and Discussion<br />
The results of the experiment when the composite sorbent<br />
affected the samples of sediment load from water reservoir<br />
for 120 and 333 days are contained in Table I.<br />
The results of the experiment when the composite sorbent<br />
affected the samples of mining waste from sludge bed<br />
for 120 and 333 days are contained in Table II.<br />
The content of elements of ni, Cr and Pb in the samples<br />
marked like 1C–4C as well as in the samples containing the<br />
composite sorbent (CS) is under the lowest limit TV, norm for<br />
environment 15 and that is why the results are not in Table I<br />
and are not commented. The remaining samples marked like<br />
120 d CS have shown the decrease of Cu from 4.53 to 8.20 %<br />
and from 11.55 to 38 % for Zn after 120 days. After 333 days<br />
the decrease of the content of Cu was ascertained from 5.55<br />
to 15.83 % and Zn showed the content decrease from 11.26<br />
to 37.1 %.<br />
The cont ent of ni and Cr in procured control samples<br />
(C) as well as in samples containing the composite sorbent<br />
(CS) was under the lowest limit TV, of the norm for environment15<br />
and that is why the results are not commented.<br />
The remaining samples marked as CS have shown the<br />
decrease of Cu from 7.25 to 11.65 %, Pb from 7.10 to 13.81 %<br />
and Zn from 15.36 to 19.68 % after 120 days. After 333 days<br />
the decrease of the content of Cu was ascertained from 11.23<br />
to 14.76 %, Pb from 5.87 to 11.57 % and the content of Zn<br />
decreased from 7.67 to 9.81 %.<br />
s346<br />
Table I<br />
Influence of composite sorbent on content of heavy metals of<br />
sediment load from the water reservoir<br />
Sample<br />
Cu<br />
[mg kg<br />
Zn<br />
–1 ]<br />
1 C 151 76.4<br />
120 d CS 140.5 (7 %) 47.35 (38 %)<br />
333 d CS 127.1 (15.83 %) 48.05 (37.1 %)<br />
max. % of decrease 15.83 38<br />
2 C 168 386.8<br />
120 d CS 157 (6.55 %) 306.6 (20.57 %)<br />
333 d CS 14<strong>2.</strong>9 (14.94 %) 311.7 (19.25 %)<br />
max. % of decrease 14.94 20.57<br />
3 C 48.8 54.9<br />
120 d CS 44.8 (8.20 %) 36.3 (33.88 %)<br />
333 d CS 44.0 (9.84 %) 38.8 (29.33 %)<br />
max. % of decrease 9.84 33.88<br />
4 C 342 310.8<br />
120 d CS 326.5 (4.53 %) 274.9 (11.55 %)<br />
333 d CS 323 (5.55 %) 275.8 (11.26 %)<br />
max. % of decrease 5.55 11.55<br />
1C–4C control sample of sediment load without composite<br />
sorbent;<br />
120 d CS a 333 d CS – samples of sediment load with composite<br />
sorbent after 120 and 333 days<br />
Table II<br />
Influence of the composite sorbent on the content of heavy<br />
metals in the waste from the mining sludge bed<br />
Sample<br />
Cu Pb<br />
[mg kg<br />
Zn<br />
–1 ]<br />
Dam C 103 1,296 1,382<br />
120 d CS<br />
91<br />
(11.65 %)<br />
1,117<br />
(13.81 %)<br />
1,110<br />
(19.68 %)<br />
333 d CS<br />
87.8<br />
(14.76 %)<br />
1,146<br />
(11.57 %)<br />
1,276<br />
(7.67 %)<br />
max. % of dec. 14.76 13.81 19.68<br />
Lagoon C 552 2,351 2,364<br />
120 d CS<br />
512 2,184 2,001<br />
(7.25 %) (7.10 %) (15.36 %)<br />
333 d CS<br />
490<br />
(11.23 %)<br />
2,213<br />
(5.87 %)<br />
2,132<br />
(9.81 %)<br />
max. % of dec. 11.23 7.10 15.36<br />
C – control sample from the mining sludge bed without composite<br />
sorbent<br />
120 d CS a 333 d CS – samples with composite sorbent<br />
Application of the composite sorbent also decreased the<br />
contents of Cu, Pb and Zn in both samples but the percentage<br />
of the content of HM is insignificant. Due to very significant<br />
exces of the content of Cu, Pb and Zn compared to the highest<br />
limit – IV, of the norm for environment 15 . Recycling of<br />
the waste deposited in the sludge bed should be considered
Chem. Listy, 102, s265–s1311 (2008) Environmental Chemistry & Technology<br />
as more favorable aiming at gaining Cu, Pb and Zn. It has<br />
been the very first experiment and so our opinion may not be<br />
considered as a decisive one.<br />
Conclusions<br />
• When verifying the content of the composite sorbent on<br />
the content of heavy metals in the WR sediment load and<br />
wastes in the sludge bed, the decrease of the content of<br />
Cu, Pb and Zn has been ascertained. The decrease is not<br />
significant. nO other sorbents were used for the experiment<br />
and so composite sorbent cannot be recommended<br />
for the HM decreases.<br />
• A long-term verification is needed for the recommendation<br />
of the application of used sorbent to decrease the<br />
content of HM in sediment load as well as the mining<br />
waste. The results need to be considered as preliminary<br />
and they require further verification in the conditions “in<br />
situ” for the minimum of 2 years.<br />
• Further experiments should focus on the comparison of<br />
the used sorbent with sorbents that are accessible and<br />
experimentally tested, such as zeolites, bentonites, kaolinites<br />
and based on experimental results the most suitable<br />
sorbents should be proposed for the sediment load,<br />
wastes from sludge beds or soil.<br />
• Today, the verification of the respective sorbent is underway<br />
in various foreign institutes. It would be useful to<br />
study the results, if they are published. Later after further<br />
experimental verification it using in our condition<br />
can be recommended.<br />
This paper was made under support of the grant agency<br />
VEGA within the project 2/7045/27 and the Agency for Support<br />
of Research and Development based on Contract No.<br />
APVV-51-027705.<br />
REFEREnCES<br />
1. ČSn 73 65 11: Nomenclature in Hydrology (1.7.1977)<br />
<strong>2.</strong> Šutriepka M.: Geochemical Research of Contamination<br />
of Bottom Sediments of Water Reservoirs of Ružín<br />
and Veľké Kozmalovce. Doctoral Thesis. Faculty of<br />
natural Sciences, Department of Geochemistry of the<br />
Comenius University in Bratislava 2007, 168 s.<br />
3. Peter P. and all: Designing and building up of the sludge<br />
beds. ALFA Bratislava, 312 p.<br />
4. Bobro M. , Brehuv J., Hančuľák J., Merva M.: Development<br />
of Erosive and Sedimentation Processes in<br />
the Water Reservoir Ružín. Final Report. ČÚ B-3 pre<br />
ESPRIT Banská Štiavnica. ÚGt SAV Košice, October<br />
1996.<br />
s347<br />
5. Brehuv J., Bobro M., Hančuľák J.: Distribution of Several<br />
Risk Elements in the Sediments of the Water Reservoir<br />
Ružín I. Acta Montanistica Slovaca. Year 2 3/1997,<br />
TU Košice, p. 295-297. ISSn 1335-1788.<br />
6. Brehuv J.: Contamination of Sediments of the Water<br />
Reservoir Ružín I by heavy metals in Relation to Slime<br />
Pits. Acta Montanistica Slovaca. Košice, Vol.5, 3/2000,<br />
p. 306-309. ISSn 1335-1788. 1.<br />
7. Šutriepka M.: Contamination of Bottom Sediments of<br />
Selected Water Reservoirs by Potentially Toxic Elements:<br />
Workshop: “Creation and Assessment of Dangerous<br />
Mining Pollution“ Modra-Harmónia, 15. – 17. 5.<br />
2006. KÚ, Prír. fak. Bratislava.<br />
8. Hraško J: Soil Analyses. Slovenské vydavateľstvo<br />
pôdohospodárskej literatúry, Bratislava, 196<strong>2.</strong><br />
9. Bobro M., Brehuv J., Hančuľák J., Slančo P., Špaldon<br />
T., Šestinová O., Lucová K.: FinalReport – Quality<br />
and Quantity Research Related to Sediments and Erosive<br />
Processes in the Basin of Hornád and Hnilec to the<br />
Water Reservoir Profile of Ružín I. in 2002 –2005 - for<br />
Slovenský vodohospodársky podnik š.p. Banská Štiavnica,<br />
Odštepný závod Košice. ÚGt SAV Košice, október<br />
2006. 56 s.<br />
10. Horváthová E.: Ion Exchange on Natural Zeolites in<br />
the Technologies of Water Treatment and Cleaning.<br />
Research Institute of Water Economy, Bratislava, 1990,<br />
69.s.<br />
11. Jablonovská K., Štyriaková I.: Absorption of Zinc and<br />
Lead to Clay Minerals. Acta Montanistica Slovaca, 11,<br />
Mimoriadné číslo 2, 304 (2006).<br />
1<strong>2.</strong> Szabová T., Bugel M., Leščinská M.: Possibility of the<br />
Use of Zeolites in the Protection of Environmental Components.<br />
Acta Montanistica Slovaca. Ročník 4, 1/1999,<br />
p. 61-65.<br />
13. Reháková M., Čuvanová S., Gavaľová Z., Rimár J.:<br />
Chem. Lett. 97, 260 (2003).<br />
1<strong>2.</strong> Decision of the Ministry of Environment of the Slovak<br />
Republic on the Highest Tolerated Values of Harmful<br />
Substances in the Soil and on Identification of Organisation<br />
Eligible to Assess Real Values of those Substances<br />
No. 531/1994-540. (1994)<br />
14. Kafka Z., Punčochářová J.: Chem. Lett. 96, 800 (2002).<br />
15. Metodological Instruction of the Ministry of Environment<br />
of the Slovak Republic no. 549/1998-2 for Assessment<br />
of Risks from Pollution of Sediments of Streams<br />
and Water Reservoirs. (1998)
Chem. Listy, 102, s265–s1311 (2008) Environmental Chemistry & Technology<br />
P08 ENGLISh FRO ChEMISTS CAN bE PhuN<br />
GABRIELA CLEMEnSOVá<br />
Faculty of Chemistry, Brno University of Technology, Purkyňova<br />
118, 612 00 Brno, Czech Republic,<br />
clemensova@fch.vutbr.cz<br />
“To teach or not to teach any special English tailored to<br />
serve a particular profession which in our case means English<br />
for chemists? ...Isn’t deep, substantial knowledge of general<br />
English everything one needs to be able to communicate?”<br />
Such questions are often ask by many a technically oriented<br />
colleague I meet at my workplace. To answer them,<br />
I always remember Elaine Horowitz, PhD from the School<br />
of Education of UT at Austin (TX). She openes her doctoral<br />
classes on Foreign Language Acquisition with the following<br />
definition of language competence:<br />
“Foreign language competence can be defined as the<br />
ability of authentic self presentation in that language. In other<br />
words, you can be called competent in L2 if the level of your<br />
education is reflected in the way you use this language. That<br />
means if a native speaker finds out who you are from the way<br />
you communicate.”<br />
Accepting this approach to competency we can say with<br />
confidence that English for specific purposes has its irreplaceable<br />
position in a postsecondary curriculum.<br />
ESP may not always focus on the language of one specific<br />
discipline or occupation, but it is supposed to introduces<br />
students to common features of academic discourse in the<br />
sciences or humanities, frequently called English for Academic<br />
Purposes (EAP),<br />
I would like to communicate some ideas and experience<br />
of teaching ESP classes at the Faculty of Chemistry of BUT.<br />
Our mission of teaching English for future chemists is more<br />
or less challenged by these phenomena:<br />
(i) Absence of appropriate teaching materials on the<br />
market. We have not found any material in bookstores which<br />
would fit our specific needs and could be used as an English<br />
textbook for the chemistry students. (This said with no intention<br />
to blame any bookstore, of course!)<br />
(ii) The different language experience of the students<br />
who come to our school. Their language proficiency often<br />
ranges from the true novice level to the advanced. The beginners<br />
and lower intermediate students have the possibility to<br />
attend two semesters of general English classes before they<br />
register for ESP. However, the different level of their language<br />
knowledge in the ESP classes cannot be fully eliminated<br />
as you could hardly expect them to make the leap from<br />
the beginner level to the upper intermediate or even advanced<br />
one in one year.<br />
(iii) The absolute majority of our students strongly<br />
oppose and almost detest memory based learning as they are<br />
used almost entirely to rely on their ability of logical reasoning.<br />
(“We would not have been here at BUT if we had<br />
been able to memorize. If we had been able to memorize, we<br />
would sure have studied law or humanities!)<br />
s348<br />
(iv) Students, especially in the previous years, had often<br />
a feeling that English was not their major specialization.<br />
That they did not come here to study English but chemistry.<br />
Despite the gradual change in this approach, there are always<br />
some who enter to the English classroom saying: “We are<br />
so tired from the previous instructions ...,” The laboratory<br />
classes we have just had were so tedious...”, We are just after<br />
organic chemistry/physics, math, … classes and tests, absolutely<br />
drained both intellectually and physically, please, do not<br />
want us to talk…” etc, etc.<br />
(v) Last but not least challenge is that the technically<br />
oriented students are not such good “natural speakers” even<br />
in their mother language as the students of the humanities.<br />
(“My goodness gracious, I do not know what to say even in<br />
Czech. And now you want me to communicate it in English<br />
on top of it…!”)<br />
What have we done to cope with the above mentioned<br />
challenges?<br />
Ad (i) The first step to overcome the gap in the teaching<br />
materials on the market was the creation and implementation<br />
of the teaching material of our own. At the earlier stages of<br />
our professional lives at our school we always prepared handouts<br />
and distributed them at the beginnings of the lessons.<br />
The dramatic change in our work occurred when the internet<br />
was installed into most of our classrooms. The availability of<br />
this medium made a great stimulus for us to create an internet<br />
based textbook which we called English for Chemists www.<br />
fch.vutbr.cz/ang<strong>2.</strong> When creating this material we had the<br />
following objectives in minds:<br />
The structure of our faculty – it is reflected in the selection<br />
of the topics as the subject matter of the individual lessons<br />
corresponds with the specialization of our institutes...<br />
Proportional balancing of the lesson content so that all<br />
four major skills could be developed equally. The use of 4<br />
different icons (indicating writing, talking, listening and<br />
reading) to label the individual exercises gives us a quick<br />
orientation.<br />
We tried hard to bring sound into the reading activities. –<br />
Why do we emphasize sound so much? Everybody will agree<br />
that priority number 1 in foreign language instructions is to<br />
reach fluency. Fluency can be defined as the ability to understand<br />
and speak instantly, e.g. without translating. Fluency<br />
enables us to talk easily with native speakers. They easily<br />
understand us and we easily understand them The only way<br />
how to reach it goes through listening. That means we shall<br />
not get fluency in English just by reading English articles<br />
or learning grammar rules. To become fluent, students must<br />
have a lot of understandable, repetitive listening. It means,<br />
they will not learn English only with their eyes, but they<br />
must learn English with their ears. It is important to know<br />
that powerful listening must be repetitive and understandable<br />
(A. J. Hoge). We managed to answer this demand by the following<br />
ways:<br />
•<br />
the reading sections of the textbook have been vocalized<br />
by a native lecturer
Chem. Listy, 102, s265–s1311 (2008) Environmental Chemistry & Technology<br />
•<br />
•<br />
each vocabulary section is competed with a hyperlink<br />
going to Merriam-Webster on-line dictionary which is<br />
soundtracked<br />
each lesson is completed with a substantial number of<br />
hyperlinks going to various sound tracked specific articles,<br />
animations, video recordings, demonstrations etc.<br />
that can be utilized for this purpose.<br />
Exposing students to the culturally authentic sources as<br />
much as possible. (e.g. videotapes, radio and TV broadcasts,<br />
films, songs etc.) – this material has long been advocated<br />
by foreign language educators as stimulating pedagogical<br />
aids. One of the best sources of the authentic materials for<br />
classroom instructions is the Internet. Target language sites<br />
accessed through the Internet offer both teachers and students<br />
a wealth of authentic materials. The advantage of such<br />
materials is that they are current and readily available. Their<br />
topicality can be easily maintained by the regular visits of<br />
these web sites. That is why we completed the individual lessons<br />
with hyperlinks going to various specific video sections,<br />
songs, soundtracked animations, classroom instructions etc.<br />
However, it is important to remember, that the documents<br />
found on the Web, like all authentic materials, have<br />
been created by and for native speakers of the language.<br />
That means they are not written with the language learning<br />
in mind. For this purpose we assessed these documents from<br />
the perspective of their general understandability first. Then<br />
we have completed these materials with the tasks that suit<br />
even the less proficient students.<br />
Ad (ii) The different language experience of our students<br />
We tried to meet the needs of the less proficient students<br />
by creating each textbook lesson in two versions. Firstly it<br />
is a printable version which the student will print and bring<br />
with him/ her to the class. Its format leaves plenty of space<br />
for writing down student’s own answers. Secondly, each unit<br />
has also the version completed with the clues to all exercises.<br />
This serves mainly to the less advanced ones to go through<br />
the explain subject matter at home again and check their<br />
answers or possibly to look up the correct answers.<br />
Besides, each lesson is ended with a short self test enabling<br />
the students to evaluate their comprehension.<br />
Ad (iii) Unwillingness to learn vocabulary and idioms<br />
by memorizing<br />
Experts say that most of people must hear a new word<br />
30 times to remember it forever. To know a word and instantly<br />
understand it, you probably need to hear it 50–100 times. The<br />
students must know that it is not enough to listen to a new<br />
word just once or twice. As the time allocation of our classes<br />
do not allow to practice repetitive listening to much at school,<br />
the students are strongly recommended to go to all the listening<br />
material again at their leisure, e.g. at home, and repeat<br />
all the listening activities as many times as possible.<br />
Ad (iv) How to engage the students who are tired from<br />
the previous “more important” classes? The answer is: make<br />
the English for chemists fun.<br />
s349<br />
Here the Internet makes a great aid again. We can use<br />
various science/chemistry oriented humor, interactive quizzes,<br />
crossword puzzles and various songs created by native<br />
students and teachers with the aim to bring fun and entertainment<br />
into their chemistry classes. Songs make excellent<br />
memory boosters. AS most people have strong musical<br />
memory, we take can advantage of this fact to make memorization<br />
and learning easier. Putting words to music instantly<br />
makes those words more memorable.<br />
Besides memorizing song verses our learners can profit<br />
from retelling the jokes, playing memory boosting quizzes<br />
(e.g. flash cards), solving crosswords etc.<br />
This can be effectively completed with the popular game<br />
based on the repetition of the words. Everybody who has ever<br />
visited a language school will sure the remember the game<br />
called: In our local super market we can buy/I will pack into<br />
my suitcase … Its variations on the premises of our school<br />
sound: In our chemistry laboratory we have … (the names<br />
of various laboratory equipment follow) .../Breathing carbon<br />
monoxide will cause… (Symptoms of CO poisoning)/Iodine<br />
deficiency causes… etc, etc.<br />
Ad (v) Shyness to speak<br />
During a semester students must prepare their own mini-<br />
presentations to meet one of the necessary conditions of getting<br />
a credit. Prior this activity they are provided with all the<br />
necessary phrases and expressions so that they learn how<br />
to address the audience, introduce themselves, express the<br />
purpose of the paper/presentation, signpost the presentation,<br />
move on in the course of it, describe the pictures, verbalize<br />
graphical data, ask checking-up questions, invite questions,<br />
finish the presentation… Though the students are encouraged<br />
to use the topics which have been explained in the classes,<br />
they widely use the Internet again as a rich source of additional<br />
information.<br />
We managed to incorporate two funny chemistry oriented<br />
dramas into a lesson. The plays come from the Internet<br />
and where created by the native authors without the language<br />
learning objective. However, our students find them<br />
very entertaining and participate enthusiastically in dramatic<br />
readings.<br />
This activity also fits a multilevel class as the students<br />
are given the freedom in adapting the sentences. So the less<br />
advanced can make their entries less complicated and simpler,<br />
while the more advanced ones enjoy the full versions of<br />
their roles. Dramatization engages students emotionally and<br />
socially, as well as intellectually. The students thoroughly<br />
enjoy it, and it leaves strong, memorable impressions which<br />
can later help recall and improve learning. Thus at the end of<br />
the activity they are able to repeat various catch phrases by<br />
heart (e.g. thanks to the plays “Becoming an alcohol – a sad<br />
story of good oxygen becoming bad”, or “Electrophilic Addition”<br />
they will long remember structures as: “My mom has<br />
always warned me against organic acids”, “It is against the<br />
rule. What rule? Markovnikov’s rule!” Aren’t my electrons<br />
good enough for you? “Along comes electron hogging
Chem. Listy, 102, s265–s1311 (2008) Environmental Chemistry & Technology<br />
chlorine” “Keep your precious electrons for yourself, you …<br />
!” etc).<br />
The students are encouraged to role play the authentic<br />
professional dialogues videotaped for instructional purposes<br />
as well as those which are found on the ESL web pages.<br />
After all, we can say that English for chemists is pHun!<br />
s350
Chem. Listy, 102, s265–s1311 (2008) Environmental Chemistry & Technology<br />
P09 VOLATILE DEGRADATION PRODuCTS OF<br />
POLyuREThANE FOAMS<br />
DAnIELA MáCOVá, TEREZA TOBIáŠOVá and JOSEF<br />
ČáSLAVSKý<br />
Institute of Chemistry and Technology of Environmental Protection,<br />
Faculty of Chemistry, Brno University of Technology,<br />
Purkyňova 118, 612 00 Brno, Czech Republic,<br />
xcmacova@fch.vutbr.cz<br />
Introduction<br />
Polyurethanes are the world’s sixth most abundant synthetic<br />
polymer. The most of their production represent flexible<br />
polyurethane foams. At the end of their life-cycle they are<br />
often deposited on waste dumps, where they degrade under<br />
the influence of various environmental factors; photodegradation<br />
and hydrolysis are the main routes. After that, their<br />
degradation products can be distributed in the environment.<br />
In common, synthetic polymers are not prone to environmental<br />
degradation. Therefore, they could stay there for a long<br />
time. Their degradability can be improved by addition of the<br />
biodegradable filler.<br />
The generation of volatile products has been reported<br />
from the photo- and thermal degradation of many polymers.<br />
1–4 Complex mixtures of degradation products of this<br />
type were for example identified in starch-based polymers 5 .<br />
Till now, there is no information about volatile compounds<br />
generated during photodegradation of synthetic polyurethane<br />
with biodegradable filler. Several studies have been developed<br />
on the UV degradation of aromatic polyurethane. Such<br />
photo-degradation has already exhibited formation of free<br />
radicals, recombination, scission of bonds, crosslinking and<br />
oxidation reactions 6,7 .<br />
This paper is focused on the identification of volatile<br />
photodegradation product of polyurethanes modified<br />
by biodegradable filler using Solid Phase Microextraction<br />
(SPME) and Gas Chromatography linked to Mass Spectrometry.<br />
The SPME method was selected in the experiment for<br />
its fastness, simplicity and environmental friendness.<br />
Experimental<br />
M a t e r i a l a n d S a m p l i n g<br />
Polyurethane foam modified with biodegradable filler<br />
like carboxymethyl cellulose, acetylated potato starch, cellulose<br />
acetate, 2-hydroxyethyl cellulose and wheat protein<br />
were prepared at the Institute of Material Chemistry at Faculty<br />
of Chemistry, Brno University of Technology.<br />
For sampling of volatile compounds the system consisting<br />
of quartz tube with Teflon cover and two SPME holders,<br />
the first with polyacrylic fibre (PA) 85 µm and the second with<br />
polydimethylsiloxane fibre (PDMS) 100 µm (both Supelco,<br />
USA) and UV lamp (high-pressure mercury discharge tube,<br />
λ = 254 nm), was set-up. The system is shown on Fig. 1.<br />
s351<br />
Fig. 1. System for sampling of VOCs formed by photodegradation<br />
of polymer<br />
G C - M S a n a l y s i s<br />
Separation and identification of volatile compouds from<br />
UV-induced polyurethane foam photodegradation was realized<br />
using Agilent 6890n gas chromatograph coupled with<br />
Agilent 5973 mass selective detector (Agilent Technologies,<br />
Germany). HP-5MS column 30.0 m × 0.25 mm × 0.25 μm<br />
was used for the separations. The injector and transfer line<br />
temperature was 270 °C. The GC oven temperature program<br />
for PDMS fibre was: 4 min at 40 °C, then increased<br />
at 15 °C min –1 to 100 °C, then 8 °C min –1 to 270 °C, then<br />
15 °C min –1 to 280 °C. For the compounds desorbed from<br />
PA fibre the column temperature program was slightly modified:<br />
4 min at 40 °C, increased at 10 °C min –1 to 230 °C, then<br />
15 °C min –1 to 280 °C. Injection/desorption of analytes from<br />
SPME fibres was realized in splitless mode. Helium was used<br />
as the carrier gas at a constant flow of 1 ml min –1 . Ion source<br />
temperature was 230 °C, electron ionization at 70 eV was<br />
used. Quadrupole analyzer of the MSD was operated in scan<br />
mode within a range 30–550 amu, solvent delay was 4 min.<br />
Identification of separated compounds was based on nIST 05<br />
spectral library search.<br />
Results<br />
Seven types of polyurethane foams with different fillers<br />
and reference foam without filler were irradiated by UV lamp<br />
during this study. Volatile compounds were sorbed on PA and<br />
PDMS fibers and desorbed, separated and detected by GC-<br />
MS technique.<br />
All identified compound are listed under chromatograms<br />
(Figs. <strong>2.</strong> and 3.). Many various compounds have been<br />
identified.<br />
Group of branched and non-branched aliphatic hydrocarbons<br />
containded: pentadecane, hexadecane, heptadecane,<br />
2,6,10,14-tetramethylpentadecane, 2,6,10,15,19,23-hexamethyl-2,6,10,14,18,22-tetracosahexaene<br />
(Squalene). These<br />
compounds are probably formed by homolysis of bonds in<br />
soft part of polyurethane.<br />
Group of ketone and fatty acid esters contained: 6,10dimethyl-5,9-undecadiene-2-one,<br />
methylester of dodecanoic<br />
acid and isopropylester of tetradecanoic acid.<br />
By photo-oxidation of alkenes hydroperoxides were<br />
formed – 1,3-dioxane and 2-methyl 1,3-dioxane.
Chem. Listy, 102, s265–s1311 (2008) Environmental Chemistry & Technology<br />
Fig. <strong>2.</strong> Volatile degradaction products of polyurethane foam<br />
sorbed on PDMS fibre<br />
1: 2-methyl-1,3-dioxane, 2: 2,4-diisocyanatotoluene, 3: 6,10dimethyl-5,9-undecadiene-2-one,<br />
4: 2,5-diterc-butyl-1,4-benzochinone,<br />
5: pentadecane, 6: hexadecane, 7: 2,6-bis(1,1-dimethyethyl)-4-(1-oxopropyl)phenol,<br />
8: 1-methylester dodecanoic<br />
acid, 9: 4-decyl-morphline, 10: heptadecane, 11: 2,6,10,14-tetramethylpentadecane,<br />
12: isopropylester tetradecanoic acid,<br />
13: 4-undecyl-morpholine, 14: N,N-dimethyl-1-hexadecanamine,<br />
15: 4-tetradecyl-morpholine, 16: squalene, 17: 4-hexadecyl-morpholine<br />
Also nitrogen derivates were detected, namely line of<br />
alkyl-substitued morpholines and n,n-dimethyl-1-hexadecanamine.<br />
By the photolysis of hard segment of polyurethane foam<br />
2,5-diterc-butyl-1,4-benzochinone, 2,6-bis(1,1-dimethyethyl)-4-(1-oxopropyl)phenol<br />
and 2,4-diisocyanatotoluene<br />
(2,4-TDI) were formed.<br />
2,4-TDI is very volatile and toxic. The compound is<br />
used as main reagent at synthesis of polyurethane. 2,4-TDI<br />
was detected in case of all polymers modified by celulose<br />
derivate fillers. It is difficult to say whether that compound is<br />
photodegradation product of polyurethane foam or unreacted<br />
raw material residue. It will be studied in the next research.<br />
All the compounds were detected in most polyurethane<br />
samples. There was observed qualitative change only.<br />
Quantitative differences were found in the case of minority<br />
distribution compounds. Their identification using library<br />
search in nIST 05 was unsuccessful in most cases. Probably<br />
small concentrations of analyte and resulting low-intensity<br />
mass spectra could be the reason, or – due to specific character<br />
of volatile compound made by irradiation of polyurethane<br />
foam – their mass spectra are not included in this library.<br />
PA fibre shows higher selectivity in comparison with<br />
PDMS fibre which in opposite gives more complex information<br />
about volatile compounds formed during photodegradation<br />
of polyurethane.<br />
s352<br />
Fig. 3. Volatile degradaction products of polyurethane foam<br />
sorbed on PA fibre<br />
1: 2-(2-ethoxyethoxy)-ethanol, 2: 2-ethyl-hexanoic acid, 3: 1,3dioxane,<br />
4: 2-methyl-1,3-dioxolane, 5: 2-methyl-1,3-diisocyanatobenzene,<br />
6: 2,6-bis(1,1-dimethyethyl)-4-(1-oxopropyl)phenol,<br />
7: 4-decyl-morpholine, 8:4-undecyl-morpholine, 9: N,N-dimethyl-1-hexadecanamine,<br />
10: 4-tetradecyl-morpholine, 11: 4-hexadecyl-morpholine<br />
Conclusions<br />
In this study the SPME method was applied for the<br />
identification of volatile compounds formed by irradiation<br />
of polyurethane foams modified by biodegradable fillers. A<br />
wide range of compounds was detected and most of them<br />
were succesfully identified by library search. The identification<br />
of the remaining compounds will be a subject of the next<br />
research.<br />
The finantial support from the project no.MSM<br />
0021630501 from Ministry of Education, Youth and Sport of<br />
the CR is greatly acknowledged.<br />
REFEREnCES<br />
1. Philippart J. L., Posada F., Gardette J. L.: Polym. Degr.<br />
Stab. 285, 49 (1995).<br />
<strong>2.</strong> Albertsson A. Ch., Karlsson S.: Polym. Degr. Stab. 245,<br />
41 (1993).<br />
3. Khabbaz F., Albertsson A. Ch., Karlsson S.: Polym.<br />
Degr. Stab. 329, 61 (1998).<br />
4. Carlsson D. J., Krzymien M., Worsfold D. J., Day M.: J.<br />
Vinyl. Add. Techn. 3, 2 (1997).<br />
5. Hakkarainen M., Albertsson A. Ch., Karlsson S.: J. chromatogr.<br />
A. 741, 251 (1996).<br />
6. Dannoux A., Esnouf S., Begue J., Amekraz A., Moulin<br />
C.: nucl. Instr. Meth. Phys. Res. B. 236, 488 (2005).<br />
7. Irusta L., Fernandez-Berridi M.J.: Polymer 40, 4821<br />
(1999).
Chem. Listy, 102, s265–s1311 (2008) Environmental Chemistry & Technology<br />
P10 DyNAMIC SIMuLATION OF bIOLOGICAL<br />
NITROGEN REMOVAL PROCESSES<br />
LEnKA ČERnOCHOVá a , Ján DERCO a and MAnFRED<br />
SCHüTZE b<br />
a Faculty of Chemical and Food Technology, Institute of Chemical<br />
and Environmental Engineering, Slovak University of<br />
Technology, Radlinského 9, 812 37 Bratislava, Slovakia,<br />
b ifak – Institut für Automation und Kommunikation e.V. Magdeburg,<br />
Werner-Heisenberg-Str. 1, 39106 Magdeburg, Germany,<br />
lenka.cernochova@stuba.sk<br />
Introduction<br />
With rising requirements for protection water resources<br />
and thereby for quality of effluent wastewater too, more<br />
complex technologies for wastewater treatment are applied<br />
as well. These technologies are characterised by more processes<br />
with different reaction rates and requirements in term<br />
of reaction conditions, interactions and generally by more<br />
complex structure of treatment lines. The complexity of these<br />
systems is also related to mutual interaction between wastewater<br />
treatment plant (WWTP) and others parts of the urban<br />
wastewater system, e.g. sewer system and receiving water<br />
(Derco and Schütze, 2004). Consequently, designing of processes<br />
and technologies and their efficient operation are also<br />
significantly complex.<br />
Mathematical models and simulations programs belong<br />
to prospective and currently more often utilised tools. They<br />
offer a simple way how to analyse changes in technologies<br />
at WWTP by optimisation or intensification already existed<br />
plants or it can help by designing new WWTPs as well.<br />
The results of application of the Activated Sludge Model<br />
no. 1 (ASM1) (Henze et al., 1987) using dynamic simulations<br />
for verification of steady state design with regard to dynamic<br />
behaviour of the WWTP and for prediction dynamic effluent<br />
concentration values are presented.<br />
Dynamic Simulation of wwTP<br />
ASM1 was used for modelling of the biological stage<br />
at real WWTP in nové Zámky (Fig. 1.). Two series of measurements<br />
included diurnal variations of wastewater flow<br />
and composition in input and output at the biological stage<br />
were carried out. The first set of measurement was perfomed<br />
in May 2002, when the nitrification process was operated.<br />
Because of expected more stringent requirements in effluents,<br />
this activated sludge plant was upgraded in 2003 applying a<br />
pre-denitrification system. The second measurements were<br />
realised after the reconstruction (in March 2007). The results<br />
of measurements were transformed into organic and nitrogen<br />
pollution fractions according to structure of the ASM1.<br />
For comparison of the experimental and the calculated<br />
resultant concentration values in the WWTP effluent were<br />
chosen criteria according the Regulation of the Slovak government<br />
(2005). The model ASM1 and the default parameter<br />
values included in the SIMBA program have been used for<br />
s353<br />
performing dynamic simulations. The calculated concentration<br />
values for individual pollutants in daily composite samples<br />
were calculated based on pollutant mass balancess.<br />
Fig. 1. Schemes of wwTP setups; Above: wwTP before reconstruction<br />
(2002); below: wwTP after reconstruction (2007)<br />
Results<br />
M o d e l S u i t a b i l i t y<br />
First step of simulations was to verify suitability of<br />
ASM1 to describe WWTP. From the results (Fig. 2) it can be<br />
concluded that the dynamic simulations describe the experimental<br />
effluent values quite well.<br />
V e r i f i c a t i o n o f S t e a d y S t a t e<br />
D i s i g n b y D y n a m i c S i m u l a t i o n<br />
The purpose was to verify the results of conventional<br />
steady-state design of the WWTP biological stage (Derco et<br />
al, 2004) for future upgrading with regard to expected load in<br />
2036. The data for this scenario were obtained from the operator<br />
of the WWTP – Západoslovenská vodárenská spoločnosť,<br />
a.s. Resulting values (7 mg dm –3 ammonium nitrogen<br />
and 9.3 mg dm –3 total nitrogen) of dynamic simulations are<br />
lower than today’s effluent standards (10 mg dm –3 ammonium<br />
nitrogen and 15 mg dm –3 total nitrogen). It can be summarised<br />
that the steady state design for the WWTP upgrading<br />
Fig. <strong>2.</strong> Effluent concentrations of ammonium nitrogen at<br />
wwTP after reconstruction ( * experimental and – calculated values)
Chem. Listy, 102, s265–s1311 (2008) Environmental Chemistry & Technology<br />
with perspective for 2036 follows also the dynamic effluent<br />
standard values. It can be expected that upgraded WWTP will<br />
meet current legislation also with regard to dynamics of the<br />
processes.<br />
The first task was to investigate what could happen if the<br />
reconstruction in 2003 had not been carried out. The effluent<br />
concentration values are shown in Table I. The load in 2007<br />
and consequently the effluent concentration values are lower<br />
than in 2002 due to industrial activities reduction. This result<br />
could lead to the conclusion that there had been no need for<br />
the reconstruction of the WWTP in 2003. However, because<br />
of the more stringent requirements (Regulation of the Slovak<br />
government, 2005) which permits 10.0 mg dm –3 for ammonium<br />
nitrogen for effluent of WWTP with corresponding load,<br />
it was necessary to carry out the reconstruction. Therefore, it<br />
should be stressed that the WWTP without this reconstruction<br />
would not be able to meet current effluent standards.<br />
The second task was to study what would happen if the<br />
pollution load of actual biological stage of the WWTP increased<br />
to values expected in 2036. The results of dynamic simulations<br />
show that even if the load will increase, the WWTP<br />
will be able to meet current effluent requirements.<br />
Table I<br />
Results of simulations<br />
WWTP 2002 1 st task WWTP 2007 2 nd task<br />
plant layout 2002 2007<br />
load situation 2002 2007 2007 2036<br />
n-nH 4<br />
[mg dm –3 ]<br />
n-nO 3<br />
[mg dm –3 ]<br />
25.06 20.89 0.81 4.05<br />
0 0 7.47 3.91<br />
Conclusions<br />
Two time-variable influent and effluent data sets of wastewater<br />
flow and composition were measured for different<br />
technological arrangements of the WWTP and were applied<br />
for dynamic simulations.<br />
It can be concluded from the work that the mathematical<br />
model ASM1 is suitable for the description of the process<br />
s354<br />
dynamics of the WWTP biological stage. Good fit between<br />
experimental and calculated effluent concentration values<br />
resulted from performed dynamic simulations.<br />
The results of dynamic simulation confirmed the necessity<br />
of the WWTP reconstruction carried out in 2003 in order<br />
to comply with actual legislation requirements.<br />
Compliance with actual effluent limits follows for previous<br />
steady state design and upgrading of the WWTP when<br />
investigating dynamics of the process.<br />
According to results of dynamic simulations it can be<br />
expected that the existing WWTP will comply with actual<br />
discharge standards also for pollution load as expected in<br />
2036.<br />
This work has been supported by the Slovak Grant<br />
Agency for chemical and chemical-technological science<br />
(Grant No. 1/0866/08). The authors would also like to<br />
thank Ľubomír Krcho and Monika Polláková for the help by<br />
acquirement influent, effluent and operational data from the<br />
WWTP.<br />
REFEREnCES<br />
1. Chem. Pap. 56, 117 (2002).<br />
<strong>2.</strong> Derco J., Kovács A., Gulyásová A., Dercová K., Horňák<br />
M.: Reserch report No. 4272, Bratislava, Slovakia,<br />
2002<br />
3. Derco J., Drtil M., Bodík I., Hutňan M.: Technológia<br />
vody a ochrana vodných zdrojov I. Časť. ÚVTIP nitra,<br />
Bratislava 2004.<br />
4. Derco J., Schütze M.: Odpadové vody 2004. Október<br />
20–22, Tatranské Zruby 2004, p. 111<br />
5. Henze M., Grady Jr. C. P. L., Gujer W., Marais G. R.,<br />
Matsuo T.: Activated Sludge Model No. 1, Scientific and<br />
Technical Report no. 1., IAWPRC, London 1987.<br />
6. ifak. SIMBA 5 – Manual. Institut für Automation und<br />
Kommunikation e. V., Magdeburg 2005.<br />
7. Regulation of the Government of the Slovak Republic<br />
n° 296/2005 on Quality Objectives of Surface Waters<br />
and on Limit Values for Pollution Indicators of Waste<br />
Waters and Special Waters.
Chem. Listy, 102, s265–s1311 (2008) Environmental Chemistry & Technology<br />
P11 APPLICATION OF A 6-MERCAPTOPuRINE<br />
FuNCTIONALIZED SORbENT FOR<br />
DIFFuSIVE GRADIENTS IN ThIN FILMS<br />
TEChNIQuE<br />
PAVeL DIVIŠ, ROMAn SZKAnDERA and PETER<br />
MATÚŠ<br />
Brno University of Technology, Faculty of Chemistry, ICTEP<br />
Purkyňova 118, BRNO, 612 00 Czech Republic,<br />
divis@fch.vutbr.cz<br />
Introduction<br />
The diffusive gradients in thin films technique (DGT) 1<br />
is used more than 10 years for determination of kinetically<br />
labile metal species in natural waters, soils and sediments 2 .<br />
However this technique is at the present time validated for<br />
measurement of more than 50 metals, only few attention was<br />
applied to measurement of mercury.<br />
As we reported in our previous studies 3,4 , combination<br />
of agarose diffusive gel together with the sorption gel containing<br />
resin with thiol functional groups is the best choice for<br />
measuring of mercury by DGT. nevertheless, at the present<br />
time there is almost no resin of this type for direct use in<br />
DGT on the market. For DGT, strictly defined size of resin<br />
about 100 μm is used. As the resins available on the market<br />
have particle size about 1 mm, there is need to crush their<br />
particles and separate the required fraction by sieving. This<br />
activity can seriously contaminate the resin or it can change<br />
its properties.<br />
In presented study we try to prepare needful resin by our<br />
self in laboratory. The Iontosorb AV resin (Iontosorb, Czech<br />
Republic) with particle size 50–100 μm was used in advance.<br />
This resin contains free amino group which can be easily diazotated<br />
(Fig. 1.). Resulted diazonium salt can be subsequently<br />
used for raction with specific reagent containing thiol groups.<br />
In this work we used 6-mercaptopurine as this reagent. new<br />
modified Iontosorb AV was characterised in laboratory and<br />
then it was used to prepare sorption gels for DGT technique.<br />
The performance of DGT with modified Iontosorb AV was<br />
then tested in model mercury solution.<br />
Fig. 1. Chemical formula of Iontosorb AV<br />
Experimental<br />
M o d i f i c a t i o n o f I o n t o s o r b A V<br />
R e s i n<br />
Iontosorb AV was modified using diazotation and copulation<br />
reactions 5,6 . The amount of 5 g Iontosorb AV was<br />
washed with hydrochloric acid and then with ultrapure water<br />
to neutral pH. After washing, diazotation was performed at<br />
0–5 °C using 1M solutions of hydrochloric acid and sodium<br />
nitrite. Diazotation was stopped after adding of 40 ml of rea-<br />
s355<br />
gents. Yellow product was filtered out and washed several<br />
time with ultrapure water. Diazonium salt was then placed to<br />
the continuously mixed and cooled reactor containing 3.5 g of<br />
6-mercaptopurine dissolved in 10% (v/w) sodium carbonate.<br />
After 24 h new red-brown product was filtered out, washed<br />
several time with ultrapure water and dryed in exicator.<br />
A n a l y t i c a l C o n t r o l o f n e w<br />
F u n c t i o n a l i s e d R e s i n<br />
Qualitative test was done using an infrared spectroscopy<br />
(Impact 400, nicolet, USA). Infrared spectrum of new functionalized<br />
resin was compared with blank infrared spectrum<br />
of Iontosorb AV.<br />
Fig. <strong>2.</strong> Infrared spectrum of Iontosorb AV (1) and new functionalized<br />
resin (2)<br />
Quantitative test of thiol groups was done by iodometric<br />
titration at pH ~ 9. To 50 mg of modified Iontosorb AV, 25 ml<br />
of 0.001M potassium iodine was added, and after 5 min of<br />
shaking and 30 min of standing in the dark, resulted solution<br />
was titrated by 0.001M ammonium thiosulphate.<br />
T e s t i n g o f n e w F u n c t i o n a l i s e d<br />
R e s i n f o r U s e i n D G T T e c h n i q u e<br />
Sorption gels for DGT technique were prepared by<br />
incorporation of modified Iontosorb AV into the agarose gel.<br />
The amount of 0.2 g of modified Iontosorb AV was added to<br />
a hot agarose solution (4% (v/w)) and the hot solution was<br />
casted between two glass plates separated by 0.4 mm plastic<br />
spacers. The disks 2 cm in diameter were cuted out from the<br />
gels after cooling down and washig of the gel sheets.<br />
Diffusive gels were prepared by similar way, the only<br />
one difference was that clear hot agarose solution (3% (v/w))<br />
and 0.8 mm plastic spacers were used.<br />
The agarose sorption and diffusive gels were used to<br />
assembly the DGT unit. Four DGT units were exposed in<br />
a 5 dm 3 beaker containing well mixed 10 μg dm –3 mercury<br />
solution for 3 h to perform basic DGT test. Simultaneously<br />
to the exposition of DGT units, mercury concentration in the<br />
solution was measured by atomic absorption spectrometry<br />
(AMA 254, Altec, CZ).
Chem. Listy, 102, s265–s1311 (2008) Environmental Chemistry & Technology<br />
Results<br />
Sucessful incorporation of 6-mercaptopurine to Iontosorb<br />
AV was proved by chage in resin colour from white to<br />
red-brown. Infrared spectroscopy has shown a new peak in<br />
Iontosorb AV spectra with wave nuber 2,362 cm –1 (Fig. <strong>2.</strong>).<br />
This is a characteristic peak for thiol groups. The amount<br />
of thiol groups was determined by iodometric titration to be<br />
0.5 mmol g –1 . This should be enough to prevent the saturation<br />
of functional groups when DGT sampling units are deployed<br />
in natural waters. new resin was successfully incorporated<br />
into the agarose gel. The agarose gel as a support for resin<br />
was chosed because of problems associated with commonly<br />
used polyacrylamide gel. In polyacrylamide gel, the new<br />
resin aggregated and it was difficult to prepare homogenous<br />
gel. In agarose gel there was no problem with aggregation of<br />
resin particles. After optimalization of sorption gel preparation<br />
procedure, basic DGT test was performed. Results from<br />
this experiment are shown in Table I. It can be seen that the<br />
difference between real mercury concentration measured by<br />
AAS and mercury concentration calculated from accumulated<br />
mass of mercury in resin gels extracted from DGT sampling<br />
units is less than 10 %. This result matches the requirements<br />
of DGT Research Ltd. for right function of DGT.<br />
Conclusions<br />
This study proved that the 6-mercaptopurine functionalised<br />
Iontosorb AV is useable for measuring of mercury in<br />
natural waters by DGT and it provided useful informations<br />
for further experiments in which better characterization of<br />
new sorbent will be carried out and more extensive investigation<br />
of its use in DGT will be done. For example, experiments<br />
s356<br />
Table I<br />
Results from basic DGT performance test<br />
DGT concentration Real concentration Difference<br />
[μg dm –3 ] [μg dm –3 ] [%]<br />
7.5 8.0 ± 0.4 6<br />
8.2 8.0 ± 0.4 3<br />
8.7 8.0 ± 0.4 8<br />
8.2 8.0 ± 0.4 3<br />
in solutions containing natural ligands and experiments in<br />
real sytems will be realized during the next years and a comparison<br />
with other sorbents usable in DGT will be done.<br />
Acknowledgement: This work has been supported by<br />
grants no. MEB 080813 and SK-CZ-0044-07. Mr. Oldřich<br />
Tokar is acknowledged for providing free Iontosorb AV sample.<br />
REFEREnCES<br />
1. Zhang H., Davison W.: Anal. Chem. 67, 3391 (1995).<br />
<strong>2.</strong> Diviš P., Dočekalová H., Smetková V. : Chem. Listy. 99,<br />
640 (2005).<br />
3. Dočekalová H., Diviš P.: Talanta 65, 1174 (2005).<br />
4. Diviš P., Leermarkers M., Dočekalová H., Gao Y.: Anal.<br />
Bioanal Chem. 382, 1715 (2005).<br />
5. Davies R. V., Kennedy J., Lane E. S., Willans J. L.: J.<br />
Appl. Chem. 8, 68 (1958).<br />
6. Mondal B. C., Das D., Das A. K.: Anal. Chim. Acta 450,<br />
223 (2001).
Chem. Listy, 102, s265–s1311 (2008) Environmental Chemistry & Technology<br />
P12 ThE DETERMINATION OF<br />
METhyLMERCuRy IN wATER ECOSySTEMS<br />
LEnKA TUHOVČáKOVá, HELEnA DOLEŽALOVá<br />
WEISSMAnnOVá, JOSEF ČáSLAVSKý and MILADA<br />
VáVROVá<br />
Brno University of Technology, Faculty of Chemistry, Purkyňova<br />
118, Brno, Czech Republic,<br />
dolezalova@fch.vutbr.cz<br />
Introduction<br />
Alkyl mercury compounds belong to a group of organometallic<br />
compounds with a high bioaccumulation potential.<br />
They are formed from inorganic forms in a methylation<br />
process and exhibit 100 times higher toxicity than inorganic<br />
forms 1 . Methyl mercury is a neurotoxin which attacks the<br />
central nervous system (CnS). The most frequent pathway<br />
by which methyl mercury enters the body is through the gastrointestinal<br />
tract which may absorb up to 95 % of methyl<br />
mercury received by a man via fish meat. It may also penetrate<br />
through the skin. It is well soluble in fat which explains<br />
its transport through blood-brain barrier and diffusion into<br />
cell membranes. It also passes the foetal placenta; the risk<br />
of damage to the foetus occurs at a mercury concentration in<br />
hair as low as 15–20 mg kg –1 . The tolerated dose of mercury<br />
in man is 33 μg per 70 kg of body weight 2,3,4 . Methyl mercury<br />
was responsible for a large number of intoxications in the past.<br />
For example, fish living in water polluted with waste from a<br />
chemical company producing chlorine caused intoxication by<br />
methyl mercury in Japan while mercury intoxications in Iraq<br />
were caused by the grain treated with methyl-mercury-containing<br />
fungicides that was originally intended as seed 5 . Methyl<br />
mercury is the most common organic form occurring in biological<br />
systems. It is soluble in water and is relatively stable.<br />
It passes biological membranes easily and has a long halftime<br />
of decomposition up to 70 days 4 . Methyl mercury has<br />
the highest partition coefficient K ow , which explains its high<br />
affinity towards fat. Methylation is one of the mercury’s most<br />
important environmental reactions. Methylation takes place<br />
in the sediment as well as in sea water and fresh water. The<br />
fastest rate of methylation was observed on the sediment’s<br />
surface that was in contact with water 6,7 .<br />
Experimental<br />
The optimization of the method was carried out using<br />
the Certified Reference Material CRM 464; tuna fish containing<br />
a total amount of THg = 5.24 μg g –1 and methyl mercury<br />
MeHg = 5.5 μg g –1 . The sample weighed 0.1 g. A total<br />
of 5 samples were extracted and each sample was subjected<br />
to three parallel measurements. Extraction was performed<br />
according to the published method 8 . Gas chromatography<br />
was used as the final analytical method. The results of parallel<br />
measurements were evaluated as mean values and their standard<br />
deviation was calculated.<br />
s357<br />
Table I<br />
The conditions of the GC/μECD analysis<br />
Parametrers of GC/μECD<br />
Column DB-608, 30 m × 0.530 mm × 0.5 μm<br />
Injection splitless<br />
Injector temperature 250 °C<br />
Carrier gas He,3 ml min –1 , constant flow<br />
Detector temperature 250 °C<br />
Make-up gas n2, 20 ml min –1<br />
Results<br />
The Certified Reference Material was used particularly<br />
for the determination of metrological parameters of the<br />
method. The mean recovery of extraction was found to be<br />
64.9 ± <strong>2.</strong>0 %. The lower recovery rate as compared to the<br />
literature(ref. 8 ) could be caused by the certified reference<br />
material used which just passed the expiry date. As a result,<br />
the content of methyl mercury might differ from that provided<br />
in the certificate. Fig. 1. shows the chromatogram of<br />
the analysis of MeHg isolated from the certified reference<br />
material.<br />
Fig. 1. Chromatogram for the certified reference material<br />
Table II contains the results of recovery from individual<br />
parallel measurements of methyl mercury levels in the CRM<br />
(Marked as 1–5).<br />
To determine the accuracy of methyl mercury determination<br />
using GC/μECD, 5 parallel measurements of the<br />
certified reference material were carried out. The results are<br />
provided in Table III.<br />
Table II<br />
Recoveries for 5 parallel samples of certified reference materials.<br />
Declared value of MeHg – 5,500 [ng g –1 ]<br />
CRM Mean c MeHg Recovery<br />
peak area [ng ml –1 ] [ng g –1 ] exper. [%]<br />
1 6,163.81 40.05 3,559.60 64.72 ± 0.51<br />
2 7,030.21 45.67 3,653.96 66.44 ± 3.80<br />
3 6,938.18 45.08 3,606.12 65.57 ± 1.71<br />
4 6,884.60 44.73 3,578.27 65.06 ± 0.61<br />
5 6,625.99 43.05 3,443.86 6<strong>2.</strong>62 ± 3.59
Chem. Listy, 102, s265–s1311 (2008) Environmental Chemistry & Technology<br />
Table III<br />
The accuracy of methyl mercury determination using<br />
GC/μECD<br />
Mean level [ng g –1 ] RSD [%]<br />
MeHg 3,568.36 1.79<br />
Conclusions<br />
The method of determining the level of methyl mercury<br />
in fish muscles using GC/μECD was modified. The optimization<br />
of the method was performed using the Certified Reference<br />
Material. On the basis of recovery and accuracy, it was<br />
concluded that the test procedure without sample pre-treatment<br />
can be applied with this method of analysis.<br />
This work has been supported by by the grant No.<br />
6215712402 given by MSMT.<br />
s358<br />
REFEREnCES<br />
1. Remy S., Prudent P., Probst J. L.: Appl. Geochem. 21,<br />
1855 (2006).<br />
<strong>2.</strong> Faro L. R .F., et al.: neuropharmacology 42, 612<br />
(2002).<br />
3. Goméz-Ariza J. L., Lorenzo F., Garcia–Barrera T.: Chemosphere<br />
61, 1401 (2005).<br />
4. Faro L. R. F., et al.: Ecotox. Environ. Safe. 55, 173<br />
(2003).<br />
5. Maršálek P., Svobodová Z.: Czech J. Food Sci. 24, 138<br />
(2006).<br />
6. Carro A. M., Mejuto M. C.: J. Chromatogr. A 882, 283<br />
(2000).<br />
7. Mishra S., et al.: Anal. Chim. Acta 551, 192 (2005).<br />
8. Castillo A., Roig-navarro A. F., Pozo O. J.: Anal. Chim.<br />
Acta 577, 18 (2006).
Chem. Listy, 102, s265–s1311 (2008) Environmental Chemistry & Technology<br />
P13 ECOTOxICOLOGICAL TESTING AND TEST<br />
METhODS OF ChEMICALS<br />
HELEnA DOLEŽALOVá WEISSMAnnOVá, HELEnA<br />
ZLáMALOVá GARGOŠOVá and MILADA VáVROVá<br />
Brno University of Technology, Faculty of Chemistry, Purkyňova<br />
118, Brno, Czech Republic<br />
dolezalova@fch.vutbr.cz<br />
Introduction<br />
Ecotoxicity involves the identification of chemical<br />
hazards to the environment. The Globally Harmonized System<br />
of Classification and Labeling of Chemicals (GHS)<br />
describes testing for hazards to the aquatic environment in<br />
Part 3, Chapter 3.10 (UnECE, 2004a). Annex 8, Guidance<br />
on Hazards to the Aquatic Environment (UnECE, 2004).<br />
Ecotoxicity tests can be classified into two following categories:<br />
standard and alternative tests.<br />
The ecological testing according to US EPA and<br />
UnECE includes many tests; however, several methods of<br />
ecotoxicological testing are used in the Czech Republic. For<br />
the typical standard and alternative aquatic ecotoxicological<br />
tests crustacea (Daphnia magna, Thamnocephalus platyurus,<br />
and Artemia salina), aquatic plant (Lemna minor), algae<br />
(Desmodesmus subspicatus, Scenedesmus subcapitatus, Selenastrum<br />
capricornutum) are used. In accordance with OECD,<br />
UnECE and Czech legislation the standard tests include<br />
these organisms in following tests – Daphnia magna (OECD<br />
Test no. 202: Daphnia sp. Acute Immobilizations Test, En<br />
ISO 6341:1996), Desmodesmus subspicatus (OECD – Test<br />
no. 201: Alga, Growth Inhibition Test, ISO 8692:2004). The<br />
aquatic organism Lemna minor (OECD Test no. 221: Lemna<br />
sp. Growth Inhibition Test, ISO 20079:2005) is application<br />
in OECD and ISO standard methods for the testing of chemicals.<br />
Experimental<br />
The general principle of ecotoxicological tests is the<br />
determination of effective concentration (EC50), eventually<br />
lethal concentration (LC50) or inhibition concentration<br />
(IC50). The limit test corresponds to one dose level of<br />
100 g dm –3 . A stepwise procedure involves four steps: the<br />
limit test, confirmatory test, basic test and definitive test.<br />
These types of studies produce end points such as LC50,<br />
EC50 and nOEC. EC50, LC50 and IC50 are the effective<br />
concentrations (i.e., the concentration of material in water<br />
that is estimated to produce a specifically quantified effect<br />
to 50 % of the test organisms). The EC50 and its 95 % confidence<br />
interval are usually derived by statistical analysis of<br />
a quantal, “all or nothing”, response (such as death, fertilisation,<br />
germination, or development) in several test concentrations,<br />
after a fixed period of exposure. End point means the<br />
variables (i.e., time, reaction of the organisms) that indicate<br />
the termination of a test, and also means the measurement(s)<br />
or value(s) derived, that characterise the results of the test<br />
(EC50). LOEC (lowest observed effect concentration) is the<br />
s359<br />
lowest concentration tested causing a statistically measurable<br />
effect to the test system. nOEC (no observed effect concentration)<br />
is the highest concentration tested causing no statistically<br />
measurable effect to the test system. The parameters<br />
LOEC and nOEC may be statistically determined.<br />
The aim of statistical analysis of ecotoxicological data is<br />
to obtain a quantitative concentration-response relationship<br />
by regression analysis. For this purpose many models could<br />
be used such as: linear interpolation, polynomial regression,<br />
log–logistic regression, probit model, Weibull model, Dunnett<br />
test, William test, Jokheere-Terpstra test.<br />
E c o t o x i c o l o g i c a l T e s t s f o r<br />
D e t e r m i n a t i o n o f E c o t o x i c i t y o f<br />
S t a n d a r d K 2 C r O 4<br />
The standard chemical K 2 CrO 4 was used for the determination<br />
of ecotoxicity, for th estimation of sensitivity of<br />
testing organisms Dapnia magna Strauss, (Daphtoxkit F<br />
magna – standard test) Thamnocephalus platyurus (Thamnotoxkit<br />
F – alternative test) and Lemna minor (standard<br />
test OECD) and for validation and comparison of obtained<br />
results with the declared values. Table I performs the basic<br />
parameters of tests in coordinance with the directive.<br />
Table I<br />
The parameters of tests<br />
Parameters Daphtoxkit Thamnotoxkit Lemna<br />
F F minor<br />
c [mg dm −3 ] 0.32–3.20 0.032–0.320 10–160<br />
T [°C] 22 ± 2 20 ± 2 24 ± 2<br />
I [lx] 6,000 4,000 –<br />
Results<br />
On the base of analysis of obtained ecotoxicological<br />
results for studied tests the values of EC50, LC50 and IC50<br />
were determined for standard chemical K 2 CrO 4 . The experimental<br />
data with the basic statistic characteristics are summarized<br />
in Table II. The EU-Directive 93/67/EEC classifies<br />
substances according to their ecotoxicological value (EC50).<br />
On the base of obtained data from ecotoxicological tests<br />
(crustacea tests Daphtoxkit F and Thamnotoxkit F) the<br />
study chemical belongs to very toxic for aquatic organisms.<br />
The studied chemical K 2 CrO 4 is also toxic to aquatic organisms<br />
for macrophyta Lemna minor.<br />
The Thamnocephalus platyurus was found<br />
as the test organism of highest sensitivity with<br />
LC50 = 0.092 ± 0.002 mg dm –3 . The effective concentration<br />
(EC50/24 h) from Daphtoxkit F for exposure 24<br />
hours was 0.99 ± 0.022 mg dm –3 and the effective concentration<br />
(EC50/48 h) was confirmed 0.79 ± 0.031 mg dm –3<br />
The inhibition concentration for Lemna minor (IC50/168 h)<br />
was calculated from average specific growth rate and confirmed<br />
via percent reduction in yield, IC50/168 h was equal<br />
to 20.52 ± 0.399 mg dm –3 . For validation and confirmation of<br />
experimental data the probit model was used for determina-
Chem. Listy, 102, s265–s1311 (2008) Environmental Chemistry & Technology<br />
tion of ecotoxicological parameters. Calculated values from<br />
probit model and experimental values were in very good correlation<br />
with declared value of tests.<br />
Table II<br />
The ecotoxicity of K 2 CrO 4 (n = 9; concentration in mg dm –3 )<br />
Daphtoxkit F Thamnotoxkit Lemma<br />
EC50/ EC50/ F minor<br />
24 h 48 h LC50/24 h IC50/168 h<br />
Declared<br />
values<br />
1.03 0.75 0.10 –<br />
Experim.<br />
value<br />
0.99 0.79 0.092 20.52<br />
Probit<br />
model<br />
0.96 0.69 0.093 –<br />
Median 0.99 0.75 0.093 20.00<br />
s 0.0286 0.0411 0.0035 0.5200<br />
Conclusions<br />
The ecotoxicity of the tested chemical was confirmed by<br />
the application of ecotoxicological tests. In the majority of<br />
cases, on the base of the obtained results of the study tests with<br />
chemical, the tests perform very suitable way for the study of<br />
ecotoxicity and can be used for evaluation of ecotoxicity of<br />
other chemicals and wastes. This study confirmed declared<br />
value and all data were statistical evaluated in detail, and the<br />
sensitivity of testing organism was also confirmed.<br />
This work has been supported by Project No. MSM<br />
002163050 form the Ministry of Education, Youth and Sports<br />
of the Czech Republic, and from the COST ACTION 636 Project<br />
No. OC 183.<br />
s360<br />
REFEREnCES<br />
1. UnECE:Globally Harmonized System of Classification<br />
and Labeling of Chemicals. ST/SG/AC.10/C.3/40/<br />
Add.221 December 2001.<br />
<strong>2.</strong> van Straalen n. M.: Environ. Toxicol. Pharmacol. 11,<br />
167 (2002).<br />
3. Isnard P., Flammarion P., Roman G. et all: Chemosphere<br />
45, 659 (2001).<br />
4. OECD Environmental health and Safety Publications:<br />
Series on testing and Assesssmnet no.10, EnV/MC/<br />
CHEM (98)18.<br />
5. OECD Environmental health and Safety Publications:<br />
OECD Guidelines for Testing Chemicals no 201 (2006,<br />
2004, 1992)<br />
6. ISO 8692:2004: Water quality – Freshwater algal<br />
growth inhibition test with unicellular green algae<br />
7. ISO 6341:1996: Water quality – Determination of the<br />
inhibition of the mobility of Daphnia magna Straus<br />
(Cladocera, Crustacea) – Acute toxicity test<br />
8. ISO 20079:2005: Water quality – Determination of the<br />
toxic effect of water constituents and waste water on<br />
duckweed (Lemna minor) – Duckweed growth inhibition<br />
test<br />
9. Commission of the European Communities, 1996. Technical<br />
guidance document in support of commission<br />
directive 93/67/EEC on risk assessment for new notified<br />
substances and commission regulation (EC) No 1488/94<br />
on risk assessment for existing substances. Part II;<br />
Environmental Risk Assessment. Office for official publications<br />
of the European Communities, Luxembourg.
Chem. Listy, 102, s265–s1311 (2008) Environmental Chemistry & Technology<br />
P14 INDOOR AEROSOL ExAMINING<br />
ADRIAnA EŠTOKOVá, nADEŽDA ŠTEVULOVá and<br />
LEnKA KUBInCOVá<br />
Technical University of Košice, Civil Engineering Faculty,<br />
Institute of Building and Environmental Engineering, Vysokoškolská<br />
4, 042 00 Košice, Slovak Republic,<br />
Adriana.Estokova@tuke.sk<br />
Introduction<br />
Aerosol particles are generally considered to be one of<br />
the principal indoor risk factors. Operation, number and behavior<br />
of occupancy i.e. type, emission intensity and amount of<br />
indoor contamination sources (building materials, combustion<br />
processes, smoking, cleaning) 1,2 determine temporal and<br />
spatial variations of indoor aerosol distribution. The particulate<br />
matter (PM) cause the negative health effect, when they<br />
are inhaled and deposited in the respiratory tract 3 .<br />
This paper is primarily concerned with suspended PM 10<br />
concentrations and indoor settled PM monitoring with regard<br />
to the chemical composition and shape of PM 10 particles.<br />
Experimental<br />
M e t h o d s<br />
Suspended particulate matter investigation was focused<br />
on thoracic fraction PM 10 monitoring in various types<br />
of residential and non-residential buildings. Measurement<br />
includes integral particles sampling onto a collection material<br />
(membrane filter Synpor 0,8 µm pore size, 35 mm in diameter)<br />
by sampling equipment VPS 2000 (Envitech, Trenčín) at<br />
air flow of 960 dm 3 h –1 during sampling period of approximately<br />
24 hours. The sampling was carried out in the middle<br />
of the room at the height of 1,500 mm from the floor. The<br />
windows and the door were closed during the monitoring<br />
period. The particulate mass concentrations were determined<br />
by gravimetric method from the increase of filter weight.<br />
Because of minimisation of humidity interference, the filters<br />
were dried at 105 °C for 8 h before and after sampling and<br />
than were equilibrated at a constant temperature and humidity<br />
(e.g. 20 °C and 50 % RH) for 24 h before and after sampling.<br />
The monitoring of indoor settled PM was performed<br />
in selected flat building. Sampling was carried out by passive<br />
methods based on PM settling into Petri dishes during<br />
28 days. The particle surface concentrations were determined<br />
by gravimetric method.<br />
The PM 10 samples were characterized by scanning<br />
electron microscopy/energy-dispersive X-ray analysis (SEM/<br />
EDX) and atomic absorption spectroscopy (AAS) as the main<br />
techniques. Particle morphology was determined by SEM on<br />
the equipment Tesla BS 340. The elemental EDX analysis<br />
were carried out on the micro-analytical system LInK ISIS<br />
300 (Oxford Instruments) operating in secondary mode at a<br />
potential 25 kV and at extension 600–30,000. The chemical<br />
analysis of the selected metals samples content was realised<br />
by SpectrAA-30 (Varian).<br />
s361<br />
Results<br />
The results of indoor PM 10 monitoring in different types<br />
of residential and non-residential buildings are illustrated as<br />
average mass concentrations in the Fig. 1.<br />
Fig. 1. The average mass concentrations of PM10 in residential<br />
(A) and non-residential (b) buildings: A1 – single family residences,<br />
A2 – flat-residences, B1 – school buildings; B2 – offices;<br />
b3 – commercial buildings; b4 – buildings for culture and ntertainment,<br />
b5 – hospitals and sanitary facilities<br />
The highest mass PM 10 concentration was observed in<br />
non-residential public buildings. The PM 10 hygienic limit for<br />
indoor air in Slovak republic – 50 µg m –3 was exceeded in all<br />
monitored types of residential and non-residential buildings<br />
excepting B2 (offices) and B5 (hospitals). The concentrations<br />
of settled PM were measured at various heights and were ranged<br />
from 21.0 μg cm –2 to 86.6 µg cm –2 . The trend of gradual<br />
decreasing of particulate matter occurrence with the raise of<br />
height was observed (Fig. <strong>2.</strong>).<br />
Fig. <strong>2.</strong> Average mass surface concentration of settled PM in dependence<br />
on the height<br />
The mass concentrations of metals in PM 10 samples<br />
investigated by AAS are summarised in Table I.<br />
The obtained mass concentrations of metals in indoor<br />
particle samples correspond with those of in typical urban<br />
aerosol 5 . The individual particles in irregular shape of the<br />
various particle size as well as particles aggregates were<br />
observed on the SEM micrographs (Fig. 3.).
Chem. Listy, 102, s265–s1311 (2008) Environmental Chemistry & Technology<br />
Table I<br />
The mass concentrations of metals<br />
element Average Minimum Maximum<br />
[μg m –3 ] [μg m –3 ] [μg m –3 ]<br />
Cu 0.704 0.03 3.38<br />
Pb 0.094 0.007 0.666<br />
Cd 0.094 0.002 0.625<br />
ni 0.050 0.007 0.29<br />
Cr 0.058 0.007 0.35<br />
Zn 0.408 0.08 <strong>2.</strong>01<br />
As 0.007 0.0001 0.019<br />
Fe 1.818 0.36 9.23<br />
Sb 0.115 0.0001 1.47<br />
Fig. 3. SEM micrograph of particles<br />
The majority of PM 10 particles are non-spherical in<br />
shape with strong division of the surface. The occurrence of<br />
the spherical particles as well as of fibrous particles was not<br />
obvious 4 .<br />
The energy-dispersive X-ray system interfaced to the<br />
SEM provides preliminary information on the elemental<br />
composition of the samples. Fig. 4. represents EDX spectrum<br />
of the selected solid aerosol sample. The principal inorga-<br />
s362<br />
Fig. 4. EDx spectrum of suspended PM 10<br />
nic elements constituting the particles in order of decreasing<br />
peak intensity were Ca ≈ Si > O > Al > C > Mg > Fe > Cl ><br />
na ≈ K.<br />
Conclusions<br />
High indoor PM 10 concentrations exceeding the hygienic<br />
limit (excepting offices and hospitals and sanitary facilities)<br />
were found out in this study. The trend of gradual decreasing<br />
of settled particulate matter concentration with height rising<br />
was observed. The determined metal mass concentrations in<br />
PM 10 correspond with the typical metal concentration range<br />
of the urban aerosol. SEM investigation refers the presence<br />
of majority particles non-spherical in shape, in primary as<br />
well as secondary form (aggregates).<br />
This work has been supported by Grant Agency of Slovak<br />
Republic (project No. 1/3342/06).<br />
REFEREnCES<br />
1. Eštoková, A. et al.: Proceding of the 4th International<br />
Conference: Praticulate matter, p. 124. Slovakia,<br />
Košice: TU, 2003.<br />
<strong>2.</strong> Owen, M. et al: J. Atmos. Environ 26, 2149 (1992)<br />
3. Gwynn, R.CH. et al: J.Environmental Health perspectives<br />
108, 125 (2000).<br />
4. Eštoková, A., Števulová, n.: J. Chemické listy 96, 8<br />
(2002).<br />
5. Hovorka J.:Aktuálni otázky znečistení ovzduší. UK,<br />
Praha 2004.
Chem. Listy, 102, s265–s1311 (2008) Environmental Chemistry & Technology<br />
P15 ATMOSPhERICAL DEPOSITION AND<br />
IMMISSION SITuATION IN THE NIŽNÁ<br />
SLANÁ AREA<br />
ERIKA FEDOROVá, JOZEF HAnČUľáK, OľGA<br />
ŠESTInOVá, Ján BREHUV and TOMISLAV ŠPALDOn<br />
Institute of Geotechnice of the Slovak Academy of Sciences,<br />
Watsonova 45, 043 53 Košice,<br />
fedorova@saske.sk<br />
Introduction<br />
Owing the positive results of geological survey, the<br />
nižná Slaná region has become during last 35 years the most<br />
important basis of Fe-ore. Potential of industrial siderite is<br />
63 mil. t 1,2 .<br />
The biggest of the polution sources is the chimney which<br />
is 120 m high. The dust fallout was monitored by means of<br />
17 sampling points located maximally up to 8 km from main<br />
source of pollution. The pollutants have municipal as well as<br />
industrial origin 5 . The range of plant emission by chemical<br />
data processing and by their comparision with dust deposition<br />
was investigated. In the present time the communal and<br />
the natural sphere causes the air pollution 3,7 .<br />
Experimental<br />
Samples of the dust deposition were taken in monthly<br />
intervals from seventeen sampling places in the intervals of<br />
30 ± 3 days. To take the samples of the dust deposition plastic<br />
sedimentation containers having a cylinder shape with the<br />
internal diameter of 1<strong>2.</strong>5 cm were used and located on two<br />
holders in the height of <strong>2.</strong>5 to 3 m 1,4,7 . The containers were<br />
filled with 250 ml of distilled water with additives of substances<br />
preventing creation of algae in the summer period and<br />
antifreeze additives in the winter period. After sampling the<br />
content of the containers was quantitatively transferred to the<br />
evaporating dishes and evaporated. To remove the organic<br />
mass the evaporation residue was annealed at the temperature<br />
of 450 ºC. The temperature was selected not to cause degradation<br />
of present carbonates and so possible distortion of<br />
gravimetry of the dust deposition. The gravimetry was made<br />
separately for each of the containers 6 . The result for each<br />
month and individual sampling places is calculated in units of<br />
g m –2 (30 days) –1 and it is the average of alues from two exposed<br />
containers. The inorganic part from twelve months set by<br />
annealing was cumulated into one sample and after mineralization<br />
analysed for individual monitored elements using the<br />
AAS method and the SpectrAA – 30 VARIAn unit 4,7 .<br />
Results<br />
Localisation of the sampling places of deposition is<br />
shown in Table I.<br />
The results are the values acquired from deposition<br />
samples after drying and annealing. The specific values of<br />
dust fallout are shown on Table II. As it is evident from these<br />
results, the highest values of the dust fallout were recorded<br />
in summer months and the vegetation period and that is<br />
s363<br />
Table I<br />
Localisation and the samples quantity in the year of 2007<br />
number of<br />
The samples<br />
Locality<br />
locality quantity<br />
1 Vlachovo – swimming pool 12<br />
2 Gočovo – playground 11<br />
3 n. Slaná – colony 12<br />
4 Above plant 12<br />
5 Before plant 12<br />
6 n. Slaná – agrarian cooperative 12<br />
7 n. Slaná – playground 12<br />
8 Direction to Kobeliarovo 12<br />
9 Crossroad – Štítnik 11<br />
10 Henckovce – before village 12<br />
11 Henckovce – upper part 12<br />
12 Henckovce – cemetary 12<br />
13 Henckovce – near railway 12<br />
14 Henckovce – lower part 12<br />
15 Between H. a G. Polomou 11<br />
16 Gemerská Poloma 12<br />
17 Betliar 12<br />
reflected in the percentage representation of the annealed<br />
organic part.<br />
According to Table II and Fig. 1. the highest average<br />
values were recorded on sampling places no. 7 and 5 in 2007<br />
being directly influenced by the dust deposition from the spot<br />
source of the plant and localized in the central part of the<br />
valley (4.40 an <strong>2.</strong>77 g m –2 (30 days) –1 accordingly). Just to<br />
compare, the average value from the sampling place no. 8<br />
that is localized relatively close to the plant, but on the west<br />
side of the valley (west side of nižná Slaná in the direction<br />
to Kobeliarovo) achieves only 0.57 g m –2 (30 days) –1 . Some<br />
of the increased values mainly from the summer period need<br />
to be ascribed also to the extremely dry weather in 2007 and<br />
blowing out of the inorganic particles from the uncovered<br />
horizonts of the farmland.<br />
Fig. 1. Specific values of dust deposition in g m –2 (30 days) –1
Chem. Listy, 102, s265–s1311 (2008) Environmental Chemistry & Technology<br />
Table II<br />
Specific values of dust deposition in g m –2 (30 days) –1<br />
no. Locality<br />
After dying After annealing<br />
min. max. aver- . aver-<br />
min. max<br />
age age<br />
1<br />
Vlachovo –<br />
swimming<br />
pool<br />
1.08 4.72 <strong>2.</strong>90 0.73 3.00 1.87<br />
2<br />
Gočovo –<br />
playground<br />
1.07 1<strong>2.</strong>13 6.60 0.70 <strong>2.</strong>82 1.76<br />
3<br />
n. Slaná –<br />
colony<br />
1.28 5.76 3.52 0.72 3.43 <strong>2.</strong>07<br />
4 Above plant 1.32 8.29 4.80 0.98 <strong>2.</strong>71 1.84<br />
5 Before plant<br />
n. Slaná –<br />
<strong>2.</strong>10 5.24 3.67 1.10 4.52 <strong>2.</strong>81<br />
6 agranian<br />
cooperative<br />
<strong>2.</strong>65 8.80 5.72 0.93 4.41 <strong>2.</strong>67<br />
7<br />
n. Slaná –<br />
playground<br />
3.01 13.22 8.12 <strong>2.</strong>29 10.23 6.26<br />
8<br />
Direction<br />
to Kobeliarovo<br />
0.34 3.97 <strong>2.</strong>16 0.18 0.98 0.58<br />
9 Crossroad – 1.69 9.82 5.76 1.38 3.92 <strong>2.</strong>65<br />
Štítnik<br />
10 Henckovce – 0.79 9.11 4.95 0.42 4.08 <strong>2.</strong>25<br />
before village<br />
11 Henckovce – 0.94 8.65 4.79 0.55 3.10 1.83<br />
upper part<br />
12 Henckovce – 0.96 5.08 3.02 0.61 1.49 1.05<br />
cemetary<br />
13<br />
Henckovce –<br />
1.21 8.62<br />
near railway<br />
4.92 0.94 3.12 <strong>2.</strong>03<br />
14<br />
Henckovce –<br />
<strong>2.</strong>07 1<strong>2.</strong>71 7.39 1.68 4.79 3.24<br />
lower part<br />
15<br />
Between H.<br />
1.67 6.07<br />
and G. Polomou<br />
3.87 1.09 3.23 <strong>2.</strong>16<br />
16<br />
Gemerská<br />
Poloma<br />
1.37 7.83 4.60 0.96 5.16 3.06<br />
17 Betliar 0.55 6.37 3.46 0.13 1.42 0.77<br />
Conclusion<br />
Monitoring of the dust deposition in 2007 year has<br />
shown a relative increase of dustiness in the monitored area<br />
influenced by the activity of the Siderit plant. The increased<br />
s364<br />
Fig. <strong>2.</strong> Variation row of statistical classes in g m –2 (30 days) –1 -<br />
inorganic part<br />
impact can be observed in the area of the farm where the<br />
smoke plume touches the terrain immediately. 4 Specific sources<br />
of gaseous and solid substances exhaled to the move with<br />
air flows in the heights of 100 – 250 m. The research in this<br />
area will enable to highlight the positive activity of the plant<br />
management in relation to the public in the interest of improvement<br />
of environment quality in the given area.<br />
This work has been supported by the Slovak Research<br />
and Development Agency, No 20-027705 and by the Slovak<br />
Grant Agency for Science VEGA (grant No- 2/0131/08).<br />
REFEREnCES<br />
1. Kyntera F., nevyjel E., Leško O.: The pollutants measurements<br />
in the Nižná Slaná area, Košice 1984.<br />
<strong>2.</strong> Grecula P. et al: Mineralia Slovaca, 829, 1 (1995).<br />
3. Mihók J.: Mining – processing establishment. SIDERIT<br />
nižná Slaná, p. 125, (1997).<br />
4. Fedorová E.: Dissertation. Slovac Academy of Sciences<br />
at Košice, Košice, Slovakia, 2003.<br />
5. Baluchová B., Fejdi P., Bobro M.: Mineralia Slovaca 36,<br />
357 (2004).<br />
6. Ursíniová M., Vaňová R., Paľušová O.: Acta Hygienica<br />
et Epidemiologica et Microbiologica 21, 1 (1992).<br />
7. Hančuľák J., Bobro M., Brehuv J., Slančo P.: Acta Montanistica<br />
Slovaca 10, 246 (2005).
Chem. Listy, 102, s265–s1311 (2008) Environmental Chemistry & Technology<br />
P16 ThE NATuRAL AND ANThROPOLOGICAL<br />
CONTAMINATION SOuRCES OF ThE<br />
HALČIANSKY WATER RESERVOIR<br />
SLAVOMíRA KAŠIAROVá a and MELánIA<br />
FESZTEROVá b<br />
a Trenčín University of A. Dubček, Department of public<br />
management, Študentská 2, 911 50 Trenčín, Slovakia<br />
b Constantine the Philosopher University, Faculty of Natural<br />
Sciences, Department of Chemistry, Tr. A. Hlinku 1, 949 74<br />
Nitra, Slovakia<br />
kasiarovas@azet.sk<br />
Introduction<br />
Many technical sights, as an integral part of a landscape<br />
structure, are at the same time its dominant features as they<br />
are directly related to its history. In the Banská Štiavnica<br />
region they are mostly related to mining traditions. Importance<br />
of water reservoirs, also called “tajchy”, in the region<br />
stems their recreational utilisation. The cleanliness of water<br />
is therefore a key issue 1 .<br />
This study has focused on the identification of possible<br />
natural and anthropogenic sources 2 of pollution in the model<br />
territory of the Halčiansky water reservoir and consequently<br />
on its contamination. Water reservoirs built to provide the<br />
water energy for driving mining machinery are a part of a<br />
mining history. As such they are a typical landscape-ecological<br />
component of the Banská Štiavnica landscape. Because of<br />
their significance they are listed on The State List of Cultural<br />
Monuments as sights of technical development and on The<br />
World Catalogue of Water Reservoirs.<br />
Experiment and Methods<br />
In the model territory of the Halčiansky Water Reservoir,<br />
conditions of potential movement of water and related contaminants<br />
were analysed in relation to natural and anthropogenic<br />
sources of contaminants with the use of GIS (Geomedia<br />
Professional) tools. The aim of the analysis was to determine<br />
the vector of the transport and representative sampling points.<br />
Based on the system analysis of the above conditions, the<br />
selection of sampling points was proposed with the sampling<br />
points for the transport system set as transparent. Samples of<br />
water taken at the representative points (period 2006–2007)<br />
were analysed in situ by spectrophotometer (Hach DR 2000,<br />
Horiba) and related to an assumed model of contamination.<br />
The results of physical-chemical analysis were further compared<br />
with the expected transit and interpretation of the contamination<br />
in the territory.<br />
Results and Discussion<br />
The following characteristics have been derived from<br />
the results and water quality monitoring:<br />
(i) Water reaction, conductivity, turbidity, temperature,<br />
salinity, nitrates (1.3–<strong>2.</strong>2 mg dm –3 ) and amount of chlorides<br />
(1.6–9.3 mg dm –3 ) and sulphates (18–33 mg dm –3 ) complied<br />
s365<br />
with the norm no. 490/2002 Z. z. during all seasons, and no<br />
measured value exceeded the norm.<br />
(ii) An increase of ammonia, nitrites, phosphates concentrations<br />
and of chemical consumption of oxygen exceeding<br />
the limit value set by the norm no. 491/2002 Z. z. was<br />
recorded during all four seasons.<br />
Free ammonia – concentration values of nH3 were in a<br />
range of 0.07–1.07 mg dm –3 them exceeding the limits<br />
of the norm ( < 0.3 mg dm –3 ). In the vicinity of the sampling<br />
points 2 and 3 there were grazing grounds foraged<br />
by cattle and sheep and an agricultural land fertilized by<br />
ammoniac, sulphate ammonia or liquid manure, increasing<br />
concentration of ammonium salts in water. Cattle<br />
excrements and fertilizers are entering water reservoir<br />
by the run-off flowing down the surrounding slopes.<br />
The directions of run-off conditions also confirm this.<br />
Another source of pollution at the sampling points 5 and<br />
6 was stabled cattle and cesspools from the residential or<br />
recreational areas.<br />
The most distinctive representation of pollution in the<br />
form of nitrites 0.004–0.226 mg dm –3 was detected in<br />
spring when the concentration of those contaminants<br />
exceeded the value set up by the norm almost eleven<br />
times. Mutual comparison of sampling points indicated<br />
the highest concentration of nitrites at the sampling<br />
sites 3, 4, 5 and 6. nitrites are products of biochemical<br />
oxidation of ammonia and to lesser extent products of<br />
the reduction of nitrates. Their sources are household<br />
sewage and wastewater.<br />
There were also excessive concentrations of phosphates<br />
0.6–<strong>2.</strong>1 mg dm –3 , which exceeded limits set up by the<br />
norm five times, with maximum concentrations registered<br />
in autumn at the sampling site <strong>2.</strong> Main sources of<br />
phosphates are household sewage and wastewater together<br />
with dead bodies of plants and animals.<br />
Chemical consumption of oxygen 10–2,800 mg dm –3<br />
•<br />
•<br />
•<br />
•<br />
had the highest value in winter, at the sampling site 1<br />
(the dam), exceeding the limit value set up by the norm<br />
eighty times. Organic water pollution can be both of<br />
natural (leaches from the organically rich soil, forest,<br />
peat bog, etc.) and artificial origin (pesticides, fertilisers).<br />
The above results have shown that the selection of sampling<br />
points based on the system analyses and GIS outcomes<br />
confirmed assumptions of physical-chemical analysis of<br />
water in natural and residential zones. The exceptions were<br />
nitrates and chlorides concentrations, in case of which the higher<br />
values were expected especially in the agricultural areas<br />
or residential zones.<br />
Conclusions<br />
Results of potential conditions of contaminants in the<br />
territory of the vector movement of water and gravitation<br />
confronted with results of physical-chemical analyses show<br />
the relevance of the model. This will enable an effective
Chem. Listy, 102, s265–s1311 (2008) Environmental Chemistry & Technology<br />
and rational selection of sampling places in the future,<br />
ensuring the representativeness of sampling in the professional<br />
analysis of water contamination.<br />
This work has been supported by grant VEGA<br />
1/3276/06.<br />
s366<br />
REFEREnCES<br />
1. Samešová D., Melichová Z., Šikulová Z.: Séria environ.<br />
ekol. 1, 104 (2002).<br />
<strong>2.</strong> Samešová D., Ladomerský J.: Ekologia, 2006 (in<br />
press).
Chem. Listy, 102, s265–s1311 (2008) Environmental Chemistry & Technology<br />
P17 bIOMODIFIED FORMS OF NATuRAL<br />
ZEOLITE AND ThEIR <strong>ENVIRONMENTAL</strong><br />
APPLICATION<br />
MáRIA REHáKOVáa , ľUBICA FORTUnOVáa , SILVIA<br />
ČUVAnOVáb , LUCIA GABEROVác and MáRIA<br />
KUŠnIEROVáb aFaculty of Science, P.J.Šafárik University, Moyzesova 11,<br />
041 54 Košice, Slovac Republic,<br />
bInstitute of Geotechnics, Slovak Academy of Sciences, Watsonova<br />
45, 043 53 Košice, Slovac Republic,<br />
cUniversité de Provence, Centre de Saint-Jérôme, Marseille,<br />
France,<br />
maria.rehakova@upjs.sk<br />
Introduction<br />
The increasing levels of heavy metals in the environment<br />
represent a serious threat to human health, living resources,<br />
and ecological systems. Mobile and soluble heavy metal species<br />
are not biodegradable and tend to accumulate in living<br />
organisms, causing various deseases and disorders. Amongst<br />
various treatment methods, ion exchange and sorption seem<br />
to be the most attractive in case those nontoxic, low cost zeolites<br />
are used.<br />
natural zeolite of clinoptilolite type (CT) from East<br />
Slovakian deposit in nižný Hrabovec has been studied with<br />
respect to its feasibility of application in environmental area<br />
in combination with biotechnological methods.<br />
This recent investigation presents a continuation of our<br />
previous study 1,2 of the decrease of content of heavy metal<br />
and other toxic compounds (polychlorinated biphenyls-PCB)<br />
in plants growing on heavily contaminated soils in industrial<br />
areas. natural zeolite as well as zeolitic fertilizers was used in<br />
this study. The results of study of growing certain agricultural<br />
plants in contaminated soils with varying dosages of natural<br />
zeolite (CT), zeolitic fertilizer and standard nPK fertilizer<br />
confirmed the favorable influence of both zeolite and the zeolite<br />
based fertilizer. Analysis of plant material showed that<br />
the lowest content of heavy metals (Zn, Cu, Pb, Cd and Cr)<br />
as well as of PCB was found in plants grown in contaminated<br />
soils with the application of CT. The content of heavy metals<br />
and PCB was lower almost of a half in comparison with<br />
plants grown on untreated contaminated soils 2 . Plants grown<br />
in contaminated soils with the addition of zeolitic fertilizer<br />
showed a somewhat higher content. natural clinoptilolite by<br />
ion exchange of heavy metals and sorption of toxic substances<br />
into its cavities and channels blocked their reception into<br />
the plants.<br />
The aim of the recent study is the enlarging of clinoptilolite<br />
sorption surface by the effect of microorganisms and<br />
obtaining more efficient results of its application in the process<br />
of reducing the residual content of heavy metals and<br />
other toxic compounds in industrial contaminated soils.<br />
According to the literature 3–5 , certain species of microorganisms<br />
have been found to absorb surprisingly large<br />
quantities of heavy metals. The removal of heavy metals<br />
s367<br />
from municipal and industrial wastes by biological treatment<br />
systems has continued to be of interest. Bacterial surfaces<br />
have great affinity to sorb and precipitate metals resulting<br />
in metal concentration on the surface. All microbes, which<br />
expose negatively charged groups on their cell surface, have<br />
the capacity to bind metal ions. Complexolysis is a process<br />
corresponding to microbial formation of complexing and<br />
chelating agents that solubilize metal ions. The microorganisms<br />
are able to transform toxic compounds to less toxic.<br />
Biosorption of copper (II) ions by Thiobacillus ferrooxidans<br />
were studied and is shown to be an effective bacterial bioaccumulation<br />
process 3 . Acidithiobacillus and Thiobacillus cultures<br />
are used for biological reduction of chromium (VI)-containing<br />
wastes 4 . The attention is paid also to the utilization of<br />
combination of microorganisms and microporous materials<br />
(active carbon, zeolite) to achieve better sorption properties<br />
for adsorption of toxic compounds 5 .<br />
Our recent study is aimed to biomodification of the<br />
surface of natural zeolite of the clinoptilolite type using the<br />
microorganisms Thiobacillus ferrooxidans. Studied are also<br />
model forms of zeolites containing copper ions, and the influence<br />
of microorganisms on the biosorption of these ions as<br />
well as other changes connected with metabolic activity of<br />
the microorganisms present. The main motivation of this<br />
study is the remediation of soils contaminated with high concentrations<br />
of the residual of heavy metals and other toxic<br />
compounds.<br />
Experimental<br />
In order to study modified forms of natural zeolite, the<br />
natural zeolite of clinoptilolite type (CT) was used from<br />
the Eastern Slovakia deposit in nižný Hrabovec. Two various<br />
granulometric classes were taken for the experiments:<br />
fine-grained one of the particle size up to 200 μm, denoted<br />
as CT1, and coarse-grained of the particle size 0.4–0.6 mm,<br />
denoted as CT<strong>2.</strong> Both granulometric classes of clinoptilolite<br />
was thermally activated at 100–110 o C for 1 hour. So prepared<br />
zeolitic samples were used for the synthesis of copper<br />
forms as well as for cultivation by microoganisms.<br />
All chemical agents used at the synthesis of modified<br />
copper forms of the natural clinoptilolite, at the analyses<br />
and preparation of nutrition medium were analytical grade<br />
(Merck and Fluka).<br />
P r e p a r a t i o n o f C o p p e r F o r m s o f<br />
n a t u r a l Z e o l i t e<br />
Copper forms of natural clinoptilolite were prepared by<br />
the reaction of fine- and coarse thermally activated fraction<br />
of natural clinoptilolite by a reaction with CuSO 4 solution of<br />
two concentrations: 0.1 and 1.0 mol dm –3 . By this way, both<br />
copper forms, fine-grained denoted as CuCT1 and coarse-grained<br />
one, denoted as CuCT2, were obtained in consequence<br />
of an ionic-exchange mechanism. These heterogeneous mixtures<br />
were after 2 hours of stirring decanted several times and<br />
centrifuged in order to get rid of sulphate ions and then dried<br />
for 1 hour at 100 °C.
Chem. Listy, 102, s265–s1311 (2008) Environmental Chemistry & Technology<br />
D e t e r m i n a t i o n o f C o p p e r C o n t e n t<br />
i n C u C T S a m p l e s<br />
The copper content in the copper forms of CuCT1 and<br />
CuCT2 was determined indirectly by determination of copper<br />
content in the solution unadsorbed by the zeolitic structure,<br />
both by AAS spectroscopy at Varian Spectr AA-30, Australia<br />
and by SPECOL 11, Carl Zeiss, Jena.<br />
The amount of Cu (II) in the zeolitic samples was determined<br />
by the energy dispersive spectroscopy (EDS) analysis<br />
using a TESLA BS 340 scanning electron microscope<br />
(TESLA ELMI a.s. with a LInK ISIS 300 microanalyser).<br />
C o n t a m i n a t i o n o f t h e Z e o l i t i c<br />
M a t e r i a l b y M i c r o o r g a n i s m s<br />
The zeolitic samples the CT1 and CT2 fractions and the<br />
copper forms were contamined in a parallel process of cultivation<br />
of microorganisms Thiobacillus ferrooxidans (TF) for<br />
different time 3,4,5 and 12 months. Before the contamination,<br />
all zeolitic samples were irradiated by a germicide lamp<br />
for sterilization. The microorganisms used were sufficiently<br />
multiplicated in a nutrition medium 9K according to Silverman<br />
and Lundgren 6 . In order to compare the surface areas<br />
and the pore volumes, a control abiotic sample (denoted as<br />
CTF) was used after application only of nutrition medium,<br />
without microorganisms.<br />
A n a l y s i s o f t h e S u r f a c e A r e a s a n d<br />
t h e P o r e V o l u m e s<br />
The analysis of surface areas and the pore volumes of the<br />
zeolitic samples prior to the contamination and after contamination<br />
by microorganisms were realized by GEMInI 2360<br />
(Micrometrics USA). The specific surface area was determined<br />
by low-temperature adsorption of nitrogen. Before measurements<br />
the samples were heated for 2 hours at 105 °C.<br />
Results and Discussion<br />
Biomodified zeolitic samples were prepared by using<br />
microorganisms in order to achieve larger sorption surface at<br />
natural zeolite of the clinoptilolite type and thus obtain more<br />
efficient results at its application in reducing the content of<br />
heavy metal residuals and other toxic materials in industrially<br />
contamined soils. Two grain- size fractions of natural clinoptilolite<br />
were studied: fine-grained (CT1) and coarse-grained<br />
(CT2). Both fractions were cultivated by microorganisms<br />
Thiobacillus ferrooxidans (TF) after thermal activation. This<br />
type of microorganism was chosen from the collection of soil<br />
microorganisms due to its accessibility as well as to the fact<br />
that some laboratory methods were available developed at the<br />
Institute of Geotechnics of the Slovak Academy of Sciences<br />
in Košice. Experimental experiences were obtained with<br />
using this type of microorganisms in the extraction of heavy<br />
metals from aluminosilicate structure. Thiobacillus ferrooxidans<br />
are applied in mineral biotechnologies for the extraction<br />
of Cu, Fe and other metals 7 and they are also present in low<br />
concentrations in the soil.<br />
s368<br />
In our first studies of the biomodified forms 8 of the natural<br />
zeolite of clinoptilolite type (CT) the microorganisms<br />
Actinomycetes were used too. However, we had observed<br />
only negligibly small changes caused by these microorganisms<br />
in the studied time interval so that we did not continue<br />
in that study.<br />
The zeolitic samples were cultivated at dynamic conditions<br />
for different time intervals: 1,3,4,5 months and 1 year.<br />
The analyses of the surface area size and pore volumes were<br />
realized also after short time intervals during the activity of<br />
the microorganisms and nutrition medium: after 3 hours and<br />
one day. The surface area and pore volumes decreased in<br />
these short time intervals.<br />
In our previous studies 2 the content of heavy metals<br />
and PCB in the plants (spring barley-Hordeum vulgare) that<br />
were grown in contaminated soils decreased (e.g. content of<br />
Cu = 16 mg kg –1 , Zn = 5<strong>2.</strong>4 mg kg –1 , PCB = 2524 µg kg –1 )<br />
compared with the plants grown in contaminated soils<br />
without an added zeolite (content of Cu = 33.1 mg kg –1<br />
Zn = 107 mg kg –1 , PCB = 4765 µg kg –1 ). For this reason we<br />
have prepared also some model forms of the natural CT with<br />
a copper cations content, which forms could be analogically<br />
obtained in natural conditions too, if the clinoptilolite sorbs<br />
the copper cations that are in the industrially contaminated<br />
soils.<br />
Via the contamination of the copper forms of the clinoptilolite<br />
by the mentioned microorganisms we pursued the<br />
changes of the surface, the volume of the pores and the bioleaching<br />
of copper from the zeolitic material as well.<br />
The results of the study of the surfare areas changes of<br />
the clinoptilolite, its fine-grained CT1 and coarse-grained<br />
CT2 and its some copper forms CuCT1 and CuCT2 are in<br />
the Table I and Figs. 1. and <strong>2.</strong> The results of the pore volumes<br />
were in a good agreement with the results of the surface<br />
Table I<br />
Summary of the size of the surfaces (Sa) of the fine-grain<br />
fraction CT1, coarse-grain fraction CT2 and some copper<br />
forms before and after the contamination by microorganisms<br />
Thiobacillus ferrooxidans (TF), and the reference sample<br />
(CTF) containing only the nutrition medium without the<br />
microorganisms<br />
Samples contaminated Sa Control<br />
Sample with microorganisms TF [m 2 g –1 ] sample CTF<br />
Sa [m 2 g –1 ]<br />
CT1 starting sample without TF 24.2117 24.2117<br />
after 3 months with TF 29.635 30.6734<br />
CT2 starting sample without TF 25.4622 25.4622<br />
after 3 months with TF 30.3999 28.6739<br />
CuCT1 starting sample without TF 25.1931 25.1931<br />
(0.1M) after 3 months with TF 33.0535 3<strong>2.</strong>6870<br />
after 1 year with TF 38.2758 37.4310<br />
CuCT2 starting sample without TF 25.6817 25.6817<br />
(0.1M) after 3 months with TF 33.154 33.6086<br />
after 1 year with TF 4<strong>2.</strong>7652 39.6286
Chem. Listy, 102, s265–s1311 (2008) Environmental Chemistry & Technology<br />
areas. The surface areas are relatively low because they were<br />
measured only for comparison of the changes. These samples<br />
were heated only at temperature 105 o C for two hours. In our<br />
next study the surface area will be measured also after heating<br />
at the higher temperatures up to 400 °C.<br />
Fig. 1. Diagram of surface area changes Sa [m 2 g –1 ] of zeolitic<br />
sample CT2, vs. its control (CTF): 1) starting sample, 2) three<br />
months after the contamination by the Thiobacillus ferrooxidans<br />
Fig. <strong>2.</strong> Diagram of surface area changes Sa [m 2 g –1 ] of zeolitic<br />
sample CuCT2, vs. its control (CTF): 1) starting sample, 2) one<br />
year after the contamination by the Thiobacillus ferrooxidans<br />
After the comparison of the samples before the contamination<br />
by the microorganisms TF and the reference samples<br />
CTF it was found out that even the nutrition medium itself,<br />
pH = 1.57, contributes to the enlargement of the surface area.<br />
The changes of the surface size and the pore volumes were<br />
related also with the grain size. At the fine-grain fraction<br />
CT-1 the enlargement of the surface of the reference sample<br />
(CTF) was higher compared to the sample contaminated<br />
by microorganisms. But at the coarse-grained fraction CT-2<br />
which was contaminated by microorganisms the enlargement<br />
of the surface area was higher compared with the reference<br />
sample. However, more study is still necessary to confirm it<br />
and to find out if a change of the grain-size has not occured<br />
because such a change can cause an enlargement of the surface<br />
size.<br />
At the copper forms CuCT the activity of the microorganisms<br />
caused enlargement of the surface area and the pore<br />
s369<br />
volumes at both the fine-grain and the coarse-grain fraction,<br />
compared to the reference samples.<br />
The copper forms were studied also with respect to a<br />
copper bioleaching. According to the analyses of the copper<br />
content in the samples contaminated by microorganisms for<br />
one year their activity decreased the copper content about<br />
60–75 % (e.g. Cu = <strong>2.</strong>17 % in CuCT1 (0.1M) without TF;<br />
Cu = 0.58 % in CuCT1 (0.1M) with TF after 1 year). The<br />
bioleaching decreased the copper content in the copper forms<br />
of the zeolitic samples (CuCT) depending on its starting concentration<br />
and on other conditions of the bioleaching process.<br />
Thiobacillus ferrooxidans utilises copper ions for its metabolic<br />
processes. T. ferrooxidans contains in the periplasmic<br />
space the small blue copper proteins – rusticyanin, which are<br />
the principal component in the iron respiratory electron transport<br />
chain 9 .<br />
The study of the surface area changes and of the bioleaching<br />
of copper continues with the aim to obtain more<br />
detailed results after more time intervals and under various<br />
conditions.<br />
Conclusions<br />
The results of the analyses of the surface area size and<br />
the pores volume of the clinoptilolite and its copper forms<br />
both before and after the contamination by microorganisms<br />
Thiobacillus ferrooxidans confirmed the changes caused by<br />
the presence of the microorganisms. The results of the copper<br />
bioleaching too indicated that via the influence of the nutrition<br />
media and metabolic activity of the microorganims there<br />
occured changes of the zeolite surface and decrease of the<br />
copper content in the samples. At the present we continue in<br />
the study with the aim to obtain more experimental results<br />
about the activity of the microorganisms acting for various<br />
time intervals and at various conditions.<br />
The combination of application of the zeolites and bioremediate<br />
technologies, which use the metabolic activity<br />
of the microorganisms looks to be a perspective ecological<br />
alternation of the contaminants degradation.<br />
This work has been supported by Scientific Grant<br />
Agency of the Slovak Republic (grants No. 1/0107/08 and<br />
2/7163/27).<br />
REFEREnCES<br />
1. Reháková M., Čuvanová S., Gavaľová Z., Rimár J.:<br />
Chem. listy 5, 260 (2003).<br />
<strong>2.</strong> Reháková M., Čuvanová S., Dzivák M., Rimár J.,<br />
Gavaľová Z.: Curr. Opin. Solid State Mater. Sci. 8, 397<br />
(2004).<br />
3. Masud Hussain S., Anantharaman n.: J. Univ. Chem.<br />
Technol. Metall 40, 227 (2005).<br />
4. Allegretto P., Furlong J., Donati E.: J. Biotechnol. 122,<br />
55 (2006).<br />
5. Lameiras S., Quintelas C., Tavares T.: Bioresour. Technol.<br />
99, 801 (2008).
Chem. Listy, 102, s265–s1311 (2008) Environmental Chemistry & Technology<br />
6. Silverman M. P., Lundgren D. G.: J. Bacteriol. 78,326<br />
(1959).<br />
7. Kušnierová, M., Fečko, P. Minerálne biotechnológie I.,<br />
VŠB–TU, Ostrava 2001, p. 143.<br />
s370<br />
8. Reháková M., Kušnierová M., Gaberová L., Fortunová<br />
ľ., Čuvanová S.: Chem. listy 100, 717 (2006).<br />
9. Kanbi D. L., Antonyuk S., Hough M. A., Hall J. F., Dodd<br />
F. E., Hasnain S. S.: J. Mol. Biol. 320, 263 (2002).
Chem. Listy, 102, s265–s1311 (2008) Environmental Chemistry & Technology<br />
P18 DISTRIbuTION PATTERNS OF ORGANIC<br />
POLLuTANTS IN bRNO LAKE wITh<br />
RESPECT TO ITS DEPOSITIONAL hISTORy<br />
eVA FRAnCůa , JAn SCHWARZBAUERb , MATHIAS<br />
RICKInGc , RADIM LánAa , PAVEL MüLLERa , JURAJ<br />
FRAnCůa and SLAVOMIR nEHYBAd aCzech Geological Survey, Leitnerova 22, 658 69 Brno, Czech<br />
Republic,<br />
bInstitute of Geology and Geochemistry of Petroleum and<br />
Coal, Aachen University of Technology (RWTH), Lochnerstr.<br />
4–20, 52056 Aachen, Germany,<br />
c Working Group Hydrogeology and Applied Geochemistry,<br />
Free University Berlin, Malteserstr. 74–100 – Raum B117,<br />
12249 Berlin, Germany,<br />
dDepartment of Geology and Mineralogy, Masaryk University,<br />
Kotlarska 2, 611 37 Brno,<br />
eva.francu@geology.cz<br />
Introduction<br />
The contamination of the environment with persistent<br />
organic pollutants (POPs) has been of great concern since the<br />
1960s. Polychlorinated biphenyls (PCBs) or organochlorine<br />
pesticides (OCPs) are found mainly in water, sediments and<br />
aquatic biota throughout the world 1,2 . Owing to an intensive<br />
agricultural and industrial production in past few decades, in<br />
particular, river and lake sediments in the Czech Republic are<br />
loaded with POPs and their levels are only partly decreasing 3 .<br />
Brno Lake is situated on the Svratka River upstream from the<br />
city of Brno and belongs to the most important water reservoirs<br />
in the SE Czech Republic. Undisturbed sediment deposits<br />
in lacustrine systems can act as environmental archive after<br />
radiodating 4,5 . Since there are only a few studies dealing<br />
with the levels of organochlorine contaminants in dated sediment<br />
cores 6–9 , this pilot study is focused on the occurrence<br />
of risk elements and organic pollutants in vertical profiles of<br />
the sediment layers of the Brno Lake in order to restore the<br />
pollution history of these trace organic pollutants.<br />
Experimental<br />
The first sampling campaign in Brno Lake covered nine<br />
1m-deep cores with 52 sediment samples. A 3 m-long core<br />
was drilled during the period of time when the reservoir was<br />
empty in the early 2008. The detailed sampling includes<br />
120 samples in total; detailed sedimentological investigation<br />
and geochemistry were applied to the whole 3 m profile.<br />
All samples were analyzed using screening methods<br />
such as magnetic susceptibility (Kf) measured on KLY-2,3<br />
and 3S kappabridges, elemental analysis of total organic and<br />
inorganic carbon (TOC, TIC, respectively), high performance<br />
liquid chromatography (HPLC) of 16 EPA priority polycyclic<br />
aromatic hydrocarbons (PAH), and gas chromatography<br />
with flame ionization detector (GC-FID) to measure the total<br />
extractable hydrocarbons (TEH). Seven indicative PCB congeners<br />
and organochlorine pesticides were determinated by<br />
means of gas chromatograph HP 6890 equipped with µECD<br />
s371<br />
63 ni, cool-on-column injector and capillary column HP-5ms<br />
(60 m × 0.25 mm i.d.). From the screening results 20 samples<br />
were selected for gas chromatography coupled with mass<br />
spectrometry (GC/MS) in full scan mode to characterize the<br />
distribution of the alkylated aromatic and parent hydrocarbons<br />
and in selected ion monitoring mode (SIM) for the saturated<br />
fraction (SAT).<br />
Results<br />
The sedimentological visual examination together with<br />
elemental analysis of the total organic and inorganic carbon<br />
(TOC and TIC) and of the magnetic susceptibility (Kf) indicate<br />
a stratigraphic archive with roughly 5 cycles each about<br />
60 cm thick marked by increased magnetic susceptibility,<br />
increased sand content and lowered organic carbon (Fig. 1.).<br />
These coarser grained intervals formed probably during major<br />
flooding events and migration of the lake bottom channel.<br />
Fig. 1. Total organic carbon and magnetic susceptibility in the<br />
deep well core profile from the Brno Lake (2008)<br />
The early phase of the depositional history has sedimentary<br />
structures suggesting more fluviatile environment<br />
and sandy lithology. The later phases are characteristic by<br />
increasing portion of fine-grained sediments. Laminated<br />
sediments with organic carbon of up to 7.18 % mark the highstand<br />
phases with stratified water column, which persisted<br />
over long periods of the existence of the lake. A Th-U(Ra)-K<br />
gamma-spectrometric survey shows that a probable source<br />
of these elements is in the weathered granitic material of the<br />
Brno Massif while the contribution from the U-mines is negligible.
Chem. Listy, 102, s265–s1311 (2008) Environmental Chemistry & Technology<br />
The dating using 137 Cs indicates the position of the 1986<br />
and 1961-2 events. The organic carbon, total sulphur, PAHs<br />
and PCBs provide a tentative pattern related to depositional<br />
history and flow rate. The geochemical profiles show a<br />
general upward increase in eutrophication and organic matter<br />
accumulation associated with increased cyanobacterial<br />
blooms. The sum of nine PAHs often exceeds the 10 mg kg –1<br />
EPA limit value and their pyrogenic character suggests an origin<br />
in low-quality fuel and furnaces used in the villages and<br />
recreational facilities in the watershed.<br />
Fig. <strong>2.</strong> Vertical changes in organochlorine pollutants levels in<br />
one-meter-deep well core profiles from the Brno Lake (2001)<br />
The higher-chlorinated PCB congeners 138, 153 and<br />
180, and p,p-DDE (a highly stable aerobic metabolite of the<br />
notorious insecticide p,p-DDT) are the most abundant organochlorine<br />
compounds detected in the sediments. PCBs show<br />
upward increase from a depth of 0.6 (0.8–0.5) m (Fig. <strong>2.</strong>),<br />
which marks the beginning of the use of PCBs and DDT. A<br />
s372<br />
stagnation in the PCB and DDT concentration is observed in<br />
the upper part of the profile (0.25–0.00 m) deposited during<br />
the last decade. The differences in POP concentrations found<br />
in individual cores and layers are closely associated with<br />
variable sedimentation rates and occurrences of bottom currents<br />
affecting the organic matter deposition.<br />
Conclusions<br />
The pollution archive related to the depositional history<br />
of the Brno Lake suggest at least 5 cycles, each about 60 cm<br />
thick, defined by the maxima in magnetic susceptibility and<br />
minima in total organic carbon which are associated with<br />
major floods or migration of bottom currents. The amount<br />
of POPs is low in more sandy early sediments, increases<br />
at a specific depth and age throughout the basin and finally<br />
stagnates during the last decade of mud deposition indicating<br />
decreased input of POPs into the environment.<br />
This work has been supported by The Ministry of the<br />
Environment of the Czech Republic,Project SP/1b7/156/07.<br />
REFEREnCES<br />
1. Sapozhnikova Y., Bawardi O., Schlenk D.: Chemosphere<br />
55, 797 (2004).<br />
<strong>2.</strong> Luder B., Kirchner G., Lucke A., Zolitschka B.: J. Paleolimnol.<br />
35, 897 (2006).<br />
3. Müller, P., Hanák, J., Boháček, Z., Toul, J., Müllerová,<br />
H., Kovářová, M.: Final Report of the project<br />
VaV/630/4/02, MS, Czech Geological Survey, Praha.<br />
Brno. MŽP Praha (2005a in Czech).<br />
4. Bollhöfer A., MAngini A., Lenhard L., Wessels M., Giovanoli<br />
F., Schwarz B.: Environ Geol 24, 267 (1994).<br />
5. Heim S., Schwarzbauer J., Kronimus A., Littke R., Woda<br />
C., Mangini A.: Org. Geochem. 35, 1409 (2004).<br />
6. Heim S., Ricking M., Schwarzbauer J., Littke R.: Chemosphere<br />
61, 1427 (2005).<br />
7. Catallo W.J., Schlenker M., ambrell R.P., Shane B.S.:<br />
Environ Sci Technol 29, 1436 (1995).<br />
8. Wei S. et al: Mar. Pollut. Bull. (in press, 2008).<br />
9. Heim, S., Schwarzbauer, J., Kronimus, A., Littke,<br />
R., Hembrock.-Heger, A.: Envir.. Chem. Lett. 1, 169<br />
(2003).
Chem. Listy, 102, s265–s1311 (2008) Environmental Chemistry & Technology<br />
P19 NEw RESIN GEL FOR DIFFuSIVE<br />
GRADIENTS IN ThIN FILM (DGT)<br />
TEChNIQuE<br />
MICHAELA GREGUŠOVá a,b , BOHUMIL DOČEKAL b<br />
and HAnA DOČEKALOVá b<br />
a Institute of Analytical Chemistry of the ASCR, v. v. i.<br />
Veveří 97, 60200, Brno, Czech Republic,<br />
b Faculty of Chemistry, Brno University of Technology<br />
Purkyňova 118, 61200 Brno, Czech Republic,<br />
xcgregusova@fch.vutbr.cz<br />
Introduction<br />
The diffusive gradients in thin film technique (DGT)<br />
represents a relatively new approach to in situ determination<br />
of labile metal species in aquatic systems. The DGT device<br />
accumulates labile species in situ from the solution, and thus<br />
problems associated with conventional collection and filtration<br />
procedures can be eliminated. After diffusing through<br />
a layer of polyacrylamide gel of known thickness (Fig. 1.),<br />
metal species are trapped by an immobilized binding agent<br />
(usually Chelex 100) incorporated in a resin gel layer 1 . Concentration<br />
gradient established in the diffusive layer is a basis<br />
for quantitative measurement of metal concentrations in the<br />
solution. The mass of accumulated metals in the resin gel is<br />
usually determined by AAS or ICP-MS after elution of resin<br />
gel with acid.<br />
This paper reports on the performance of a new resin<br />
gel based on alternative binding agent with 5-sulphophenylazo-8-hydroxychinoline<br />
groups, specific sorbent Spheron-<br />
Oxin ® (ref. 2 ).<br />
Experimental<br />
Diffusive and resin gels were based on polyacrylamide<br />
hydrogel, prepared according to the conventional procedures<br />
(DGT Research Ltd., Lancaster, UK) 1 . Chelex 100 was substituted<br />
by Spheron-Oxin ® in the resin gel. DGT probe was<br />
loaded with resin gel, diffusive gel and filter on the cylindric<br />
body and sealed with a plastic top with an exposition window<br />
of 2 cm in diameter (Fig. 1.). DGT probes were deployed in<br />
the test solutions at 24 ± 1 °C.<br />
Elution efficiency of Cd, Cu, ni, Pb and U was obtained<br />
from subsequent elution experiments with 1 ml 1 mol dm –3<br />
nitric acid. The sorption capacity of discs was estimated<br />
Fig. 1. Scheme of the DGT unit<br />
s373<br />
from accumulated mass of a metal in resin discs immersed<br />
in solutions of 25–790 mg dm –3 Cu. The effect of solution<br />
acidity was investigated within the range of pH 3–8. The<br />
effect of ionic strength and potentional interferents of alkali<br />
earth elemets to heavy metals was tested with model solution<br />
of sodium (<strong>2.</strong>5 × 10 –5 –0.6 mol dm –3 ) and magnesium<br />
(0–0.05 mol dm –3 ) nitrate. The effect of competitive ligands<br />
on DGT metal uptake was investigated in solutions containing<br />
iminodiacetic acid (0–1 × 10 –4 mol dm –3 ) and humic<br />
substance Fluka (product no. 53680) (0–316 mg dm –3 ).<br />
For estimation of specific sorption capabilty to uranium,<br />
sorbents Chelex 100, Spheron-Oxin ® and Spheron-Salicyl ®<br />
were exposed to 5 mg dm –3 U solutions (pH ~ 6,7) of various<br />
carbonate concentration (0–100 mg dm –3 ).<br />
Results<br />
Quantitative analysis by DGT requires reproducible elution<br />
of metal ions from the resin. The elution efficiency for<br />
the Spheron-Oxin ® resin gel, calculated as the ratio of the<br />
amount eluted from the gel and the amount taken up by the<br />
gel, was 0.98, 0.66, 0.86, 0.93 and 0.90 for Cd, Cu, ni, Pb<br />
and U, respectively.<br />
Since DGT can be used as a long-term monitoring tool,<br />
it is important to assess the sorption capacity of the resin gel.<br />
Maximum sorption capacity of 3 μmol disk –1 Cu was determined<br />
from the isotherm. Because the linear part of the sorption<br />
isotherm relates to aproximatelly 10 % of the capacity,<br />
discs can be deployed in natural waters for a long time period<br />
of several months.<br />
Uptake experiments in the pH range of 3–8 showed that<br />
resin gel with Spheron-Oxin ® can be used in DGT technique<br />
within the pH range of 6–8, typical for most of the natural<br />
waters.<br />
The effect of ionic strength was investigated with solution<br />
of cadmium (40 μg dm –3 ). Concentration of Cd measured<br />
by DGT was independent of ionic strengths up to<br />
0.6 mol dm –3 nanO 3 .<br />
Fig. <strong>2.</strong> Influence of IDA concentration c IDA on the normalized<br />
values of the apparent diffusion coefficients (D APP /D TAb ) for Ni<br />
(pH ~ 7). ●Chelex 100, ▲Spheron Oxin®
Chem. Listy, 102, s265–s1311 (2008) Environmental Chemistry & Technology<br />
In real water systems, several other ions are present,<br />
which can compete with metals measured by DGT. The Ca<br />
and Mg are dominant cations in hard waters. Although the<br />
stability constant for magnesium is lower than for Cd, Cu,<br />
ni and Pb, magnesium can affect DGT measured metals concentrations.<br />
Uptake of Cd, Cu, ni and Pb was not influenced<br />
by magnesium nitrate in the whole concentration range up tu<br />
0.05 mol dm –3 . new discs can be also used in high salinity<br />
waters.<br />
Fig. 3. Ifluence of HA concentration c hA on the normalized values<br />
of the apparent diffusion coefficients (D APP /D TAb ) for Spheron-Oxin<br />
® resin gel (pH ~ 7). ▲Cd, ●Cu, □Ni, ■Pb<br />
In natural waters, variety of ligands occurs that can affect<br />
concentration measured by DGT technique. Iminodiacetic<br />
acid (IDA) was used as a model strong ligand influencing<br />
the uptake of metals. The results of deployment of DGT<br />
units, packed with Spheron-Oxin ® and Chelex 100 resin gels,<br />
in ni solutions containing IDA in the concentration range of<br />
0–0.1 mol dm –3 are shown in Fig. <strong>2.</strong><br />
Diffusion coefficients (D) can be calculated when taking<br />
into account diffusion area (3.14 cm 2 ) and thickness of the<br />
diffusive layer. Those diffusion coefficients can be considered<br />
as apparent diffusion coefficients (D APP ) of the metal under<br />
specific conditions. Their values represent the metal fluxes<br />
per unit deployment time, unit diffusion area, unit metal concentration<br />
in the external solution and unit thickness of the<br />
diffusive gel layer. The difference between both curves relates<br />
to stability constants of both funcional groups. This difference<br />
can be employed in speciation measurements.<br />
Humic acids (HA) are the most widespread natural complexing<br />
ligands. Influence of the concentration of the humic<br />
substance on the D APP is shown in Fig. 3., in which elementspecific<br />
effect of HA can be observed. Similar results were<br />
also obtained in Refs. 3,4 , in which Chelex 100 and Spheron-<br />
Thiol ® resin gels were used. Due to competitive reactions,<br />
s374<br />
Fig. 4. Influence of carbonate concentration on distribution coefficient<br />
of uranium for ■ Spheron-Oxin ® , ▲ Spheron-Salicyl ® ,<br />
and ● Chelex 100 sorbents (pH ~ 6.7)<br />
the complex formation with HA decreases the concentration<br />
of metal species in external solution that can be measured by<br />
DGT.<br />
Uranium, analogously to other heavy metals, forms various<br />
complexes in natural waters with a variety of ligands.<br />
Depending on pH of the solution, uranyl ions are bound in<br />
stable hydroxocomplexes and, especially carbonate complexes<br />
due to dissolved atmospheric CO 2 . Influence of equilibrium<br />
carbonate concentration on distribution coefficient (D g)<br />
of uranium is shown in Fig. 4. It is evident that the resin gel<br />
based on Spheron-Oxin ® appears to be a new useful resin gel<br />
for speciation analysis of uranium in natural waters.<br />
Conclusions<br />
The new resin gel based on Spheron-Oxin® with anchored<br />
5-sulphophenyl-azo-8-hydroxychinoline functional<br />
groups exhibits very strong afinity to Cd, Cu, ni, Pb and U.<br />
In addition to conventional Chelex 100 based gels it can be<br />
applied in DGT technique and provide more information on<br />
heavy metals speciation, especially of uranium in aquatic<br />
systems.<br />
Acknowledgement: This work was performed and supported<br />
within the Institutional research plan AV0Z40310501.<br />
REFEREnCES<br />
1. Dawison W., Zhang H.: nature 367, 546 (1994).<br />
<strong>2.</strong> Slovák Z.: Bulletin of n.p.Lachema Brno, 1979, 30 p.<br />
3. Dočekal B., řezáčová-Smetková V., Dočekalová H.:<br />
Chem. Pap. 59, 298 (2005).<br />
4. Trávníčková J.: Diploma Thesis. Brno University of<br />
Technology, Brno, Czech Republic, 2008.
Chem. Listy, 102, s265–s1311 (2008) Environmental Chemistry & Technology<br />
P21 ChALLENGES IN ThE ANALySIS OF<br />
hExAbROMOCyCLODODECANE IN ThE<br />
<strong>ENVIRONMENTAL</strong> SAMPLES<br />
PETRA HRáDKOVá, JAn POUSTKA, JAnA<br />
PULKRABOVá, MICHAELA náPRAVníKOVá and<br />
JAnA HAJŠLOVá<br />
Department of Food Chemistry and Analysis, ICT Prague,<br />
Technická 3,166 28 Prague 6, Czech Republic,<br />
petra.hradkova@vscht.cz<br />
Introduction<br />
Brominated flame retardants (BFRs) are compounds<br />
widely used in commercial products to reduce and prevent<br />
the extent of fire. Hexabromocyclododecane (HBCD) is the<br />
third most produced BFR worldwide and the second most<br />
used BFR in Europe. HBCD is mainly applied as an additive<br />
flame retardant for the expanded and extruded polystyrene<br />
which are used as insulation materials in buildings and in the<br />
upholstery textile.<br />
As the HBCD is not chemically bound to the material<br />
to which is added, it could leak into the environment through<br />
emission during a production or use of various materials,<br />
from final products or following disposal. Similarly to other<br />
BFRs, HBCD is a persistent, bioaccumulative and toxic chemical.<br />
There are theoretically 16 HBCD diastereoisomers,<br />
however, the technical mixture consists mainly from three<br />
diastereomeric pairs of enantiomers (α-, β- and γ-HBCD), the<br />
latter one is the most abundant (75–85 %).<br />
Both GC-MS and LC-MS are commonly used techniques<br />
for the quantitative determination of HBCD. Total-<br />
HBCD (sum of α-, β- and γ-HBCD) may be measured by GC-<br />
MS, but it does not allow the quantification of the individual<br />
isomers, because the HBCD diastereoisomers can rearrange<br />
above oven temperature of 160 ºC and also resolution of GC<br />
separation is not sufficient. The individual HBCD diastereoisomers<br />
can be determined using LC-MS/MS. On the other<br />
hand, the response in this system may be influenced by matrix<br />
ion suppression especially in the electrospray ionisation<br />
MS 1,2,3,4 .<br />
In this study, the both types of analytical systems were<br />
tested to assess the ways of HBCD determination in the<br />
environmental samples.<br />
Experimental<br />
The choice of environmental samples was based on: (i)<br />
a representativeness of both biotic and abiotic components<br />
and (ii) origin from Czech environment. The final extracts<br />
of tested samples including target analytes were analysed by<br />
two different chromatographic systems:<br />
• GC-MS (using negative chemical ionization mode (nCI)<br />
with quadrupole analyzer)<br />
• LC-MS/MS (using negative electron spray ionization<br />
(ESI–) with tandem quadrupole analyzer).<br />
s375<br />
S a m p l e T r e a t m e n t<br />
The fish muscles of species chub (Leuciscus cephalus)<br />
and bream (Abramis brama) represented biotic environmental<br />
samples. The chub and bream frequently occur in Czech<br />
rivers, are very suitable as a bioindicator of the aquatic<br />
environment contamination and were caught in the Vltava<br />
River. Also sediment and sewage sludge represented other<br />
analysed samples. The sewage sludge was collected in a<br />
sewage treatment plant (STP) and the river sediment was collected<br />
downstream from this STP, both in Hradec Králové.<br />
The individual standards of α-, β- and γ-HBCD diastereoisomers<br />
were obtained from Cambridge Isotope Laboratories<br />
(CIL, UK).<br />
The samples (sediment and sludge after drying) were<br />
desiccated with anhydrous sodium sulphate and then extracted<br />
in a Soxhlet apparatus using a solvent mixture n-hexane:<br />
dichloromethane (1 : 1, v/v) for fish and DCM in case of sediment/sludge.<br />
The crude extracts were rotary-evaporated to<br />
dryness. Lipid content of fish samples was determined gravimetrically.<br />
In next analytical step, the samples were re-dissolved<br />
in 10 ml of ethylacetate: cyclohexane (1 : 1, v/v). The<br />
fat and other co-extracted compounds were removed by a gel<br />
permeation chromatography (GPC). Finally, a target fraction<br />
was rotary-evaporated and concentrated in isooctane and in<br />
acetonitrile for GC and LC analysis, respectively. GC extract<br />
was in addition treated with concentrated sulphuric acid prior<br />
the analysis.<br />
I n s t r u m e n t a l D e t e r m i n a t i o n<br />
The target analytes were separated using either gas or<br />
liquid chromatography. An Agilent 6890n gas chromatography<br />
(GC) coupled to an Agilent 5975 Inert XL mass spectrometer<br />
(MS) was operated in nCI mode (both Agilent, USA).<br />
The system was equipped with a 15 m × 0.25 mm × 0.1 µm<br />
DB XLB capillary column (J&W Scientific, USA). The temperature<br />
of the column was programmed from 80 °C (2 min)<br />
to 325 °C at a rate of 50 °C min –1 and held for 5 min. Helium<br />
was used as a carrier gas at ramping flow from 1.5 ml min –1<br />
(7.2 min) to 3 ml min –1 at a rate of 50 ml min –1 (ref. 2 ). The ion<br />
source, quadrupole and interface temperature were 150 °C,<br />
150 °C and 300 °C, respectively. Bromine isotopic ions<br />
[Br] – at m/z 79, 81 and molecular ions [Br 2 ] at m/z 158 and<br />
160 were monitored for confirmation HBCD in selected ion<br />
monitoring (SIM) mode.<br />
A high performance liquid chromatograph carried out<br />
with a Waters Alliance 2695 HPLC instrument (USA) together<br />
with a Quattro Premier XE tandem-quadrupole mass<br />
spectrometer (Waters, USA) was operated in negative electrospray<br />
ionization (ESI–). The LC separation of the compounds<br />
was performed on a nUCLEODEX beta-PM chiral column<br />
(200 × 4 mm id, 5 µm, Macherey-nagel), kept at 40 °C, using<br />
an (A) methanol, (B) acetonitrile and (C) deionized water<br />
gradient. The gradient was programmed as follow: 30 % (A),<br />
30 % (B) and 40 % (C), 0–3 min linear change to 30 % (A),<br />
60 % (B) and 10 % (C), 3–20 min kept this composition.
Chem. Listy, 102, s265–s1311 (2008) Environmental Chemistry & Technology<br />
Specific mass transitions (m/z 640 → 79, 81) were used for a<br />
MS/MS determination.<br />
Results and Discussion<br />
The levels of HBCD in selected environmental samples<br />
were monitored using both types of previously described analytical<br />
systems. As mention above, HBCD consists of three<br />
diastereoisomers – α-, β-, and γ-HBCD. Fig. 1. documented<br />
the result of a GC-MS application, this technique does not<br />
enable the isomers separation, all isomers are eluted in one<br />
broaden peak. For this reason, α-isomer is used as a calibrant.<br />
Furthermore, individual diastereomers have different<br />
response factors which can cause that the less accurate results<br />
are obtained in case of higher content of β- and γ-isomers.<br />
Fig. 1. GC-MS chromatogram of hbCD (m/z 79 and 81)<br />
On the other hand, the LC-MS/MS allows separation of<br />
six individual enantiomers as demonstrates Fig. <strong>2.</strong>a. The LC<br />
chromatograms show diverse patterns of the isomeric composition.<br />
In the sediment samples (abiotic matrix), as shows<br />
Fig. <strong>2.</strong>b, γ-diastereoisomer is usually predominant, followed<br />
by α- and β-HBCD, what reflects the diastereomeric profile<br />
in various technical products. The content of the first isomer<br />
in the biota samples is the inverse and α-HBCD is the most<br />
abundant (no figure). It could be caused by biotransformation<br />
process in live organisms 5 . In addition to ability of excellent<br />
separation of individual enantiomers, LC-MS/MS provides<br />
lower limit of detection (0.5 ng g –1 lipid weight, 0.7 ng g –1<br />
dry mass) in comparison with GC-MS system (0.8 ng g –1 lipid<br />
weight, 0.8 ng g –1 dry mass) in case of fish samples, sediment<br />
and sewage sludge, respectively.<br />
The first results obtained from the analysis of the Czech<br />
environmental samples are resumed in Table I. The chub<br />
and bream livers contained both α-HBCD enantiomers and<br />
at the low concentration also β-enantiomers. The high level<br />
of γ-HBCD was determined in the sample of chub muscle<br />
from Podolí. This significantly higher level of γ-isomer in<br />
biota sample may indicate there is an emission source in<br />
particular locality present, because as mention above, γ-isomer<br />
dominates in technical mixture. The similar pattern of<br />
diastereomers was found also in the sediment and sewage<br />
sludge samples where only γ-HBCD was detected as shows<br />
Fig. <strong>2.</strong>b. Comparing the results obtained within our study,<br />
it was found that the GC levels of target analytes are just a<br />
s376<br />
Fig. <strong>2.</strong> LC-MS/MS chromatogram of (a) a standard of hbCD<br />
individual enantiomers and (b) a real sample of river sediment<br />
from Hradec Králové<br />
slightly overevaluated by about 13 % in case of α-diatereomers.<br />
Total differences in the results between LC-MS/MS<br />
and GC-MS can be cause by usage of α-HBCD as a calibrant<br />
together with diverse response factor of individual diastereomers<br />
in GC-MS.<br />
Table I<br />
The results of diastereoisomers obtained by LC-MS/MS<br />
and sum of HBCD as a result of application GC-MS in fish<br />
samples (ng g –1 lipid weight) and sediment/sewage sludge<br />
(ng g –1 dry mass)<br />
HBCD<br />
Results of<br />
Fish Locality Diastereoisomers<br />
GC-MS<br />
α β γ<br />
Chub němčice 34 1.4 n.d 36<br />
Bream němčice 68 0.4 n.d. 80<br />
Chub Klecany 6.6 n.d. n.d. 7.5<br />
Bream Lysá 59 1.1 n.d. 69<br />
Chub Podolí 16 6 105 58<br />
Sediment Hradec Králové n.d n.d 28.1 17.7<br />
Sewage Hradec Králové n.d n.d 103.9 156<br />
sludge<br />
Conclusions<br />
In presented study, two different analytical techniques<br />
(GC/MS and LC-MS/MS) were tested for the analysis of<br />
HBCD isomers in environmental samples. The potential of<br />
the first system is particularly in the determination of the total<br />
HBCD occurrence in samples. On the other hand, the latter<br />
one using chiral permethylated β-cyclodextrine stationary<br />
phase allows the separation and quantification of individual<br />
diastereomers. Comparing the results obtained within our<br />
study, it was found that the GC levels of target analytes are<br />
just little overevaluated. For this reason, the need for further<br />
investigations into differences between GC and LC results<br />
are necessary.
Chem. Listy, 102, s265–s1311 (2008) Environmental Chemistry & Technology<br />
HBCD profiles in fish are different from those observed<br />
in sediment and sewage sludge. In fish, usually α-HBCD is<br />
the major diastereomer, whereas in sediment and in sewage<br />
sludge is most abundant γ-HBCD. The processes affecting<br />
these differences in isomer composition are not fully<br />
investigated yet. LC-MS/MS is an appropriate for monitoring<br />
changes of diastereomers pattern.<br />
This study was undertaken within the projects MSM<br />
6046137305 and NPV II (2B06151).<br />
REFEREnCES<br />
1. Haug L. S., Thomsen C., Liane V. H., Becher G.: Chemosphere<br />
71, 1087 (2007).<br />
s377<br />
<strong>2.</strong> Heeb n. V., Schweizer W. B., Mattrel P., Haag R.,<br />
Kohler M., Schmid P., Zennegg M., Wolfensberger M.:<br />
Chemosphere 71, 1547 (2008).<br />
3. Gómara B., Lebrón-Aguilar R., Quintanilla-López J. E.,<br />
González M. J.: Anal. Chim. Acta 605, 53 (2007).<br />
4. Van Leeuwen S. P. J., De Boer J.: Mol. nutr. Food Res.<br />
25, 194 (2008).<br />
5. Yegers B. n., Mets A., Van Bommel R., Minkenberg<br />
C., Hamers T., Kamstra J. H., Pierce G. J., Boon J. P.:<br />
Environ. Sci. Technol. 39, 2095 (2005).
Chem. Listy, 102, s265–s1311 (2008) Environmental Chemistry & Technology<br />
P22 ThE CONTENT OF POLybROMINATED<br />
DIPhENyL EThERS IN FREShwATER FISh<br />
FROM bRNO wATER RESERVOIR<br />
M. HROCH, M. VáVROVá and V. VEČEREK<br />
Faculty of Chemistry, University of Technology Brno, Purkyňova<br />
118, 612 00 Brno, Czech Republic,<br />
hroch@fch.vutbr.cz<br />
Introduction<br />
One group of “new” persistent halogenated contaminants<br />
is represented by brominated flame-retardants (BFRs).<br />
BFRs are chemicals widely used in various products such as<br />
plastics and textiles to prevent a fire hazard. Generally two<br />
types of these compounds are in use. The reactive BFRs<br />
represented mainly by tetrabromobisphenol A (TBBPA) are<br />
incorporated into the polymeric materials by covalent binding,<br />
whereas the additive types, represented by polybrominated<br />
diphenyl ethers (PBDEs), polybrominated biphenyls<br />
(PBBs) and hexabromocyclododecane (HBCD) are embedded<br />
into a matrix of appropriate polymer.<br />
PBDEs are similar to polychlorinated biphenyls (PCBs)<br />
in structure and characteristics such as hydrophobic and<br />
semi-volatile and/or nonvolatile. Theoretically 209 congeners<br />
(5 majorities) of PBDEs exist with specific chemical<br />
and physical properties, which lead to various biological and<br />
toxicological effects. Alike other organohalogen compounds<br />
such as PCBs, DDT and other organochlorine pesticides, PB-<br />
DEs are lipophilic, very stable and resist to acids and basis,<br />
heat and light and biodegradation.<br />
Table I<br />
Physical and chemical characteristics of majority congeners<br />
Congener no. of Br Log Melting Slb. in water<br />
atom K ow point [°C] [mg ml –1 , 25°C]<br />
47 4 6.55 83.5–84.5 0.015<br />
99 5 7.13 90.5–94.5 0.0094<br />
100 5 6.86 102 0.04<br />
154 6 7.39 131–13<strong>2.</strong>5 8.7 × 10 –7<br />
209 10 9.97 30<strong>2.</strong>5 4.17 × 10 –9<br />
The concern over these anthropogenic compounds is<br />
that they can be released into the environment from products<br />
as they are not chemically bounded to the materials, and more<br />
importantly, they are persistent with a high bioaccumulation<br />
potential.<br />
PBDEs are being found as contaminants of indoor and<br />
outdoor environments. The presence of PBDE was proved in<br />
all the components of the environment such as air, sediment<br />
and sewage sludge as well as biological samples including<br />
biota, human blood, adipose tissues and breast milk. Quite<br />
high concentrations were found in the dust in flats and offices.<br />
s378<br />
Experimental<br />
This study presents results of measuring concentration of<br />
ten PBDE congeners (BDE-3, 15, 28, 47, 99, 100, 118, 153,<br />
154 and 183) in different species of fish using gas chromatography<br />
with electron captured detector (GC-ECD). These<br />
samples were collected from Brno water reservoir, which is<br />
situated near the Brno city.<br />
Five head of each kind were detected and the total PBDE<br />
congener concentrations (Σ PBDEs) in the fish were amur <<br />
bream < crucian < carp.<br />
C h e m i c a l s<br />
PBDE standards, all with declared 99% purity, were<br />
purchased from AccuStandard, Inc. (new Haven, USA).<br />
Working standard mixtures in isooctane contained following<br />
congeners: 4-BDE (BDE 3), 4,4’-diBDE (BDE 15),<br />
2,4,4’-triBDE (BDE 28), 2,2’,4,4’-tetraBDE (BDE 47),<br />
2,2’,4,4’,5-pentaBDE (BDE 99), 2,2’,4,4’,6-pentaBDE<br />
(BDE 100), 2,3’,4,4’,5-pentaBDE (BDE 118), 2,2’,4,4’,5,5’hexaBDE<br />
(BDE 153), 2,2’,4,4’,5,6’-hexaBDE (BDE 154),<br />
2,2’,3,4,4’,5’,6-heptaBDE (BDE 183).<br />
M e t h o d<br />
A homogenized fish tissue was desiccated with mixture<br />
of sea sand and anhydrous sodium sulphate. Soxhlet extraction<br />
carried out (6 hours) with hexane/petrolether solvent<br />
mixture (96 : 4, v/v) for isolation of target analytes from the<br />
sample. Concentrated crude extracts were purified by using<br />
multi layer column (300 × 8 mm; florisil, silica, alumina). The<br />
collected fraction was evaporated to dryness and re-dissolved<br />
in 1 ml of isooctane. After addition of a few drops of sulphuric<br />
acid the organic layer was used for GC analysis. Quantification<br />
of target analytes was carried out by high-resolution<br />
gas chromatography, where two capillary columns (DB-17<br />
MS column and HT-8 column) operated in parallel mode<br />
were used. Experiments were carried out on Agilent 6890 GC<br />
system and the analytes were identified by retention times.<br />
Results<br />
This paper reports PBDEs levels in freshwater fish.<br />
These were determined by gas chromatography with ECD.<br />
The identification of PBDEs in the fish samples was based<br />
on comparison of the retention times with those of the available<br />
authenticated standards. All results are summarized in<br />
Fig. 1. Chromatogram of carp-skin sample analysed by GC<br />
with electron captured detector in capillary column Db-17 MS
Chem. Listy, 102, s265–s1311 (2008) Environmental Chemistry & Technology<br />
Table II<br />
Concentrations of PBDE detected in carp skin and muscle<br />
[μg kg –1 ]<br />
Cong./ Skin Skin Muscle Muscle<br />
Carp Range Mean Range Mean<br />
BDE 3 21.2–26.3 24.8 14.6–17.0 15.2<br />
BDE 15 nd * – nd –<br />
BDE 28 nd – nd –<br />
BDE 47 66.7–188 118 54.5–78.2 66.4<br />
BDE 99 26.3–50.0 33.3 nd –<br />
BDE 100 49.8–136 98.2 37.9–55.1 46.3<br />
BDE 118 nd – nd –<br />
BDE 153 4<strong>2.</strong>5–77.1 5<strong>2.</strong>2 nd –<br />
BDE 154 37.1–98.6 69.3 28.6–34.1 30.5<br />
BDE 183 18.9–24.5 21.0 nd –<br />
* not detected<br />
Table III<br />
Concentrations of PBDE detected in crucian skin and muscle<br />
[μg kg –1 ]<br />
Cong./ Skin Skin Muscle Muscle<br />
Crucial Range Mean Range Mean<br />
BDE 3 69.6–175 – 81.3 81.3<br />
BDE 15 nd – nd –<br />
BDE 28 nd – nd –<br />
BDE 47 49.9–68.2 57.4 31.3 31.3<br />
BDE 99 nd – 16.5–27.9 24.4<br />
BDE 100 40.0–6<strong>2.</strong>3 57.8 nd –<br />
BDE 118 nd – nd –<br />
BDE 153 6<strong>2.</strong>2 6<strong>2.</strong>2 31.8–106 85.5<br />
BDE 154 23.6–25.1 24.7 nd –<br />
BDE 183 nd – nd –<br />
Tables II–IV. The levels of PBDEs in amur were bello tho<br />
limits of detection, therefore they were left out in the table<br />
summary. Fig. 1. shows representative chromatogram of carp<br />
skin sample analysed in capillary column DB-17 MS with<br />
50 % diphenyl- 50 % dimethylsiloxane stationary phase.<br />
The most abundant congeners determined in skin of<br />
investigated species were BDE 3, BDE 47, BDE 100 and<br />
BDE 153. Greater mean levels were observed in skin then<br />
muscle tissues.<br />
s379<br />
Table IV<br />
Concentrations of PBDE detected in bream skin and muscle<br />
[μg kg –1 ]<br />
Cong./ Skin Skin Muscle Muscle<br />
Bream Range Mean Range Mean<br />
BDE 3 4<strong>2.</strong>2–6<strong>2.</strong>2 48.3 26.0–31.5 29.8<br />
BDE 15 nd – nd –<br />
BDE 28 nd – nd –<br />
BDE 47 35.2 35.2 nd –<br />
BDE 99 nd – nd –<br />
BDE 100 19.8 19.8 13.2 13.2<br />
BDE 118 nd – nd –<br />
BDE 153 20.6–2<strong>2.</strong>8 21.7 18.6 18.6<br />
BDE 154 nd – nd –<br />
BDE 183 nd – nd –<br />
Polybrominated diphenyl ethers are very resistant to<br />
biodegradation and also show carcinogenic and mutagenic<br />
effects. Due to unavoidable emissions into the environment<br />
PBDEs have been found throughout the world both in abiotic<br />
(air, water, soil, sediment) and biotic (fish tissue, bird eggs,<br />
marine mammals) compartments. Into the future, will be very<br />
important and necessary monitoring these compounds in the<br />
environment and food chain especially.<br />
Financial support from Ministry of Education, Youth<br />
and Sports under MSM 6215712402 is greatly appreciated<br />
REFEREnCES<br />
1. Marsh G., Hu J., Jakobsson E., Rahm S.; Bbergman A.:<br />
Environ. Sci. Technol. 33, 3033 (1999).<br />
<strong>2.</strong> de Boer K., Boom J. P.: Polybrominated biphenyls and<br />
diphenyl ethers. The handbook of environmental chemistry<br />
3, new types of persistent halogenated compound,<br />
61–95, 2000.<br />
3. Kazda R., Hajšlová J., Poustka J., Čajka T.: Anal. Chim.<br />
Acta 520, 237 (2004)<br />
4. WHO/ICPS: Environmental health kriteria 162, Brominated<br />
diphenyl ethers, World health organization,<br />
Geneva, 1994.
Chem. Listy, 102, s265–s1311 (2008) Environmental Chemistry & Technology<br />
P23 ExAMINATION OF AbANDONED Sb<br />
DEPOSITS by MINERALOGICAL METhODS<br />
IN POPROČ (SLOVAKIA)<br />
MICHAL JAnKULáR a , TOMአKLIMKO b , ľUBOMíR<br />
JURKOVIČ a , BROnISLAVA LALInSKá b , PETER<br />
ŠOTTníK c , OTíLIA LInTnEROVá c and MICHAL<br />
ŠUTRIEPKA c<br />
Faculty of Natural Sciences Comenius University<br />
842 15 Bratislava, Slovak Republic,<br />
a Department of Geochemistry,<br />
b Department of Mineralogy and Petrology,<br />
c Department of Economic Geology,<br />
jankular@fns.uniba.sk<br />
Introduction<br />
The Poproč region has long been recognized as an<br />
important source of antimony in Europe. Mining began in<br />
the 17 th century and finished in 20 th century 1 . The abandoned<br />
Poproč Sb deposit is situated in the SE part of the Spišskogemerské<br />
Rudohorie Mts. (Slovakia). Geologically, the area<br />
consists of Paleozoic metamorphic rock complexes – graphitic<br />
and sericitic phyllites, metapsammites and metarhyolitic<br />
tuffs and granites. The Sb mineralization occurs as quartzcarbonate<br />
veinlets and impregnation in the host rocks. Antimony<br />
is the main ore mineral; others are pyrite, arsenopyrite,<br />
and various sulphides of Pb-Zn-Cu. The main non-metallic<br />
vein minerals are quartz, carbonates, tourmalines, albites,<br />
sericites, and chlorites. Extensive contamination related to<br />
the Sb deposit in Malé Karpaty Mts. was described previously<br />
2,3 . The study of arsenic and antimony bindings to ferrous<br />
ochres 4,5 , concentrations and distribution of As and Sb<br />
in oxidation rims of destabilized sulphides of impoundment<br />
sediment, and experimental investigation of geochemical<br />
barrier media were important. An investigation of biological<br />
and chemical oxidation was also conducted 6 . Rapid dissolution<br />
of Sb from impoundment sediment was studied at the<br />
nearby Dúbrava deposit 7 . Description of significant influence<br />
of long term mining activity and the potential effects of abandoned<br />
deposits on population health quality were described<br />
in the Zlatá Idka community (Spišsko-gemerské Rudohorie<br />
Mts.) 8 . Finally, a study of the Poproč area and its surroundings<br />
reported highly contaminated surface waters, soils, and<br />
stream sediments 9 . The As in soil samples exceeded class C<br />
standards of the Ministry of Agriculture of the Slovak Republic<br />
no. 531/1994-540 by 400 times, all stream sediment samples<br />
exceeded class C As and Sb limits, and concentrations of<br />
Sb were 100 times higher than sanitary regulatory limits for<br />
drinking water 10,11 .<br />
Experimental<br />
Samples were collected of geological materials and natural<br />
media (groundwater, surface waters, stream sediments,<br />
soils and ochres) and selected plant species (roots and shoots)<br />
in the field area shown in Fig. 1. Samples were preferentially<br />
collected in areas near potential local contamination sources<br />
s380<br />
(outflow from mines, tailings ponds and theirs surroundings,<br />
and mining wastes). Samples of soils, stream sediments,<br />
impoundment material, and plant tissues were dried and<br />
homogenized under laboratory conditions by standard procedure.<br />
Special techniques were needed to selectively dissolve<br />
the solid ochre samples from the Agnes and Filip adits outflow.<br />
Selective dissolution analysis is based on the different<br />
dissolution rates of various mineral phases and compounds12 .<br />
Based on the FeOX /FeDT ratio in analyzed ochre samples, it<br />
was possible to evaluate the relative crystallinity of the FeIII oxides and oxyhydroxides. Samples were dissolved by three<br />
different methods:<br />
• dissolution of Fe oxides and oxyhydroxides in hydrochloric<br />
acid<br />
• dissolution of Fe oxides and oxyhydroxides in dithionate-citronate-bicarbonate<br />
(DCB)<br />
•<br />
dissolution of Fe oxides and oxyhydroxides in ammonium<br />
acetate<br />
Samples of soils, sediments, waters, impoundment material,<br />
ochre, and plant tissues were analyzed in the geochemical<br />
laboratories of the State Geological Survey of the Slovak<br />
Republic. Selected chemical parameters (As, Sb, Zn, Cu, Pb,<br />
Fe, Al, Mn) were analyzed by atomic absorption spectrometry<br />
in the < 0.125 mm mesh size fraction.<br />
Results<br />
Chemical analyses of the various environmental media<br />
sampled confirm the previous field investigation findings that<br />
the area surrounding the abandoned Poproč Sb deposit is highly<br />
polluted.<br />
Results of selected chemical analysis data for soils are<br />
shown in Table I. The most important contaminants in the<br />
area are antimony and arsenic; their association is in accordance<br />
with the fact that the two elements are chemically similar<br />
13,14 . Their toxicology is also similar, and they are both<br />
carcinogenic 15,16 . Extremely high concentrations of Sb were<br />
recorded in the area surrounding the Agnes adit, with values<br />
ranging from 4,700 mg kg –1 to 10,000 mg kg –1 . The highest<br />
As level measured 56,900 mg kg –1 . These extreme Sb and As<br />
concentrations in soils near the Agnes adit are both a result of<br />
recent contamination. A 2 m thick layer of ochre precipitates<br />
was observed over a 200 m 2 area coming from the Agnes adit<br />
until the year 2004 when stable conditions were provided.<br />
The ochre precipitate, which potentially contained similarly<br />
high concentrations of toxic elements were in the past mechanically<br />
removed by water outflowing from the Agnes adit,<br />
discharging to the catchment of the Olšava River. Chemical<br />
analysis of ochre samples collected from the Agnes adit and<br />
dissolved in HCl show high content of As and Sb in ochre<br />
material (Table II); these toxic elements have long contaminated<br />
the surface water and stream sediments of the Olšava<br />
and Bodva Rivers.<br />
Antimony, analogous to arsenic, has an ability to bind<br />
to plant tissues and can be phytotoxic 17 . Considering the often-described<br />
mobility of these elements likely controlled by
Chem. Listy, 102, s265–s1311 (2008) Environmental Chemistry & Technology<br />
Fig. 1. Schematic map of investigated area<br />
Table I<br />
Selected chemical parameters of soil samples from surrounding<br />
of Sb deposit Poproč [mg kg –1 ]. Fe, Mn, Al, SO4<br />
expressed in %<br />
Adit Adit Adit Adit Im- Im<br />
Adit pound-<br />
Filip- Agnes Agnes Agnes pound-<br />
Filip<br />
subs OU OA1 OA2 ment ment<br />
(cover)<br />
As 72 298 11,060 26,380 56,900 1,898 2,800<br />
Sb 3,270 86,230 9,254 4,697 9,993 4,747 4,190<br />
Pb 274 1723 25 < 5 < 5 351 352<br />
Zn 122 352 135 1,655 3,272 71 60<br />
Cu 54 155 48 34 52 15 13<br />
Fe 4.23 4.29 17 30.8 35.6 0.92 5.67<br />
Mn 0.174 0.106 0.262 0.073 0.02 < 0.001 0.002<br />
Al 7.97 6.92 4.73 1.44 0.07 5.06 3.38<br />
SO 4 0.13 0.11 0.14 0.27 0.24 0.27 1.97<br />
Fe, Mn oxides and pH 18 , their biosorption into organisms or<br />
biovolatilization in organisms 19,20 is important. Plant tissues<br />
were sampled in the area of interest and high concentrations<br />
s381<br />
of As and Sb were detected in selected plant species. near<br />
the Agnes adit, the maximum As and Sb values of plant tissue<br />
were, respectively, 45.8 mg kg –1 and 1.9 mg kg –1 (dry<br />
weight).<br />
Table II<br />
Ochre samples chemical analyses (mg.kg-1)<br />
Chemical Spring 300 m nW Adit<br />
parameter from adit Agnes Agnes<br />
Fe 106,000 336,000<br />
As 8,600 34,000<br />
Sb 5,200 6,100<br />
Pb 104 97<br />
Zn 160 831<br />
Cu 44 0<br />
Mn 1,580 210<br />
Hg 0.4 1<br />
Cd 0 12<br />
na 8,540 1,360<br />
K 1,720 420<br />
Ca 10,600 2,460<br />
Mg 6,070 830<br />
Al 7,660 2,560<br />
S 23,300 5,950<br />
Conclusions<br />
The results of preliminary mineralogical and geochemical<br />
sampling near the abandoned Poproč Sb deposit reveal<br />
significant contamination of the surrounding environment.<br />
The most important toxic elements in the study area are As<br />
and Sb. High concentration levels measured in adit estuaries<br />
could be caused by inadequate mine closure/rehabilitation.<br />
Deposition of highly contaminated ochre precipitates near the<br />
Agnes adit and outflow are indicative of contaminated mine<br />
waters; inadequate recultivation has caused ochre precipitates<br />
(containing As and Sb) to be resuspended and to flow into the<br />
Olšava river catchment. The next step should be research into<br />
geochemical and mineralogical mobility and the bioavailability<br />
of the main contaminants in the environmental media.<br />
This work has been supported by the Slovak Research<br />
and Development Agency under contract No. APVV-0268-<br />
06.<br />
REFEREnCES<br />
1. Chovan M., Háber M., Jeleň S., Rojkovič I.: Ore textures<br />
in the Western Carpathians. Slovak Academic Press,<br />
Bratislava 1994.<br />
<strong>2.</strong> Miner. Slov. 35, 131 (2003). (in Slovak)<br />
3. Ministry of Education of the Slovak Republic: Risk contamination<br />
assessment of surroundings of Sb, Au and<br />
sulphide deposit in Pezinok and proposition for remediation:<br />
toxicity of As and Sb, acidification, AV/901/2002<br />
(VTP25) (2006 ME SR). (in Slovak)
Chem. Listy, 102, s265–s1311 (2008) Environmental Chemistry & Technology<br />
4. Slov. Geol. Mag. 5, 179 (1999).<br />
5. Geochim. Cosmochim. Acta 71, 4206 (2007).<br />
6. Andráš P., Milovská S., Kušnierová M., Adam M., Šlesarová<br />
A., Chovan M., Hajdušková ľ., Lalinská B.: 7th<br />
International Symposium on Environmental Geotechnology<br />
and Global Sustainable Development: Environmental<br />
hazards at the Sb-Au-S deposit Pezinok (Slovakia)<br />
in relation to the chemical and biological-chemical<br />
oxidation processes, Helsinki, 8. – 10. June 2004, p. 10<br />
7. Slov. Geol. Mag. 6, 61 (2000).<br />
8. Env. Geol. 51, 387 (2007).<br />
9. Ministry of Environment of the Slovak Republic: Poproč<br />
– tailings piles, ore dumps, impoundments, search<br />
investigation, state by April 1996, (1996 ME SR). (in<br />
Slovak)<br />
10. Ministry of Agriculture of the Slovak Republic: Maximum<br />
permissible values of harmful pollutants in soil and<br />
definition of qualified organizations to determine real<br />
values of these pollutants, no. 531/1994-540 (MA SR<br />
1994). (in Slovak)<br />
s382<br />
11. Government Directive of the Slovak Republic: Demands<br />
on water assigned to human usage and quality control<br />
assigned to human use, no. 354/2006 (2006). (in Slovak)<br />
1<strong>2.</strong> Geochim. Cosmochim. Acta 45, 421 (1981).<br />
13. WHO: Guidelines for Drinking Water Quality: Health<br />
Criteria and Other Supporting Information, (WHO<br />
1996).<br />
14. Earth-Science Rev. 59, 125 (2002).<br />
15. Water Res. 34, 4304 (2000).<br />
16. J. Clean. Prod. 13, 19 (2005).<br />
17. Ann. Rev. Plant Physiol. 29, 511 (1978).<br />
18. J. Hydrol. Hydromech. 55, 223 (2007).<br />
19. Environ. Pollut. 124, 93 (2003).<br />
20. Environ. Sci. and Pollut. Res. 14, 31 (2007).
Chem. Listy, 102, s265–s1311 (2008) Environmental Chemistry & Technology<br />
P24 DETERMINATION OF VOLATILE<br />
COMPOuNDS AND SACChARIDES AT ALDER<br />
wOOD hyDROLySIS<br />
FRAnTIŠEK KAČíK a , MARTA LAUROVá a and<br />
DAnICA KAČíKOVá b<br />
a Department of Chemistry and Chemical Technologies,<br />
b Department of Fire Protection,<br />
Faculty of Wood Sciences and Technology, Technical University<br />
in Zvolen, T. G. Masaryka 24, 960 53 Zvolen, Slovak<br />
Republic,<br />
kacik@vsld.tuzvo.sk<br />
Introduction<br />
A pretreatment of lignocellulosic biomass at the production<br />
of pulp, ethanol and other technically important chemicals,<br />
is a subject of research for a long time. The pretreatment<br />
main goal is to remove lignin and hemicelluloses, to decrease<br />
celullose crystallinity and to increase porosity of the lignocellulosic<br />
material. The various physical, physico-chemical an<br />
biological processes of pretreatment are used for this purpose<br />
at present 1,2 .<br />
One method is a high-pressure water prehydrolysis. It is<br />
realized at a wide range of temperatures (160–260 °C), but in<br />
the short time intervals (0.42–7 min) in dependence on wood<br />
species 3 .<br />
The hydrothermal pretreatments of lignocellulosic materials<br />
have got a different effect on their main components.<br />
Extractives, hemicelluloses and watersoluble lignin are released<br />
from wood in the temperature range 150–230 °C. The<br />
cellulose fraction depolymerises at the higher temperatures<br />
(210–280 °C) 3,4 .<br />
At wood hydrolysis also other compounds arise except<br />
saccharides. They can be processed (methanol, acetic acid,<br />
propionic acid, 2-furaldehyde), resp. their negative environmental<br />
influence must be solved 5 . Their concentration in the<br />
hydrolysates depends on wood species and the hydrolysis<br />
conditions, mainly on the temperature and the time of the<br />
treatment.<br />
The water prehydrolysis of biomass (by saturated water<br />
steam and hot high-pressure water) can be considered as a<br />
environmentally friendly technology, where it is not necessary<br />
to add any chemicals 6 .<br />
This paper aim was to research the release of saccharidic<br />
part and volatile compounds from alder wood (Alnus glutinosa<br />
(L.) GAERTn.) during the water hydrolysis.<br />
Experimental<br />
M a t e r i a l<br />
wood samples preparation<br />
The samples from the trunk wood of 59 years old alder<br />
(Alnus glutinosa (L.) GAERTn.) were chipped to the dimensions<br />
2 × 2 × 10 mm.<br />
s383<br />
wood analyses<br />
The amount of extractives soluble in the mixture toluene-ethanol<br />
(1 : 2) was determined in accordance with ASTM<br />
Standard D 1107-96 7 , the amount of cellulose by Seifert<br />
method 8 and the amount of holocelluse by Wise method 9 .<br />
Lignin amount was determined in accordance with ASTM<br />
Standard D 1106-96 10 .<br />
H y d r o l y s i s<br />
Wood chips (2 g) were put into the stainless autoclaves<br />
with internal volume 12 cm 3 and they were refilled by distilled<br />
water. The solid/liquor ratio was 1 : 4.<br />
The prehydrolysis was performed in the thermostate at<br />
the temperatures 160, 180 and 200 °C. The time of treatment<br />
was 30, 60, 120 and 240 min. Then the autoclave was cooled<br />
into the temperature 20 °C and the hydrolysate was filtrated.<br />
H y d r o l y s a t e s A n a l y s e s<br />
ph value<br />
Hydrolysates pH values were determined by the potenciometric<br />
method with pH meter inoLab pH 720 (WTW<br />
GmbH).<br />
Saccharides<br />
Saccharides amount in the hydrolysates was determined<br />
in the form of aldonitrilacetates by GC method 11 at the<br />
following conditions: column – 5 % PEGA Chromaton n-<br />
AW-DMCS (0.16–0.2 mm) 240 cm × 0.35 cm, column temperature<br />
– 200 °C, injector temperature – 260 °C, detector<br />
temperature – 250 °C, detector – FID, carrier gas – n 2 .<br />
Volatile compounds<br />
The volatile compounds in the hydrolysates (methanol,<br />
acetic acid, propionic acid, 2-furaldehyde) were determined<br />
by the method of GC 12 at the following conditions: column<br />
– Chromosorb 102 (80–100 mesh) 120 cm × 0.35 cm, column<br />
temperature – 195 °C, injector temperature – 250 °C, detector<br />
temperature – 250 °C, detector – FID, carrier gas – n 2 .<br />
Results<br />
During the hydrothermal treatment of wood, various<br />
acid compounds are released. It is confirmed by the measured<br />
values of pH (Table I). The increase of the hydrolysates<br />
acidity causes next degradation of wood matter and the glycosidic<br />
bonds in the polysaccharides are cleavaged.<br />
The hydrolysates acidity is due to the formation of socalled<br />
nascent organic acids (formic, acetic, propionic e.g.),<br />
which are formed by the cleavage of some functional groups<br />
from the polysaccharides and also by the decomposition of<br />
arised monosaccharides. These acids have got an important<br />
influence on the next course of the hydrolysis, therefore they<br />
catalyse the glycosidic bond cleavage in the polysaccharides<br />
13,14 .<br />
The used alder wood contained 84.06 % of holocellulose,<br />
41.26 % of cellulose, 21.45 % of lignin and 4.97 % of<br />
extractives.
Chem. Listy, 102, s265–s1311 (2008) Environmental Chemistry & Technology<br />
Table I<br />
Hydrolysates pH value<br />
Temperature [°C] Time [min] pH<br />
160 30 4.14<br />
160 60 3.46<br />
160 120 3.29<br />
160 240 3.18<br />
180 30 3.61<br />
180 60 3.18<br />
180 120 3.03<br />
180 240 3.09<br />
200 30 3.17<br />
200 60 <strong>2.</strong>95<br />
200 120 <strong>2.</strong>92<br />
200 240 <strong>2.</strong>97<br />
Table II<br />
Yield of monosaccharides in hydrolysates<br />
Temperature [°C] Time [min] Monosaccharides [g dm–3 ]<br />
160 30 1.56<br />
160 60 <strong>2.</strong>84<br />
160 120 4.46<br />
160 240 9.12<br />
180 30 <strong>2.</strong>46<br />
180 60 14.40<br />
180 120 7.96<br />
180 240 3.15<br />
200 30 3.05<br />
200 60 4.71<br />
200 120 <strong>2.</strong>23<br />
200 240 1.92<br />
At the temperature 160 °C the monosaccharides amount<br />
in the hydrolysates increased during the total time range<br />
(Table II). At the higher temperatures the maximum yield of<br />
monosaccharides was determined during 60 min of the hydrolysis.<br />
It is in accordance with 2-furaldehyde amount increase<br />
in the hydrolysate (Table IV). The highest concentration<br />
of monosaccharides was observed at the temperature 180 °C<br />
and the time of the hydrolysis 60 min.<br />
The similar trend we can see at the determination of total<br />
saccharides amount (Table III) determined after the hydrolysis<br />
by 3 % sulfuric acid. At the biggest yields of the saccharides<br />
(180 °C, 60 min) approximately one half of the saccharides<br />
amount is present in the form of monosaccharides and second<br />
half in the form of oligosaccharides and polysaccharides.<br />
In the hydrolysates there are various volatile compounds.<br />
Their amounts increase in dependence on the temperature and<br />
the time of treatment in most cases (Table IV).<br />
Methanol, arising mainly by the methoxyl group cleavage,<br />
is extreme toxic. In some cases it is necessary to remove<br />
it before the next treatment of the hydrolysate. In hardwoods<br />
there are 3–5 % of acetyl groups (CH 3 CO-), they give rise<br />
s384<br />
Table III<br />
Yield of total saccharides in hydrolysates<br />
Temperature Time Total saccharides<br />
[°C] [min] [g dm –3 ]<br />
160 30 <strong>2.</strong>43<br />
160 60 3.35<br />
160 120 15.06<br />
160 240 14.06<br />
180 30 3.83<br />
180 60 30.48<br />
180 120 1<strong>2.</strong>36<br />
180 240 3.29<br />
200 30 14.97<br />
200 60 6.40<br />
200 120 3.57<br />
200 240 1.23<br />
Table IV<br />
Yield of volatile compounds in hydrolysates<br />
Temp- Acetic Propionic 2-Furerature<br />
Time Methanol acid acid aldehyde<br />
[min] [g dm<br />
[°C]<br />
–3 ]<br />
[g dm –3 ] [g dm –3 ] [g dm –3 ]<br />
160 30 0.11 0.28 0.10 0.02<br />
160 60 0.31 1.35 0.53 0.14<br />
160 120 0.63 4.46 1.17 0.63<br />
160 240 0.54 5.77 0.94 1.64<br />
180 30 0.18 0.67 0.18 0.05<br />
180 60 0.47 5.35 0.92 0.89<br />
180 120 0.82 7.73 0.74 7.24<br />
180 240 0.84 7.52 0.65 9.23<br />
200 30 0.29 3.41 0.61 0.46<br />
200 60 0.40 7.72 0.59 6.43<br />
200 120 0.97 10.03 0.66 8.17<br />
200 240 1.13 <strong>2.</strong>95 0.82 5.12<br />
acetic acid at the hydrolysis. The acetic acid amount increases<br />
mainly at the first 120 min of the hydrolysis, then their<br />
increase is retarded. It corresponds with the results of birch<br />
wood hydrolysis, where the increase of acetic acid amount<br />
was slowed or decreased in the hydrolysis at the temperature<br />
200 °C 15,16 .<br />
2-Furaldehyde arises by pentose dehydratation and it<br />
can be isolated as a valuable product under certain conditions.<br />
The temperature of 180 °C causes the heavy increase<br />
of 2-furaldehyde, its concentration increases due to the condensation<br />
reactions at the temperature 200 °C.<br />
Conclusions<br />
From the experimental results obtained at the hydrolysis<br />
of alder wood can be concluded that at the mild conditions<br />
of hydrolysis the acetic acid and 2-furaldehyde concentration<br />
increases due to the saccharides deacetylation and dehydration,<br />
respectively. The amount of 2-furaldehyde decrease is
Chem. Listy, 102, s265–s1311 (2008) Environmental Chemistry & Technology<br />
due to its participation in the condensation reactions at the<br />
temperature 200 °C.<br />
The maximum of both monosaccharides and total saccharides<br />
contents were found at the temperature 180 °C and<br />
the time 60 min of the treatment.<br />
This work has been supported by the Slovak Reaserch<br />
and Development Agency under the contract No. APVV-<br />
0282-06 and by the Slovak Scientific Grant Agency under the<br />
contract No. VEGA 1/0385/08.<br />
REFEREnCES<br />
1. Sun Y., Cheng J.: Bioresour. Technol. 83, 1 (2002).<br />
<strong>2.</strong> Mosier n., Wyman Ch., Dale B., Elander R., Lee Y.Y.,<br />
Holtzapple M., Ladish M.: Bioresour. Technol. 96, 673<br />
(2005).<br />
3. Garrote G., Domínguez H., Parajó J. C.: Holz Roh<br />
Werkst 57, 191 (1999).<br />
4. Sasaki M., Adschiri T., Arai K.: Bioresour. Technol. 86,<br />
301 (2002).<br />
5. Horbaj P.: Energia 3, 52 (2001).<br />
6. Garrote G., Domínguez H., Parajó J. C.: J Chem Tech<br />
Biotechnol. 74, 1101 (1999).<br />
s385<br />
7. ASTM Standard D 1107-96: Standard test method for<br />
ethanol toluene solubility of wood (1998).<br />
8. Seifert V. K.: Das Papier 1960, 104.<br />
9. Wise L. E., Murphy M., D’Addieco A. A.: Paper Trade<br />
J. 122, 35 (1946).<br />
10. ASTM Standard D 1106-96: Standard test method for<br />
acid insoluble lignin in wood (1998).<br />
11. Kačík F., Solár R. : Analytická chémia dreva. Technická<br />
univerzita vo Zvolene, Zvolen 2000.<br />
1<strong>2.</strong> Kačík F.: Tvorba a chemické zloženie hydrolyzátov v<br />
systéme drevo-voda-teplo. Technická univerzita vo Zvolene,<br />
Zvolen 2001.<br />
13. Conner A. H., Lorenz L. F.: Wood Fiber Sci. 18, 248<br />
(1986).<br />
14. Garotte G., Domínguez H., Parajó J. C.: Holz Roh<br />
Werkst 59, 53 (2001).<br />
15. Sundqvist B., Karlsson O., Westenmark U.: Wood Sci.<br />
Technol. 40, 549 (2006).<br />
16. Kačík F., Výbohová E., Kačíková D.: Acta Facultatis<br />
Xylologiae 49, 39 (2007).
Chem. Listy, 102, s265–s1311 (2008) Environmental Chemistry & Technology<br />
P26 MODELING OF DISPERSION OF wINDbORNE<br />
MATERIAL IN ATMOSPhERE<br />
MICHAL KAPOUn a , RADIM DVOřáK b , FRAnTIŠEK<br />
ZBOřIL b and IVAn MAŠEK a<br />
Brno University of Technology,<br />
a Faculty of Chemistry,<br />
b Faculty of Information Technology,<br />
kapoun@fch.vutbr.cz<br />
Introduction<br />
Air pollution modeling is an attempt to describe the<br />
functional relation between emissions and occurring concentrations<br />
and deposition. Air pollution measurements present<br />
these occurring concentrations and deposition, but they can<br />
only give a snapshot at specific locations and times. In principle,<br />
the air pollution modeling can give a more complete and<br />
consistent description, including an analysis of the causesthe<br />
emissions sources-which have led to these concentrations/deposition.<br />
Air pollution models play an important role in science,<br />
because of their capability to investigate the importance of the<br />
relevant processes, and they play a major role in application<br />
(e.g. fire brigade intervention during chemical accidents) 1 .<br />
The atmospheric dispersion modeling, where the air pollution<br />
modeling belongs to, has a long history and it dates<br />
back to the end of 19th century, when Reynolds in 1895(ref. 2 )<br />
formulated criterion for the change from laminar to turbulent<br />
flow, in other words the diffusion, in pipes. During the next<br />
few decades, the huge progress was done in the describing of<br />
mathematical formulas and their correspondences to observations.<br />
These formulas were evaluated in analytical way<br />
and they were restricted to simple cases where the solution<br />
could be found. nowadays, the trend of atmospheric dispersion<br />
evolution is based on the numerical solution of diffusion<br />
equation.<br />
The diffusion equation is expressed in a form of partial<br />
differential equation (PDE). The solution of the equation can<br />
be derived by analytical process that is often very difficult<br />
to find. There exist many cases of PDE where the analytical<br />
solution to the PDE does not even exist. Thus, many kinds of<br />
numerical methods have been developed and they have been<br />
used next to the analytical ones. However, the problem exists<br />
in this kind of evaluation and it is the arising of numerical error.<br />
The only ways to check the accuracy is either to compare<br />
the results with the exact analytical solution or to compare it<br />
with the observation.<br />
In our work we have used the first case thus the form<br />
of diffusion equation had to be simplified so as its analytical<br />
solution can be calculated. The reason originates from the<br />
fact that it is not possible to find the exact analytical solutions<br />
in the majority of cases where the solutions are looked for 2 .<br />
s386<br />
Mathematical Models<br />
The general form of the diffusion equation describing<br />
atmospheric dispersion can be expressed as follows 1 :<br />
∂ C <br />
+ ∇ Cu = ∇( D∇<br />
C)<br />
+<br />
∂t<br />
+ chemistry + emmisions +<br />
+ dry _ deposition +<br />
+ wet _ deposition<br />
where C is a pollution concentration, u is a wind velocity,<br />
D are diffusion coefficients (their coordinate axes are D x ,<br />
D y and D z , respectively).<br />
The chemistry term presents atmospheric chemistry<br />
term that is used for the determination of a chemical substance<br />
influence to the atmosphere and to the dispersion process<br />
itself. The emissions term expresses the rate of the emissions<br />
in the atmosphere and its relation to the atmospheric<br />
dispersion of the specific pollutant. The last two terms, dry<br />
and wet depositions, are the major sink terms in the model<br />
and besides they determine the pollutant behavior above the<br />
terrain surface.<br />
In our case, we have used the advection-diffusion equation<br />
(A-DE) which is a part of equation (1) and where the<br />
terms chemistry, emissions and wet deposition are neglected.<br />
The reasons for this choice were that the chemistry and emissions<br />
terms are complex to find the analytical solution for<br />
them. The wet deposition plays an important role for watersoluble<br />
species only and it is not our primary concerns at this<br />
moment.<br />
Full form of A-DE can be expressed as follows:<br />
∂C <br />
∂C<br />
= −∇ Cu + ∇( D∇<br />
C) + W<br />
∂t ∂z<br />
where C, u and D symbols have the same meanings as<br />
in equation (1). W is a pollutant gravitational settling velocity.<br />
Equation (2) can be furthermore simplified if we apply<br />
following assumptions. When the wind speed value is sufficiently<br />
large, a diffusive transport is negligible in wind<br />
direction with respect to advection (Ermak 3 ). Moreover, the<br />
coefficients D y , and D z , depend on the downwind distance<br />
x only and they are therefore independent on the crosswind<br />
distance y and height distance z. From these facts, the diffusive<br />
terms can be simplified - the brackets are not needed<br />
anymore and the second derivatives appear. Last assumption<br />
is the stationary source with constant strength during time.<br />
Thus, the result of our simplification is a steady state form of<br />
equation (2):<br />
(1)<br />
(2)
Chem. Listy, 102, s265–s1311 (2008) Environmental Chemistry & Technology<br />
2<br />
∂C<br />
∂ C<br />
ux = Dy<br />
2 z<br />
∂x<br />
∂y<br />
( x)<br />
+ D ( x)<br />
2<br />
∂ C ∂C<br />
+ W 2<br />
∂z<br />
∂z<br />
Here u x is a wind speed in the x direction; all other variables<br />
are the same as in equation (2).<br />
To be completed, the PDE (3) needs to have specified<br />
boundary conditions. The first condition follows from an assumption<br />
of continuous point source with constant strength<br />
located in (0,0,h) coordinates:<br />
The next two conditions follow from the natural assumption<br />
that pollutant concentration approaches zero far from the<br />
source in the lateral y directions and high above the source:<br />
( )<br />
(3)<br />
C x, +∞ , z = 0 .<br />
(3b)<br />
( )<br />
C x, −∞ , z = 0 .<br />
(3c)<br />
C( x, y , +∞ ) = 0 .<br />
(3d)<br />
The last boundary condition is that pollutant deposition<br />
onto the ground occurs at a rate proportional to local air<br />
concentration 3 (for simplicity, the flat ground is taken into<br />
account only):<br />
⎡ ∂C<br />
⎤<br />
⎢<br />
D W C<br />
⎥<br />
vC<br />
⎣ ⎦<br />
( ∞ ) + = [ ] = 0<br />
z z<br />
∂z<br />
z=<br />
0<br />
.<br />
(3a)<br />
(3e)<br />
The deposition velocity v depends on many factors such<br />
as type and size of pollutant particles, the roughness of terrain<br />
and its other surface properties and the meteorological<br />
conditions.<br />
A n a l y t i c a l m o d e l<br />
The analytical solution of equation (3) with respect to<br />
boundary conditions (3a-e) is derived in (refs. 3,5,6 ), and it is<br />
done by expression (4):<br />
(4)<br />
s387<br />
The standard deviations of plume width and height, σ y<br />
and σ z , are defined in terms of their respective diffusion coefficients<br />
3,6 :<br />
The error function erfc (ξ) is defined in (ref. 4 ) as:<br />
n u m e r i c a l M o d e l<br />
In our model we have decided to use the well know<br />
method of lines, which was frequently used for solving different<br />
kinds of PDEs by classical analog and hybrid computers.<br />
In order to perform this method the given PDE (3) must be<br />
transformed into the system of ordinary differential equations<br />
(ODEs). To do that the discretization of all variables except<br />
one must be done. In our case we have discretized y (points<br />
j, step Δy) and z (points k, step Δz) variables and we have<br />
let the x variable continuous (because of the assumed wind<br />
direction).<br />
The obtained system of ODEs is as follows:<br />
( , , )<br />
dC x j k<br />
∂x<br />
=<br />
( ) ( , + 1, ) − 2 ( , , ) + ( , −1,<br />
)<br />
Dy x C x j k C x j k C x j k<br />
⋅ +<br />
u y<br />
2<br />
x<br />
∆<br />
( ) ( , , + 1) − 2 ( , , ) + ( , , −1)<br />
D x C x j k C x j k C x j k<br />
+<br />
z<br />
⋅ +<br />
u z<br />
2<br />
x<br />
∆<br />
( , , + 1 ) − ( , , −1)<br />
.<br />
W C x j k C x j k<br />
+ ⋅<br />
ux 2∆z<br />
The system of ODEs (6) is solved inside the <br />
interval along the y direction, and inside the along the<br />
z direction, where N j and N k are natural numbers. Thus the<br />
total number of ODEs is (2N j + 1) × (N k + 1) and all equations<br />
can be solved for current time point in parallel.<br />
The boundary condition (3a) is transformed to new initial<br />
conditions (7a):<br />
C<br />
C<br />
( 0,<br />
0,<br />
H )<br />
Q<br />
=<br />
u ∆y∆z<br />
x<br />
( 0,<br />
j,<br />
k)<br />
= 0 otherwise .<br />
(7)<br />
(7a)<br />
And new boundary conditions (7b–e) for the ODEs system<br />
(7) with respect to (3b–e) are:<br />
(5)<br />
(6)
Chem. Listy, 102, s265–s1311 (2008) Environmental Chemistry & Technology<br />
( x,<br />
+ N , k)<br />
= 0.<br />
C j<br />
( x,<br />
−N , k)<br />
= 0.<br />
C j<br />
C<br />
( x,<br />
j,<br />
N ) = 0.<br />
+ k<br />
( ∞)<br />
Dz<br />
C(<br />
x,<br />
j,<br />
0)<br />
=<br />
C(<br />
x,<br />
j,<br />
2)<br />
.<br />
2∆z(<br />
v −W<br />
) + D<br />
z<br />
( ∞)<br />
(7b)<br />
(7c)<br />
(7d)<br />
(7e)<br />
For integration of the system of ODEs (7) the 4 th order<br />
Runge-Kutta method was chosen. It has sufficient accuracy<br />
as is shown in the next chapter.<br />
Results<br />
As was mentioned above equation (3) supposes one point<br />
source that has constant strength. It means that the amount of<br />
pollutant is constant during time. The wind flows along x axis<br />
with constant speed and the ground is flat everywhere. In our<br />
experiments, all diffusion coefficients were constant in every<br />
space points during time, for simplicity.<br />
now everything is defined to solve our model of<br />
PDE (3) with boundary conditions (3a–e). The experiment<br />
has been done with following coefficient setting. The diffusion<br />
coefficients has been set like that: D y = 0.23 m 2 s –1 ,<br />
D z = 0.23 m 2 s –1 which is the parameter of ammonia, other<br />
coefficients has been: v = 2 m s –1 , W = 3 m s –1 , u x = 2 m s –1 ,<br />
Q = 0.1 kg s –1 and H = 1.5 m.<br />
The space discretization has been chosen as follows:<br />
N i = 600, N j = 50, N k = 50, Δx = 0.005 m, Δy = 0.05 m and<br />
Δz = 0.05 m. In this case the assumed space 3 m × <strong>2.</strong>5 m × <strong>2.</strong>5 m<br />
has been discretized into 1,500,000 points in which the equations<br />
have been calculated.<br />
V i s u a l i z a t i o n<br />
We made simple program/tool for solving given A-DE<br />
and for the visualization of the results with possibility of<br />
comparison the analytical and the obtained numerical soluti-<br />
Fig. 1. xy plane cut in zero depth, which means that the ground<br />
pollutant dispersion is shown. The wind flows from left to right<br />
s388<br />
ons. The program has possibility to make the cuts through the<br />
perpendicular grid in XY, XZ and YZ planes in any depth and<br />
the appropriate grid points can be plotted.<br />
Fig. 1. and Fig. <strong>2.</strong> show the XY and XZ cuts for our<br />
above-defined experiment. The level of gray (the lighter the<br />
more concentrated) expresses the amount of concentration of<br />
pollutant at each point - the most concentrated means approximately<br />
0.5% of source concentration.<br />
Fig. <strong>2.</strong> xZ plane cut in depth of 25 of overall depth 50 which<br />
means that the cut in depth of point source is shown. The wind<br />
flows from left to right<br />
Scales of axes (x is horizontal, y is vertical) in figures<br />
above are these:<br />
• Fig. 1.: x axis: m, y axis: m<br />
• Fig. <strong>2.</strong>: x axis: m, y axis: m<br />
The three-dimension (3D) visualization is another way<br />
to represent the calculated data in space. It has many advantages<br />
and gives to the user tool for fast investigation of the<br />
result. Many methods of gas or fluid visualization were developed<br />
however not all are suitable for our purpose. We can<br />
mention the stream ribbons, stream surfaces, particle traces,<br />
vector fields etc. 7 .<br />
Fig. 3. 3D visualization of pollutant dispersion in the atmosphere.<br />
The white color points show the highest concentration of<br />
pollutant, the black color points show its low concentration
Chem. Listy, 102, s265–s1311 (2008) Environmental Chemistry & Technology<br />
In our case, we have inspired in particle visualization<br />
of pollutant concentration. After many experiments of different<br />
ways of visualization, we conclude to the one showed in<br />
Fig. 3. The concentration is expressed by two basic methods<br />
– by color and by particle count. The level of the top concentration<br />
can be adjusted – in Fig. 3. the white means approximately<br />
1 % of source concentration, thus the user can see that<br />
this level of concentration will occurs in the presented scenario<br />
on the ground too. For the better perception of depth, the<br />
further particles are darkened, they do not interfere with the<br />
foreground particles.<br />
A c c u r a c y<br />
The problem of numerical calculation is the stability of<br />
the system and the accuracy of the calculation. Both depend<br />
especially on the size of calculation steps. In our case, when<br />
we have transformed the PDE (3) into the system of ODEs (7),<br />
three calculation steps exist.<br />
The first step Δx is a step along x axis and it is used as<br />
integration step in described experiment. Thus, its size primarily<br />
influences the accuracy of obtained results.<br />
Last two steps Δy and Δz discretize y and z variables and<br />
they have impact on the size of ODEs system (7). These steps<br />
subdivide the space in lateral directions and both are used<br />
for approximation of the second derivatives appearing in<br />
PDE (3). Therefore, they influence both the stability and the<br />
accuracy and they thus indirectly affect the size of Δx.<br />
Fig. 4. The absolute error of the numerical calculation. The<br />
vertical axis shows the error, the horizontal axis shows the distance<br />
from source along x axis (in wind direction)<br />
In case of our numerical solution of A-DE there exist<br />
specific properties of the calculation behavior, as you can<br />
see from our error measurement shown in Fig. 4., where the<br />
absolute error is shown. The error evolution is shown along<br />
the wind direction. More specifically the error is the mean<br />
error in all points (one plane) of the specific x distance.<br />
s389<br />
The greatest error along x axis has been measured close<br />
to the source, which is caused by definition of the initial condition<br />
(7a). Fig. 4. shows other peak of error which is around<br />
0.7 m distance from the source. That is the place where the<br />
plume reaches the ground. The boundary condition (7e) which<br />
is the approximation of boundary condition (3e) is the main<br />
reason of this error existence. It must be noted that the numerical<br />
calculations were stable in spite of measured errors.<br />
Conclusion<br />
The numerical method of A-DE solution has been proposed<br />
and implemented and the results have been presented.<br />
In addition, the accuracy of our model has been verified by<br />
comparison with the analytical solution.<br />
Presented method is relatively simple and easy to implement,<br />
therefore, it can be relatively easy extend to more<br />
general form of the A-DE which will be the main goal of the<br />
future project progress. The extensions could be the general<br />
wind direction and speed, the non-flat ground with obstacles<br />
(trees, buildings etc.), non-stationary point source/sources<br />
etc. Moreover, other atmospheric parameters such as temperature<br />
and humidity and substance chemical properties will<br />
be added to the model for even more physically and chemically<br />
correct behavior.<br />
This preliminary work will be served as a base for more<br />
sophisticated model that will be a part of the intelligent system<br />
for human protection against consequences of industrial<br />
accidents and its analysis. To do that many experiments and<br />
measurements of real substance outflows, gas dispersion etc.<br />
will have to be done.<br />
REFEREnCES<br />
1. Builtjes P. J. H.: Air Pollution Modeling and Its Application<br />
XIV (Gryning S.E., Schiermeier F.A., ed,), p. 3,<br />
Major Twentieth Century Milestones in Air Pollution<br />
Modelling and Its Application, Springer US, 2004.<br />
<strong>2.</strong> Reynolds O.: Philos. Trans. R. Soc. London, Ser. A ,<br />
1895, 123.<br />
3. Ermak D. L.: Atmos. Environ. 11, 231 (1977).<br />
4. Jacobson M. Z.: Fundamentals of Atmospheric Modeling.<br />
Cambridge University Press, new York 2005.<br />
5. Slanco P., Bobro M., Hanculak J., Geldova E.: Acta<br />
Montanistica Slovaca,, 313 (2000).<br />
6. Roussel G., Delmaire G., Ternisien E., Lherbier R.:<br />
Environmental Modelling & Software 15, 653 (2000).<br />
7. Pagendarm H. G.: Visualization and Intelligent Design<br />
in Engineering and Architecture, p. 315, Scientific Visualization<br />
in computational fluid dynamics, Computational<br />
Mechanics Publications, 1993.
Chem. Listy, 102, s265–s1311 (2008) Environmental Chemistry & Technology<br />
P27 REPROCESSING OF DANGEROuS PuT-OuT<br />
ChEMICALS AND wASTES<br />
JURAJ KIZLInK<br />
Faculty of Chemistry, Brno University of Technology, Purkyňova<br />
118, 612 00 Brno,<br />
kizlink@fch.vutbr.cz<br />
Introduction<br />
The possibilities of reprocessing of some dangerous put-<br />
out chemicals and wastes are described. The usual way for<br />
the disposal of these compounds and wastes is the effective<br />
combustion in the suitable incinerator. However, this facility<br />
must be equipped with effective furnace, vigorous supplier<br />
for air-oxygen, hold-up of waste gases for at least six seconds<br />
and also with effective cleaning of emissions 1–4 . Procedure is<br />
relatively simple, however too expensive. Some of these chemicals<br />
and wastes can be disposed by total decomposition by<br />
means of strong reactive chemical agents 5–10 . We suggested<br />
and also elaborated the chemical reprocessing of these chemicals<br />
or their wastes into some non-toxic chemicals, suitable<br />
for technical praxis.<br />
Proposed Procedures<br />
B e n z i d i n e ( 4 , 4 ’ - d i a m i n o d i p h e n y l )<br />
( 9 2 - 8 7 - 5 )<br />
Benzidine as dangerous proved chemical cancerogen is<br />
already put out from chemical praxis and usually its diposal is<br />
due to combustion in suitable mixtures of more combustible<br />
materials 1–4 . This compoun is possible to change by reprocessing<br />
into aromatic etherical compound. The base of this<br />
reprocessing is diazotation of benzidine (base, hydrochlorine,<br />
sulfate) in the methanolic solution by dry hydrochlorine and<br />
then with addition of concentrated water solution or finelly<br />
powdered alkaline nitrite in the ice bath. When diazotization<br />
is over, another methanol is added and the reaction<br />
mixture is very slowly heated (simmered) in the large flask<br />
under reflux water-cooled condenser. The diazonium salt is<br />
slowly decomposed, the nitrogen gas escape and in the methanol<br />
solution after heating up to boiling is converted into<br />
the 4,4’-dimethoxydiphenyl compound (fragrance). nOTE:<br />
The volume in the flask must be at least twice larger than<br />
volume of reaction mixture because the escape of nitrogen<br />
gas is vigorous and it is possible to reach explosion hazard<br />
of the flask. This compound often contains 4,4’-dihydroxydiphenyl<br />
as impurity, especially if this reaction is carried out in<br />
the presence of water.<br />
When we need the pure compound, it is possible to<br />
apply alkalization by means of alkaline lye and then to use<br />
some methylating agent, such as methyl iodide or dimethyl<br />
sulfate 11,12 . In the case we use ethanol as solvent, after boiling<br />
the diphenyl compound is obtained.<br />
The similar procedure is possible to use for other aromatic<br />
amines and diamines, such as 1,4-diaminobenzene known<br />
as p-phenylene diamine (Ursol S, alergen, harmful substance)<br />
and other aromatic diamines as 1-aminonaphtalene<br />
s390<br />
(alfa-naphtyl amine) and 2-aminonaphtalene (beta-naphtyl<br />
amine, Feba, Fenyl-beta, PBn), which is also very potent<br />
carcinogen!<br />
H y d r a z i n e ( D i a z a n e ) / 3 0 2 - 0 1 -<br />
2 / a n d A l s o H y d r a z i n e - H y d r a t e<br />
( 1 0 2 1 7 - 5 2 - 4 )<br />
Hydrazine in the salts (hydrochloride, sulphate) is relatively<br />
stable substance and its disposal is quite safe 5–10 . Hydrazine<br />
in the form of base or hydrate is also effective carcinogen<br />
and its disposal is usually realized by the means of<br />
combustion 1–4 .This substance is possible to convert to prosperous<br />
compound by boiling with benzaldehyde resulting<br />
into substituted hydrazone, known in the cosmetic industry<br />
under trade name Benzalazine (cheap UV-absorber for suncreams).<br />
H y d r o g e n C y a n i d e ( F o r m o n i t r i l e ,<br />
Z y k l o n B ) ( 7 4 - 9 0 - 0 8 ) a n d A l k a l i n e<br />
C y a n i d e s K C n ( 1 5 1 - 5 0 - 8 ) a n d<br />
n a C n ( 1 4 3 - 3 3 - 9 )<br />
Hydrogen cyanide and alkaline cyanides are very toxic<br />
substances. They could be totally decomposed under influence<br />
of strong oxidative agents, such as alkaline hypochlorites,<br />
hydrogen peroxide and fumic nitric acid, even to nitrogen,<br />
carbon dioxide and water 13–15 . However all concentrated<br />
alkaline cyanides could be converted by heating of their ethanolic<br />
solution together with benzyl chloride and the benzyl<br />
cyanide (phenylacetonitrile). After addition of toluene into<br />
reaction mixture, followed by azeotropical distillation and<br />
removal of reaction water the phenylacetic acid ethyl ester<br />
is obtained. This compound is possible to obtain as pure substance<br />
(fragrance) after suitable drying (calcium chloride or<br />
sodium sulphate) and distillation. After reduction by hydrides<br />
it is possible to obtain 2-phenylethanol (fragrance) as the chemical<br />
substitute of natural rose oil.<br />
REFEREnCES<br />
1. Brunner C. D.: Incineration Systems, Selection and<br />
Design, Van nostrand - Reinhold, new York 1984.<br />
<strong>2.</strong> Dawson G. W., Mercer B. W.: Hazardous Waste Management,<br />
Wiley, new York 1986.<br />
3. Bilitewski B., Hardtle G., Marek K.: Abfallwirtschaft,<br />
Springer Verlag, Berlin 1991.<br />
4. LaGrega M. D., Buckingham P. L., Evans J. C.: Hazardous<br />
Waste Management, McGraw-Hill, new York<br />
2001.<br />
5. Lunn G., Sansone B.: Destruction of Hazardous Chemicals<br />
in the Laboratory, Wiley, new York 1990.<br />
6. Luxon S. G.: Hazards in the Chemical Laboratory,<br />
Royal Society of Chemistry, London 199<strong>2.</strong><br />
7. Richardson M. L.: Risk Management of Chemicals,<br />
Royal Society of Chemistry, London 199<strong>2.</strong><br />
8. Stricoff R. S., Walters D. B.: Handbook of Laboratory<br />
Health and Safety, Wiley, new York 1995.
Chem. Listy, 102, s265–s1311 (2008) Environmental Chemistry & Technology<br />
9. Chereminisoff n. P.: Handbook of Solid Waste Management<br />
and Waste Minimization Technologies, Elsevier<br />
Science, Burlington 2003.<br />
10. Shafer D. A.: Hazardous Material Characterization,<br />
Wiley, new York 2006.<br />
11. Černý J. V., Černý M., Paleček M., Procházka M.: Organická<br />
syntéza – Organikum, Academia, Praha 1971.<br />
1<strong>2.</strong> Večeřa M., Panchartek J.: Laboratorní příručka Organické<br />
chemie, SnTL, Praha 1987.<br />
s391<br />
13. Kizlink J.: Nakládání s odpady, Fakulta chemická VUT,<br />
Brno 2007<br />
14. Kuraš M.: Odpady – jejich využití a zneškodňování,<br />
VŠCHT, Praha 1994<br />
15. Kuraš M.: Odpadové hospodářství, Ekomonitor, Chrudim<br />
2008.
Chem. Listy, 102, s265–s1311 (2008) Environmental Chemistry & Technology<br />
P28 APLICATION OF ChITOSAN FOR wATER<br />
TREATMENT<br />
ZUZAnA KLíMOVáa , PETR DOLEJŠa,b and MILADA<br />
VáVROVáa aInstitute of Chemistry and Technology of Environmental<br />
Protection, Faculty of Chemistry, Brno University of Technology,<br />
Purkyňova 118, 612 00 Brno, Czech Republic,<br />
bW&ET Team, box 27, Písecká 2, 370 11 České Budějovice,<br />
Czech Republic,<br />
klimova-z@fch.vutbr.cz<br />
Abstract<br />
Results of experimental study focused on the removal<br />
of humic substances and turbidity by cationic biopolymer<br />
chitosan are presented. Chitosan is a natural high-molecular-weight<br />
polymer prepared from chitin, which is a polysaccharide<br />
found in the exoskeleton of shellfish like shrimps<br />
or crabs. The high content of amino groups provides very<br />
interesting heavy metals chelating properties to chitosan.<br />
Chitosan is partially soluble in diluted mineral acids such as<br />
HnO 3 , HCl, H 3 PO 4 . We have used 0.5% solutions of chitosan<br />
diluted in 0.1M HCl. Aggregates of humic substances after<br />
inorganic coagulant or chitosan addition were separated by<br />
centrifugation. Tests were made with model humic water.<br />
The aim of this work was to found optimal use of chitosan<br />
and to compare its coagulative effectivity with that of standard<br />
coagulants – ferrous and clayey sulphate.<br />
Introduction<br />
Chitosan is a derivative of chitin, a polysaccharide that is<br />
the major component of the shells of crustaceans and insects.<br />
Chitin consists of long chains of acetylated D-glucosamine,<br />
that is, glucosamine with acetyl groups on the amino groups<br />
(n-acetylglucosamine). Chitosan is n-deacetylated chitin,<br />
although the deacetylation in most chitosan preparations<br />
is not complete (see Fig. 1.). Chitin itself is usually prepared<br />
from crab or shrimp shells or fungal mycelia. Treatment with<br />
an alkali then produces chitosan with about 70% deacetylation<br />
1,2 .<br />
Fig. 1. Structure of chitosan<br />
Chitosan as cationic polysaccharide is an important<br />
polymer flocculant in water treatment. It is known that in<br />
chitosan’s molecular structure contains many amino groups<br />
s392<br />
(–nH 2 ) and hydroxyl groups (–OH) on the molecular chain.<br />
These –OH and –nH 2 groups contain single-pair electrons<br />
that can offer the electron pair to empty d-trajectories of<br />
metal ions. Chitosan can therefore be used for removal of<br />
many unwanted metal ions from water such as Al 3+ , Zn 2+ ,<br />
Cr 3+ , Hg 2+ , Ag + , Pb 2+ , Ca 2+ and Cu 2+ etc. Because the active<br />
amino groups in chitosan molecule can be protonated with H +<br />
in water into a cationic polyelectrolyte 3 the molecule shows<br />
effects of static attraction and adsorption. Thus chitosan can<br />
also flocculate particles into digger flocs which become deposited.<br />
Chitosan can be effectively used for removing COD<br />
(organic contaminant) and SS (solid suspending substances)<br />
in water treatment.<br />
Compared with traditional chemical flocculants, chitosan<br />
has the following advantages: the required dosage is<br />
lower, a the depositing velocity is higher, also the efficiency<br />
of removing COD, SS and metal ions is better, sludge treatment<br />
is easier and there is no further pollution. Chitosan<br />
as a flocculant for treating of water will be more expensive<br />
than traditional flocculants. The objective opf our work was<br />
to prepare a cheaper composite based on the chitosan flocculant<br />
material and to make this up from lobster shells 4 and<br />
other chemical flocculants. This composite chitosan flocculant<br />
was planned not only to reduce flocculation cost but also<br />
to improve flocculating function, in comparison with single<br />
chitosan flocculant and traditional chemical flocculant polyaluminium<br />
chloride (PAC) 5 .<br />
Impurities present in the raw water are in suspended,<br />
colloidal, and dissolved form. These impurities are dissolved<br />
organic and inorganic substances, microscopic organisms,<br />
and various suspended inorganic materials. It is necessary to<br />
destabilize and bring together (coagulate) the suspended and<br />
colloidal material to form particles. Afterwards these particles<br />
are removed by filtration.<br />
Coagulation is accomplished by the addition of ions<br />
having the opposite charge to that of the colloidal particles.<br />
Since the colloidal particles are almost always negatively<br />
charged, the ions which are added should be cations or<br />
positively charged. Typically, two major types of coagulants<br />
are added to water. These are aluminium salts and iron salts.<br />
The most common aluminium salt is aluminium sulphate, the<br />
most common iron salt is ferric sulphate. Iron and aluminium<br />
salts are used as primary coagulants and the reactions that<br />
occur after addition of these coagulants are fairly well elucidated.<br />
More recently, organic polyelectrolyte coagulants<br />
have become also used. Organic coagulants are sometimes<br />
used in combination with inorganic coagulants. Depending<br />
on the specific chemistry of the target water, polymer use can<br />
vary from as little as 5 % of the total coagulant dosage to as<br />
much as 100 % ref. 6 .<br />
Chitosan has been widely used in vastly diverse fields,<br />
ranging from waste management to food processing, medicine<br />
and biotechnology. It becomes an interesting material<br />
in pharmaceutical applications due to its biodegradability<br />
and biocompatibility, and low toxicity. The protonization<br />
of amino groups in solution makes chitosan positively char-
Chem. Listy, 102, s265–s1311 (2008) Environmental Chemistry & Technology<br />
ged, and thereby very attractive for flocculation and different<br />
kinds of binding applications. Since most natural colloidal<br />
particles, including bacteria and macromolecules, are negatively<br />
charged, attractive electrostatic interactions may lead<br />
to flocculation 1,2,4 .<br />
Experimental<br />
C h i t o s a n S o l u t i o n s<br />
Chitosan is partially soluble in dilute mineral acids such<br />
as HnO 3 , HCl, H 3 PO 4 . We have used 0.5% solutions of chitosan<br />
TM 324 (Primex, Island) diluted in 0.1M HCl. The<br />
solution was prepared fresh before each set of experiments<br />
for consistency.<br />
M e t a l - B a s e d C o a g u l a n t s<br />
Ferric sulphate [Fe 2 (SO 4 ) 3 ] and aluminium sulphate<br />
[Al 2 (SO 4 ) 3 . 18H2 O], supplied by Kemifloc a.s. (Přerov,<br />
Czech Republic) or Kemwater ProChemie s.r.o., (Bakov<br />
nad Jizerou, Czech Republic) respectively were used for the<br />
experiments.<br />
Fig. <strong>2.</strong> Turbidity removal comparison between different initial turbidity levels<br />
s393<br />
M o d e l H u m i c W a t e r s<br />
Tests were made with model humic water. Model water<br />
was mixtures of distilled water, tap water and natural concentrate<br />
of humic substances sampled from a peatbog near<br />
Radostín. Selected model humic water parameters are given<br />
in Table I.<br />
Turbidity was formed by addition of bentonit. Absorbance<br />
at 254 nm was measured in 1-cm cell and absorbance at<br />
387 nm and at 820 nm were measured in 5-cm cell 7 .<br />
C o a g u l a t i o n T e s t s<br />
Coagulation test using centrifugation as the separation<br />
method was employed. This test did allow us to study formation<br />
of nOM particles by Brownian motion (perikinetic<br />
coagulation) and has the highest possible degree of reproducibility<br />
(in any place in the world) as temperature is the<br />
only parameter influencing the kinetics of particles formation.<br />
Aggregation time was 10 and 40 minutes. Absorbance at<br />
254 nm, 387 nm and 820 nm were evaluated.
Chem. Listy, 102, s265–s1311 (2008) Environmental Chemistry & Technology<br />
Table I<br />
Parameters of starting model humic waters<br />
pH 6.3<br />
AnC 4.5 [mmol dm –3 ] 0.4<br />
χ [mS m –1 ] 16.7<br />
A 254 (1 cm) 0.178<br />
A 387 (5 cm) 0.196<br />
A 820 (5 cm) 0.015<br />
turbidity [nTU] <strong>2.</strong>4<br />
χ – conductivity; AnC 4.5 – acidic neutralising capacity to<br />
pH 4,5; A 254 – absorbance at 254 nm; A 387 – absorbance at<br />
387 nm; A 820 – absorbance at 820 nm<br />
Results<br />
Chitosan solution was dosed into model waters with<br />
values of initial turbidity 25, 45, 100 a 200 nTU. The dosages<br />
of chitosan were from 0.5 to 5.0 mg dm –3 .<br />
Figs. 2 and 3. show comparison of removal of turbidity<br />
between different initial turbidity. Optimum coagulant<br />
dose ranged from <strong>2.</strong>0 to 3.0 mg dm –3 of chitosan. Removal<br />
of turbidity was more than 90 % in optimum dose. Application<br />
of higher dosages induced lower efficiency of turbidity<br />
removal. Values of turbidity were lower than <strong>2.</strong>0 nTU after<br />
treatment 8 .<br />
Conclusion<br />
Generally, the results show very good removal of humic<br />
substances and turbidity by chitosan. The optimum pH value<br />
for chitosan coagulation was between 6–7 ref. 9 .<br />
Almost 100% removal was reached when using relatively<br />
low dosages of chitosan. Value of turbidity lower than<br />
10 nTU was measured already at dosage of 0.5 g dm –3 . The<br />
results show that chitosan is a promising substitute of metalbased<br />
coagulants, which are traditionally applied in treatment<br />
of turbid humic waters.<br />
REFEREnCES<br />
1. Divakaran R., Sivasankara Pilla V. n.: Water Res. 36,<br />
2414 (2002).<br />
<strong>2.</strong> Dalwoo Corporation: Chitin, chitosan and chitosan<br />
oligomer from Crab Shells. [online]. cit. 2008-07-21<br />
http://members.tripod.com/~dalwoo/<br />
3. Safari,K., Elmaleh S., Coma J., Bankhouja K.: Chem.<br />
Eng. J. 27, 9 (2004).<br />
4. Defang Z., Gang Y., Penvi Z.: Chin. J. Environ. Sci. 1,<br />
62 (2002).<br />
5. Defang Z., Wu J., Kennedy J., F.: Carbohydr. Polym. 71,<br />
135 (2008).<br />
s394<br />
Fig. 3. Dependence of absorbance and ph at chitosan dosage<br />
6. Gulbrandsen: Organic polymers [online]. 200<strong>2.</strong> cit.<br />
2008-05-13. http://www.gulbrandsen.com/GTI_prod_<br />
4_3_06.shtml.<br />
7. Dolejš P.: In Sborník konference „Hydrochémia ‘83“.<br />
Bratislava: ČSVTS VÚVH, p. 361, 1983.<br />
8. Klímová Z., Dolejš P.: In Sborník konference PITNÁ<br />
VODA 2008, České Budějovice: W&ET Team, p. 213,<br />
2008.<br />
9. Klímová Z.: In Sborník konference VODA ZLÍN 2008,<br />
Zlínská vodárenská, a.s., Voding Hranice s.r.o., p. 65.
Chem. Listy, 102, s265–s1311 (2008) Environmental Chemistry & Technology<br />
P30 ThE EFFECT OF wASTE bASALT wOOLS<br />
ON ThE ChEMICAL, AGROChEMICAL,<br />
PEDOLOGICAL AND hyGIENIC-<br />
TOxICOLOGICAL SOIL PARAMETERS<br />
PETER KOVáČIK, ALEnA VOLLMAnnOVá and<br />
JAROSLAV nOSKOVIČ<br />
Department of Agrochemistry and Plant Nutrition,Faculty<br />
of Agrobiology and Food Resources, Slovak University of<br />
Agriculture in Nitra, Tr. A. Hlinku 2, 949 76 Nitra, Slovak<br />
Republic,<br />
Peter.Kovacik@uniag.sk<br />
Introduction<br />
The range of soil amendments applying in agriculture of<br />
European countries, and Asia as well is considerably wider<br />
than the one in Slovakia. However, after Slovak accession<br />
to EU it has started to diversify year by year, as many soil<br />
amendments affect positively on weathering of the mineral<br />
soil elements and mineralization of organic soil elements.<br />
They reduce production of non-soluble phosphorus compounds,<br />
thereby affect positively on the level of available soil<br />
nutrients. Consequently they are alternative sustaining harvest<br />
stabilization due to the financial shortage for purchase of<br />
the industrial and organic fertilizers 1 .<br />
The trial aim was to ascertain the affect of two almost<br />
identical recycled waste rock wools produced for hydroponic<br />
plant growing (Agroban) and for building industry<br />
(nobasyp) by the company Izomat nová Baňa on many soil<br />
parameters.<br />
Experimental<br />
C h a r a c t e r i s t i c s o f t h e W a s t e<br />
( R o c k ) B a s a l t W o o l s<br />
nobasyp is a commercial name for loose minced<br />
thermo-insulating material sold as nobasil. It is produced as<br />
a result of milling (recycling) of nobasil which has not met<br />
the requirements of the consumer (shape, thickness, colour,<br />
etc.). Agrodrap can be obtained by scrapping the pieces of<br />
rock wool (basalt wool) commercially sold as Agroban.<br />
In a similar way like nobasyp, Agrodrap is produced with<br />
the aim to evaluate Agroban which is made with different<br />
parameters than the particular buyer requires. Appropriate<br />
agrochemical and hygienic-toxicological parameters of used<br />
waste rock (basalt) wools were the condition for their inclusion<br />
in biological tests.<br />
V e g e t a t i o n T r i a l s<br />
The pot trial was realized in a vegetation cage located at<br />
the Slovak Agricultural University in nitra. 25 kg of Haplic<br />
Luvisol with a low content of C, accessible n and P and a<br />
high content of K were weighed out into 30 kg pots –1 . Every<br />
pot was sown with 100 spring barley grains. After the germination<br />
the number of the individuals was united to 75<br />
plants per pot. There were 8 treatments repeated four times<br />
(0 – control; nS 1 – nobasyp dose of 20 t ha –1, AD 1 – Agro-<br />
s395<br />
drap dose of 20 t ha –1 ; nPK – the dose of nPK fertilizers<br />
consisting of n dose – 140 kg ha –1 , P dose – 50 kg ha –1 and<br />
K – 40 kg ha –1 ; nPK + nS 1 – fertilizers + the basic dose of<br />
nobasyp 20 t ha –1 ; nPK + nS 1/2 – fertilizers + half a dose of<br />
nobasyp 10 t ha –1 , nPK + AD 1 – fertilizers + the basic dose<br />
of Agrodrap 20 t ha –1 ; nPK + AD 1/2 – fertilizers + half a dose<br />
of Agrodrap ). The doses of nPK nutrients (n – 3 g pot –1 , P<br />
– 1 g pot –1 , K – 2 g pot –1 ) were calculated taking into account<br />
the n an and accessible P, K contents in the Haplic Luvisol as<br />
well as the requirements of the nutrients for planned yield<br />
(6 t ha –1 of the grain).<br />
nitrogen was added in the fertilizer DAM 390, P in<br />
a form of simple superphosphate and K in a form of 60 %<br />
KCl. nobasyp and Agrodrap doses were chosen on the basis<br />
of knowledge 2 .<br />
The spring barley harvest was performed in a growth<br />
phase DC 91. After the harvest the soil samples were taken<br />
from the whole profile of each pot where was given a research<br />
in the effect of waste rock wools on many soil parameters.<br />
A n a l y t i c a l M e t h o d s<br />
Specific electric conductivity (EC) was determined by<br />
the conductometer Hana HI 8820 n. The hydrogen ions activity<br />
was sensed potentiometrically by the glass electrode (in<br />
a soil suspension) after 24 hours of effect 1M KCl on the soil.<br />
The cation exchange capacity was detected as a sum of the<br />
base of saturation and the total acidity of soil 3 . The total carbon<br />
content was sensed oxidometrically, oxidation with K 2 Cr 2 O 7<br />
in the environment H 2 SO 4 . Composition of humic substances<br />
was detected by Kononova – Beltchikova method 3 . The content<br />
of Cd, Pb, Cr, ni was detected after mineralization with<br />
HF + HClO 4 by atomic absorption spectrophotometry.<br />
Results and Discussion<br />
The application of nobasyp or Agrodrap (20 t ha –1 )<br />
has statistically significantly increased the cation exchange<br />
capacity (+ 35.7 % and + 17.2 %), the sum of exchange basic<br />
cations (+ 42 % and + 21.4 %) and the base of saturation<br />
of the soil (+ 4.7 % and + 3.6 %). The bulk density of the<br />
soil has been decreased significantly as well (–5.7 % and<br />
–<strong>2.</strong>5 %), whereas nobasyp has determined the parameters<br />
more importantly than Agrodrap. Established results are at<br />
disagreement with the contention 4 which assert that the use<br />
of the mineral wool do not improve physical parameters of<br />
the soil. The assertion is irrational, because their experiments<br />
were narrowly focused on the effect of the wools on the water<br />
reserves increase of eroded soil.<br />
Both materials have had a positive effect on the total<br />
carbon content (+ <strong>2.</strong>1 % and + 9.3 %) and and the organic<br />
matter quality, thereby have increased the humic acid share<br />
in the soil, whereas Agrodrap has had more significant effect<br />
on these parameters than nobasyp. The combined application<br />
with nPK fertilizers has increased the positive effect of the<br />
wools on the increase of the organic matter quality of the<br />
soil.
Chem. Listy, 102, s265–s1311 (2008) Environmental Chemistry & Technology<br />
Both waste rock wools have had an alcalic effect on the<br />
soil and have deadened acidic effect of the fertilizers and<br />
the negative effect on the increase of salt content in the soil<br />
as well. They have had the same effect on the content of nine<br />
determined heavy metals in the soil (Cd, Pb, Cr, Zn, Cu, Co,<br />
ni, Mn, Fe) as nPK fertilizers application.<br />
At the end of the trial was the content of six heavy<br />
metals (Cd, Pb, Cr, Cu, Co and ni) in all the treatments lower<br />
than before the start of the trial.<br />
Conclusions<br />
Due to the neutral effect of wools on the heavy metals<br />
content in the soil and the positive effect on the remaining<br />
soil parameters can be nobasyp and Agrodrap regarded as<br />
soil amendments.<br />
s396<br />
This work has been supported by grant projects VEGA<br />
No. 1/1346/04 and 1/4418/07<br />
REFEREnCES<br />
1. Marschner H.: Mineral nutrition of higher plants.<br />
Elsevier Academic press, San Diego, California, 889 p,<br />
2005.<br />
<strong>2.</strong> Kovacik P.: Acta fytotechnica et zootechnica 9, 5<br />
(2006).<br />
3. Hanes J.: Analyses of soil sorption properties. VUPOP<br />
Bratislava a SPU nitra, 136 p, 1999.<br />
4. Orlik T., Marzec M.: Acta cientarium Polonorum – Formatio<br />
Circumiectus 3(1), 81 (2004).
Chem. Listy, 102, s265–s1311 (2008) Environmental Chemistry & Technology<br />
P31 INFLuENCE OF wATER EROSION<br />
PROCESSES ON ThE bOTTOM SEDIMENT<br />
QuALITy<br />
nATáLIA KOVALIKOVá and MAGDALénA<br />
BáLInTOVá a<br />
a Civil engineering Faculty, Technical university of Košice,<br />
Vysokoškolská 4, 042 00 Košice,<br />
natalia.kovalikova@tuke.sk<br />
Introduction<br />
Erosion processes in watersheds belong to serious ecological<br />
and economical problems because of negative consequences<br />
in terms of soil and water deterioration as well as<br />
on the environment as a whole. Sediments, detached by the<br />
erosion, bind nutrients (particularly nitrogen and phosphorus),<br />
that can significantly affect the balance of the aquatic<br />
ecology, resulting in eutrophication of lakes and rivers 1 .<br />
More studies in Slovakia have been focused on the assessment<br />
of soil erosion, based upon principles and parameters<br />
defined in the Universal Soil Loss Equation, but neither from<br />
them has dealt with nutrient transport assessment in consequence<br />
of water erosion.<br />
This contribution deals with the nutrient transport from<br />
eroding upland fields by the small water basin Kľušov.<br />
Experimental<br />
M a t e r i a l a n d M e t h o d s<br />
The study of nutrient transport assessment in consequence<br />
of water erosion has been realized in vicinity of<br />
small water basin (SWB) Kľušov situated at the Tisovec<br />
stream in the east of Slovakia. Average depth of SWB is<br />
3.5 m and its total capacity is 72,128 m 3<br />
According to last measuring, the quantity of sediments<br />
in reservoir caused the decreasing of SWB capacity about<br />
33 % during 18 years. Therefore this reservoir was run the<br />
water off from 2005 to 2007 and has been chosen as model<br />
basin for our study.<br />
For bottom sediment quality assessment, there was realized<br />
sampling of bottom sediments and also sampling of<br />
arable land in vicinity of reservoir.<br />
Soil samples were taken according the modified methodology<br />
for nutrient transport assessment in consequence of<br />
water erosion. This methodology comes out from Decree<br />
of the Ministry of Agriculture of the Slovak Republic<br />
no. 338/2005 Coll. combine with Soil Sampling according<br />
to Mahler and Tindall 2 , because Slovak decree doesn’t assess<br />
soils in term of total phosphorus and nitrogen concentrations,<br />
it considers only with plant available nutrients.<br />
Soil samples were taken from arable land in period<br />
2006–2007.<br />
Together with soil samples also one composite sediment<br />
sample was taken from each selected locality – along the<br />
reservoir and by the dyke.<br />
Localities for sediment and soil sampling are shown in<br />
Fig. 1.<br />
s397<br />
Fig. 1. Sediment and soil sampling localities<br />
In the first stage of our research, the granularity impact<br />
of soil and sediment particles on the nutrient concentration<br />
was followed, because pollutants are preferentially attached<br />
to the finest particles (fractions below 63 microns) 3 .<br />
Samples of bottom sediments and soils were analyzed<br />
for total n and P in accredited laboratory of State Geological<br />
Institute of Dionyz Stur Spišská nová Ves.<br />
Results<br />
From chemical analyses (Table I) follows that nutrient<br />
concentrations in average soil sample (P1, P2) were nearly<br />
identical with concentrations of followed compounds in fractions<br />
below 63 microns (P1’, P2’).<br />
The concentrations of P, n in chosen sediment samples<br />
(S1–S8) were diverse due to irregular sediment deposition in<br />
the reservoir (Table II). These concentrations increase with<br />
proportion of the finest particle fraction and the higher concentrations<br />
are by the dyke (Fig. <strong>2.</strong>). In this case the literary<br />
information 3 about higher concentrations of the followed<br />
compounds (n, P) in sediment samples in fraction below 63<br />
microns has been confirmed. Because we found 4 that nutrient<br />
concentrations in sediment average sample (S1, S2, S5) and<br />
sediment fractions below 0.063 mm (S1’, S2’, S5’) are nearly<br />
identical, in the next research we have focused only on concentration<br />
in average sediment and soil sample (Table I, II).<br />
Table I<br />
Concentration of n and P in the arable land<br />
Sample n tot [%] P tot [%]<br />
P1 0.08 0.069<br />
P1’ 0.09 0.068<br />
P2 0.12 0.065<br />
P2’ 0.13 0.066<br />
P3 0.18 0.082<br />
P4 0.16 0.055<br />
P5 0.22 0.075<br />
P6 0.23 0.06<br />
P7 0.20 0.077<br />
P8 0.22 0.058
Chem. Listy, 102, s265–s1311 (2008) Environmental Chemistry & Technology<br />
nutrient transport assessment from soils to surface<br />
water was studied through transport of dissolved and adsorbed<br />
forms of n and P.<br />
Table II<br />
Concentration of n and P in SWB sediments<br />
Sample n tot [%] P tot [%]<br />
S1 0.26 0.112<br />
S1’ (100 %) 0.26 0.112<br />
S2 0.24 0.113<br />
S2’ (97.65 %) 0.24 0.110<br />
S3 0.22 0.066<br />
S4 0.23 0.066<br />
S5 0.24 0.112<br />
S5’ (89.24 %) 0.25 0.115<br />
S6 0.20 0.090<br />
S7 0.17 0.049<br />
S8 0.14 0.070<br />
Fig. <strong>2.</strong> Influence of sampling distance from the dyke on the N<br />
and P sediment concentration<br />
For determining nutrient concentrations in dissolved<br />
phase several leaching experiments were realized. Expe-<br />
s398<br />
riment results have shown that portion of dissolved phase<br />
represented 0.46–0.65 % of total P and 0.37–0.46 % of total n<br />
in the soil sample. According these findings, dissolved phase<br />
weren’t considered.<br />
As follows from Table I, nitrogen concentrations in<br />
adsorbed phase of soils varied from 0.08 % to 0.23 % and<br />
phosphorus concentrations were in range 0.054 % to 0.082 %.<br />
It depends on rates and date of fertilizer application and also<br />
on type of grown crop and its uptake rates (samples P1–P4<br />
before and P5–P8 after nitrogenous fertilizer application).<br />
Conclusions<br />
The concentration of nutrients in studied soil samples<br />
wasn’t influenced by their granularity and depends on the<br />
applicable fertilizer rates and grown plant uptake.<br />
The results from chemical analyses confirmed the literary<br />
information that the concentrations of P, n in chosen<br />
sediment samples are diverse due to irregular sediment deposition<br />
in the reservoir and increase with proportion of the<br />
finest particle fraction.Concentrations of P, n in sediments<br />
correspond to their concentrations in soils what is in accord<br />
with our results about their maximal portion in adsorbed<br />
phase.<br />
This work has been supported by the Slovak Grant<br />
Agency for Science (Grant No. 1/0613/08).<br />
REFEREnCES<br />
1. Bálintová M., Kovaliková n.: Sel. Sci. Pap. 1, 189<br />
(2005).<br />
<strong>2.</strong> Mahler R. L., Tindall T. A.: Coop. Ext. Bull.1997, 704<br />
3. Methodological instruction of Ministry of environment<br />
SR no. 549/98-2<br />
4. Kovaliková n., Bálintová M.: Acta Facultatis Ecologiae<br />
16, 129 (2007).
Chem. Listy, 102, s265–s1311 (2008) Environmental Chemistry & Technology<br />
P32 MODELLING AND DIAGNOSING OF<br />
MEChANICAL ENGINEERING LIFE CyCLE<br />
PRODuCTION PROCESS<br />
RUŽEnA KRáLIKOVá and ALEnA PAULIKOVá<br />
Technical University in Košice, Faculty of Mechanical Engineering,<br />
Department of Environmental Studies and Control<br />
Processes, Park Komenského 5, 041 87 Košice, Slovak<br />
Republic,<br />
ruzena.kralikova@tuke.sk<br />
Introduction<br />
Competing business challenges to interest in production<br />
process as determined factor for quality products, environment<br />
protection, production machinery condition, required<br />
parameters for machining and elaborateness for given accuracy.<br />
One of solution is the implementation modern simulating<br />
devices and applications of analogs in production practice.<br />
It is necessary to pay attention to production process<br />
as a determined factor for product quality, environment protection,<br />
production machinery state, required parameters for<br />
machining and elaborateness, which is given for achievement<br />
of required accuracy. One of solution is implementation of<br />
modern simulation devices and application of models in production<br />
operation.<br />
Environmental Strategies<br />
Environmental aspects, its loading and protection give<br />
production enterprises the possibility of evaluation of their<br />
production methodology, used technology, raw material and<br />
energy management in term of environmental influence reduction.<br />
However, the quality of these solutions dependeds on<br />
project quality for new building-up or reconstruction of production,<br />
there is need to add ecological aspects to ordinary<br />
methods of projecting.<br />
The ecological ones in determined term ensure sustainable<br />
development of environment. Policy, economy and<br />
ecology have got significant function. Works, function and<br />
possibilities in environmental creation and protection could<br />
be outlined in points which represent strategy of mechanical<br />
engineering development in environmental view at present:<br />
•<br />
•<br />
•<br />
•<br />
production of environmental suitable products,<br />
using of environmental acceptable technologies for their<br />
production,<br />
energy and raw material economy – low-waste, nonwaste<br />
and recycling technologies,<br />
machinery and devices production for environmental<br />
protection and creation (water treatment plants, filters,<br />
separators, traps, eco-technology).<br />
Model Creation of Mechanical Engineering Production<br />
Process<br />
Production process is the collection of human activity,<br />
machinery and physical processes and its results are particu-<br />
s399<br />
lar kinds of products. At every production process there are<br />
three factors:<br />
systematic activity – human work,<br />
work objects which are transformed to products – basic<br />
mechanical engineering products are machines, function<br />
groups, nodal points and components,<br />
means of work, which are production machines, devices,<br />
tools, accessories, helpers, transport and handling equipments,<br />
control technology1 •<br />
•<br />
•<br />
.<br />
During production process shape and composition materials<br />
are changed so that the result is the new utility value.<br />
The production process can start if production factors, inputs<br />
are disposable. One of inputs can be also the creation of production<br />
process model. That is why is necessary to have concrete<br />
data, which characterize given production process.<br />
By analysing of process activity there are scheme where<br />
particular phases of phenomena observation or object perform<br />
these activities that are each other connected and regulated<br />
by producer’s and customer’s decision.<br />
In accordance to environmental view the mechanical<br />
engineering production process is open system with its relation<br />
to surroundings. It has got full interaction among subjects.<br />
In accordance to relations this system is quite open which<br />
makes possible the full interaction to surroundings. In Fig. 1.<br />
and Fig. <strong>2.</strong> there is the comparison of production process<br />
from the point of the view:<br />
•<br />
•<br />
•<br />
•<br />
influence on the environment<br />
renewable and unrenewable resources exploitation of<br />
raw materials and energy<br />
interaction with other processes<br />
waste production 4 .<br />
Fig. 1. Nonenvironmental production process<br />
Environmental suitable production has to follow the<br />
main aim. Production process is regarded as system which<br />
creates closed structure with interaction of system environ-
Chem. Listy, 102, s265–s1311 (2008) Environmental Chemistry & Technology<br />
Fig. <strong>2.</strong> Environmental production process<br />
ment, i.e. Closed Loop Systems, Fig. 3. This system demonstrates<br />
renewable energy, nontoxic materials in a closed loop<br />
and sustainable product design. It is rooted within circular<br />
concepts of the product life cycle.<br />
Production process has also got its life cycle. There<br />
are characterized its production, system, technological and<br />
environmental phases. According to production aspects the<br />
process can be in beginning phase of its cycle. However<br />
according to environmental impact view can be out-of-date<br />
or according to qualitative parameters in leading countries<br />
“outsider”. Working out of equivalent model of production<br />
process is has got several phases as followings:<br />
Fig. 3. Closed Loop Systems 4<br />
P r e d i c t i o n A n a l y s i s<br />
Estimation of production running, its inputs and outputs<br />
is possible to make or by considering that production has got<br />
the same way eventually similar way or quite new and different<br />
way. The way is determined as kind of application, its<br />
evaluation, modification or change of production, systemic,<br />
technological and environmental approaches. It is important<br />
to establish the reliable obtained information. It can reach<br />
s400<br />
to use accurate methods of data collecting or application of<br />
measurement methods if there is an existing operation plant<br />
where it is possible to obtained parameters.<br />
D e v e l o p m e n t o f M e t h o d<br />
According to number of inputs and outputs, we can choose<br />
strategy or methods for model development. We obtained<br />
various types of models with the combination of individual<br />
parameters. If we choose the main point as economical point<br />
and inputs will be reduced only gains, expenses, costs per<br />
hour, costs per piece, etc. Very simply model comes into existence<br />
but in real operation there is not applied. Many customers<br />
ask for quality, ecology, and modern technology not<br />
only low price.<br />
M o d e l I m p l e m e n t a t i o n<br />
There is a verification of prediction and correctness of<br />
used methods. If the preparation is worked out in details then<br />
the implementation is simple and the model can be applied<br />
in short time. Implementation makes possible to modify<br />
a model and it creates other opportunity to regulate and to<br />
adjust the model.<br />
C o n t r o l l i n g o f M o d e l<br />
After successful implementation of model there is final<br />
period – i.e. control. It is the adjusting according to external<br />
and internal operational demands. All feedback relations in<br />
system can be used and following modifications, which do<br />
not influence the model creation but only they simulate all<br />
changes in production.<br />
A p p l i c a t i o n o f M o d e l<br />
Model, which is created in this way, exists from its<br />
beginning to its end and this model makes possible to eliminate<br />
or minimize mistakes. These mistakes would be developed<br />
directly in operation without the using of previous simulation.<br />
Model becomes the control tool for production process.<br />
Mistakes in model are cheaper than real production and changes,<br />
which are done in model, are reversible as well. Production<br />
enterprises can use Model for improving or representation<br />
for customers, contact persons from state institutions,<br />
for certification of quality of environmental management,<br />
for training and courses of employees or for comparison of<br />
product quality to competing product. In model there are all<br />
accessible methods and technologies, which product operator<br />
requires. One of methods is Life Cycle Assessment (LCA) 2 .<br />
Life Cycle Assessment<br />
Life Cycle Assessment is very often term predominately<br />
in environmental management field. Every mechanical engineering<br />
product shows environmental “track” in environment<br />
and this way these environmental impact are evaluated during<br />
all its life cycle – from the cradle to grave. It is complicated to<br />
obtain enough data number from operation. Or obtained data<br />
are different values, units or time and accuracy of obtaining.
Chem. Listy, 102, s265–s1311 (2008) Environmental Chemistry & Technology<br />
Production process is also concerned hundreds of products<br />
and its characters are complicated. In LCA there are<br />
assessed for example harmful substances released into the air<br />
and water, amount of solid waste as well, energy and raw<br />
material consumption, human environmental effects, who are<br />
in production. Tools of LCA cover general matters as well as<br />
localizations independent from evaluation methods.<br />
Modelling of process means the using of all available<br />
methods from LCA, SEM, standards ISO 14000 and 9000<br />
and technological processes, LCA technologies and likewise.<br />
Complex model can also simulate production accidents 3 .<br />
Multicriterial Environmental Evaluation of using Chemicals<br />
in Individual Plants<br />
This evaluation is based on quantification of parameters<br />
for environment quality by means of unbalanced evaluating<br />
effects of production process.<br />
Fig. 4. Multicriterial evaluation for using of chemicals in production<br />
process<br />
Objectivity of solution has got number of evaluating<br />
coefficients, their optimal number in interval 20–25. Deriving<br />
from following relations it is possible to determine Q j<br />
– value of environmental chemical load:<br />
aij - a j<br />
Qj = ∑ × k j , (1)<br />
s<br />
j j<br />
where:<br />
Q j – value of environmental load,<br />
a ij – value j-element of vector,<br />
s401<br />
ā j – average value of j-element ,<br />
s j – standard deviation of modified j-descriptor,<br />
k j – reduction constants.<br />
Example for application of multicriterial evaluation for<br />
using of chemicals in production process is in Fig. 4.<br />
It is possible to determine from application of multicriterial<br />
evaluation which operational plant is the most loaded, i.e.<br />
the plant with the higher Q j - value.<br />
Conclusions<br />
Methods for monitoring and checking of technological,<br />
chemical and environmental aspects for production can have<br />
other applications as well.<br />
There are in various enterprises for development of technology<br />
or optimalization of operation according to customer’s,<br />
producer’s or environmental engineer’s demands. This period<br />
is period IT technologies and it could show that environmental<br />
pollution is slowing because operation plats of individual<br />
productions began to behave more understanding.<br />
Model of life cycle for production process is one of tools<br />
that helps producers made with optimal technology, develop<br />
products with optimal balanced performance and costs,<br />
characters which are up to standards for environment, health<br />
and safety.<br />
Acknowledgement (This work has been supported<br />
by VEGA 1/3231/06: (2006–2008) Modelling of Working<br />
Environment Factors and Their Optimalization in Specified<br />
Conditions of Mechanical Engineering Enterprises).<br />
REFEREnCES<br />
1. Králiková, R., Pauliková, A.: In: SYM-OP-IS 2006: Simpozijum<br />
o operacionim istraživanjima: Banja Koviljača,<br />
Beograd: Instirut Mihailo Pupin, 2006. p. 45-48.<br />
<strong>2.</strong> Králiková, R., Pauliková, A., Wessely, E.: In: Industrial<br />
engineering – adding innovation capacity of labour<br />
force and entrepreneur: 5th international DAAAM Baltic<br />
conference, p. 203. Tallinn, Estonia 2006.<br />
3. Kozáková, ľ.: In: 11th Conference on Environment and<br />
Mineral Processing, p.23. Ostrava, Czech Republic<br />
2007.<br />
4. www.cleanproduction.org/images/closed-loop-diagram.<br />
gif, citated on 28 th May, 2008.
Chem. Listy, 102, s265–s1311 (2008) Environmental Chemistry & Technology<br />
P33 SIMuLATION OF ChEMICAL FACTORS IN<br />
wORKING ENVIRONMENT<br />
ALEnA PAULIKOVá and RUŽEnA KRáLIKOVá<br />
Technical University in Košice, Mechanical Engineering<br />
Faculty, Department of Environmental Studies and Control<br />
Processes, Park Komenského 5, 041 87 Košice, Slovak<br />
Republic,<br />
ruzena.kralikova@tuke.sk<br />
Introduction<br />
Mechanical engineering has not got so many environmental<br />
impacts as chemical industry but its technologies often<br />
use various chemicals to improve its operations. Working<br />
environment of mechanical engineering is also a subsystem<br />
of global geosphere environment.<br />
People spend so long term that they identify this working<br />
environment with their microenvironment. People are<br />
often influenced by several factors in this “small world” of<br />
them. These factors categorize some working activities from<br />
point of view the environmental and health risks. The categorization<br />
of our working activities involves the known details<br />
about factors of work and working environment.<br />
At industry plants there is most of workers exposed to<br />
a combination of multiple factors of working environment<br />
which influence their health and comfort. The category is<br />
determined separately for individual factors but there is no<br />
methodology of working activities assessment for any combination<br />
of individual factors 1 .<br />
By means of modern software simulation there is designed<br />
the methodology with the look-up functions of program<br />
Vensim for a complex assessment of working environment in<br />
specific conditions of mechanical engineering enterprises.<br />
Chemical Parameters in Cutting Process<br />
In cutting processes there are a lot of chemical parameters<br />
which improve or make worse human working environment.<br />
These chemicals exist in various form and states. The<br />
liquids and aerosols create predominant part of the states.<br />
C u t t i n g F l u i d s<br />
Cutting emulsion is a dispersion system of two insoluble<br />
liquids. One creates microscopical drops dispersed in the<br />
other liquid. At machining only emulsion type: oil in water is<br />
used. Milk appearance or transparent appearance depends on<br />
size of oil drops. For the first case the drops are larger and for<br />
the second case the drops are smaller than 10 mm 3 .<br />
Mineral oil and water almost do not generate an emulsion.<br />
That is why the other component is needed – emulator<br />
which covers oil drops with absorption coat protecting their<br />
repeated mergence. Soaps, organic amino compounds, sulphonate<br />
compounds and the like are used as emulators.<br />
Mineral oils conditioned with emulators are called<br />
emulsive oils. They also contain anticorrosive, antibacterial<br />
and high-pressure additives. The content of mineral oils in<br />
emulsive oils is 50–75 %.<br />
s402<br />
The second component of basic emulsion compounds<br />
is water which has got very good cooling effect. However,<br />
raw water has got a lot of defaults for a preparation of industrial<br />
emulsions, i.e. presence of limestone and magnesium<br />
which are liquated and they create hard-removable sediments<br />
on metal surfaces. The sediments silt up piping, sieves, tanks<br />
and also seal the functional parts of machinery 2 .<br />
As well the corrosive influences and high contents of<br />
micro-organisms are harmful in water for an emulsion preparation.<br />
An anticorrosive protection is performed by the<br />
anticorrosive additives, i.e. soda, borax, sodium phosphate<br />
or sodium silicate. These additives soft water and decrease<br />
its surface tension. They improve wettability, cooling effects<br />
and create alkaline environment. Alkaline environment is<br />
suitable from point of view an anticorrosive protection of ferrous<br />
metals. There are pH under 9.0 because safety and health<br />
reasons. If pH is higher then there is a damage of protective<br />
coats and rubber parts of machines.<br />
The main default is an inclination to micro-organism<br />
contamination what makes short cutting fluid durability by<br />
decisive way. If there is an emulsion value of pH 9.5 and higher<br />
then micro-organism development is decelerated. However,<br />
in this condition the emulsion is health unsuitable, irritate<br />
skin and airways.<br />
A d d i t i v e B I O S T A T ® f o r C u t t i n g<br />
F l u i d s<br />
BIOSTAT ® is a common name for new generation set<br />
of antibacterial and fungicidal preparations which have been<br />
developed for 8 years in the framework of environment friendly<br />
production.<br />
Preparation set BIOSTAT ® is inorganic origin and its<br />
influence is based on three activity principles:<br />
•<br />
•<br />
•<br />
the strong electrochemical influence of Ag ion operating<br />
directly with energy reaction in an electron-transportation<br />
string of cellular proteins<br />
the irreversible denaturation of sulfhydryl groups of<br />
micro-organism proteins by means of the ion exchange<br />
H by Ag<br />
the strong oxidation possibility of product of BIOSTAT ® ,<br />
which causes the catalytic oxidation H 2 O molecule and<br />
air oxygen generating hydrogen peroxide. Hydrogen<br />
peroxide is fissioned consequently into H 2 O molecule<br />
and oxygen radical 3 .<br />
Determination of Parameters for Model<br />
Simulation software Vensim is a graphical model tool.<br />
By means of it, we can draft, document, simulate, analyse<br />
and optimize various simulation models of industrial technologies.<br />
One of the technologies is also machining with using<br />
of chemicals, which belongs to the difficult tasks solved in<br />
environmental engineering protection.<br />
The keystone of s model imulation is determination and<br />
application of following variables in the sketch with nodes<br />
and connecting curves:
Chem. Listy, 102, s265–s1311 (2008) Environmental Chemistry & Technology<br />
•<br />
•<br />
•<br />
•<br />
level parameters – amounts of cutting fluids<br />
rates – operations or technological processes<br />
constant variable – chemical factors<br />
auxiliary variables – derived parameters for chemical<br />
and environmental impacts.<br />
M o d e l f o r C u t t i n g F l u i d C h e m i c a l s<br />
In Fig. 1. there is the sketch of applied parameters for<br />
using of cutting liquids in machining and in Fig. <strong>2.</strong> there is<br />
the simulation of these parameters.<br />
Fig. 1. used parameters of cutting liquids in machining<br />
S i m u l a t i o n f o r C u t t i n g F l u i d<br />
C h e m i c a l s<br />
Fig. <strong>2.</strong> Simulation parameters of cutting liquids<br />
There is a chemical world of systems driven by cause<br />
and affect. Those systems include production, protection,<br />
biological, chemical, thermodynamic or workflow.<br />
s403<br />
Environmental or chemical systems can be modelled<br />
as nodes representing system variables and connecting lines<br />
representing causal effects. The changing value of one variable<br />
can cause another to increase or decrease. Understanding<br />
how a system really works is the first step towards using,<br />
improving or automating 4 .<br />
R e s u l t s<br />
We can change chemical status of the overall machining<br />
process with the movement of slider. Every constant has got<br />
its own slider. The change of constant value influences the<br />
value of auxiliary variables and then they influence value of<br />
level parameters.<br />
This similar model can help the technicians or workers<br />
to properly dose various additives, to fill up fresh cutting<br />
fluids, to increase total productivity and to save expenses.<br />
Conclusions<br />
By the assessment of individual quantitative indicators<br />
of cutting fluid chemical status we can draw these conclusions:<br />
used cutting fluids began to spoil the most often by long<br />
term of cleaning of individual machines and cutting fluid<br />
reservoirs<br />
the insertion of additive BIOSTAT ® into cutting fluids to<br />
lengthen their durability and cleaning intervals.<br />
the declination of Ag is caused its sedimentation of<br />
undissolved additive in the cutting fluid reservoirs and<br />
its removal by means of workflows or waste-flows of<br />
cutting fluids<br />
the cutting fluids flows need for their cycle the segment<br />
of sedimentation reservoir and filters to improve working<br />
environment<br />
additive BIOSTAT ® •<br />
•<br />
•<br />
•<br />
•<br />
does not cause allergic reaction of<br />
respiratory or dermal characters.<br />
This work has been supported by VEGA 1/3231/06:<br />
(2006–2008) Modelling of Working Environment Factors<br />
and Their Optimalization in Specified Conditions of Mechanical<br />
Engineering Enterprises.<br />
REFEREnCES<br />
1. Pauliková A.: Habilitation Thesis, Technical University,<br />
Košice, 2008.<br />
<strong>2.</strong> Ruiz J. M, Kollár V, Brokeš P.: Priemyselné technológie,<br />
Grafické štúdio Ing. Peter Juriga, Bratislava 2000.<br />
3. Ansil: Manuál pre aplikáciu prípravku Biostat ® (Slovenská<br />
republika), 2006.<br />
4. www.excelsoftware.com, August 8, 2007.
Chem. Listy, 102, s265–s1311 (2008) Environmental Chemistry & Technology<br />
P34 MuLTI-RESIDuE METhOD FOR<br />
ThE ANALySIS OF PESTICIDES AND<br />
MyCOTOxINS IN CEREALS by LC-MS/MS<br />
OnDřEJ LACInA, JAnA URBAnOVá, ALEXAnDRA<br />
KRPLOVá and JAnA HAJŠLOVá<br />
Institute of Chemical Technology Prague<br />
Technická 5, 166 28 Prague 6,<br />
ondrej.lacina@vscht.cz<br />
Introduction<br />
In the recent decade, liquid chromatography–tandem<br />
mass spectrometry (LC MS/MS) operated in a selected reaction<br />
monitoring mode, has become the main tool for the analysis<br />
of food and environmental contaminants presenting wide<br />
range of physico-chemical properties. This approach allowed<br />
the introduction of multiresidue methods with up hundreds<br />
target analytes determined in a single run. However, most of<br />
these methods are focused only on one group of food contaminants<br />
such as pesticides, veterinary drugs, mycotoxins,<br />
plant toxins, etc. Considering the fact, that sample preparation/detection<br />
principles are basically similar for most of<br />
these methods, we attempted to determine pesticide residues<br />
and mycotoxins - contaminants representing different sources<br />
of origin in single run. The comprehensive LC-MS-MS<br />
multi-residue method has been developed and validated for<br />
14 Fusarium toxins, 4 aflatoxins, ochratoxin A, 3 Alternaria<br />
toxins and 200 pesticides.<br />
Experimental<br />
C h e m i c a l s a n d R e a g e n t s<br />
Certified pesticide and mycotoxins standards were<br />
purchased from Dr. Ehrenstorfer GmbH (Germany), Riedel<br />
de Haen (Germany) and/or Biopure (Austria). Individual<br />
analyte stock solutions (concentrations in the range<br />
0.3–3mg ml –1 ) were prepared in either methanol or acetonitrile,<br />
depending on the solubility of particular analyte. These<br />
solutions were used for preparation of mixed standard solution<br />
in acetonitrile (10 µg ml) and stored in –18 °C. Deionized<br />
water for preparation of a mobile phase was produced<br />
by Milli–Q apparatus (Millipore, Germany). Ammonium formate<br />
for mass spectrometry was obtained from Fluka (Buchs,<br />
Germany). Acetonitrile (Sigma-Aldrich, Germany) and methanol<br />
(Merck, Germany) were HPLC gradient grade solvents<br />
for pesticide residue analysis.<br />
S a m p l e P r e p a r a t i o n<br />
5 g of sample were weighted into 50 ml PTFE centrifugation<br />
tube. Then, 20 ml of extraction mixture of acetonitrile/<br />
water/formic acid (75 : 24 : 1, v/v/v) were added and the tube<br />
was placed onto laboratory shaker for 90 min. After this time,<br />
the tube was centrifuged (Hettich, Germany) at 11,000 rpm<br />
for 5 min and aliquot of extract was diluted by a water in<br />
a ratio 2 : 1 and filtered through a 0.45 µm PTFE filter Iso-<br />
DiscTM (Supelco, USA), and transferred into a vial.<br />
s404<br />
H P L C - M S - M S A n a l y s i s<br />
The HPLC analyses of selected pesticides and mycotoxins<br />
were performed using an Alliance LC system (Waters,<br />
USA) equipped with an Atlantis T3 column (100 × <strong>2.</strong>1 mm<br />
I.D., 3 µm particle size, Waters, USA) maintained at 30 °C.<br />
The mobile phase contained 0.005M ammonium formate<br />
in deionized water (A) and methanol (B), flow rate was<br />
0.3 ml min –1 . The optimized chromatographic method started<br />
at mobile phase composition of 5 % of B and was hold for<br />
0.5 min, then rising linearly to 60 % of B and then 100 %<br />
at 15 min. This composition was held for 8 min to remove<br />
co-extracted matrix from column, 6min re-equilibration to<br />
initial mobile phase composition followed. Sample injection<br />
volume 8µl was used in all experiments.<br />
HPLC system was connected to tandem mass spectrometer<br />
Quattro Premier XE (Waters, USA) operated in positive<br />
electrospray ionization mode. The capillary voltage was set<br />
to 3,500 V, source temperature was maintained at 120 °C and<br />
desolvation temperature was 380 °C. The masses of parent<br />
and daughter ion, cone voltage and collision energy were<br />
tuned previously for each analyte and two MS/MS transitions<br />
were acquired for each of them.<br />
Results<br />
O p t i m i z a t i o n o f S a m p l e<br />
P r e p a r a t i o n<br />
QuEChERS extraction method published and extensively<br />
tested in a recent years 1–3 has become the widely used<br />
method for isolation pesticide residues from various matrices.<br />
QuEChERS method employs acetonitrile (MeCn)<br />
extraction followed by partition induced by added salts. If<br />
necessary dispersive SPE clean-up is performed. The partition<br />
step discriminate a lot of bulk matrix compounds such<br />
as sugars and/or acids, which would interfere with determinative<br />
step, however also recovery of polar target analytes is<br />
reduced. For this reason, the QuEChERS has not become an<br />
extraction method of choice for mycotoxins, especially for<br />
relatively polar B trichothecenes.<br />
It should be noted, that existing multi-mycotoxins<br />
methods are based on the extraction by MeCn i.e. use similar<br />
solvent as QuEChERS. Although the sources of food contamination<br />
by pesticides and mycotoxins are fairly different in<br />
their nature, from analytical point of view there are a large<br />
number of representatives of these two groups, possessing<br />
similar physico-chemical properties. On this account, it is a<br />
conscionable concept to put together analysis of mycotoxins<br />
and pesticide residues in one multi-toxin method.<br />
The bottleneck of such method might be the sample<br />
preparation step, since it is necessary to achieve acceptable<br />
recovery for all analytes and at the same time discriminate<br />
extraction of matrix components, which could cause suppression<br />
of ionization as far as electrospray (ES) is employed<br />
in LC-MS method. In principle, achieving simultaneously<br />
these two requirements is impossible, and, therefore the only<br />
feasible approach is to examine extract directly without any<br />
purification 4–5 .
Chem. Listy, 102, s265–s1311 (2008) Environmental Chemistry & Technology<br />
Several extraction solvents including MeCn, methanol<br />
(MeOH) and their mixtures with water were tested to achieve<br />
good recovery for a wide range of analyte polarities. MeOH<br />
and its mixtures with water offered good extraction efficiency<br />
for polar and semi-polar compounds, however high amount<br />
of matrix was also co extracted. Only aqueous MeCn was<br />
used, because of poor extraction of polar analytes by pure<br />
solvent. It is a common practice in many multi-mycotoxin<br />
methods to employ azeotropic mixture of 84 % MeCn and<br />
16 % water. This approach was developed for easy purification<br />
by Mycosep and subsequently solvent evaporation,<br />
nevertheless omitting purification step enabled improvement<br />
of extraction efficiency of polar compounds (such as DOn-<br />
3-glucoside, acephate, propamocarb) by increasing of water<br />
content in extraction mixture up to 25 % (v/v). At the same<br />
time, acceptable recoveries were still obtained for relatively<br />
non-polar analytes represented e.g. by zearalenon and pyrethroid<br />
insecticides.<br />
It should be noted that the addition of water prior to<br />
extraction into low moisture samples as cereals is also recommended<br />
by a document n° SAnCO/2007/3131. To improve<br />
recovery of fumonisin mycotoxins and protect unstable basesensitive<br />
pesticides against the hydrolysis, addition of 1 % of<br />
formic acid into extract mixture was necessary.<br />
The final extract was diluted by water to decrease content<br />
of MeCn and consequently to reduce matrix effects.<br />
Different ratios of MeCn and water in a vial were tested,<br />
nevertheless the content of water higher than 50% caused<br />
precipitation of matrix components and consequently decreasing<br />
of recovery of non-polar analytes.<br />
O p t i m i z a t i o n o f L C - M S - M S<br />
As mentioned above, no purification step was employed,<br />
so chromatographic separation plays an important role to<br />
separate analytes and matrix to decrease matrix effects.<br />
Although slow gradient was used, very strong signal suppression<br />
(over 80 % lower signal of matrix matched standard as<br />
compared to solvent standard) still occurred for some of later<br />
eluting compounds.<br />
Many LC-MS pesticide multi-residues method use only<br />
ESI + ionization, because almost of analytes ionize only in<br />
positive mode or better sensitivity/selectivity is achieved<br />
under these conditions. Although B-trichothecenes offer better<br />
sensitivity in a negative mode by formation adducts with<br />
acetic or formic anion (depends on composition of mobile<br />
phase), ionization in positive mode is also possible. The main<br />
advantage of positive mode is a compatibility with more than<br />
95 % pesticides and other mycotoxins (aflatoxins, fumonisins)<br />
which do not give any ions in ESI – .<br />
M e t h o d V a l i d a t i o n<br />
The distribution of recoveries of all analytes in wheat is<br />
showen in Fig. 1. The recovery and repeatability of particular<br />
analyte was obtained from analysis of spiked wheat material<br />
at 100 μg kg –1 . The extraction method offers a good recovery<br />
for both, acids and bases and covered a wide range of pola-<br />
s405<br />
rities. The trueness of method was demonstrated by analysis<br />
of reference materials for mycotoxins (ochratoxin A, deoxynivalenol,<br />
nivalenol, T-2 and HT-2 toxins) and proficiency<br />
testing materials obtained from FAPAS 0950 and EUPT-C1/<br />
SRM<strong>2.</strong> For all reference materials and positive findings in<br />
proficiency tests were achieved satisfactory score |z| < <strong>2.</strong><br />
Fig. 1. Distribution of recoveries of all 222 pesticide residues<br />
and mycotoxins at concentration level 100 μg kg –1 in wheat<br />
Conclusions<br />
The multi-toxin LC-MS-MS method for simultaneous<br />
analysis of 200 pesticide residues and 22 mycotoxins in<br />
cereals has been developed and fully validated. Acceptable<br />
recoveries and repeatabilities have been achieved for most<br />
of analytes. The trueness of generated data was also documented.<br />
The authors are convinced that this high throughput<br />
approach will find a wide use in many control laboratories in<br />
close future.<br />
This study was carried out with support from the Ministry<br />
of Education, Youth and Sports, Czech Republic from the<br />
project MSM 6046137305 and partly from the project NAZV<br />
1B53043 supported by the Ministry of Agriculture, Czech<br />
Republic.<br />
REFEREnCES<br />
1. Annastasiades M., Lehotay S. J., Štajnbaher D., Schenck<br />
F. J.: J. AOAC 86, 412 (2003).<br />
<strong>2.</strong> Lehotay S. J., Maštovská K., Lightfield A. R.: J. AOAC<br />
88, 615 (2005).<br />
3. Lehotay S. J., Maštovská K., Yun S. J.: J. AOAC 88, 630<br />
(2005).<br />
4. Sulyok M., Krska R., Schuhmacher R.: Anal Bioanal<br />
Chem 389, 1505 (2007).<br />
5. Sulyok M., Berthiller F., Krska R., Schuhmacher R.:<br />
Rapid Commun. Mass Spectrom. 20, 2649 (2006).
Chem. Listy, 102, s265–s1311 (2008) Environmental Chemistry & Technology<br />
P35 AERObIC MTbE bIODEGRADATION by<br />
PAeCilOMyCes vAriOTii<br />
BLAZO LALEVIC a , VERA RAICEVIC a , LJUBInKO<br />
JOVAnOVIC b , DRAGAn KIKOVIC c and MIOMIR<br />
nIKSIC a<br />
a Faculty of Agriculture, Nemanjina 6, 11080 Belgrade-<br />
Zemun,<br />
b Institute for Multidisciplinary Research, Kneza Viseslava,<br />
11000 Belgrade,<br />
c Faculty of science, Lole Ribara 29, 38220 Kosovska Mit-<br />
rovica<br />
lalevicb@yahoo.com<br />
Introduction<br />
Methyl tert-butyl ether (MTBE) has been used since the<br />
1970s as a gasoline additive and octane booster to replace<br />
lead and other toxic additives and to improve combustion<br />
efficiency of gasoline. Because of useful properties, MTBE<br />
has become one of the organic compounds with the highest<br />
production in the world 1 . In 1999, about 3.3 million tons had<br />
produced in the European Union 2 . In the United States, in<br />
1998, MTBE was the fourth-most-produced chemical 3 . However,<br />
its extremely water solubility, mobility and volatilization<br />
have resulted in its contamination of surface soils, groundwater<br />
and sediments mainly from leaky tanks and spills 4 . A<br />
report by the U.S. Geological Survey identified MTBE as the<br />
second most common contaminant of urban aquifers in the<br />
USA 5 . The U.S. Environmental Protection Agency 6 has listed<br />
MTBE as a possible human carcinogen and recommended<br />
concentration in drinking water below 40 μg dm –3 .They also<br />
proposed the methods for removal of MTBE from environments.<br />
Bioremediation is methods, which use natural biological<br />
activity of microorganisms and plants to transform or<br />
destroy different toxic contaminants 7 . Previous bioremediation<br />
studies reported little or no biodegradation of MTBE<br />
under aerobic 8,9 and anaerobic 10,11 condition. However,<br />
authors 4,9,12,13 reported that pure and mixed bacterial cultures<br />
have been capable for MTBE biodegradation. There are only<br />
a few reports of fungal strains capable of biodegradation of<br />
MTBE 14,15,16 so far.<br />
The aim of this paper was to investigate the capacity of<br />
fungal strain Paecilomyces variotii, isolate 129b, for MTBE<br />
biodegradation at different MTBE concentration in laboratory<br />
conditions.<br />
Material and Methods<br />
I s o l a t i o n a n d I d e n t i f i c a t i o n o f<br />
F u n g u s P a e c i l o m y c e s V a r i o t i i<br />
The fungal strain of Paecilomyces variotii, isolate<br />
129b, was isolated from the wastewater of API separator in<br />
Oil Refinery Pancevo, Serbia. The cultures maintained onto<br />
rose bengal streptomycin agar (RBSA) plates 17 at 26 °C. The<br />
identification based on fungal morphological characteristics<br />
s406<br />
growing in malt agar and Czapek yeast agar (CYA), using the<br />
key for identification 18 .<br />
D e g r a d a t i o n E x p e r i m e n t<br />
Liquid suspension cultures grown axenically in 250ml<br />
glass bottles. The growth medium (80 ml) was mineral salts<br />
medium 14 . The medium sterilized at 121 °C for 15 min and<br />
inoculated with 10 % (v/v) of suspension of Paecilomyces<br />
variotii conidia (13.8 × 10 5 ). After addition of different MTBE<br />
concentrations, the liquid suspension cultures incubated for<br />
19 days at 26 °C and shaken at 120 rpm. All the experiments<br />
were conducted in triplicate.<br />
T h e Y i e l d o f P a e c i l o m y c e s<br />
V a r i o t i i M y c e l i a<br />
The yields of mycelia measured after 19 days by means<br />
of dry weight. Liquid suspension cultures were vacuum filtered<br />
onto filter papers. Mycelia and filters were dried at 65 °C<br />
for 24 h and reweighed. The control variant was without<br />
MTBE as an sоle energy and carbon source. The experiments<br />
were conducted in triplicate.<br />
A n a l y t i c a l M e t h o d s<br />
The MTBE used in these experiments originates from<br />
industrial facilities of Oil Refinery Pancevo. Consumption of<br />
MTBE was monitored by a Agilent Technologies 6890n gas<br />
chromatograph (GC) fitted with a flame ionization detector. A<br />
30 m × 0.53 mm ID, 3.0 μm DB-624 column was used (J&W<br />
Scientific, Folsom, CA, USA). The temperature program was<br />
50 °C for 2 minutes, ramp 8 °C min –1 to 100 °C, hold 3 minutes.<br />
The injector temperature was 170 °C and detector (FID)<br />
temperature 300 °C. The flow hydrogen was 40 ml min –1 ,<br />
flow air 450 ml min –1 and make up gas n 2 25 ml min –1 .<br />
The headspace (Agilent 7694E Head Sampler) was:<br />
vial equilibration time 30 min; bath temp. 80 °C; valve/temp<br />
loop 85 °C; transfer line temp. 120 °C; loop size 1 ml; pressure<br />
time 0.00 min; loop fille time 0.050 min; loop eq. time<br />
0.05 min; inject time 1.0 min. Internal standard was acetonitrile<br />
(retention time <strong>2.</strong>951 min). The MTBE retention time<br />
was 3.310 min. In experiment, headspace samples (100 μl)<br />
were taken with gas-tight syringes.<br />
The consumption of MTBE was measured in the beginning<br />
of the experiment and after 5; 12; 15 and 19 days.<br />
Results<br />
The soils of Oil Refinery Pancevo are heavy polluted<br />
with different organic substances and it can be expected to<br />
find out big diversity of fungus and bacteria whose use pollutants<br />
there as sole source of carbon and energy. During different<br />
experiments, about 40 bacteria and 14 different fungi<br />
strains were identified and isolated. One of the fungi founded<br />
there, after testing, showed high ability to consume MTBE.<br />
That fungus is isolated and identified as Paecilomyces variotii,<br />
isolate 129b, and used in experiments. Ours results<br />
showed that degradation rate was depending on initial MTBE<br />
concentration (10.85; 34.34 and 83.15 ppm used) and time
Chem. Listy, 102, s265–s1311 (2008) Environmental Chemistry & Technology<br />
of sampling. After 19 days of incubation, the degradation of<br />
initial middle (34.34) and high (83.15) MTBE concentration<br />
stopped, while the degradation of lowest MTBE concentration<br />
(10.85) continued after incubation period (Table I).<br />
Table I<br />
The decreasing of MTBE concentration (ppm) caused by fungal<br />
strain Paecilomyces variotii isolate 129b<br />
MTBE [ppm] 5th day 12 th day 15 th day 19 th day<br />
10.85 6.6 6.08 <strong>2.</strong>45 1.55<br />
34.34 33.5 23.34 19.19 20.2<br />
83.15 74.3 46.92 38.25 40.7<br />
Moreover, even different pattern of degradation the fungal<br />
strain of Paecilomyces variotii, isolate 129b, decreased<br />
MTBE concentration in all treatments used (Table II). The<br />
highest degradation rate (<strong>2.</strong>23 ppm per day) was in the treatment<br />
with the highest concentration used, (from 83.15 to<br />
40.70). In the middle treatment, the degradation rate decreased<br />
to 0.744 ppm per day and in lowest concentration the<br />
degradation rate further decrees to 0.490 ppm per day. However,<br />
the total MTBE degraded by fungi is to be in highest<br />
concentration used (4<strong>2.</strong>7 ppm for 19 days). From the Table III<br />
it can be seen that there is no substantial change in the fungus<br />
yields (mg/ml) compared treatments and control.<br />
Table II<br />
The MTBE degradation rate [%] caused by fungal strain<br />
Paecilomyces variotii isolate 129b<br />
MTBE 5th day 12 th day 15 th day 19 th day<br />
[ppm] [%] [%] [%] [%]<br />
10.85 39.2 44.0 77.4 85.7<br />
34.34 <strong>2.</strong>4 3<strong>2.</strong>0 44.1 41.2<br />
83.15 10.6 43.6 54.0 51.1<br />
The highest yield of Paecilomyces variotii mycelia was<br />
noticed at lowest initial MTBE concentration. The addition of<br />
MTBE slightly affects mycelia yield and is similar to control.<br />
The results of mycelia yield is in correlation with degradation<br />
results, because the highest mycelia yield is noticed in variant<br />
with lowest concentration used, but even that the difference<br />
among treatments are not statistically significant.<br />
Table III<br />
Paecilomyces variotii mycelia biomass after 19 days of<br />
MTBE treatments<br />
MTBE initial<br />
concentration<br />
repeats [mg ml –1 ]<br />
[ppm] I II III<br />
average<br />
[mg ml –1 ]<br />
10.85 0.010 0.026 0.037 0.024<br />
34.34 0.019 0.022 0.012 0.018<br />
83.15 0.018 0.025 0.014 0.019<br />
control 0.013 0.022 0.016 0.017<br />
s407<br />
The results of experiments showed that the fungal strain<br />
Paecilomyces variotii isolate 129b, is capable of MTBE utilization<br />
as sole source of carbon and energy to support growth.<br />
The highest MTBE degradation rate was at the lowest initial<br />
MTBE concentration. The addition of MTBE had a negative<br />
effect on degradation rate but total MTBE degraded was<br />
higher.<br />
Discussion<br />
Fungi are highly successful in survival because of their<br />
great physiological versatility. Their ability to produce extracellular<br />
enzymes is of great survival value. Fungi are involved<br />
in the biodegradation processes of undesirable materials<br />
(waste, pesticides, detergents, oil spills etc.) into harmless<br />
products 19 . The utilization of filamentous fungi for bioremediation<br />
processes has been limited compared with bacteria.<br />
Because of enzyme production in different environmental<br />
conditions, the fungi perform the degradation of broad<br />
spectrum of pollutants 20 . One of enzyme that is responsible<br />
for MTBE degradation is alcohol dehydrogenase 14 , who affects<br />
the TBF formation during the MTBE oxidation. Because<br />
of its gelatinolytic and cellulolytic activity, the fungus Paecilomyces<br />
variotii is capable of biodegradation of some aromatic<br />
volatile organic compounds (VOC) like toluene 21 , formaldehyde<br />
22 and alkylbenzenes 23 . In addition, recent reports<br />
showed that Paecilomyces variotii could be use in cadmium<br />
biosorption 24 and for bioremediation of aflatoxine 25 . Previous<br />
mycoremediation studies indicated that different fungal<br />
cultures have capability of MTBE biodegradation 15,16 .<br />
The results of investigation shown that Paecilomyces<br />
variotii mycelia can grow in the presence of different MTBE<br />
concentration. MTBE degradation rate is lowest in the latest<br />
phase of incubation period. This conclusion is in accordance<br />
with previous MTBE studies 14 , where the MTBE degradation<br />
rate progressively declined during the mycelia incubation<br />
with MTBE alone. Our experiments showed that the<br />
degradation rate was lower than in previous studies 14 , but the<br />
initial MTBE concentration was lower than in our investigation.<br />
The slower degradation rate was also possibly due to<br />
presence of methanol, which was solvent for MTBE. Other<br />
authors 15 also reported similar conclusion.<br />
The low degradation rate and yield of mycelia indicates<br />
that MTBE may be a poor substrate and energy source<br />
and/or that an intermediate during degradation may inhibit<br />
the microbial growth 12 . During the MTBE degradation, intermediates<br />
concentrations increased, while concentration of<br />
MTBE was decreased 26 . This conclusion confirms the MTBE<br />
degradation by microbial pure cultures. The results showed<br />
that ether bonds could be cleavage by certain microorganisms,<br />
although some investigations showed that this bond<br />
is not biodegradable or resistant to biodegradation 27 . According<br />
to this conclusion is a result of yield of Paecilomyces<br />
variotii mycelia, which was comparatively low. The low<br />
yield of microbial cultures in the presence of MTBE was also<br />
reported in earlier studies 28 , probably because this compound<br />
is metabolic and electron transport inhibitor 9 .
Chem. Listy, 102, s265–s1311 (2008) Environmental Chemistry & Technology<br />
This investigation confirms that the fungus Paecilomyces<br />
variotii isolate 129b can utilize the MTBE as a sole<br />
source of energy and carbon and could be use in degradation<br />
of recalcitrant contaminants such as the fuel oxygenates.<br />
Conclusions<br />
Based on these results following conclusions are<br />
obtained:<br />
• The degradation capability of Paecilomyces variotii isolate<br />
129b depend on initial MTBE concentration and on<br />
time of sampling.<br />
• During the experiment, the highest degradation rate was<br />
conducted at lowest initial MTBE concentration. After<br />
incubation period, the degradation of initial middle and<br />
high MTBE concentration stopped, while the degradation<br />
of lowest MTBE concentration continued.<br />
• The highest yield of Paecilomyces variotii mycelia was<br />
notices at lowest initial MTBE concentration, but even<br />
that the difference among treatments are not statistically<br />
significant.<br />
• The fungus Paecilomyces variotii isolate 129b can utilize<br />
the MTBE as a sole energy and carbon source and<br />
could be use in degradation of recalcitrant contaminants<br />
such as the fuel oxygenates.<br />
REFEREnCES<br />
1. Schmidt, T. C., Schirmer, M., Weiβ, H., Haderlein, S. B.:<br />
J. Contam. Hydrol. 70, 173 (2004).<br />
<strong>2.</strong> Krayer von Krauss, M., Harremoës, P.: Late Lessons<br />
from Early Warnings: The Precautionary Principle<br />
1896–2000. Environmental Issue Report, Vol. 2<strong>2.</strong> Office<br />
for Official Publications of the European Communities,<br />
Copenhagen. (2001).<br />
3. Johnson, R., Pankow, J., Bender, D., Price, C., and Zogorski,<br />
J.): Environ. Sci. Technol. 34, 210A. (2000).<br />
4. Hanson, J. R., Ackerman, C. E., Scow, K. M.: Appl.<br />
Environ. Microbiol. 65, 4788 (1999).<br />
5. Squillace, P. J., Zogorski, J. S., Wilber, W. G., Price,<br />
C. V. Environmental Science and Technology 30, 1721<br />
(1996).<br />
6. U.S. Environmental Protection Agency: Overview. EPA<br />
510-F-97-014. Office of Solid Waste and Emergency<br />
Response, Washington, DC (1998).<br />
7. Vidali, M.: Pure Appl. Chem. 73, 1163 (2001).<br />
8. Jensen, H. M., Arvin, E.: Contaminated soils ’90F<br />
(Arndt, M. Hinsenveld, and W. J. van den Brink (eds.),.<br />
Kluwer Academic Publishers, Dordrecht, The netherlands.<br />
445–448 (1990).<br />
s408<br />
9. Salanitro, J. P., Diaz, L. A., Williams, M. P., Wisniewski,<br />
H. L.: Appl. Environ. Microbiol. 60, 2593 (1994).<br />
10. Mormile, M. R., S. Liu, and J. M. Suflita.: Environ. Sci.<br />
Technol. 28, 1727 (1994).<br />
11. Yeh, C. K., and J. T. novak: Water Environ. Res. 66, 744<br />
(1994).<br />
1<strong>2.</strong> Mo, K., Lora, C. O., Wanken, A. E., Javanmardian, M.,<br />
Yang, X., Kulpa, C. F.: Appl. Environ. Microbiol. 47, 69<br />
(1997).<br />
13. Lalevic, B., Raicevic Vera, Kikovic, D., Jovanovic Lj.:<br />
Proceedings of XI Eco-conference, p. 271. novi Sad,<br />
(2007).<br />
14. Hardison, L. K., Curry, S. S., Ciuffetti, L. M., Hyman,<br />
M. R.: Appl. Environ. Microbiol. 63, 3059 (1997).<br />
15. Magaña-Reyes, M., Morales, M., Revah, S.: Biotechnol.<br />
Lett 27, 1797 (2005).<br />
16. Lalevic, B., Dabic, D., Raicevic, V., Kikovic, D., Jovanovic,<br />
Lj., niksic, M.: Mater. Prot. 3, 45 (2006).<br />
17. Peper, I. L., Gerba, C. P., Brendencke, J. W.: Acad. Press,<br />
San Diego, 11-33 (1995).<br />
18. Samson, R. A., Hoekstra, E. S., Frisvad, J. C. Baarn-<br />
Delft: Centraalbureau voor Schimmelcultures, Seventh<br />
edition (2004).<br />
19. Gopinath, S. C. B., Anbu, P., Hilda, A.: Mycoscience 46,<br />
119 (2005).<br />
20. Bennett, J. W., Faison, B. D.: Manual of Environmental<br />
Microbiology, Washington DC: ASM Press, 758–765<br />
(1997).<br />
21. Estevez, E., Veiga, M. C., Kennes, C.: J. Ind. Microbiol.<br />
Biotechnol. 32, 33 (2005).<br />
2<strong>2.</strong> Kondo, T., Morikawa, Y., Hayashi, n.: Appl. Microbiol.<br />
Biotechnol. 77, 995 (2008).<br />
23. Kennes, C., Veiga, M. C.: J. Biotechnol. 113, 305<br />
(2004).<br />
24. Chatterjee, n.: Thapar Institute of Engineering and<br />
Technology (Deemed University) PATIALA- 147 004<br />
(2006).<br />
25. El-Shiekh, H., Mahdy, H. M., El-Aaser, M.: Pol. J.<br />
Microbiol. 56, 215 (2007).<br />
26. Alimohammadi, M., Mesdaghinia, A. R., Mahmoodi,<br />
M., nasseri, S., Mahvi, A. H., nouri, J.: Iran J. environ.<br />
Health Sci. Eng. 2, 237 (2005).<br />
27. Erika, L. J., Christy, A. S., Kirk, T. O., Michael, R. H.:<br />
Appl. Environ. Microbiol. 70, 1023 (2004).<br />
28. Hristova, K., Gebreyesus, B., Mackay, D., Scow, K. M.:<br />
Appl. Environ. Microbiol. 69, 2616 (2003).
Chem. Listy, 102, s265–s1311 (2008) Environmental Chemistry & Technology<br />
P36 bIOLEAChING OF ANTIMONy MINERALS<br />
by bACTERIA ACiDiTHiObACillus<br />
ferrOOxiDANs AND DesulfOvibriO<br />
DesulfuriCANs<br />
ALEnA LUPTáKOVá a , EVA MAČInGOVá a , STEFAnO<br />
UBALDInI b and JAnA JEnČáROVá a<br />
Institute of Geotechnics of Slovak Academy of Sciences, Watsonova<br />
45, 043 53 Kosice, Slovak Republic,<br />
luptakal@saske.sk<br />
Introduction<br />
In several gold ores, gold is trapped in the matrix in of<br />
metallic sulphides (FeS 2 , Sb 2 S 3 etc.). In such cases recovery<br />
of gold from refractory ores requires a pre-treatment to liberate<br />
the gold particles from the host mineral. For the pre-treatment<br />
of gold ores exist several hydro- and biohydrometallurgical<br />
processes 1 . The fundamental of biohydrometallurgical<br />
processing for sulphide minerals is the application of microorganisms,<br />
which on the basis of their metabolic processes<br />
can increase or decrease mobility of metals 2,3,4 .<br />
In the area of biohydrometallurgical processing of goldbearing<br />
antimony sulphide minerals and concentrates the<br />
iron- and sulphur-oxidising bacteria have the very important<br />
function as well as on the ground the new knowledge also<br />
the sulphate-reducing bacteria 5,6,7 . Using involved bacteria<br />
to catalyse the breakdown of sulphides that host the gold<br />
is an important biological method for the pre-treatment of<br />
refractory gold ores. Following this biological treatment<br />
a combination of chemical and physical methods are used for<br />
leaching (e.g. the cyanide process) and concentration (e.g.<br />
the electrowinning) of gold. Although these methods are well<br />
accepted by industry, they harbour limitations in the processing<br />
of low-grade refractory ores, and regulatory agency/public<br />
acceptance of cyanide use. The objectives of this work<br />
were to evaluate the use of iron- and sulphur-oxidising bacteria<br />
Acidithiobacillus ferrooxidans (At. ferrooxidans) and<br />
sulphate-reducing bacteria Desulfovibrio desulfuricans (Dsv.<br />
desulfuricans) in the biohydrometallurgical processing of<br />
gold-bearing antimony sulphide minerals. Experiments were<br />
conducted at laboratory scale on a refractory gold-bearing<br />
stibnite coming from Santa Rosa de Capacirca Mine, Bolivia.<br />
Involved bacteria were used separately at different conditions<br />
for the pre-treatment of the aforementioned sample in order<br />
to increase the subsequent gold recovery during cyanidation<br />
processes. The At. ferrooxidans application is based on the<br />
their ability to oxidize and dissolve pyrite and stibnite, thus<br />
releasing the entrapped gold particles. The using of the bacteria<br />
Dsv. desulfuricans is based on their ability of the bacterially<br />
H 2 S production for the alkaline leaching of stibnite.<br />
Experimental<br />
M i c r o o r g a n i s m s<br />
In the experiment were used bacteria At. ferrooxidans<br />
isolated from the acid mine water 8 (deposit Smolník, Slovakia)<br />
and Dsv. desulfuricans isolated from the potable mineral<br />
s409<br />
water 9 (Gajdovka spring, Kosice, Slovakia). The isolation<br />
was performed by the modified dilution method 10 .<br />
S a m p l e s o f O r e<br />
The sample of gold-bearing antimony sulfide minerals<br />
used was obtained from Bolivia 6 (Santa Rosa de Capacirca<br />
Mine). Mineralogical characterisation by X-ray Diffraction<br />
(XRD) showed the presence of quartz (SiO 2 ), stibnite (Sb 2 S 3 )<br />
and pyrite (FeS 2 ). Their chemical composition includes<br />
21.93 % Si, 4.94 % Sb, 4.28 % Fe and 3.77 % (S). Quantitative<br />
chemical analysis was performed by Inductively Coupled<br />
Plasma Spectrometry (ICP).<br />
B i o l e a c h i n g T e s t b y B a c t e r i a<br />
Bacteria At. ferrooxidans and Dsv. desulfuricans were<br />
used separately. The experimental tests were conducted in a<br />
fed batch reactor at 30 °C under aerobic and dynamic conditions<br />
(with At. ferrooxidans) and anaerobic and static conditions<br />
(with Dsv. desulfuricans). The weight of the sample<br />
of gold-bearing antimony sulfide minerals was of 10 g. The<br />
total volume of feed solution consisted of 100 ml selective<br />
nutrient medium 1 9K(A) for At.f. with pH <strong>2.</strong>5; and DSM-63<br />
medium 10 for Dsv. desulfuricans with pH 7.5. The abiotic<br />
control was carried out without the bacteria application at<br />
the same conditions. Dissolved metals in liquid phase during<br />
the experiments were determined using an atomic absorption<br />
spectrophotometer. After 120 days the solid phases were<br />
recovered by filtration and were saved for the consequently<br />
test of cyanidation.<br />
Results<br />
The results of the bioleaching i.e. the pre-treatment of<br />
gold-bearing antimony sulphide minerals are demonstrated<br />
by Figs. 1.–4.<br />
Fig. 1. Dissolution of Fe by bacteria Acidithiobacillus ferrooxidans<br />
from the sample of gold-bearing antimony sulfide minerals.<br />
c – concentration of Fe, t – time of bioleaching,<br />
– Acidithiobacillus ferrooxidans, – abiotic control<br />
Fig. 1. presents the dissolution of the Fe by bacteria<br />
At. ferrooxidans and in the cases from the start until the end<br />
of experiments the concentration of Fe in liquid phase increase.<br />
From beginning, probably due to interaction between
Chem. Listy, 102, s265–s1311 (2008) Environmental Chemistry & Technology<br />
the mineral and the cultural medium and after 14 days by<br />
direct and indirect influence of bacteria At. ferrooxidans. This<br />
fact demonstrates the comparison of the Fe dissolution curve<br />
shape of At. ferrooxidans and abiotic control. It confirms the<br />
bioleaching of pyrite (FeS 2 ).<br />
Fig. <strong>2.</strong> Dissolution of the Sb by bacteria Acidithiobacillus ferrooxidans<br />
from the sample of gold-bearing antimony sulfide<br />
minerals. . c – concentration of Sb, t – time of bioleaching,<br />
– Acidithiobacillus ferrooxidans, – abiotic control<br />
Fig. 3. Influence of bacteria Desulfovibrio desulfuricans for the<br />
Fe dissolution under the alkaline leaching of gold-bearing antimony<br />
sulfide minerals. c – concentration of Fe, t – time of bioleaching,<br />
– Desulfovibrio desulfuricans, – abiotic control<br />
Fig. <strong>2.</strong> shows the trend of the Sb dissolving. Initially,<br />
during 7 days the concentration of Sb increases in the At. ferrooxidans<br />
presence and abiotic control, probably due to<br />
interaction between the mineral and the cultural medium. After<br />
7 days the abiotic control allocated the circa constant Sb<br />
concentration in liquid phase until the end. After 35 days was<br />
recorded the depression as follows was observed the decreasing<br />
of the Sb concentration until the end of experiments in<br />
the At. ferrooxidans presence. This fact can be interpreted on<br />
the bases the creation of the insoluble antimony oxosulphates<br />
– (SbO) 2 SO 4 according the reaction (1) 11 :<br />
s410<br />
Sb 2 S 3 + 6O 2 + 2H 2 O → (SbO) 2 SO 4 + 2H 2 SO 4<br />
Figure 3 presents the Fe concentration in liquid phase at<br />
the using bacteria Dsv. desulfuricans that was from beginning<br />
until the end almost zero. Although the little increase was<br />
observed after 19 days. This situation can be resolve by the<br />
Fe precipitation with bacterially produced hydrogen sulphide<br />
under the influence of bacteria Dsv. desulfuricans After 40<br />
days it’s the intense increase was recorded in the experiments<br />
without bacteria. Just now concerning this fact we have not<br />
the adequate understanding. At the end of the experiments the<br />
Fe concentration at presence SRB and abiotic control were<br />
again almost zero.<br />
Figure 4 shows the Sb concentration in the liquid phase<br />
at the using bacteria Dsv. desulfuricans From the confrontation<br />
of the Sb concentration curve shape in the abiotic control<br />
and in the presence bacteria you can see that the influence of<br />
bacteria Dsv. desulfuricans was not significant. The contamination<br />
of the abiotic control by bacteria Dsv. desulfuricans<br />
was not evidence. After 20 days was observed the formation<br />
of the shined cover on the reactor wall in the presence bacteria.<br />
Its can be explain to the Sb concentration decreasing.<br />
Fig. 4. Influence of bacteria Desulfovibrio desulfuricans for the<br />
Sb dissolution under the alkaline leaching of gold-bearing antimony<br />
sulfide minerals. c – concentration of Sb, t – time of bioleaching,<br />
– Desulfovibrio desulfuricans, – abiotic control<br />
After ending the solid phases were recovered by filtration<br />
from solution. The solid phases were saved for the<br />
consequently test of cyanidation and liquid phases for the<br />
electrowinning.<br />
Conclusions<br />
Experimental studies confirmed:<br />
• the bacteria At. ferrooxidans have the positive influence<br />
on the dissolving of pyrite (FeS2 ) and stibnite (Sb2S3 )<br />
to occur in the used sample of gold-bearing antimony<br />
sulphide minerals,<br />
• the increase, subsequent the depression and the decreasing<br />
of the Sb concentration during the bioleaching<br />
(1)
Chem. Listy, 102, s265–s1311 (2008) Environmental Chemistry & Technology<br />
•<br />
experiments with bacteria At. ferrooxidans can be interpret<br />
on the bases the creation of the insoluble antimony<br />
oxosulphates – (SbO) 2 SO 4 ,<br />
the bacteria Dsv. desulfuricans does not show the<br />
expressive influence for the alkaline leaching antimonybearing<br />
materials.<br />
This work was supported by the Slovak Research and<br />
Development Agency under the contract No. APVV-51-<br />
027705, Slovak Grant Agency VEGA No. 2/0075/08 and Slovak<br />
– Italian bilateral project.<br />
REFEREnCES<br />
1. Karavajko G. I., Rossi G., Agate A. D., Groudev S. G.,<br />
Avakyan Z. A.: Biogeotechnology of metals. Centre of<br />
projects GKnT, Moscow 1988.<br />
<strong>2.</strong> Gadd G. M.: Curr. Opin. Biotechnol. 11, 271 (2000).<br />
3. Kadukova J., Stofko M.: Environmetálne biotechnológie<br />
pre hutníkov. Equilibria s.r.o., Kosice 2000.<br />
4. Poulin R., Lawrence R. W.: Miner. Eng. 9, 799 (1996).<br />
5. Solozhenkin P. M., Lyalikova-Medvedeva n. n.: J. of<br />
Mining Sci. 37, 534 (2001).<br />
s411<br />
6. Ubaldini S., Veglio F., Toro L., Abbruzzese C.: Miner.<br />
Eng. 13, 1641 (2000).<br />
7. Solozhenkin P. M., nebera V. P.: Proc. of 15th International<br />
Biohydrometallurgy symposium: Biohydrometallurgy:<br />
a sustainable technology in evolution (Tsezos<br />
M., Hatzikioseyian A., Remoudaki E., eds.), p.10. national<br />
Technical University of Athens, Zografou, Athens<br />
2004.<br />
8. Luptakova A., Kusnierova M.: Proceedings of 2nd<br />
International Conference on Environmental Research<br />
and Assessment (Patroescu M., Matache M., ed.), p. 254.<br />
Bucharest 2006.<br />
9. Luptáková A., Kušnierová M., Fečko P.: Minerálne biotechnológie<br />
II., sulfuretum v prírode a v priemysle. ES<br />
VŠB – TU Ostrava, Ostrava 200<strong>2.</strong><br />
10. Ronald M. A.: Principles of Microbiology. Mosby, new<br />
York 1995.<br />
11. Postgate J. R.: The sulphate-reducing bacteria. Cambridge<br />
University Press, Cambridge 1984.<br />
1<strong>2.</strong> Lyalikova n. n.: Trans. Mosc. Soc. 24, 11 (1966).
Chem. Listy, 102, s265–s1311 (2008) Environmental Chemistry & Technology<br />
P37 ThE RECLAMATION OF CALCIuM<br />
SuLPhATE SLuDGES by SuLPhATE-<br />
REDuCING bACTERIA<br />
ALEnA LUPTáKOVá a and MáRIA KUŠnIEROVá a<br />
Institute of Geotechnics of Slovak Academy of Sciences, Watsonova<br />
45, 043 53 Kosice, Slovak Republic,<br />
luptakal@saske.sk<br />
Introduction<br />
Combustion of fossil fuels containing sulfur releases<br />
sulfur oxides to the atmosphere. If lime or limestone scrubbing<br />
desulfurizes combustion gases, calcium sulfates sludges<br />
are generated and these must be disposed of. Many processes<br />
for their treatment have been developed. Under appropriate<br />
conditions these sulfate can be converted to sulfide by the<br />
anaerobic bacterial sulfate reduction, which is the basic metabolic<br />
process of sulfate-reducing bacteria (SRB).<br />
The SRB represent a group of chemoorganotrophic<br />
and strictly anaerobic bacteria that may be divided into four<br />
groups based on rRnA sequence analysis 1 : Gram-negative<br />
mesophilic SRB, Gram-positive spore forming SRB, thermophilic<br />
bacterial SRB and thermophilic archaeal SRB. They<br />
include genera like Desulfovibrio, Desulfomicrobium, Desulfobacter,<br />
Desulfosarcina, Desulfotomacullum, Thermodesulfobacterium,<br />
Archaeoglobus, etc.<br />
Considering the inorganic or organic character of energy<br />
source of SRB there are two types of anaerobic respiration<br />
of sulfates authotrophic and heterotrophic 2 . SRB produce<br />
a considerable amount of gaseous hydrogen sulfide, which<br />
reacts easily in the aqueous solution with heavy metal, forming<br />
metal sulfides that have low solubility. In the bacterial<br />
anaerobic reduction of sulfates the organic substrate (lactate,<br />
malate, etc.) or gaseous hydrogen is the electron donor and<br />
sulfates is the electron acceptor.<br />
The industrial technologies for the desulfurization<br />
of combustion products produced during the generation<br />
of electric energy by combustion of fossil fuels use limestone<br />
(CaCO 3 ) as an absorption agent. The desulfurization<br />
of combustion products proceeds in the absorber in several<br />
stages. This process results in the formation of gypsum suspension<br />
(CaSO 4 . 2H2 O) which is incorporated into the final<br />
stored product – “stabilizate” – after being treated together<br />
with other wastes (ash, burnt lime, desulphurization waste<br />
water, etc.).<br />
The objective of our study was to verify experimentally<br />
the possibility of using gypsum contained in the above-mentioned<br />
“stabilizate” as the source of electron acceptors for the<br />
growth of SRB with the prospect of the recycling of desulfurization<br />
agent – limestone.<br />
Experimental<br />
M i c r o o r g a n i s m s<br />
A culture of SRB (genera Desulfovibrio and Desulfotomaculum)<br />
was obtained from drinking mineral water<br />
Gajdovka (locality Kosice-north, Slovak Republic). For the<br />
s412<br />
isolation and cultivation of these bacteria a selective nutrient<br />
medium (DSM-63 – Postgate′s C medium) was used 3 .<br />
L i q u i d P h a s e<br />
The feed solution (the selective nutrient medium (DSM-<br />
63 – Postgate’s C medium without sulfates) was prepared by<br />
dissolving analytical grade salts such as: K 2 HPO 4 0.5 g dm –3 ,<br />
nH 4 Cl 1 g dm –3 , CaCl 2 . 6H2 O 0.1 g dm –3 , MgCl 2 . 6H2 O<br />
0.3 g dm –3 , C 3 H 5 O 3 na <strong>2.</strong>0 g dm –3 , C 2 H 3 O 2 Sna 0.1 g dm –3<br />
and C 6 H 8 O 6 0.1 g dm –3 in distilled water.<br />
S o l i d P h a s e<br />
The sample of “stabilizate“ from Vojany power plant<br />
(Slovak Republic) was used in the experiments. Mineralogical<br />
characterisation by X-ray Diffraction (XRD) showed the<br />
presence of CaSO 4 40.84 %, SiO 2 2<strong>2.</strong>70 %, Al 2 O 3 10.70 %,<br />
Fe 2 O 3 4.26 % and CaO 3.00 %.<br />
A n a l y t i c a l P r o c e d u r e s<br />
A turbidimetric method was used to measure the concentration<br />
of soluble sulfate ion concentrations in the<br />
liquid phase 4 . Samples were centrifuged for 10 minutes at<br />
10,000 rpm before performing the analysis. Digital pH-<br />
meter GPRT 144 AGL was used. Qualitative changes of<br />
“stabilizate” were performed by the qualitative X-ray diffraction<br />
analysis using Dron-2 instrument and energy dispersive<br />
spectrometry (EDS) analysis using instruments, which consisted<br />
of a scanning electron microscope BS 300 and an X-ray<br />
microanalyser EDAX 9100/60. Samples of solid phase were<br />
dried and coated with gold before the EDS analysis.<br />
B i o l o g i c a l U t i l i z a t i o n o f G y p s u m<br />
f r o m “ S t a b i l i z a t e ”<br />
Series of anaerobic tests were studied in a fed batch<br />
reactor in the thermostat at 30 °C. Samples of “stabilizate”<br />
were kept in static conditions for a period of 40 days at pH<br />
7.5. The weight of “stabilizate“ was 20 g. The stock culture<br />
of SRB was used as an inoculum (10 %, v/v). The total<br />
volume of feed solution consisted of 200 ml distilled water<br />
and 300 ml selective nutrient medium for SRB (DSM-63<br />
– Postgate’s C medium without sulfates). The abiotic control<br />
was carried out without the SRB application at the same<br />
conditions. After 40 days the solid phase was filtered, dried<br />
and analyzed using the qualitative X-ray analysis and energy<br />
dispersive spectrometry (EDS) analysis.<br />
Results<br />
The formation of black precipitates and the sensorial detection<br />
of classical strong H 2 S smell were observed after 3–4<br />
days from the beginning of the process. These remarks were<br />
not detected in the abiotic control until the end of the experiment.<br />
Changes of sulphates concentration during the discontinuous<br />
cultivation of sulphate-reducing bacteria using gypsum<br />
contained in the “stabilizate” as the source of electron acceptors<br />
for the growth of SRB are shown in Fig. 1. The results of<br />
qualitative X-ray diffraction analysis of original “stabilizate”,
Chem. Listy, 102, s265–s1311 (2008) Environmental Chemistry & Technology<br />
bacterially treated “stabilizate” and “stabilizate” of abiotic<br />
control are shown in Figs. <strong>2.</strong>–4. They show the significant<br />
qualitative changes in the “stabilizate” initiated by SRB. The<br />
sulfates from the original major component of “stabilizate”<br />
– CaSO 4 . 2H2 O (Fig. <strong>2.</strong>) – were reduced according by SRB<br />
forming hydrogen sulfide as proved by the sensorial detection<br />
of classical strong H 2 S smell. This is indirectly confirmed by<br />
Fig. 3, which proves the extinction of CaSO 4 and formation<br />
of CaCO 3 according to equation (1):<br />
SRB<br />
2C 3 H 5 O 3 na + CaSO 4 → 2CH 3 COOna + CO 2 +<br />
CaCO 3 + H 2 S + H 2 O<br />
The above-mentioned changes have not been observed<br />
in abiotic control as documented by the comparison of qualitative<br />
X-ray analysis of “stabilizate” before applying SRB<br />
(Fig. <strong>2.</strong>) with the qualitative X-ray analysis of “stabilizate”<br />
in abiotic control (Fig. 4.). The results of energy dispersive<br />
spectrometry (EDS) analysis and scanning electron microscope<br />
of original “stabilizate”, bacterially treated “stabilizate”<br />
and “stabilizate” of abiotic control are shown in Figs. 5.–7.<br />
They fall into line with Figs. <strong>2.</strong>, 3. and 4. and suggest on the<br />
Fig. 1. Changes of sulfates concentration during the discontinuous<br />
cultivation of sulfate-reducing bacteria.<br />
c – sulfates concentration, t – time of sulfate-reducing bacteria<br />
cultivation, – “stabilizate” with SRb, – “stabilizate” without<br />
SRb (abiotic control)<br />
Fig. <strong>2.</strong> Qualitative x-ray analysis of “stabilizate” before application<br />
of sulfate-reducing bacteria. I – intenzity, u – 2-theta<br />
uhol, 1 – CaSO 4 . h2 O, 2 – SiO 2<br />
(1)<br />
s413<br />
elimination of CaSO 4 . 2H2 O form “stabilizate”. The element<br />
composition of solid phases (Figs. 5., 6. and 7.) accepts with<br />
this fact.<br />
Fig. 3. Qualitative x-ray analysis of solid phase formed by the<br />
effect of SRb on “stabilizate”. I – intenzity, u – 2-theta uhol,<br />
1 – CaCO 3 , 2 – SiO 2<br />
Fig. 4. Qualitative x-ray analysis of solid phase in abiotic con-<br />
Fig. 5. EDS qualitative analysis of “stabilizate” before application<br />
of sulfate-reducing bacteria
Chem. Listy, 102, s265–s1311 (2008) Environmental Chemistry & Technology<br />
Fig. 6. EDS qualitative analysis of solid phase formed by the<br />
effect of SRb on“stabilizate”<br />
Conclusions<br />
The results confirmed the theoretical assumptions on the<br />
use of gypsum, which forms the substantial component of<br />
“stabilizate”, as the source of sulphate for sulphate-reducing<br />
bacteria, which produce hydrogen sulphide in the process of<br />
bacterial reduction of sulphates. They also showed the possibility<br />
of recycling desulphurization agent – limestone.<br />
This work was supported by the Slovak Research and<br />
Development Agency under the contract No. APVV-51-<br />
027705, Slovak Grant Agency VEGA No. 2/0075/08 and Slovak<br />
– Italian bilateral project.<br />
s414<br />
Fig. 7. EDS qualitative of solid phase in abiotic control<br />
REFEREnCES<br />
1. Castro H. F., Williams n. H., Ogram A.: FEMS Microbiol.<br />
31, 1 (2000).<br />
<strong>2.</strong> Odom J. M., Rivers Singleton J. R.: The sulphate-reducing<br />
bacteria Contemporary Perspectives, Springer-<br />
Verlag, new York 1993.<br />
3. Karavajko G. I., Rossi G., Agate A. D., Groudev S. G.,<br />
Avakyan Z. A.: Biogeotechnology of metals. Centre of<br />
projects GKnT, Moscow 1988.<br />
4. APHA, Standard Methods for the Examination of Water<br />
and Wastewater, 17 th edition, American Public Health<br />
Association, USA, Washington D. C., 1989.
Chem. Listy, 102, s265–s1311 (2008) Environmental Chemistry & Technology<br />
P38 bIOLOGICAL-ChEMICAL REGENERATION<br />
OF DESuLPhuRIZATION SORbENTS bASED<br />
ON ZINC FERRITE<br />
MáRIA KUŠnIEROVá, ALEnA LUPTáKOVá,<br />
VLADIMíR ŠEPELáK and MáRIA PRAŠČáKOVá<br />
Institute of Geotechnics SAS, Watsonova 45, 043 53 Kosice,<br />
Slovak Republic,<br />
kusnier@saske.sk<br />
Introduction<br />
The energetic demands of people in present, as well<br />
as in the future will be supplied mainly by the energy from<br />
the fossil sources, which is accompanying with the negative<br />
impact on the environment in the form of emissions of sulphate<br />
and carbonate compounds. For desulphurization and<br />
decarbonization of these emissions more commercial technological<br />
methods have been developed, to which belongs<br />
also the utilization of solid sorbents (filters) based on the zinc<br />
ferrite. The studies of Grindly 1 and Krisham 2 helped to clear<br />
up the high-temperature process of desulphurization of waste<br />
gases after coal combustion which can be described by the<br />
chemical equation:<br />
3ZnFe 2 O 4 + 3 H 2 S + H 2 → ZnS + 2FeS + 4H 2 O (1)<br />
In dependence on the conditions of the combustion process<br />
there is according to the Lamoreaux 3 a possibility of a<br />
occurring of another reaction of the iron (occurring in the<br />
solid sorbents) with waste gases of carbon, leading to formation<br />
of carbide. This is governed by the equations:<br />
3FeO + CO → Fe 3 C + 2O 2<br />
3Fe + CO → Fe 3 C + ½O 2<br />
The phase composition of sulphurized (amortised) sorbents<br />
shows the presence of sulphidic and carbidic structures<br />
located mainly on the surface of particles of zinc ferrite<br />
(respectively Zn Fe 2 O 3 – micropellets of zinc ferrite). They<br />
became inactive and the further utilization is constrained to<br />
their regeneration. In relation with the most effective methods<br />
of manifold recycling of sorbents, several methods of their<br />
regeneration were studied.<br />
The literature shows two methods of regeneration of<br />
sulphatizing sorbents based on zinc ferrite. The first method<br />
commercially used, is a oxidising pyrolysis of sulphides 2 . In<br />
this process are the sulphidic structures in dependence on the<br />
temperature of the oxidising rousting transformed step by<br />
step at the first stage to the sulphates and at the second stage<br />
which corresponds to the temperature of sulphates decomposition<br />
(in the temperature range from 480 to 600 °C) to the<br />
oxides, according to the equations (4) and (5):<br />
2FeS + 3.5O 2 → Fe 2 O 3 + 2SO 2<br />
(2)<br />
(3)<br />
(4)<br />
s415<br />
ZnS + 1.5O 2 → ZnO + SO 2<br />
The second method of the regeneration of desulphurization<br />
sorbents which is introduced by Sakao 4 , is based on the<br />
principle of pressure leaching of ZnS in water environment at<br />
the temperature over 550 °C. This method is described by the<br />
equation, almost identical with the Eq. (5):<br />
ZnS + 1.5O 2 → ZnO + SO 2<br />
The commercially available technologies of sulphides<br />
processing and treatment (as sources of colour and rare<br />
metals) have nowadays started with utilization of biologicalchemical<br />
processes (bio-leaching); where the physical and<br />
chemical base of degradation of sulphidic structures is identical<br />
with the methods of regeneration of desulphurization<br />
sorbents mentioned above.<br />
The principle of all mentioned methods is the process of<br />
sulphides oxidation with utilization of various methods of catalysis.<br />
In the process of thermic regeneration is the oxidising<br />
reaction catalysed by the thermic energy, at pressure leaching<br />
by the pressure and temperature.<br />
The aim of this paper is to testify the biological-chemical<br />
method as a new method of sorbents regeneration, utilising<br />
the catalytic effect of the metabolism of an acidophilous bacteria<br />
– Thiobacillus ferrooxidans, oxidising the sulphate and<br />
iron 8 .<br />
Experimental<br />
M a t e r i a l<br />
Zinc ferrite<br />
For biological-chemical regeneration, zinc ferrite after<br />
sulphurization test was used.The powder sample containing<br />
90 % zinc ferrite and 10 % bentonite binder by weight was<br />
pelletized to cylindrical pellets, calcined in air from room<br />
temperature to 970 K, and crushed and sieved to the size<br />
of a stainless steel cylinder, in which 25 g of pelletized sorbent<br />
was packed.The simulated coal gas had the following<br />
composition: 30 % vol. CO, 50 % vol. n 2 , 19.5 % vol. H 2 ,<br />
and 0.5 % vol. H 2 S. Total gas flow-rate diring absoption was<br />
5,000 cm 3 min –1 . The desulphurization tests were stopped<br />
when the H 2 S concentration of the effluent gas was above<br />
50 ppm. The details of the sulphurization experiments are<br />
described also in our previous papers 6,7 .<br />
bacteria<br />
The bacteria used in experiments was: Thiobacillus<br />
ferrooxidans, isolated from the mining drainage waters of<br />
sulphides deposits, which is cultivated for a long time on<br />
the sphalerite (ZnS) substrates. The leaching solution was<br />
formed by cultivated medium according to the Silverman<br />
and Lundgren 5 , in which the cells of bacteria were scattered.<br />
The pH value of the solution at the beginning of the reaction<br />
was 1.6.<br />
(5)<br />
(6)
Chem. Listy, 102, s265–s1311 (2008) Environmental Chemistry & Technology<br />
M e t h o d s<br />
The experiments of biological-chemical way of regeneration<br />
were realized by the form of charge leaching tests at<br />
the suspension density 5 % at the temperature of 30 °C, under<br />
continuos stirring for the period of 19 days. The qualitative<br />
changes of investigated zinc ferrite during the process of biologico-chemical<br />
way of regeneration were evaluated by:<br />
• RTG diffraction analysis (diffractometer DROn 2,0<br />
Technsabexport, Russian, FeKa radiation),<br />
• particle size distribution (granulometer Helos and Rodos,<br />
Sympatec GmbH Claustahl Zellerfeld),<br />
• BET adsorption method for measuring the adsorption<br />
surface (Micromeritics, Gemini 2360, in nitrogen atmosphere),<br />
• chemical analysis of the content of Zn and Fe in the<br />
leach (atom absorption spectroscopy on the instrument<br />
Spectra AA-30 ,Varian, Australia).<br />
Results<br />
RTG diffraction analysis of amortised sorbents revealed<br />
except of the rest ferrite zinc (Franklinite, ZnFe 2 O 4 ), which<br />
represents probably the nonreacted cores of micropelets, also<br />
the presence of the formed sulphidic, sulphate, oxidic and<br />
carbidic compounds: b-sphalerite (ZnS), wurtzite (ZnS with<br />
addition of Fe), pyrite (FeS 2 ), melanterite (FeSO 4 . 9H2 O),<br />
elemental sulphur (S), magnetite (Fe 3 O 4 ), hematite (a-Fe 2 O 3 )<br />
and cohenite (Fe 3 C).<br />
The bio-leaching of this product leads to the biologicochemical<br />
degradation of amortised layers located on the surface,<br />
which is accompanied by the extraction of Zn and Fe<br />
to the leach. The changes of the concentration of introduced<br />
elements in the leach in dependence on the time of leaching<br />
are shown in Table I.<br />
The concentration of Zn in the leach during the observed<br />
time interval showed the arising trend, while in the Fe concentration<br />
dependence has been appeared the maximum (after<br />
15 days the concentration of the leached ferrite decreased).<br />
As the realized experiments represent the spontaneous<br />
non-regulated process of biologico-chemical oxidation, it is<br />
possible to assume that the decrease of the Fe concentration<br />
Table I<br />
The time dependence of changes of Zn and Fe concentration<br />
in the leach during the biological-chemical regeneration of<br />
amortised sorbents based on zinc ferrite<br />
Time leaching Concentration Concentration<br />
[days] Fe [g dm –3 ] Zn [g dm –3 ]<br />
0 0.37 0.62<br />
3 0.37 1.21<br />
5 1.48 1.56<br />
7 1.50 1.73<br />
10 1.39 <strong>2.</strong>68<br />
14 0.52 <strong>2.</strong>81<br />
17 0.55 <strong>2.</strong>97<br />
19 0.61 3.19<br />
s416<br />
Fig. 1. Comparison of x-ray phase analysis of zinc ferrite sorbent,<br />
A – primary, b – pasivated, C – biologically and chemicaly<br />
regenerised<br />
Legend: w – wurtzite, F – franclinite, S – sphalerite<br />
was caused by the precipitation of the secondary oxididic<br />
compositions of the iron. This assumption has been confirmed<br />
by the RTG diffraction analysis of the leach. After finishing<br />
the biological-chemical leaching of amortised sorbent the<br />
extinction of the most of secondary structures formed by<br />
sorption of sulphate compositions was observed by the RTG<br />
method (Fig. 1.).<br />
The regenerated sample contained the franklinite, addition<br />
of magnetite, metal zinc and the rest of wurtzite, which<br />
during the observed period manifested itself as refractory<br />
mineral and to its destruction the longer period or the change<br />
of electrochemical conditions of leaching should be needed 9 .<br />
Referring to the reality, that the effectivity (the sorption<br />
capacity) of sorbents is directly connected with the sizes<br />
of their surfaces and inversely with the particles sizes, the<br />
changes of these parameter were also studied (Fig. <strong>2.</strong>). The<br />
process of biological-chemical regeneration caused intense<br />
changes in the adsorption surface of sorbents, it has changed<br />
from the value of <strong>2.</strong>8245 m 2 g –1 at amortised sample to the<br />
value of 6.2543 m 2 g –1 at the regenerated sample.<br />
The expressive change was also registered at the distribution<br />
of the particles sizes. The value of mean particle<br />
diameter has decreased from the value of 9 mm at amortised<br />
sorbent to <strong>2.</strong>19 mm at the regenerated sorbents (Table II).
Chem. Listy, 102, s265–s1311 (2008) Environmental Chemistry & Technology<br />
A<br />
B<br />
C<br />
Fig. <strong>2.</strong> Mophology of surface of the zinc ferrite sorbent, A – primary,<br />
b – pasivated, C – biological and chemical regenerised<br />
Conclusions<br />
The presented results confirm the possibility of utilization<br />
of the biological-chemical method as a new regeneration<br />
method of desulphurization sorbents based on zinc ferrite.<br />
The big advantage of this process in comparison with conventional<br />
regeneration methods is the lowering of the temperature<br />
of leaching from 500°C to 30°C. The period of the<br />
duration of the regeneration seems to be an disadvantage, its<br />
lowering requires the additional research aimed at the con-<br />
s417<br />
Table I<br />
Comparison of the selected fysical and chemical charakteristic<br />
of the zinc ferrite sorbents before and after biological and<br />
chemical regeneration<br />
Specific Surfaces<br />
Average of<br />
Sample surface SA factor f *<br />
particles<br />
[m2 g –1 ] d50 [μm]<br />
primary<br />
sorbent<br />
pasivated<br />
sorbent<br />
regenerised<br />
sorbent<br />
<strong>2.</strong>6 1.022 4.77<br />
<strong>2.</strong>8 1.478 9.10<br />
6.2 1.797 <strong>2.</strong>19<br />
tinual optimalization of conditions for biologico-chemical<br />
regeneration.<br />
This work was supported by the Slovak Research and<br />
Development Agency under the contract No. APVV-51-<br />
027705.<br />
REFEREnCES<br />
1. Grindley T., Steinfeld G.: Proceedings. 4 th Annual<br />
Contractor ´s Meeting on Contaminant Control in Hot<br />
Coal-Derived Gas Streams. U. S. Department of Energy/<br />
METC. Morgantown, WV. DOE/ METC, 85-3, pp. 314-<br />
446. Morgantown 1984.<br />
<strong>2.</strong> Krishan G. n.,Tong G. T., Lamoreaux R. H., Brittain R.<br />
D.: Wood B.J.: Proceedings of Fifth Annual Contractor´s<br />
Meeting on Contaminant Contro in Hot Coal-Derived<br />
Gas Streams. U. S. Department of Energy/METC. Morgantown,<br />
WV. DOE/ METC-85/6025, pp. 6-18. Morgantown<br />
1985.<br />
3. Lamoreaux R.M., Brittain R.D., Zieger J., Leach. S.C.:<br />
Determination of Solid Phase Boundaries in Coal Gas<br />
Desulfurization by Zinc Ferrite., U. S. Department of<br />
Energy/METC. Technical Report DOE/MC 21096-219<strong>2.</strong><br />
Morgantown, WV, 1986.<br />
4. Sasaoka E., Hatori M., Sada n., Uddin A.: Ind. Eng.<br />
Chem. Res. 39, 3844 (2000).<br />
5. Buchanan R. E. and Bigons n. E. Bergy´s Manual of<br />
Determinative Bacteriology., 8 th ed., Baltimore, 1974.<br />
6. Wutzer R., Steinike U., Lorenz P., Rossahl,B.: Brennstoff-Wärme-Kraft<br />
45, 477 (1993).<br />
7. Šepelák V., Rogachev Yu., Steinike U., Uecker D. Ch.,<br />
Krumeich F., Wissmann S., Becker K. D.: Brennstoff-<br />
Wärme-Kraft 48, 1996, 28.<br />
8. Barret J., Hughes M. n., Karavajko G. I., Spencer P. A.:<br />
Metal extraction by bacterial oxidation of minerals. Eôis<br />
Horwood, new York, London, Toronto, Sydney, Tokyo,<br />
Singapore, 1996.<br />
9. Baláž P., Kušnierová M., Varencova V. I., Mišura B.: J.<br />
Miner. Process. 40, 273 (1994).
Chem. Listy, 102, s265–s1311 (2008) Environmental Chemistry & Technology<br />
P42 CAuSES OF ACCIDENTS REGARDING<br />
TRANSPORT OF DANGEROuS GOODS<br />
JAnA VICTORIA MARTInCOVá a , IVAn MAŠEK a and<br />
JIří MARTInEC b<br />
a Faculty of Chemisty Brno, University of Technology, Purkyňova<br />
118, 612 00 Brno, Czech Republic,<br />
b Clean Energies Unit, Institute for Energy, JRC, 1755 ZG<br />
Petten, The Netherlands,<br />
platina@email.cz<br />
Introduction<br />
Transport of dangerous substances can be characterized<br />
by a permanent or relative contact with the population and<br />
represents in all possible stages a potential hazard. Related<br />
to human health, injury or death people during accidents<br />
also damage to property and the affected environment, the<br />
transport of dangerous goods is very serious problem. Road<br />
– accidents in hazardous materials transportation have increased<br />
95 % in the last 30 years. This negative feature of the<br />
excessive traffic is evident due to available statistics of the<br />
accidents in the whole Europe. Besides the noticeable number<br />
of accidents in the cases related to the transport of dangerous<br />
substances the economical point of view in increasing<br />
costs is under general concern.<br />
The most frequented transportation regarding dangerous<br />
goods is on the roads in the Europe.<br />
Results<br />
Accident registration has been launched in 2000 in the<br />
Czech Republic by the traffic police. Data from 2000 to 2002<br />
are not very precise because of administration faults. Data<br />
registered since 2003 has been more precise.<br />
As an example of main causes of accidents the accident<br />
frequency in 2003 and 2004 were used – regarding accidents<br />
conform to the directive ADR (European Agreement Concerning<br />
the International Carriage of Dangerous Goods by<br />
Road). There was a new code system regarding causes of<br />
accidents used. Previous code system included causes and<br />
their consequences related to the hazard. The new system<br />
Fig. 1. Main cause of accident, 2003<br />
s418<br />
is focused only on the main cause of accident. The aim of the<br />
system is the minimal and concise list of codes.<br />
All results regarding causes of accidents were worked<br />
out by cooperation with Police of the Czech Republic.<br />
Figs. 1. and <strong>2.</strong> show the main causes of ADR accidents<br />
which are evident.<br />
Fig. <strong>2.</strong> Main cause of accident, 2004<br />
1 – overtaking, 2 – side-on crash, 3 – speeding (not keep a safe distance),<br />
4 – driver did not adapt speed (to condition and character<br />
of a road, cargo character, skills of a driver, character of a car), 5<br />
– poor attention of a driver (skid, crashing into a barrier, off the<br />
road, collision with a car, a stationary car, a driving car, collision<br />
with a pedestrian, collision with a bicycle), 6 – while reversing, 7<br />
– uncontrolled driving of truck set, 8 – driving roadside, 9 – not<br />
respecting railway signals, 10 – turning round, 11 – technical<br />
fault (on the vehicle, on the vehicle set), 12 – turning off, 13 –<br />
non-acquaintance with or bad judgment of the size of the truck,<br />
14 – crash with upstream driving car, 15 – bad fixation of a<br />
cargo, 16 – falling asleep, micro-sleep, 17 – not respecting traffic<br />
signs (“right of way”, prohibitive), 18 – not giving right of way,<br />
19 – bad driving in the traffic lane (side-on crash, inadvertence<br />
of the parallel driving car), 20 – character of the road, damage of<br />
the road, 21 – contrary climatic conditions, 22 – impaired driving,<br />
23 – cause is unknown<br />
Reasons of accidents are mostly the same when considering<br />
small cars or trucks. The main reasons are human<br />
error; poor attention of drivers and their reactions and no<br />
acceptance of the speed limit.<br />
The experience of drivers is crucial and each company (transporting<br />
dangerous goods according to the ADR) should have a<br />
possibility to check driver’s crime sheet regarding accidents and<br />
other offences.<br />
From the figures below the age of drivers causing<br />
accidents is evident. The statistic results from years 2003 and<br />
2004 for construction of Figs. 3. and 4. were used.<br />
From the mentioned results is evident, that the age of<br />
drivers has no effect on the accident frequency (ADR) or<br />
the cause. In fact many of available studies show relation<br />
between frequency of accidents (regarding total number of<br />
car accidents) and age drivers.
Chem. Listy, 102, s265–s1311 (2008) Environmental Chemistry & Technology<br />
Fig. 3. Age of drivers during accidents, 2003<br />
Fig. 4. Age of drivers during accidents, 2004<br />
Conclusions<br />
The Czech Republic is one of the countries with the largest<br />
accident frequency and high number of deaths of people<br />
s419<br />
during accidents. Reasons for accidents are mostly the same<br />
when considering small cars or trucks. The main reason is<br />
human error – insufficient attention of drivers and their reactions,<br />
further more no acceptance of the speed limit.<br />
Substances included in the group of flammable substances<br />
(according with European ADR directive) represent the most<br />
frequently transported dangerous materials on the roads. A risk<br />
assessment for dangerous substances is performed using different<br />
kinds of methods. In order to propose and create methods for the<br />
safe transport of dangerous goods is at first necessary to perform<br />
an extensive analysis of the existing situation. Methods must be<br />
also focused, made relevant to different localities and the industry<br />
to represent different surroundings. More strict penalties could be<br />
applied. The experience of drivers is crucial and each company<br />
(transporting substances according to ADR) should have to check<br />
drivers’ crime sheet regarding accidents and other offences and<br />
also prove their skills.<br />
There is possibility to improve the situation through our preparedness,<br />
self-education, and interest regarding the problem.<br />
REFEREnCES<br />
1. Police of the Czech Republic, Statistics.<br />
<strong>2.</strong> United nations Economic Commission for Europe:<br />
Directive ADR – European Agreement Concerning the<br />
International Carriage of Dangerous Goods by Road,<br />
United nations, new York and Geneva, 2006.<br />
3. Lees, F. P.: Prevention in the Process Industries, Butterworths,<br />
London, 1980.<br />
4. Scenna n. J., Santa Cruz A. S. M.: Reliab. Eng. Syst.<br />
Saf. 90, 83 (2005).<br />
5. Martincova, Masek, nBC 2006, Symposium on chemical,<br />
biological, nuclear and radiological threats – a<br />
safety and security challenge, Tampere, Finland 2006.<br />
6. Martincova J., Masek I.: 34 th International Conference<br />
of SSCHE, Tatranské Matliare, May 2008.
Chem. Listy, 102, s265–s1311 (2008) Environmental Chemistry & Technology<br />
P43 RISKS FACTORS OF SOCIAL DEVELOPMENT<br />
AS ENVIRONMENT FOR MANAGEMENT<br />
IVAn MAŠEK a and JAROMíR nOVáK b<br />
a Brno University of Technology, Faculty of Chemistry, Purkynova<br />
118, Brno, 612 00, Czech Republic,<br />
b Palacký University Olomouc, Philosophical Faculty, Krizkovskeho<br />
12, Olomouc, 771 80, Czech Republic,<br />
masek@fch.vutbr.cz<br />
Introduction<br />
All things, phenomena, and processes have their own<br />
causes and consequences. They bring along pros and cons;<br />
they can be controlled and chaotic, can and cannot be influenced.<br />
Social development has been getting more and more<br />
complicated, undergoing fast changes; being difficult to predict.<br />
If the last century was said to be a century of changes,<br />
this feature will be more significant and determining for further<br />
development. There is more and more urgent need to ask<br />
questions about further development and search for answers<br />
to them. What is our future going to be like? What factors<br />
are there going to become determinants for further phenomena<br />
and processes management? It is necessary to deal with<br />
negative consequences of our decision making processes. For<br />
the purpose of this contribution, concerning the topic of the<br />
conference, We are going to try to briefly describe some of<br />
the crucial factors development, which could be considered<br />
as risks.<br />
Authors think that everybody can be influenced by them,<br />
as well as influence them him/herself. This concerns especially<br />
those people who manage.<br />
Risk factors<br />
F a c t o r 1 – P o p u l a t i o n<br />
A c c u m u l a t i o n D y n a m i c s<br />
The number of the Earth population grows unevenly,<br />
especially in materially immature countries. In materially<br />
mature countries the birth rate is descending, there are a<br />
growing number of seniors. This will evoke changes in processes<br />
as well as in number and quality of human population,<br />
its behaviour and migration.<br />
Population aging will influence its integration into<br />
economic and other socially significant processes. Social<br />
and health systems, material and non-material needs, such<br />
as boarding, dressing, hygiene, travelling, free time, home<br />
equipment; relationship between people and generations will<br />
change. Country defence potential will change, too.It is a big<br />
difference between the needs to negate poverty with a lack of<br />
capital and material production, and, on the contrary, to offer<br />
capital and material production to poverty.<br />
F a c t o r 2 – I n e q u a l i t y o f t h e W o r l d<br />
W e a l t h<br />
There are a few countries that experience a relative prosperity.<br />
On the other hand it is estimated that up to two billions<br />
of people suffer absolute poverty. There are about fifteen<br />
s420<br />
countries on the planet which record growth, but more than a<br />
hundred countries record descent or stagnation. According to<br />
some records there are 85 % shopping expenses for 20 % of<br />
the richest people. On the other hand 20 % of the poorest people<br />
must settle for 1.1 % of the world incomes (as compared<br />
to 1.4 % in 1991 and <strong>2.</strong>3 in 1960).<br />
More than a billion people do not have access to medical<br />
services, basic education or drinkable water, two billions<br />
do not have electricity and 80 % of the world population do<br />
not have the slightest possibility to telecommunicate and this<br />
access new information and communication technologies,<br />
which can, for example, enable distant studies.<br />
It has also been found out that if the world population<br />
used the same ways of development and consumption as<br />
north America, we would need three planets like the Earth<br />
is.<br />
The gap between the rich and the poor is getting bigger.<br />
On one side there are great chances to balance the inequalities,<br />
and on the other side they are being deepened. The problems<br />
of justice are to be seriously dealt with. The poor can<br />
not pay for the prosperity of the rich.<br />
The inequalities are deepened not only among countries,<br />
or the north and the South, but also among people inside the<br />
countries. For instance, in the USA the rate between the highest<br />
and the lowest salaries has risen from 35 multiple up to<br />
150 multiple within the last 20 years. We witness deepening<br />
of inequalities even here in our republic. Is it right for the<br />
poor to contribute the rich? How long will it last to the poor<br />
to start taking from the rich or at least make their wealth less<br />
pleasant? There are such cases and most probably there will<br />
be more and more of them.<br />
F a c t o r 3 – T h e E n v i r o n m e n t<br />
Pressure caused by human activities having impact<br />
on nature systems is huge. Generally, it is connected with<br />
great material movement. Unrenewable resources are being<br />
fatigued, wasted, species of fauna and flora perish, water<br />
and air are being polluted, and number of natural as well as<br />
human-caused disasters is growing.<br />
There have been mostly warning and non-optimistic statements<br />
published in the last few years. They are often contradictory.<br />
Yet, they have something in common – they make<br />
us think and act. Acting in the sense of adequate performance<br />
does not appear very often. It is so for many reasons.<br />
Europe, as well as other continents, is going to face<br />
droughts and floods. Water level of seas can rise up to one<br />
meter. There is a threat of devastating winds. World map is<br />
expected to change.<br />
According to the Living Planet Report, published by<br />
the World Wildlife Fund (WWF), standards of our lives can<br />
collapse in three decades. It is because we have been withdrawing<br />
from the planet every year up to one fifth more than<br />
the planet is able to renew. If the development continues this<br />
way, the biological capacity withdrawal deficit will reach up<br />
to 220 % in the half of the century.
Chem. Listy, 102, s265–s1311 (2008) Environmental Chemistry & Technology<br />
The report states that the life expectancy will rapidly<br />
decline around the year 2030. Level of education and world<br />
economy will irrefutably collapse.<br />
Unrenewable resources are being fatigued and wasted,<br />
species of fauna and flora perish, water and air are being<br />
polluted, and number of natural as well as human-caused<br />
disasters is growing. Environment knows no frontiers. In the<br />
past years at international conferences attention was paid to<br />
greenhouse gases emissions, yet no success was reached. For<br />
example – the USA produce <strong>2.</strong>5 multiple of carbonic oxide<br />
emissions per person than Europe. In the USA the emissions<br />
production growth is eighteen per cent; the world average is<br />
nine per cent.<br />
A hectare of tropical forests disappears every two<br />
seconds. The species disappear from hundred to thousand<br />
times faster then they would when living in a harmonic<br />
environment.<br />
Water problems are increasingly urgent. What may happen<br />
is that this century will even become a century of a war<br />
over water, food and raw materials. Water means life. Lack<br />
of water is more and more apparent. Rivers, streams, swamps<br />
and moor land dry up.<br />
Unrenewable resources are being fatigued, wasted,<br />
species of fauna and flora perish, water and air are being<br />
polluted, and number of natural as well as human-caused<br />
disasters is growing. Environment knows no frontiers. In the<br />
past years attention was paid to greenhouse gases emissions<br />
at international conferences, yet no success was reached. For<br />
example – the USA produce <strong>2.</strong>5 multiple of carbonic oxide<br />
emissions per person than Europe. Water problems are increasingly<br />
urgent. Maybe this century will even become a war<br />
over water, food and raw materials.<br />
F a c t o r 4 – G l o b a l i z a t i o n<br />
Consequently to almost complex globalization the world<br />
is really or relatively diminishing, with no regard to continents,<br />
countries, districts. Mutual dependency of population<br />
is growing incredibly; consequences of individual’s mistakes<br />
significantly affect others.<br />
Here an essential question is to be asked: What is the connection<br />
between often absurdly defended freedom of individuals<br />
and at the same time the growing mutual dependence of<br />
people? Apart from freedom there is also justice and stability,<br />
balance and equality. So far we have been witnessing more of<br />
globalization of power, profit and exploitation. It is necessary<br />
to globalize responsibility for nature and people in it.<br />
Great attention is being paid to globalization in various<br />
discussions. It has its positive features as well as big negatives.<br />
We must find a way to tame it to avoid a great disaster.<br />
If we manage to run the globalization processes there is<br />
a chance for a positive development. It is good that Movements<br />
against wild globalization start to appear.<br />
s421<br />
F a c t o r 5 – I n t e g r a t i o n a n d<br />
D i s i n t e g r a t i o n<br />
Various groups come into being and on the contrary,<br />
states decay, therefore the there is bigger and undesirable<br />
atomization. People, regions and countries have their own<br />
interests, often of vital importance, which can be and are in<br />
contradiction with interests and aims of other countries. It<br />
is difficult do make compromise solutions. Politics and economics<br />
deal more often with the consequences than causes.<br />
Almost 20 new countries have arisen within the past 10 years,<br />
which have different political systems and aims, which are,<br />
apart from other, based on nationalistic principles.<br />
The role of international organisations changes – Un,<br />
EU, International monetary fond, World Bank, WTO, nATO<br />
and others. We can not say that the changes are always positive,<br />
transformation is essential.<br />
F a c t o r 6 – n C B W e a p o n s<br />
There are a growing number of countries which have or<br />
will have nuclear weapons. That increases the world insecurity<br />
as well as opportunities to destroy. Here is important to<br />
note the proliferation of military equipment and technologies<br />
of ambiguous use, like nBC weapons. Gun trade volume is<br />
not low. For example, in the last three years, American companies<br />
sold weapons for nearly 19 milliard dollars; French<br />
companies for 4 milliards dollars, and German ones for 1<br />
milliard dollars.<br />
Besides official, by governments approved gun trades<br />
there is a trade that is being tolerated and concluded by<br />
governments. There is also illegal gun trade.<br />
A big threat of today is a black market dealing with<br />
nuclear material and nuclear equipment. Gaining theoretical<br />
knowledge in the way of overpaying the specialists or<br />
documents is a current problem, too. non-proliferation of all<br />
kinds of weapons, especially nBC weapons has another side,<br />
too. It is that they are kept by countries that have already<br />
had them. The logic is simple – why do some countries have<br />
them, and why the others do not? Why can you have them<br />
but we cannot? Once these weapons exist, it is a question of<br />
time and money for the others to get them. The “others” can<br />
potentially mean terrorists. Why have these weapons actually<br />
been developed and why do they exist? If the development<br />
does not change, the world will take a risk of self-destruction.<br />
The danger can be bigger than it was during the cold war<br />
time. During the cold war time, these weapons “helped” keep<br />
peace, though the peace was unstable and faulted.<br />
There is a growing number of countries which have<br />
or will have nuclear weapons. That increases the world<br />
insecurity as well as a chance to destroy. Here is important<br />
to note the spread of military equipment and technologies of<br />
ambiguous use, like nBC weapons.<br />
F a c t o r 7 – V i o l e n c e G r o w t h<br />
It is easily provable that there is a quantitative as well<br />
as qualitative growth of violence. Here it is appropriate to<br />
remember Erich Fromm who defines violence as an urgent
Chem. Listy, 102, s265–s1311 (2008) Environmental Chemistry & Technology<br />
consequence of a non-lived and crippled life. A person who<br />
is not able to create must destroy. We have been witnessing<br />
growth of violence. The violence has many forms – human<br />
(physical and mental), military, economy, financial, political,<br />
etc. Difference between war and peace has been becoming<br />
less apparent as seen from many contemporary examples.<br />
The volume of gun-running is not small. For example, in the<br />
last three years American companies sold weapons for nearly<br />
19 milliard dollars, French companies for 4 milliard dollars<br />
and German ones for 1 milliard dollars. People tend to feel<br />
insecure. Violence has negative influence on mental, physical,<br />
and social health.<br />
F a c t o r 8 – P e r m a n e n t D e v e l o p m e n t<br />
Probably never in human history was people’s ability to<br />
self destroy as high as it is today. Will we control the ability<br />
or cope with it? Is permanent development possible? Is there<br />
and will there be enough sources for needs filling? Values and<br />
needs vary with individuals, regions, states and continents<br />
– will the differences be apparent? One of many world principles<br />
is stability and balance. Let us admit that something<br />
like this exists in materially developed world. The situation,<br />
however, can rapidly change into misbalance and dramatic<br />
value, visions and ideology conflicts.<br />
The world has been changing fast and dramatically. Is<br />
mankind able to accept these changes throughout its physical<br />
and mental essence? Probably everybody must admit that<br />
mere existence of modern technologies brings along civilisation<br />
risks that were unthinkable several years ago. How can<br />
the modern technologies be used and controlled for general<br />
use? Do modern technologies serve people or do people serve<br />
modern technologies?<br />
F a c t o r 9 – A b i l i t y t o M a n a g e<br />
To be able to cope with development and suppress<br />
negative factors as much as possible, the problems have to<br />
be recognised and described openly and impartially. It also<br />
necessary to find consensual solution – to manage. Management<br />
is, in its essence, optimal use of available sources. The<br />
main group of sources include: human, financial, material,<br />
information and time sources.<br />
Risk factors are unpleasant parts of life. They can, however,<br />
work as challenge for searching for solution. Individual<br />
and social scruples make people tend to avoid thinking about<br />
unpleasant things. This phenomenon can be seen every day.<br />
However, burying heads into sand and pursuing ostrich-like<br />
policy will not lead to success. This policy will lead to postponing<br />
and not solving the problems and, in its consequences,<br />
will be nonreturnably harmful.<br />
It is necessary to independently examine the risk factors<br />
and, if necessary, to establish an independent institution for<br />
these purposes. Avoiding unpleasant things can cause their<br />
outbreak. Political institutions have to be included in this<br />
s422<br />
work in larger extent than they are today. Without wearing<br />
ideological blinkers must we ask questions like: “Is it true?<br />
Can it be true?” instead of “who and why said that?”.<br />
If we characterise contemporary and, especially, future<br />
environment as turbulent, it will not be an empty or just interesting<br />
concept. In various studies there have been characterised<br />
dozens of risks that can reach different levels of significance<br />
and different levels of development. It is probable<br />
that there may quickly appear new unexpectable, and, from<br />
today’s point of view, unpredictable risks. Unfortunately, we<br />
make some decisions using logic of today or even yesterday.<br />
Environment has been becoming more and more complicated;<br />
technologies have been in progress. People and their<br />
understanding, thinking and behaviour are changing, too.<br />
It is necessary to ask the main question: Is there (do we<br />
have) any visions, plans, and directions for the new century?<br />
Are there any devices for them? Don’t we focus on shortterm,<br />
purpose-made, selfish solutions, which will chase us<br />
into a trap? Don’t we remove consequences instead of causes<br />
of our decisions?<br />
We are certain that the crucial key matter of future is<br />
regulation, management, ability and willingness to manage<br />
even within international standards, as well as balanced unity<br />
of managing items. It is necessary to solve problems within<br />
international standards without selfishness, using the principles<br />
of solidarity and balanced values substitutions. It will<br />
take us a long time to do so.<br />
Conclusions<br />
The above stated factors are mutually interconnected;<br />
they influence each other, change their content and extent.<br />
There is a possibility of chaotic and unrestrained development<br />
along with uncontrollable, unpredictable changes resulting<br />
from these factors. In their consequences, these changes<br />
create risks and threats. It is very important for the top management<br />
representatives to realise the characters of development<br />
factors. These factors concern each of us, too.<br />
REFEREnCES<br />
1. Beck, U.: Riziková společnost. Sociologické nakladatelství,<br />
Praha 2004.<br />
<strong>2.</strong> Huntington, Samuel P. Střet civilizací. Rybka publishers,<br />
Praha 2001.<br />
3. němeček, P., a kol.: Možné trendy rozvoje podniků. Akademické<br />
nakladatelství CERM, Brno 2004.<br />
4. novák, J.: Možné vývojové tendence okolí managementu.<br />
In Sborník konference GEMAN 04 „General<br />
management“. Plzeň: Sdružení EVIDA Plzeň, 2004.<br />
5. Rašek, A.: Zpráva o stavu České republiky-oblast bezpečnosti.<br />
CESES, UK Praha, 2004.<br />
6. Souček, Z.: Sežer! nebo budeš sežrán?! ? In Sborník<br />
konference PEMAN 05 „Personal management“. Plzeň:<br />
Sdružení EVIDA Plzeň, 2005.
Chem. Listy, 102, s265–s1311 (2008) Environmental Chemistry & Technology<br />
P44 CAN wE ENSuRE SAFER ENVIRONMENT<br />
FOR CuLTuRAL hERITAGE?<br />
IVAn MAŠEK a and ZDEnA ROSICKá b<br />
a Brno University of Technology, Faculty of Chemistry, Purkynova<br />
118, Brno, 612 00, Czech Republic,<br />
b Universita of Pardubice, Faculty of Restoration, Jiraskova<br />
3, Litomysl, 570 01, Czech Republic,<br />
masek@fch.vutbr.cz<br />
Introduction<br />
Books should be kept in a stable environment. This is<br />
best effected by preventing temperature changes around the<br />
collection or ensuring that any changes made will be very<br />
gradual. In addition, books in fragile condition should be<br />
placed in close-fitting, nearly airtight enclosures. They protect<br />
materials from dust and airborne pollutants; reduce the<br />
exchange of moisture between the paper in the books and the<br />
air. Slow changes in air temperature around a book will not<br />
cause harm, even sudden upward temperature changes are<br />
not too damaging. In case the book in a protective enclosure<br />
is suddenly cooled, water will condense on the enclosure’s<br />
interior walls when the temperature drops bellow the dew<br />
point of the air within the enclosure.<br />
The climate maintained in a library is the result of a<br />
compromise between the needs of the readers and the staff,<br />
maintenance demands and the structure of the building which<br />
should result in minimizing the deterioration rate of the collection.<br />
It is believed that that the rate of deterioration of library<br />
materials doubles with every 10°C increase of temperature.<br />
This belief is based on the fact that the speed of chemical<br />
reactions depends in large part of temperature. Recommended<br />
temperature ranges for a variety of library materials.<br />
A certain amount of relative humidity is necessary for<br />
paper to retain its flexibility but scientists disagree about<br />
the optimum relative humidity desirable because increased<br />
moisture content increases the rate of deteriorative chemical<br />
reactions and mold will grow. The recommended level<br />
of relative humidity is a compromise among several require-<br />
ments:<br />
•<br />
•<br />
•<br />
level of moisture high enough to maintain flexibility,<br />
level low enough to slow deterioration of materials and<br />
control insects and mold,<br />
level that will do no structural harm to library buildings<br />
due to condensation in cold weather.<br />
Molds cause a downy or furry growth on the surface of<br />
organic matter; they can develop on leather, cloth, paper, etc.,<br />
especially in the presence of relatively high heat and relative<br />
humidity. Every cubic meter of air contains thousands of<br />
molds spores that cover surface of library objects. Mold and<br />
mildew eat books and papers. The cellulose, adhesives and<br />
starches in the sizing provide a source of nutrition that enables<br />
the fungi to excrete digestive enzymes that convert these<br />
materials into forms they can digest. Molds usually attack<br />
bindings before the text block because it lands on the binding<br />
s423<br />
first, the cellulose is more difficult to digest and the text block<br />
is tightly closed.<br />
Salvage of Flood Damage Papers<br />
It should be noted that flood damage to some items may<br />
be irreversible. The treatment of objects of high monetary,<br />
historic or sentimental value should only be performed in<br />
consultation with a conservator.<br />
Many people are sensitive to mold and some mold species<br />
are toxic. The best way to prevent or stop the outbreak<br />
of mold is to remove items from environmental conditions<br />
that encourage mold growth: high temperature, high relative<br />
humidity, stagnant air and darkness. If wet and moldy materials<br />
cannot be dried immediately they may be stabilized by<br />
freezing. Placing damaged items in a personal or commercial<br />
freezer will not kill mold, however, it will put the mold<br />
in a dormant state until time and the appropriate treatment<br />
environment are available. Active mold look fuzzy or slimy.<br />
Dormant mold is dry and powdery. Mold which remains<br />
active after freezing or after the host material appears dry<br />
may be treated with exposure of 1–2 hours to ultraviolet radiation<br />
from the sun. Extreme caution must be exercised when<br />
treating material outdoors: too much radiation will accelerate<br />
deterioration and may cause fading, wind may cause<br />
physical damage, and high relative humidity or condensation<br />
caused by rapid temperature changes may also exacerbate<br />
mold growth. Dormant mold spores will reactivate as soon as<br />
conditions are favorable. They should, therefore be removed<br />
from items and may be brushed or vacuumed away.<br />
There are both chemical and non-chemical means to kill<br />
mold. Effective treatment can be fungi-static or fungicidal.<br />
Fungi-static treatments are those preventing the mold spores<br />
from germinating but do not kill the mold. Freezing is one of<br />
methods. Fungicidal treatment kills the mold and its spores.<br />
no safe large-scale treatment imparts lasting or residual mold<br />
control. That is why it is important to change the environment<br />
so it inhibits mold growth. In addition, there is some evidence<br />
that books and papers treated with fungicides may be more<br />
susceptible to mold after treatment than they were prior to<br />
the outbreak.<br />
Fig. 1. Flood damaged book
Chem. Listy, 102, s265–s1311 (2008) Environmental Chemistry & Technology<br />
Paper is very fragile when it is wet. In some cases it may<br />
be desirable to remove caked-on mud and dirt as dirt left by<br />
receding water may be contaminated. Wet documents or photographs<br />
which cannot be air dried within two days should be<br />
frozen to inhibit mold growth. Circulating air will effectively<br />
dry most items. Physical distortions may result but information<br />
will be saved. Blotting materials for air drying should be<br />
clean and absorbent. Screening material such as window screens,<br />
well supported and stacked with spaces between them<br />
provide an excellent compact drying surface. The porous surface<br />
assists air circulation and promotes drying.<br />
Without intervention glossy materials such as paperback<br />
book covers, art books, etc. are likely to stick together. Loose<br />
glossy materials should be spread out in one layer for air<br />
drying. Bound glossy materials must be interleaved between<br />
every page to prevent sticking.<br />
As to books, interleaving material should be placed<br />
between the text block and the front back covers. If time and<br />
supplies allow interleaving material should be placed intermittently<br />
throughout the text as well. Evaporation of water as<br />
it wicks into the interleaving paper will enhance drying.<br />
Several classes of photographs are highly susceptible to<br />
water damage and the recovery rate will be very low. Old<br />
photographs and negatives can never be frozen. Most prints,<br />
negatives and slides may successfully be individually air<br />
dried face up. Contemporary photographic prints and negatives<br />
which are still wet and have stuck together may separate<br />
after soaking in cold water, however, this type of treatment<br />
could cause irreversible damage. Highly valued items,<br />
particularly prints, for which there is no longer a negative,<br />
should be referred to a conservator immediately.<br />
s424<br />
Conclusions<br />
The most critical element affecting the longevity of<br />
library materials is the environment in which they are used<br />
and stored. The sitting of the building, its orientation to the<br />
sun, building’s location in areas safe from flooding and other<br />
natural disasters, planted areas and trees near perimeter walls,<br />
the design of roofs, basements, and location of windows considering<br />
stack areas. But it is not only buildings and their<br />
design that cause problems: libraries house millions of books<br />
published on acidic paper, high temperatures and humidity<br />
cause chemical reactions between the cellulose in paper, the<br />
acids residing in the fibers, and pollutants in the atmosphere,<br />
all of which accelerate deterioration.<br />
Adjusting the environment near the building can help<br />
considerably in reducing problems inside.<br />
REFEREnCES<br />
1. Ritzenthaler M. L.: Archives and Manuscripts: Conservation:<br />
A Manual on Physical Care and Management.<br />
SAA Basic Manual Series. Chicago: Society of American<br />
Archivists, 1993.<br />
<strong>2.</strong> Padfield T.: Climate Control in Libraries and Archives.<br />
In Preservation of Library Materials: Conference held<br />
the National Library of Austria, Vienna, 1986. IFLA<br />
Publications, 41. Munchen:K.G.Saur, 1987.<br />
3. nyberg S.: The Invasion of the Giant Spore. SOLInET<br />
Preservation Program Leaflet no 5: Southeastern<br />
Library network, Inc., november 1, 1987.
Chem. Listy, 102, s265–s1311 (2008) Environmental Chemistry & Technology<br />
P47 CIVIL PROTECTION IN ThE CZECh<br />
REPubLIC AND ITS PERSPECTIVES<br />
OTAKAR J. MIKA and LEnKA FIŠEROVá<br />
Faculty of Chemistry, Brno University of Technology, Purkyňova<br />
118, 61200 Brno, Czech Republic,<br />
mika@fch.vutbr.cz<br />
Introduction<br />
From the legal, institutional and structural points of<br />
view the history of the conception of civil protection in the<br />
Czech Republic was relatively complicated during 90-ties.<br />
The above development accompanied fundamental socialpolitical<br />
changes in the country after 1989 without being<br />
completed with adaptation of legislation focused on civil<br />
protection. Even if the importance of civil protection reflecting<br />
increasing risks of anthropogenic, natural and mixed<br />
origin in peace conditions was fully accepted by specialists<br />
and the responsible state authorities passed individual measures<br />
aimed on gradual change of the state then, the global<br />
conception of civil protection was approved by the Czech<br />
government as late as in 200<strong>2.</strong><br />
The Act no. 239 of June 28, 2000 on integrated rescue<br />
system introduced the term civil protection into the Czech<br />
legal code. According to the above act civil protection is<br />
understood as fulfillment of civil protection tasks, especially<br />
warning, evacuation, sheltering and emergency survival of<br />
civilian population and further measures to ensure protection<br />
of their lives, health and possessions with reference to the<br />
article no. 61 of Protocol Additional to the Geneva Conventions<br />
of August 12, 1949 on protection of international armed<br />
conflicts victims (Protocol I).<br />
Civil protection has become an integral and priority<br />
domain of emergency planning and management. In connection<br />
with its systematical implementation and practical<br />
realization the necessity of university education for qualified<br />
emergency managers mastering thoroughly both theoretical<br />
and practical background of civil protection has been proved.<br />
history of Civil Defense and Protection<br />
Purposeful and qualified attention has been paid to the<br />
practical and theoretical problems of civil protection in the<br />
Czech Republic (former Czechoslovakia) for more than<br />
seventy years.<br />
As early as in 1929, after World War I, the Centre for<br />
Civil Defense was established by the Czechoslovak Ministry<br />
of Defense as a response to both complicated international<br />
political situation then and to growing fears of danger from<br />
air force war activities threatening civilians especially with<br />
chemical warfare agents. The Centre was run as a voluntary<br />
organization via local bodies with the semi-official support<br />
of central authorities and with active participation of organizations<br />
whose program was concentrated on defense activities.<br />
One year later the organization Protection of Civilians<br />
against Air Raids arose.<br />
s425<br />
A remarkable change of situation was noticed in the<br />
first half of 30-ties of the previous century. At that time the<br />
attempt of nazi Germany to realize its political aims aggressively<br />
by all the available means expressed by its intensive<br />
building military and air forces was becoming more and more<br />
apparent.<br />
The authorities of the Czechoslovak Republic reflected<br />
the above situation by introduction of a series of individual<br />
precautions resulting in passing the Act no. 82/1935 Coll.<br />
on protection from and on defense against air raids. The base<br />
for system of legal regulations for civil protection was set<br />
both by promulgation of the above law and by establishment<br />
of Civil Air Defense (referred to as CAD). Amending the<br />
above law another Act no. 75 of April 1938 represented a<br />
reaction to immediate threat of the Czechoslovak Republic<br />
by fascist Germany. The conception of CAD in the pre-war<br />
Czechoslovak Republic fulfilled requirements then and under<br />
given conditions it comprised the first historical phase of systematic<br />
and effective attempt to solve the problems of civil<br />
protection.<br />
During the occupation of the Czechoslovak Republic by<br />
nazis the CAD was liquidated and its compartments, units<br />
and material equipment were taken over by the German Air<br />
Defense in 1941. After liberation in 1945 the CAD passed out<br />
of existence. The first attempts to re-establish it were realized<br />
after 1948.<br />
Regardless of certain individual measures the work<br />
on institutionalization of a civil defense (referred to as CD)<br />
organization culminated in 1951 by acceptation of Government<br />
resolution on civil defense fixing gradual organizational,<br />
personal and material building of civil defense in the<br />
legal code.<br />
Between 1951 and 1970 civil defense was focused<br />
solely on protection against conventional weapons and on<br />
priority ensurance of protection against weapons of mass<br />
destruction effects (referred to as WMD). In 1955 the<br />
Research Institute of Civil Defense was established. Transfer<br />
of civil defense subject to protection against weapons of mass<br />
destruction expressed crucial qualitative change that resulted<br />
in acceptance of the new Resolution of Government of the<br />
Czechoslovak Republic no. 49/1958 Coll. on civil defense<br />
of the Czechoslovak Republic. For its support the following<br />
services were founded: medical, energy, gas, transport, fire,<br />
order, road and bridge, municipal, shelter, water-technical,<br />
agricultural, camouflage, construction-technical and supply<br />
ones. Operative control of civil defense was ensured by CD<br />
staffs whose members were mainly regular soldiers.<br />
Based on the legal resolution of Federal Assembly no.<br />
17/1976 Coll. drawing on doctrinal theory of Warsaw pact<br />
countries the subordination of CD was transferred from the<br />
Federal Ministry of Interior to the Federal Ministry of national<br />
Defense effective January 1, 1976. The State Defense<br />
Council became the supreme body for state defense control.<br />
Federal Ministry of national Defense was entrusted to<br />
become the central body of state administration for organization,<br />
coordination and control of CD on the whole area of the
Chem. Listy, 102, s265–s1311 (2008) Environmental Chemistry & Technology<br />
Czechoslovak Republic. Local authorities at all levels were<br />
responsible for provision of tasks and needs of CD. Between<br />
1976 and 1989 CD followed directives of the State Defense<br />
Council.<br />
In June 1991 the State Defense Council approved the<br />
Conception of Civil Defense in the Czech and Slovak Federative<br />
Republic reflecting trends of CD development abroad<br />
with the aim to focus on protection of population against<br />
non-military emergency events. For the first time in the<br />
Czechoslovak history clear differentiation of functions and<br />
tasks of CD in times of peace and during military alerts was<br />
expressed.<br />
Substantial changes were implemented after division<br />
of the federal state into two independent ones and after the<br />
establishment of the Czech Republic on January 1, 1993. Effective<br />
that day the operation of the former Federal CD staff<br />
was transferred to the Staff of Civil Defense of the Czech<br />
Republic. On March 17, 1993 the Resolution of the Government<br />
of the Czech Republic no. 126/1993 Coll. on the state<br />
of civil protection in the Czech Republic, its structure and<br />
material needs ensurance was passed. The government states<br />
there that the formation of the new civil protection system<br />
(referred to as CP) will be realized together with the new conception<br />
of the Army of the Czech Republic with full respect to<br />
the Protocols Additional I and II to the Geneva Conventions.<br />
On September 1, 1993 the Central Body for Civil Protection<br />
of the Czech Republic was established by the directive of<br />
then minister of defense. The body became an authority of<br />
the Ministry of Defense responsible for execution of state<br />
administration in CP affairs and at the same time it replaced<br />
the Staff of Civil Protection of the Czech Republic.<br />
In 1997 the Government of the Czech Republic confirmed<br />
the resolution no. 710/1997 Coll. transferring the<br />
authority to execute state administration on CP from the<br />
Ministry of Defense to the Ministry of Interior and set the effective<br />
date on January 1, 2000 in the resolution no. 53/1999<br />
Coll. In the new organization structure the Central Body<br />
for Civil Protection of the Czech Republic and regional CP<br />
bodies were united with the Fire Rescue Service of the Czech<br />
Republic (referred to as FRS). This way the activities of CP<br />
of the Czech Republic as an institution was terminated and<br />
the General Directorate of FRS of the Ministry of Interior<br />
became central authority entrusted with civil protection.<br />
Effective Legislation Focused on Ensurance of Civil<br />
Protection<br />
The government of the Czech Republic approved the<br />
Conception of Civil Protection until 2006 with the Prospect<br />
to 2015 (referred to as conception 2006) in its resolution no.<br />
417/200<strong>2.</strong> The conception solves protection of civilians systematically.<br />
The government obliged ministers and heads of<br />
other authorities, governors and city mayors of Prague, Brno,<br />
Ostrava and Plzeň to implement fully the measures comprised<br />
in the above conception 2006 that emphasizes responsibility<br />
of ministries, central state authorities, local authorities,<br />
persons and physical persons for CP specified by laws. The<br />
s426<br />
conception was revised by the resolution of the Czech government<br />
no. 21/2005 Coll.<br />
In the above conception 2006 civil protection was<br />
characterized as a system of activities and procedures, subject<br />
related authorities, other subjects and individual citizens<br />
resulting in minimization of impacts of emergencies on lives<br />
and health of inhabitants, on possessions and environment.<br />
At the beginning of 2008 (on February 25) the Government<br />
of the Czech Republic passed the resolution no. 165<br />
“On Evaluation of the State of Implementation of the Conception<br />
of Civil Protection until 2006 with the Prospect to<br />
2015 and on the Conception of Civil Protection until 2013<br />
with the Prospect to 2020” giving more details on CP in the<br />
Czech Republic. This resolution contains 25 pages of specialized<br />
text from the field of CP and the Schedule of Implementation<br />
of Provisions on CP until 2013 with the Prospect to<br />
2020 (referred to as conception 2013 and schedule). Inspite<br />
of the attempt to design the conception 2013 and schedule<br />
from the contemporary point of view it is necessary to point<br />
at inconsistent solutions of some problems concerned.<br />
Civil protection represents an extremely important aspect<br />
of life of modern society. The supreme legislative regulation<br />
of the Czech Republic, the Constitution, ensures protection of<br />
lives, health, possessions of Czech citizens and protection of<br />
environment. Similarly to other developed European countries<br />
the security-political situation in the Czech Republic has<br />
been re-evaluated during the last decade of the 20 th century.<br />
As the result of substantial political changes at the beginning<br />
of 90-ties military threat in Europe and global war conflict<br />
became less probable. Attention was focused on non-military<br />
risks important from the point of view of individual countries<br />
and security of their citizens.<br />
Regarding the importance of civil protection its problems<br />
should be specified and expressed in a special law.<br />
Possible content and extent of the suggested law on civil pro-<br />
tection follows:<br />
•<br />
•<br />
•<br />
•<br />
•<br />
•<br />
•<br />
•<br />
•<br />
Introductory provisions<br />
Definitions and basic terms<br />
General provisions<br />
Emergency events and crisis states<br />
Basic organization and technical measures for civil protection<br />
Protection of citizens against impacts and effects of<br />
emergency events and crisis states<br />
Preparedness of citizens for emergency events and crisis<br />
states<br />
Execution of state administration in the field of civil protection<br />
Effectiveness of the act<br />
Besides the above mentioned legislative regulation a<br />
project “Who is Who in Civil Protection” should be implemented.<br />
Authors and proposers will appreciate inspiring and<br />
constructive ideas and comments concerning the project.
Chem. Listy, 102, s265–s1311 (2008) Environmental Chemistry & Technology<br />
Project: Who is Who in Civil Protection in the Czech<br />
Republic<br />
Aim of the project:<br />
• to compile a database of specialists in the fields related<br />
to civil protection in the Czech Republic<br />
• to support preparedness and capacity of action of professional<br />
and voluntary bodies related to civil protection<br />
• to list bodies or people in the database based on voluntary<br />
principle (protection of personal data of listed participants<br />
of the project)<br />
•<br />
•<br />
•<br />
•<br />
•<br />
•<br />
Project outcomes:<br />
Proceedings (printed publication)<br />
Implementation and update of a website<br />
Participating organizations – initial suggestion:<br />
Universities: e.g. Technical University of Ostrava<br />
– Faculty of Safety Engineering; University of Defense<br />
Brno – Institute of nBC Defense Vyškov; Police Academy<br />
of the Czech Republic, Prague, Department of<br />
Crisis Management; Brno University of Technology,<br />
Faculty of Chemistry; Tomas Bata University Zlín; University<br />
of South Bohemia, České Budějovice; Palacky<br />
University Olomouc; University of Pardubice; University<br />
of Economics, Prague etc.<br />
Research institutes and specialized institutions: e.g.<br />
Population Protection Institute Lázně Bohdaneč; Military<br />
Technical Institute of Protection Brno; national<br />
Institute for nuclear, Chemical and Biological Protection<br />
Kamenná; State Office for nuclear Safety, Prague etc.<br />
Companies and firms manufacturing and marketing<br />
materials for civil protection (e.g. syndicate of companies<br />
Czech nBC team etc.)<br />
Ministries: Ministry of Interior – General Directorate of<br />
Fire Rescue Service and Police of the Czech Republic;<br />
Ministry of Health – Department of Crisis Preparedness,<br />
Emergency Medical Service, Air Rescue Service,<br />
selected hospitals; Ministry of Defense; Ministry of<br />
Industry and Trade; Ministry of Transport; Ministry of<br />
Education, Youth and Sport; Ministry of Environment;<br />
voluntary bodies, e.g. Czech Red Cross, Mountain Rescue<br />
Service of the Czech Republic etc.<br />
Proposed personal data of specialists to be listed in the<br />
“Who is Who in Civil Protection in the Czech Republic”<br />
database:<br />
s427<br />
•<br />
•<br />
•<br />
•<br />
•<br />
First name and surname, academical degrees<br />
Employment history/accomplishments<br />
Major contemporary professional orientation<br />
Major supervised projects and publications in the field<br />
of CP in recent 5 (10) years<br />
Contact information for communication: address, telephone<br />
and fax numbers, e-mail address etc.<br />
Implementation of the above process makes sense when<br />
its outcomes are accessible e.g. on a special website available<br />
for selected specialists assigned with passwords and when the<br />
database is regularly updated.<br />
Conclusions<br />
Contradictory and contrary character of civilization<br />
activities accompanied with permanent proliferation of security<br />
risks results in increasing danger for citizens caused by<br />
growing number and types of emergency events. The development<br />
of corresponding security system lags behind the<br />
above described process, which makes the problems of civil<br />
protection permanently unresolved.<br />
Civil protection as a system of specialized measures<br />
remains an integral part of crisis management and represents<br />
its priority in non-military emergency events. Concerning the<br />
systematic approach to solve individual types and kinds of<br />
emergency events civil protection is understood as a separately<br />
controlled and coordinated domain.<br />
With regard to growing importance of civil protection<br />
nowadays and in future preparation of and negotiation on<br />
special legislative regulations (see the proposed law on civil<br />
protection above) based on a “set of acts on crisis states”<br />
passed in the half of 2000 year and effective January 1, 2001<br />
can be highly recommended. The field of civil protection<br />
deserves proper background in thorough legislation.<br />
REFEREnCES<br />
1. Zeman M., Mika O. J.: Protection of Citizens. Brno University<br />
of Technology, Faculty of Chemistry, Brno 2007<br />
<strong>2.</strong> Silhanek B., Dvorak J.: Short History of Civil Protection.<br />
Ministry of Interior, General Directorate of FRS of the<br />
Czech Republic, Prague 2003<br />
3. Kratochvilova, D.: Protection of Citizens, Society of<br />
Safe and Fire Engineering, Ostrava 2005<br />
4. Krulik O., Masek I., Mika O. J.: Phenomenon of Current<br />
Terrorism. Brno University of Technology, Faculty of<br />
Chemistry, Brno 2008
Chem. Listy, 102, s265–s1311 (2008) Environmental Chemistry & Technology<br />
P48 APPLICATION OF DGT METhOD FOR<br />
ASSESMENT OF AVAILAbILITy OF hEAVy<br />
METALS TO PLANTS<br />
Z. MLáDKOVá a , K. PEŠKOVá a,b , B. DOČEKAL b ,<br />
H. DOČEKALOVá a and P. ŠKARPA c<br />
a Department of Environmental Chemistry and Technology,<br />
Faculty of Chemistry, Brno University of Technology, Purkyňova<br />
118, 612 00 Brno, Czech Republic,<br />
b Institute of Analytical Chemistry, Czech Academy of Science,<br />
Veveří 97, 602 00 Brno, Czech Republic,<br />
c Mendel University of Agriculture and Forestry, Faculty of<br />
Agronomy, Zemědělská 1, 613 00 Brno, Czech Republic,<br />
mladkova@fch.vutbr.cz<br />
Introduction<br />
At present time problems of toxic metal contamination<br />
of soils are often solved. The form of metals present in the<br />
environment is an important factor affecting their bioavailability.<br />
Metals are often bound to various organic complexing<br />
ligands as humic substances, which influences their mobility.<br />
Therefore, studies of metal speciation are necessary for<br />
understanding how metals can move in nature systems.<br />
Leaching procedures are especially used for determination<br />
of toxic metals concentration in soils. Simple leaching<br />
procedures using aqua regia, ethylenediaminetetraacetic acid<br />
(EDTA), nitric acid or sodium nitrate are usually recommended<br />
and applied. However, leaching procedures give no<br />
information about the metal fraction which is really available<br />
for the root system of plants. Therefore, new approaches are<br />
still being searched to obtain a better characterization of bioavailable<br />
forms of metals and their transport in soils.<br />
Recently an in situ technique capable of quantitatively<br />
measuring labile metal species has been developed 1 . This<br />
technique, known as diffusive gradients in thin films (DGT),<br />
has been successfully used to measure the in situ concentrations<br />
of metals in natural waters, sediments and soils and has<br />
been shown to be a promising tool to assess metal phytoavailability<br />
in a wide range of soils. The technique is based<br />
on accumulation of solutes in a resin layer after passing through<br />
a well-defined diffusive gel layer. The mass of solutes<br />
accumulated in the resin during a period of deployment time<br />
is measured.<br />
The aim of this work was to assess the heavy metal<br />
uptake of radish and to test the capability of DGT to predict<br />
phytoavailability of the metals for this plant.<br />
Experimental<br />
S o i l T r e a t m e n t a n d L e a c h i n g<br />
P r o c e d u r e s<br />
Homogenized and sieved soil, which had been sampled<br />
in Zabcice site, was used in the experiment. Content of<br />
Cd and Cu extractable with nitric acid, acetic acid, EDTA,<br />
sodium nitrate and water was determined in the soil according<br />
to the recommendation of the Community of Bureau<br />
of Reference (BCR) 2 and Gupta 3 . Portion of 6 kg of the soil<br />
s428<br />
was weight into each of 40 pots. Soil portions in individual<br />
pots were spiked by adding solution of Cd and Cu, so that<br />
the concentration of the metal in the soil was increased by<br />
1 ppm Cd, 2 ppm Cd, 100 ppm Cu and 200 ppm Cu. The pots<br />
with non-spiked soil portions served as control samples. After<br />
3 months, leaching with the same agents was carried out<br />
with artificially contaminated samples.<br />
D G T E x p e r i m e n t<br />
The gels for DGT were prepared according to the conventional<br />
procedures (DGT Research, Ltd., Lancaster, UK) 4 .<br />
The DGT piston probes were deployed at 24 ± 1 °C in each<br />
soil sample in triplicate with the moisture content of 150 % of<br />
maximum water holding capacity MWHC for 24 hours. After<br />
elution of the resin gel with 1M HnO 3 , the accumulated mass<br />
of Cd or Cu was determinated.<br />
P o t E x p e r i m e n t<br />
Radish (Raphanus sativa) was sown both in the control<br />
and contaminated soils. Five plants of radish were grown in<br />
each of four pots with the same soil sample. Six weeks after<br />
sowing the radishes were harvested, rinsed with deionized<br />
water; the root divided into the white inner part and the<br />
red outer part and digested using the dry mode mineralizer<br />
(APIOn). Dry matter content in both parts was determined<br />
by drying samples in a oven at 105 °C.<br />
D e t e r m i n a t i o n o f M e t a l s<br />
Content of Cu and Cd was determined by electrothermal<br />
atomic absorption spectrometry (ETAAS) employing Perkin-<br />
Elmer Model 4110 Zeeman atomic absorption spectrometer.<br />
Recommended conditions were applied.<br />
Results<br />
Concentration of Cd and Cu found in soil samples by<br />
leaching with nanO 3 and water and in dry matter of radish<br />
edible parts are summarized in Tables I and II. The test sample<br />
was also characterized by other leaching agents. Content<br />
of elements in this soil related to nitric acid, acetic acid<br />
and EDTA leachate fractions was 49.1 ± <strong>2.</strong>8; 45.5 ± 1.9;<br />
11.8 ± 0.8 μg kg –1 Cd and 6.80 ± 0.50; 0.256 ± 0.051;<br />
3.10 ± 0.17 mg kg –1 Cu.<br />
The content of both metals is significantly higher in<br />
contaminated soils as intended. The results show that added<br />
metals are strongly bound to the soil matrix. The amount of<br />
extractable Cd and Cu with nanO 3 reaches only 10 % and<br />
even only 0.1 % of added metal, respectively. The concentrations<br />
found by means of DGT technique are within 1–2<br />
orders of magnitude lower than the concentrations in sodium<br />
nitrate leachates for both metals.<br />
The dry matter content was determined in both analyzed<br />
parts of radishes. The red outer part and the white inner part<br />
contained on average 11 % and 5 % of dry matter, respectively.<br />
Cd and Cu concentration in both parts of radish increases<br />
with increasing content of these metals in soils. The<br />
Cd and Cu uptake in red outer part of radish is higher than
Chem. Listy, 102, s265–s1311 (2008) Environmental Chemistry & Technology<br />
in white inner part. The fluctuation of individual results indicates<br />
higher biological variability among the plants grown in<br />
the experimental pots.<br />
Table I<br />
Cadmium content in soils and in dry matter of plant samples<br />
grown in these soils<br />
Leaching –<br />
nanO 3<br />
Concentration of Cd [μg kg –1 ]<br />
Control soil Cd 1 ppm soil Cd 2 ppm soil<br />
0.47 ± 0.10 46.7 ± 8.5 249 ± 32<br />
Leaching –<br />
water<br />
0.85 ± 0.10 1.89 ± 0.73 3.77 ± 0.51<br />
DGT unit 0.015 ± 0.003 1.54 ± 0.26 3.38 ± 0.96<br />
Radish –<br />
white part<br />
86.0 ± 20.0 2,430 ± 212 4,860 ± 1,230<br />
Radish –<br />
red part<br />
282 ± 67 3,543 ± 762 6,260 ± 1,420<br />
Conclusions<br />
Metal concentration (Cd, Cu) in radish depends on the<br />
concentration of the metal in soils in which the plants were<br />
grown. DGT technique can provide relevant information on<br />
accessible form of elements in the soil.<br />
Acknowledgement: This work was performed and supported<br />
within the Institutional research plan AV0Z40310501.<br />
s429<br />
Table II<br />
Copper content in soils and in dry matter of plant samples<br />
grown in these soils<br />
Concentration of Cd [μg kg –1 ]<br />
Control Cu 100 ppm Cu 200 ppm<br />
soil soil soil<br />
Leaching – 10.9 ± <strong>2.</strong>1 210 ± 11 202 ± 39<br />
nanO 3<br />
Leaching – 7.71 ± 0.40 75.9 ± 18.9 77.9 ± 6.3<br />
water<br />
DGT unit 0.191 ± 0.030 3.71 ± 0.19 4.96 ± 0.33<br />
Radish – 2,340 ± 440 7,220 ± 1,160 11,600 ± 4,600<br />
white part<br />
Radish – 3,520 ± 505 15,200 ± 1,830 42,800 ± 21,400<br />
red part<br />
REFEREnCES<br />
1. Davison W., Zhang H.: nature 367, 545 (1994).<br />
<strong>2.</strong> Ure A. M., Quevauviller P., Muntau H., Griepink B.: Int.<br />
J. Environ. Anal. Chem. 51, 135 (1993).<br />
3. Gusta S. K., Aten C.: Int. J. Environ. Anal. Chem. 51, 25<br />
(1993).<br />
4. DGT measurements in waters, soils and sediments; DGT<br />
Research Ltd., Lancaster, UK http://www.dgtresearch.<br />
com, (January 2008).
Chem. Listy, 102, s265–s1311 (2008) Environmental Chemistry & Technology<br />
P49 SPECTROPhOTOMETRIC<br />
MICRODETERMINATION OF PhOSPhATE<br />
bASED ON ThE ION ASSOCIATION COMPLEx<br />
wITh RhODAMINE b IN wATER<br />
MARTIn MOOS and LUMíR SOMMER<br />
Brno University of Technology,Chemistry and Technology of<br />
Environmental Protection, Purkyňova 118, 612 00 Brno,<br />
xcmoos@fch.vutbr.cz<br />
Introduction<br />
Phosphate may be a serious problem for the ecosystem 1,2<br />
since it is the main reason for the eutrophication of natural<br />
surface waters. In the presence of phosphate, a considerable<br />
growing of anabaena is observed which release toxins after<br />
their extinction. Moreover, the phosphates cause a considerably<br />
growing of water plants which consume the oxygen<br />
contents in water, and interfere with the aquatic life. The<br />
visual spectrophotometry 3,4 often based on the interaction of<br />
molybdatophosphate or molybdatovanadato-phosphate with<br />
some basic dyes is often used for its determination. 5–8 The<br />
formation of an ion associate with the sensitive Rhodamine B<br />
(Tetraethylrhodamine) was studied in detail in this paper.<br />
Experimental<br />
C h e m i c a l s<br />
All chemicals used were in analytical grade quality.<br />
0.01 mol dm –3 standard solution of phosphate was prepared<br />
from 0.3402 g KH 2 PO 4 (Lachema, Brno, Czech Republic)<br />
in 250 ml, previously dried 1h at 130 °C.<br />
0.3 mol dm –3 solution of sodium molybdate, (Lachema,<br />
Brno, Czech Republic) and 1 × 10 –3 mol dm –3 , solution of<br />
Rhodamine B (Tetraethylrhodamine), (Merck, Darmstadt,<br />
SRn) in milli Q water were stock solutions.<br />
Brij 35 (Aldrich, Steinheim, SRn), Triton X 100 (Calbiochem<br />
Co., San Diego, USA) and Polyvinylalcohol (PVA)<br />
(Sigma, Steinheim, SRn) surfactants were in 1 % wt. aqueous<br />
solutions.<br />
Astasol standard solutions with 1 g dm –3 of SiO 3 2- , Ca 2+ ,<br />
Al 3+ , Fe 3+ , K + , na + , Mg 2+ , As 3+ , Cl – , SO 4 2– , nH4 + , nO3 – ,<br />
nO 2 – (Analytika, Praha, ČR), were used for studying interferences.<br />
R e a l W a t e r s S a m p l e s<br />
Surface water from the River Sázava, mineral water<br />
Korunní, drinking water from the Brno water supply and sea<br />
water from the Mediterranean Sea were sampled. The water<br />
samples were filtered by using membrane filter with pore size<br />
0.45 µm.<br />
I n s t r u m e n t<br />
Spectrophotometer Spectronic UnICAM UV 500<br />
(Spectronic Unicam, UK, Cambridge).<br />
s430<br />
C a l i b r a t i o n p l o t s a n d l i m i t s o f<br />
d e t e c t i o n<br />
All linear calibration plots were evaluated according<br />
to the standard ČSn ISO 8466-1 10 characterizing necessary<br />
statistical characteristics for evaluation of linear calibration<br />
plots (variation range homogeneity test and linearity test).<br />
The detection limits were expressed according to Graham<br />
9 , Miller 11 and to IUPAC 13 .<br />
The method of continuous variation 12 was used for the<br />
evaluation of the mol ratio of components.<br />
Results<br />
The sequence of mixing components has an important<br />
effect for the sensitivity and reproducibility of the<br />
method. The maximal absorbance was reached for the following<br />
order of mixied components: phosphate → nonionic<br />
surfactant → sodium molybdate → sulphuric acid →<br />
Rhodamine B. The absorbance of the ternary species of<br />
12–molybdatophosphate with Rhodamine B reaches its<br />
maximum value for 8.3 × 10 –5 mol dm –3 Rhodamine B and<br />
0.03 mol dm –3 sodium molybdate after 20 min. at 572 nm.<br />
The higher concentrations of both components are responsible<br />
for the absorbance decreases.<br />
E f f e c t o f A c i d i t y<br />
In the following range 0.1–3.0 mol dm –3 , the absorbance<br />
considerably decreased with the increasing concentration of<br />
sulphuric acid. 1 mol dm –3 of H 2 SO 4 was optimal for obtaining<br />
stable absorbance of the associate in time. Hydrochloric<br />
acid has a similar effect but 1.5 mol dm –3 was used for further<br />
measurements.<br />
E f f e c t o f s u r f a c t a n t s<br />
Three non-ionic surfactants were used, Brij 35, Triton<br />
X 100 and PVA respectively, from which 0.01 % wt.<br />
of Brij 35 was optimal. In the presence of Triton X 100 the<br />
adsorption of the ion associate on glass surface was observed.<br />
PVA 30,000–70,000 mol. weight does not prevent turbidity<br />
in solution.<br />
C a l i b r a t i o n P l o t s a n d D e t e c t i o n<br />
l i m i t s ( L O D )<br />
The strictly linear calibration plots were evaluated for six<br />
concentration levels between1 × 10 –6 –7 × 10 –6 mol dm –3 . The<br />
points were measured in triplicate for the optimal conditions<br />
1 mol dm –3 sulphuric acid, 0.01 % wt. Brij 35, 0.03 mol dm –3<br />
sodium molybdate and 8.3 × 10 –5 mol dm –3 Rhodamine B for<br />
the evaluation were used.<br />
e f f e c t o f i o n s<br />
1,000 : 1 Mg 2+ , K + , na + , nH 4 + , nO3 – , SO4 2– , Cl – , HCO3 –<br />
did not interfere the determination of 1 × 10 –6 mol dm –3<br />
H 2 PO 4 and 100 : 1 Al 3+ , Fe 2+ , Ca 2+ . As (III, V) and nO 2 –<br />
interfered above concentrations only which are not present<br />
in natural waters. The SiO 3 2– was successfully masked with<br />
6.7 × 10 –4 mol dm –3 tartaric acid.
Chem. Listy, 102, s265–s1311 (2008) Environmental Chemistry & Technology<br />
Table I<br />
Calculated values from calibration plots<br />
T h e S t o i c h i o m e t r y o f t h e T e r n a r y<br />
S p e c i e s o f 1 2 - M o l y b d a t o p h o s p h a t e<br />
w i t h R h o d a m i n e B<br />
The molar ratio of components in the ion associate<br />
was expressed from the method of continuous variations1<strong>2.</strong><br />
n<br />
y = 0.1421x + 0.0104 R 2 = 0.9987<br />
X Δ α a 0.40 × 10 –6 mol dm –3 1.24 × 10 –5 g dm –3<br />
X Δ β a 1.18 × 10 –6 mol dm –3 3.66 × 10 –5 g dm –3<br />
X m b 0.79 × 10 –6 mol dm –3 <strong>2.</strong>44 × 10 –5 g dm –3<br />
X 3σ c 0.83 × 10 –6 mol dm –3 <strong>2.</strong>56 × 10 –5 g dm –3<br />
ε σ d 142123 ± 3767 mol –1 cm –1 dm 3<br />
x<br />
1− x<br />
max<br />
= .The resulting value of n was n = = 1<br />
max<br />
0,<br />
5<br />
1−<br />
0,<br />
5<br />
Fig. 1. The point 0 on the jobs curve corresponds with the<br />
maximal concentration of the Rhodamine b and zero concentration<br />
of phosphate, the point 1 with the maximal concentration<br />
of phosphate and zero concentration of Rhodamine b. points<br />
belong to the total absorbance of solution, points belong to the<br />
Rhodamine b blank<br />
This molar ratio corresponds with the ratio between phosphate<br />
and Rhodamine B as 1 : 1. Which describes the composition<br />
of the ion associate such as H 2 P[Mo 3 O 10 ] 4 – . RhB + in<br />
1 mol dm –3 H 2 SO 4 .<br />
A p p l i c a t i o n s F o r t h e R e a l S a m p l e s<br />
o f W a t e r<br />
For all kinds of water, the method of standard additions<br />
in six concentration levels which are 1, 2, 4, 6,<br />
7 × 10 –6 mol dm –3 was used. The concentration of phosphate<br />
was found 0.1 ± 0.02 mg dm –3 triplicate the values in the<br />
.<br />
s431<br />
Fig. <strong>2.</strong> The supposed structure of the ion associate<br />
river water and 0.16 ± 0.007 mg dm –3 phosphate in the drinking<br />
water. The determination could not be carried out by<br />
this approach for mineral water because of increased contents<br />
of silicate in solution. The optimal concentration of<br />
6.7 × 10 –4 mol dm –3 tartaric acid is not effective for masking<br />
but the necessary higher concentration of tartaric acid would<br />
interfere with the determination of phosphate. The concentration<br />
of phosphate in the analyzed sea water was under the<br />
detection limit and the method of standard addition can not<br />
be used.<br />
REFEREnCES<br />
1. Klein G., Perera P.: Eutrophication and health. WHO<br />
and EC, Luxembourg 200<strong>2.</strong><br />
<strong>2.</strong> Pitter P.: Hydrochemie. VŠCHT, Praha 1999.<br />
3. Marczenko Z.: Separation and spectrophotometric<br />
deter-mination of elements. Ellis-Horwood, Chichester<br />
1986.<br />
4. Malát M.: Absorpční anorganická fotometrie. Academia,<br />
Praha 1973.<br />
5. Xiao L. H., Jia Z. Z.: Anal. Chim. Acta 55, 580 (2006).<br />
6. Sommer L., Doležal J.: Scripta fac. Sci. nat. Univ. Purk.<br />
Brun 19, 159 (1989).<br />
7. Kratochvíla J., Sommer L.: Scripta Fac. Sci. nat. Univ.<br />
Purk. Brun 10, 53 (1980).<br />
8. Kartikeyan S., Rao T. P., Iyer C. S. P., Damodaran A. D.:<br />
Microchimica Acta 71, 113 (1994).<br />
9. Graham R. C.: Data Analysis for the Chemical Science.<br />
VCH Publisher, new York 1993.<br />
10. ČSn ISO 8466-1: Kalibrace a hodnocení analytických<br />
metod a určení jejich charakteristik -Část 1: Statistické<br />
hodnocení lineární kalibrační funkce (březen 1994).<br />
11. Miller J. n., Miller J. C.: Statistics and Chemometrics<br />
for Analytical Chemistry. Pearson Education Limited,<br />
new York 2005.<br />
1<strong>2.</strong> Sommer L., Hniličková M.: Bull. Soc. Chim. France<br />
1959, 36.<br />
13. MacDougall D.: Anal. Chem. 52, 2242 (1980).
Chem. Listy, 102, s265–s1311 (2008) Environmental Chemistry & Technology<br />
P50 DETERMINATION OF uRANIuM by ICP-<br />
AES IN ThE AbSENCE AND PRESENCE OF<br />
PRECONCENTRATION ON MACROPOROuS<br />
SORbENTS<br />
MARTIn MOOS, KRISTýnA URBánKOVá and LUMíR<br />
SOMMER<br />
Brno University of Technology,Chemistry and Technology of<br />
Environmental Protection, Purkyňova 118, 612 00 Brno,<br />
xcmoos@fch.vutbr.cz<br />
Introduction<br />
Determination of uranium at very low concentrations<br />
often needs preconcentration in order to meet the detection<br />
limit of a given analytical method. Matrix interferences are<br />
another problem when using AAS and ICP-AES. The preconcentration<br />
by solid phase extraction is simple, rapid and usually<br />
help to eliminate interferences from the matrix elements.<br />
Several sorbents were used for preconcentration and separation<br />
of trace uranium (VI) 1 , among them the macroporous<br />
Amberlite XAD resins 2,3 , silica 4,5 , active carbon 6 and polyurethane<br />
foam 7 which can be loaded with completing reagents.<br />
The modified Amberlite XAD 4 resin in various particle size<br />
was studied for the sorption of uranium in this paper prior to<br />
the final determination by ICP-AES 1–3 .<br />
Experimental<br />
C h e m i c a l s<br />
All chemicals used were of analytical grade quality.<br />
1 g dm –3 standard solution of uranium (VI) Astasol<br />
(Analytika, Praha, Czech Republic)<br />
0.5 g dm –3 solution of 4-(2-pyridylazo)resorcinol (PAR)<br />
from, Lachema, Brno, Czech Republic, the ammonium salt<br />
of pyrrollidincarbodithioate (APDC) from, Lachema, Brno,<br />
Czech Republic, 8-hydroxyquinoline-5-sulphonic acid (8-<br />
HQS) from Aldrich, Steinheim, Germany and 1,2-dihydroxybenzene<br />
(PYR) from Lachema, Brno, Czech Republic in<br />
distilled water were stock solutions.<br />
Cationic surfactants 1-ethoxycarbonylpentadecyl-trimethylammonium<br />
bromide (Septonex ® ) from Tamda, Oloumouc,<br />
Czech Republic, benzyldimethyltetradecyl-ammonium<br />
chloride (Zephyramin ® ) from Merck, Darmstadt, Germany<br />
and benzyldimethyldodecyl-ammonium bromide (Ajatin®)<br />
from Fluka, Buchs, Switzerland were in 0.1 mol dm –3<br />
aqueous solutions.<br />
The macropourous sorbent Amberlite ® XAD 4 (Fluka,<br />
Buchs, Switzerland) was previously dried 24 h at 100 °C,<br />
milled and sieved; the fraction 0.32–0.63 µm was used and<br />
ctivated in methanol for 24 hours. 200 mg of activated sorbent<br />
was filled into empty cartridges. The columns were finally<br />
washed by 10 ml of acetone and 10 ml of distilled water.<br />
Solutions for the sorption or the eluent were aspirated<br />
through the sorbent-filled plastic cartridges using the vacuum<br />
pump operated vacuum suction device Dorcus (Tessek,<br />
Praha, Czech Republic). A peristaltic pump UnIPAM 315<br />
(Scientific instrument, Warszawa, Poland) was attached with<br />
s432<br />
3 mm wide silicon tubing to the cartridges and operated at a<br />
solution flow rate of 1 ml min –1 .<br />
I n s t r u m e n t<br />
An echelle-based ICP-spectrometer with a prism predisperser<br />
IRIS AP (Thermo Jarell Ash, U.S.A.) containing<br />
a CID detector with 512 × 512 pixels for 195–900 nm, axial<br />
plasma discharge and echelle grating with 54.4 lines mm –1<br />
was used. The plasma source was a generator with 27.12 MHz<br />
with the power output of 1.35 kW. The plasma argon flow rate<br />
was 12 dm 3 min –1 . The integration time was 30 s. The results<br />
were the average of 3 measurements. Spectral lines (nm) in<br />
high orders: U 385.958 and U 409.014 nm were tested for<br />
the determination and the spectral line 385.958 was used for<br />
future measurement.<br />
C a l i b r a t i o n P l o t s a n d L i m i t s o f<br />
D e t e c t i o n<br />
All linear calibration plots were evaluated according to<br />
the ČSn ISO 8466-1 standard including the variation range<br />
homogeneity test and linearity test 8 . The confidence limits of<br />
the plot are also expressed.<br />
The recovery was calculated by the expression<br />
c(<br />
U )<br />
R =<br />
eluted ⋅<br />
c(<br />
U ) applied onto the column<br />
where f is the enrichment factor.<br />
The detection limit was expressed according to Graham<br />
9 , Miller 10 from the calibration plots and to IUPAC 11<br />
from 10 points of the blank.<br />
Results<br />
D e t e r m i n a t i o n o f U r a n i u m b y<br />
I C P - A E S i n t h e A b s e n c e o f<br />
P r e c o n c e n t r a t i o n<br />
Some determination in geological samples was earlier<br />
described 12 . A 10% signal decrease was observed for<br />
0.75 mol dm –3 HnO 3 , but for 1 mol dm –3 HCl the decrease<br />
reaches 20 %. In the presence of various 3 × 10 –3 mol dm –3<br />
surfactants, Brij 35, Zephyramine, Ajatin and dodecylsuphate<br />
the 5–15 % increase of the calibration slope was observed.<br />
Similarly, the slope of calibration plots increased by 5 % in<br />
the presence of 6 × 10 –5 mol dm –3 PAR, 9 × 10 –5 mol dm –3<br />
APDC or <strong>2.</strong>2 × 10 –5 mol dm –3 8-HQS. (cf. Table I)<br />
C a l i b r a t i o n p l o t s a n d e f f e c t o f<br />
i n t e r f e r i n g i o n s<br />
The strictly linear calibration plots were evaluated<br />
for seven concentration levels between 0.1 mg dm –3 –<br />
50 mg dm –3 . The points were measured in triplicate. The detection<br />
limits were X ∆ α = 1.26 mg dm –3 , X∆ β = 3.69 mg dm –3<br />
according to Graham, X ∆ m = 1.13 mg dm –3 according to Miller<br />
and 0.30 mg dm –3 according to IUPAC.<br />
For 1–3 mg dm –3 U, no interference were observed for<br />
100 : 1 nO 3 – , Cl – , SO4 2– , SiO3 2– , nH4 + , na + , K + , Ca 2+ , Mg 2+ ,<br />
f<br />
(1)
Chem. Listy, 102, s265–s1311 (2008) Environmental Chemistry & Technology<br />
Table I<br />
The regression equation for different selected systems<br />
U (VI) Solution regression equation<br />
Basic a y = 4.48x + 1.29<br />
Septonex b y = 4.49x + 0.23<br />
Dodecylsulphate c y = 5.37x + 1.08<br />
0.75 mol dm –3 HnO3 y = 4.04x + <strong>2.</strong>18<br />
1 mol dm –3 HCl y = 3.75x + 3.18<br />
PAR d y = 4.95x + 1.32<br />
APDC e y = 4.83x + 0.43<br />
a calibration plots for 1 mg dm –3 –15 mg dm –3 U without orga-<br />
nic reagents ;<br />
b 3 × 10 –3 mol dm –3 Septonex;<br />
c 3 × 10⁻³ mol dm –3 sodium dodecylsulphate;<br />
d 2 × 10 –5 mol dm –3 PAR;<br />
e 3 × 10 –5 mol dm –3 APDCin solution<br />
Al 3+ . The 10 : 1 excess of multicomponent standards containing<br />
Br – , Cl – , Br – , SO 4 2– , PO4 3– or Cd 2+ , Co 2+ , Cr 3+ , Cu 2+ ,<br />
Mn 2+ , Pb 2+ , V 5+ and Zn 2+ (each of metal ion) in the absence<br />
or presence of Y 3+ internal standard (1 mg dm –3 ) did not<br />
interfere. 10 : 1 excess of Fe 3+ interferes strongly by the 50%<br />
signal decrease in the presence of Y 3+ .<br />
D e t e r m i n a t i o n o f U r a n i u m b y I C P -<br />
A E S A f t e r t h e P r e c o n c e n t r a t i o n o n<br />
M o d i f i e d A m b e r l i t e X A D 4<br />
Prior to the sorption, the column was conditioned by<br />
10 ml of 5 × 10 –3 mol dm –3 Septonex whose pH was adjusted<br />
by hydrochloric acid and sodium hydroxide. This procedure<br />
was always used for the sorption.<br />
E f f e c t o f S u r f a c t a n t s a n d O r g a n i c<br />
R e a g e n t s<br />
The retention efficiency of 3 mg dm –3 U from 50 ml<br />
volume with the optimal pH 9 without surfactants and organic<br />
reagents was 56 % only. The elution of uranium from the<br />
column was carried out with 10 ml acetone and 1 mol dm –3<br />
nitric HnO3 (1 : 1). The various surfactants were used such<br />
as non-ionic Brij 35, cationic Septonex or Zephyramine<br />
and anionic dodecyl sulphate respectively, from which<br />
5 × 10 –3 mol dm –3 of Septonex was optimal for conditioning<br />
and allowed the recovery of 96 % U. The recovery with<br />
dodecylsulphate was 81 % U. Brij 35 produced a foam in the<br />
column and Zephyramine did not prevent turbidity during<br />
evaporation, when HnO3 was used for elution.<br />
Moreover the sorption of 1.5–15 mg dm –3 of U was<br />
quantitative by using 6 × 10 –5 mol dm –3 PAR and 9 × 10⁻⁵<br />
– 1.8 × 10 –4 mol dm –3 APDC which corresponds with the 5 or<br />
10 fold excess of reagent and the recovery nearly 100 % was<br />
obtained in the presence of 1.3 × 10 –4 mol dm –3 8-HQS and<br />
1.4 × 10 –4 mol dm –3 PYR. Thus, 6 × 10 –5 mol dm –3 of PAR was<br />
recommended for following preconcentration.<br />
s433<br />
Fig. 1. Effect of organic reagents. pH = 5; pH = 7;<br />
pH = 9; a 6 × 10 –5 mol dm –3 PAR, b 1.2 × 10 –4 mol dm –3 PAR,<br />
c 9 × 10 –5 mol dm –3 APDC, d 1.8 × 10 –4 mol dm –3 APDC,<br />
e 6.7 × 10 –5 mol dm –3 8-hQS, f 1.3 × 10 –4 mol dm –3 8-hQS,<br />
g 1.4 × 10 –4 mol dm –3 PyR; h <strong>2.</strong>7 × 10 –4 mol dm –3 PyR, 3 mg dm –3 u<br />
was sorbed after conditioning the sorbent with 5 × 10 –3 mol dm –3<br />
Septonex solution<br />
E f f e c t o f p H<br />
The influence of pH on the sorption follows from Table II.<br />
The sorption was quantitative in the interval of pH 7–9.<br />
Table II<br />
Effect of pH on the sorption a<br />
pH recovery [%]<br />
9 100.0 ± 3.6<br />
8 99.5 ± 3.7<br />
7 100.6 ± <strong>2.</strong>4<br />
6 89.6 ± 4.8<br />
5 88.6 ± 5.3<br />
4 8<strong>2.</strong>7 ± 0.9<br />
a From 50 ml of sample with 3 mg dm –3 U, in the presence<br />
of 6 × 10 –5 mol dm –3 PAR and after conditioning the sorbent<br />
with 5 × 10 –3 mol dm –3 Septonex solution. The sorption was<br />
carried out in triplicate<br />
E f f e c t o f E l u e n t s<br />
For the quantitative elution of the complex of uranium<br />
(VI) with the used reagents, acetone, ethanol and methanol<br />
in different ratio with 1 mol dm –3 nitric acid were tested. The<br />
most effective eluent with 100% recovery of U was 10 ml of<br />
1 : 1 acetone and 1 mol dm –3 nitric acid or the 1 : 1 mixture of<br />
acetone and 4 mol dm –3 HnO 3 mixtures. The best eluents are<br />
compared in Table III.<br />
Conclusions<br />
The sorbent XAD-4 in the presence of 4-(2pyridylazo)resorcinol<br />
or pyrrollidincarbodithioate was<br />
observed for the separation and preconcentration of Uranium<br />
(VI) at pH 9. The column of Amberlite XAD 4 of<br />
particle size 0.32–0.63 µm was washed with 10 ml of acetone<br />
and 10 ml of distilled water, and conditioned with
Chem. Listy, 102, s265–s1311 (2008) Environmental Chemistry & Technology<br />
Table III<br />
The recovery with different eluents<br />
Elution reagent Recovery of U [%] a<br />
Ethanol-HnO 3 [1 mol dm –3 ] 92 ± 5<br />
Aceton-HnO 3 [1 mol dm –3 ] 100 ± 3<br />
Methanol-HnO 3 [1 mol dm –3 ] 94 ± 2<br />
a eluted with 10 ml of eluent in triplicate<br />
5 × 10 –3 mol dm –3 Septonex solution. The sample solution<br />
containing 1.5–15 mg dm –3 U with 6 × 10 -5 mol dm –3 of PAR<br />
was applied on the column with 1 ml min –1 . The column<br />
was then washed with 15 ml of distilled water and uranium<br />
eluted with a mixture of acetone : 1 mol dm –3 HnO 3 (1 : 1) .<br />
The organic solvent was removed by evaporation under an IR<br />
lamp to 2 ml in a suitable Teflon ® dish. The residue was then<br />
diluted to 10 ml by distilled water and analyzed by ICP-AES.<br />
(cf. Table IV)<br />
REFEREnCES<br />
1. Rao T. P., Metilda P., Gladis J. M.: Talanta 68, 1064<br />
(2006).<br />
<strong>2.</strong> Ramesh A., Mohan K. R., Seshaiah K.: Talanta 57, 243<br />
(2002).<br />
3. Singh B. n., Maiti B.: Talanta 69, 393 (2006).<br />
4. Leepipatpiboon V.: J. Chromatography A 697, 137<br />
(1995).<br />
5. Ueda K., Koshino Y., Yamamoto Y.: Anal. Lett. 18, 2345<br />
(1985).<br />
6. Okamota Y., Murata T., Kumamaru T.: Anal. Sci. 7, 879<br />
(1991).<br />
s434<br />
Table IV<br />
The efficiency for uranium (VI) in the presence of org. reagent<br />
at pH 9 on Amberlite XAD 4<br />
Org. reagent Uranium (VI)<br />
1.5 mg dm –3 3 mg dm –3 15 mg dm –3<br />
PAR a 1.53 ± 0.02 <strong>2.</strong>99 ± 0.05 14.75 ± 0.12<br />
APDC b 1.65 ± 0.09 3.05 ± 0.05 15.69 ± 0.15<br />
APDC c 1.43 ± 0.07 3.01 ± 0.05 14.48 ± 0.69<br />
a 6 × 10 –5 mol dm –3 PAR,<br />
b 9 × 10 –5 mol dm –3 APDC,<br />
c 1.8 × 10 –4 mol dm –3 APDC,<br />
d The sorbent conditioned with 5 × 10 –3 mol dm –3 Septonex<br />
and the sorption carried out in triplicate<br />
7. Ferreira S. L. C.: Spec. Chim. Acta Part B 62, 4 (2007).<br />
8. ČSn ISO 8466-1: Kalibrace a hodnocení analytických<br />
metod a určení jejich charakteristik -Část 1: Statistické<br />
hodnocení lineární kalibrační funkce (březen 1994).<br />
9. Graham R. C.: Data Analysis for the Chemical Science.<br />
A Guide to Statistical Techniques, VCH Publisher, new<br />
York 1993.<br />
10. Miller J.n., Miller J. C.: Statistics and Chemometrics for<br />
Analytical Chemistry. Pearson Education Limited, new<br />
York 2005.<br />
11. MacDougall D., Crummett W.B.: Anal. Chem. 52, 2242<br />
(1980).<br />
1<strong>2.</strong> Kanický V., Abu-Ajamieh Y., Awadat A. W.: Scripta Fac.<br />
nat. Univ. Masaryk. Brun. 25, 21 (1995).
Chem. Listy, 102, s265–s1311 (2008) Environmental Chemistry & Technology<br />
P51 SIMuLTANEOuS SPECIATION OF SELENIuM<br />
AND MERCuRy IN <strong>ENVIRONMENTAL</strong><br />
SAMPLES by uSING A COLuMN SwITChING<br />
SySTEM wITh LIQuID ChROMATOGRAPhy<br />
COuPLED TO ICP-MS<br />
F. MOREnO, T. GARCíA-BARRERA and J. L. GóMEZ-<br />
ARIZA<br />
Departamento de Química y Ciencia de los Materiales “Prof.<br />
J. C. Vílchez Martín”. Facultad de Ciencias Experimentales.<br />
Universidad de Huelva, Campus de El Carmen. 21007<br />
Huelva (Spain),<br />
fernando.moreno@dqcm.uhu.es<br />
Introduction<br />
Mercury is a very toxic element which damages the central<br />
nervous system, endocrine system, kidneys, and other<br />
organs. Exposure over long periods of time or heavy exposure<br />
to mercury vapour can result in brain damage and ultimately<br />
death. Mercury and its compounds can produce serious birth<br />
defects.Compounds of mercury tend to be much more toxic<br />
than the element itself. 1–3<br />
On the other hand selenium is an essential micronutrient<br />
for animals with biological functions as cofactor. However<br />
it is toxic in large doses. Selenium deficiency can lead to<br />
Keshan and Kashin-Beck diseases. If it is taken in excess it<br />
can lead to seleniosis. In addition, several studies have suggested<br />
a link between cancer and selenium deficiency 4 .<br />
It has been issued that Se-methionine inhibits some neurotoxic<br />
effects of methylmercury. 5–7<br />
For this reason, the development of new analytical strategies<br />
for multielemental speciation is a primordial issue.<br />
In the present study, a new method for the detection<br />
of Se- and Hg- species has been developed, including chiral<br />
species.<br />
Experimental<br />
I n s t r u m e n t a t i o n<br />
The HPLC system is an Agilent 1100 series. The<br />
columns used were a Phenomenex Bondclone C18,<br />
300 mm × 3.90 mm, 10 μm; and an Astec Chirobiotic T<br />
column, 250 mm × 4.6 mm.<br />
An inductively coupled plasma mass spectrometer<br />
Model HP 4500 (Hewlett Packard, Yokogawa, Analytical<br />
System, Tokyo, Japan) equipped with a Babington nebuliser<br />
was used in this study.<br />
R e a g e n t s a n d S t a n d a r d s<br />
All reagents were of analytical reagent grade. Deionized<br />
water (18 MΩ cm –1 ) was obtained from a Milli-Q water<br />
purification system (Millipore, UK). 2-mercaptoethanol 98%<br />
was purchased from Sigma–Aldrich (Steinheim, Germany)<br />
and tetraethylammonium chloride from Fluka (Switzerland).<br />
Ammonium acetate and nitric acid were obtained from Merck<br />
(Darmstadt, Germany).<br />
s435<br />
Stock standard solutions of 1,000 mg Se dm –3 were<br />
prepared in deionized water from selenocystine (SeCys 2 ,<br />
Sigma), seleno-DL-methionine (Se-DL-Met, Sigma), seleno-<br />
L-methionine (Se-L-Met, Sigma), selenomethylselenocysteine<br />
(SeMeSeCys, Sigma), selenocystamine (SeCA, Sigma),<br />
sodium selenate (na 2 SeO 4 ) and sodium selenite (na 2 SeO 3 ).<br />
Methylmercury chloride stock standard solution was<br />
prepared at 1,000 mg Hg dm –3 by dissolving methylmercury<br />
chloride (Merck (Darmstadt, Germany) into 2% HnO 3 .<br />
Mercury chloride stock standard solution was prepared as<br />
1,000 mg Hg dm –3 solution by dissolving mercury chloride<br />
(Merck (Darmstadt, Germany) into 10% HnO 3 .<br />
P r o c e d u r e<br />
A 0.075% tetraethylammonium chloride water solution<br />
at pH 4.5 (mobile phase A) and a 5% (v/v) methanol-water<br />
solution containing 0.06 mol dm –3 ammonium acetate and<br />
0.1% (v/v) 2-mercaptoethanol (mobile phase B) were used as<br />
the mobile phases for HPLC. The flow rate was 1 ml min –1 and<br />
the sample injection volume was 100 μl. The columns were<br />
connected using three valves to build a column swithching<br />
system and species were on-line detected by ICP-MS. The<br />
columns outlets were connected directily to the nebulizer of<br />
the ICP-MS system.<br />
Elemental detection was performed using a model 4500<br />
ICP-MS system. The plasma and auxiliary argon flow rates<br />
were 15 and 1 dm 3 min -1 , respectively. The nebulizer gas flow<br />
rate was 1.28 dm 3 min -1 . The forward RF power was fixed at<br />
1,266 W. The dwell time was 3 seconds per isotope and 77 Se,<br />
82 Se and 202 Hg were monitored.<br />
Table I<br />
HPLC conditions<br />
Time Mobile phase Columns<br />
0–5.1 A RP<br />
5.1–6.15 A RP + Chiral<br />
6.15–8.3 A RP<br />
8.3–13.3 A RP + Chiral<br />
13.3–25 B RP<br />
RP = Phenomenex Bondclone C18 column,<br />
300 mm × 3.90 mm, 10 μm<br />
Chiral = Astec Chirobiotic T column, 250 mm × 4.6 mm,<br />
In our study of selenium and mercury speciation have<br />
been successfully separated six selenium compounds and<br />
two major mercury compounds in biological samples using<br />
a reversed-phase column. The chiral species of selenium was<br />
later separated with the second column.<br />
After the injection in the loop, all species go into the<br />
reversed phase column and later directly to the ICP-MS,<br />
using the mobile phase A. With this program, SeCM, SeCys,<br />
SeMeSeCys and Se (IV) elute before 5.1 minutes. At 5.1<br />
minutes we active the second column, and D-selenomethionine<br />
and L-selenomethionine go throught the chiral column.<br />
After that, at 6.15 minutes we switch off the chiral column,
Chem. Listy, 102, s265–s1311 (2008) Environmental Chemistry & Technology<br />
then Se (VI) go out from reversed phase column to the ICP-<br />
MS. At 8.3 minutes we switch on the chiral column again<br />
going out D-Selenomethionine and L-Selenomethionine.<br />
At this moment, MeHg and inorganic mercury are still<br />
inside the reversed phase column and to get their separation,<br />
at 13.3 minutes we disconnect the chiral column again and<br />
the mobile phase B is pumped. With this change we get the<br />
elution of MeHg and inorganic mercury.<br />
Results<br />
Fig. 1. illustrates the chromatograms obtained with the<br />
method proposed and the Table II show the species detected,<br />
their retention times, detection limits and linear range. The<br />
detection limits vary between 0.3 and 9.7 ng depending<br />
of the species. The Relative Standard Deviation (% RSD) for<br />
the retention time is below 1 % for all species and for peak<br />
area is below 19 % for all species.<br />
Fig. 1. Chromatogram obtained by the proposed method for<br />
77 Se, 82 Se and 202 hg isotopes<br />
Conclusions<br />
This work reports for the first time an analytical methodology<br />
for the chromatographic separation of mercury and<br />
selenium species including chiral ones.<br />
The methodology proposed for the simultaneous speciation<br />
allows a deeper insight into the interaction between Se<br />
and Hg-species which is a key question due to the beneficious<br />
effect of Se-species into Hg toxicity.<br />
s436<br />
Table II<br />
Retention times, detection limits and linear range of the<br />
species<br />
Retention Detection Linear<br />
Peak Species time limit range<br />
[s] [ng] [ppb]<br />
1 Se-cystamine 16<strong>2.</strong>2 6.24 6<strong>2.</strong>4–1,000<br />
2 Se-cystine 189.2 4.03 40.2–500<br />
3<br />
Se-methylselenocysteine<br />
243.3 7.78 77.8–1,000<br />
4 Se (IV) 279.3 7.26 7<strong>2.</strong>6–1,000<br />
5 Se (VI) 420.8 6.63 66.3–1,000<br />
6 Se-L-methionine 717.3 9.67 96.7–1,000<br />
7 Se-D-methionine 75<strong>2.</strong>4 4.78 47.8–1,000<br />
8 Peak due to mobile phase change<br />
9 Methylmercury 1,265.1 4.40 44.0–10,000<br />
10 Inorganic mercury 1,344.4 0.30 3–10,000<br />
The developed methodology allows high sample throughput<br />
and low sample consumption that is highly important<br />
for the application to food and biological samples.<br />
This method don’t has memory effect in the system.<br />
REFEREnCES<br />
1. Devi M., Fingerman M.: B Environ. Contam. Tox. 55,<br />
746 (1995).<br />
<strong>2.</strong> Drevnick P. E., Roberts A. P., Otter, R. R., Hammerschmidt<br />
C. R., Klaper, R., Oris, T.: Comp. Biochem.<br />
Phys. C 147, 331 (2008).<br />
3. Zahir F., Rizwi S. J., Haq S. K., Khan R. H.: Environ. Toxicol.<br />
Phar. 20, 351 (2005).<br />
4. Whanger P. D.: J. nutr. 119, 1236 (1989).<br />
5. Weber D. n., Connaughton V. P., Dellinger J. A., Klemer<br />
D., Udvadia A., Carvan III M. J.: Physiol. Behav. 93,<br />
250 (2008).<br />
6. Dos Santos A. P. M., Mateus M. L., Carvalho C. M. L.,<br />
Batoréu M. C. C.: Toxicol. Lett. 169, 121 (2007).<br />
7. Wen-Xiong W., Wong R. S. K., Wang J., Yu-fong Y.:<br />
Aquat. Toxicol. 68, 39 (2004).
Chem. Listy, 102, s265–s1311 (2008) Environmental Chemistry & Technology<br />
P53 VOLATILE ORGANIC SubSTANCES PRESENT<br />
IN SPICES AND SPRuCE NEEDLES<br />
LUDMILA MRAVCOVá, MILADA VáVROVá, JOSEF<br />
ČáSLAVSKý, MICHAELA STOUPALOVá, ILOnA<br />
HLAVáČKOVá and HAnA VíTEČKOVá<br />
Brno University of Technology, Faculty of Chemistry, Purkyňova<br />
118, 612 00 Brno,<br />
mravcova@fch.vutbr.cz<br />
Introduction<br />
Essential oils are volatile lipophilic substances, usually<br />
colorless. Most often, essential oils consist of terpenes,<br />
namely monoterpenic hydrocarbons, aldehydes, alcohols,<br />
ketones, acids, esters. Their content substances are usually<br />
classified as isoprenoids and phenylpropanoids groups 1 . Their<br />
characteristic scent is conditioned by terpenic compounds, in<br />
general 2 .<br />
The TLC (thin layer chromatography) method can be<br />
used for the identification of essential oil present in spice 1 .<br />
This method is simple, without need of sofisticated and<br />
expensive instrumentation. Defined amount of the analysed<br />
mixture is applied on the starting line of a plate covered by<br />
a thin layer of sorbent (stationary phase). Chromatographic<br />
plate is then placed into the developing chamber with mobile<br />
phase, which rises slowly and evenly through the thin layer,<br />
transporting the individual components of the analyzed mixture<br />
by various speed. Dried thin layer with perceptible stains<br />
of particular compounds of the mixture situated in different<br />
distances from the start – represents TLC chromatogram. The<br />
identification of compounds is performed either via comparison<br />
of their migration distances with standards, or by<br />
comparison of their R F values with those obtained from the<br />
literature 3 .<br />
Another option to identify essential oils is application<br />
of SPME (Solid phase microextraction) in connection with<br />
GC/MS. Solid phase microextraction is simple and efficient<br />
sorptive – desorptive technique used for solventless isolation/<br />
preconcentration of target analytes from the sample matrix 4 .<br />
In the field, this procedure could be also used as passive sampling<br />
method. During this procedure, analytes are sorbed by<br />
thin layer of stationary phase placed on the SPME fiber. The<br />
SPME process continues until the equilibrium in the system<br />
is reached. In physical-chemical terms, the SPME technique<br />
state of equilibrium depends on the analyte properties and on<br />
the type and thickness of polymer covering the silica fiber 4 .<br />
Experimental<br />
For the identification of essential oils present in spice<br />
(caraway, cardamom, pepper, sweet pepper, calamint, cinna-<br />
mon and muscat), two methods were used 5 :<br />
•<br />
•<br />
TLC<br />
SPME, GC/MS<br />
s437<br />
T L C<br />
Spice essential oils isolation proceeded in the following<br />
manner. Spice samples were extracted by ethanol for<br />
10 minutes. After that, the extract was filtered and the spice<br />
was reextracted twice for 20 minutes by petroleum ether.<br />
Extracts were concentrated on the vacuum rotary vaporizer<br />
to the defined volume.<br />
By means of micropippete, concentrated extracts were<br />
applied on the chromatographic plate (Alugram Sil G). The<br />
distance of applied stains was between 0.5–1 cm, the volume<br />
of applied sample was always 10 μl and 20 μl. Ethanol and<br />
petroleum ether extracts I and II were applied on plates.<br />
Plates were developed in a closed chromatographic<br />
chamber, which was filled with a developing agent – mobile<br />
phase formed by the mixture of toluene and ethyl acetate<br />
(ratio 93 : 7). Developing was ascensive and was let in progress<br />
until the mobile phase reached the distance of 1 cm<br />
from the top of the plate. Plates were let to dry and then they<br />
were sprayed by developer for the purpose of visualization of<br />
stains created by separated substances. The used developer<br />
consisted of ethanol and sulphuric acid (ratio 95 : 5), which<br />
was mixed in 1 : 1 ratio with one-percent solution of vanillin<br />
in ethanol. After the chemical detection, plates were dried<br />
again in the drier at the temperature of 105 °C for 5 minutes.<br />
Identification of vizualized stains was performed via comparison<br />
of experimental R F values with those published in the<br />
literature 6 .<br />
S P M E – G C / M S<br />
Weighted amounts of individual spices (1 g) were put<br />
into vials. Substances from spice were sorbed from the headspace<br />
by SPME fiber at the temperature of 40 °C. The compounds<br />
were then directly injected into the gas chromatograph.<br />
The SPME fiber used was 65 μm polydimethylsiloxan/<br />
divinylbenzene (PDMS/DVB) from Supelco. Gas chromatograph<br />
with mass spectrometric detector was Agilent 6890n<br />
GC/5973 MSD. The HP-5MS column (Agilent Technologies,<br />
USA), 30 m × 0.25 mm × 0.25 μm was used, the injector temperature<br />
was 270 °C, oven program was: 45 °C, 2 min, 5 °C<br />
to 200 °C, hold 2 min. He at a flow of 1 ml min –1 (constant<br />
flow mode) was used as a carrier gas, transferline temperature<br />
was 250 °C, ion source temperature was 230 °C, quadrupole<br />
temperature was set to 150 °C. Direct interface connection<br />
was applied, electron ionization at 70 eV was employed.<br />
Results<br />
TLC chromatograms evaluation was performed in<br />
accordance with requirements of the Pharmaceutical Codex 6<br />
, which is valid for phytopharmaca and recomends TLC as<br />
an optimum screening method. R F values were calculated<br />
for each of detected stains. This factor was also used for the<br />
identification. Besides the retention factor, also the colours of<br />
the stains were compared. For example, the comparison of all<br />
sweet pepper extracts shows Table I. In column “Identified<br />
Compound”, unambiguously identified content substance
Chem. Listy, 102, s265–s1311 (2008) Environmental Chemistry & Technology<br />
is presented in bold; where no compliance existed, “n.i.” is<br />
stated, which stands for “not identified”. Concerning results,<br />
it is evident that not all the content substances were present<br />
in all extracts. Mostly, they were detected in the ethanolic<br />
extract and in the first petroleum extract and their presence in<br />
these two extracts was influenced by the chemical nature of<br />
these substances.<br />
Table I<br />
Identification of volatile compounds in sweet pepper<br />
extracts<br />
RF Ethanol RF Petroleum RF Petroleum Identified<br />
ether I ether II compound<br />
– 0.17 – pinene<br />
0.23 0.22 – cymene<br />
0.28 – – terpinene<br />
0.38 0.41 0.39 n.i.<br />
0.52 0.65 0.67 n.i.<br />
0.69 0.68 – n.i.<br />
0.93 – – n.i.<br />
0.96 – – n.i.<br />
0.99 – – n.i.<br />
As the second method of essential oils components<br />
analysis, SPME in connection with GC/MS was used. The<br />
method was optimalized and measurements were performed<br />
under conditions mentioned above. Also by this method, not<br />
the concentration of substances, but their identification was<br />
the matter of concern. In contrast to TLC, the isolation/preconcentration<br />
of target compounds was performed via headspace<br />
method. To confirm the presence of a given substance<br />
nIST spectral library search was used. The Fig. 1. shows<br />
chromatogram of sweet pepper spice. In Table II is a summary<br />
of substances identified via spectral library search in<br />
this spice.<br />
Fig. 1. Chromatogram of sweet pepper<br />
By comparison of Tables I and II it is obvious, that more<br />
single volatile substances and their isomers can be recognised<br />
s438<br />
Table II<br />
Retention times and identification of compounds present in<br />
sweet pepper<br />
Peak number Retention Time Identification<br />
1. 7.97 α-pinene<br />
<strong>2.</strong> 9.24 β-pinene<br />
3. 9.71 β-myrcene<br />
4. 10.09 α-felandrene<br />
5. 10.26 3-karene<br />
6. 10.46 α-terpinene<br />
7. 10.71 p-cymene<br />
8. 10.84 limonene<br />
9. 11.76 γ-terpinene<br />
10. 1<strong>2.</strong>66 4-karene<br />
by means of SPME in connection with GC/MS. Similar comparison<br />
could be made at all spices used.<br />
Conclusion<br />
Analytical separation-based methods were used for the<br />
identification of content substances present in essential oils of<br />
seven spice species. Following results were obtained:<br />
The isolation of essential oils content substances can be<br />
performed by the means of either appropriate solvent<br />
extraction, or passive sampling via SPME.<br />
Screening chromatography method on the thin layer<br />
(TLC) is appropriate for the quick identification of content<br />
substances in essential oils. This method is also<br />
recommended by the Pharmaceutical Codex6 •<br />
•<br />
.<br />
• Decisive GC/MS method enabled the identification of<br />
more content substances, including some isomers, at all<br />
spice and herbal tea samples analysed.<br />
This work was supported by the Ministry of Education<br />
of the Czech Republic under research project MSM 621<br />
71242<strong>2.</strong><br />
REFEREnCES<br />
1. Marsili, R.: Techniques for Analyzing Food Aroma. CRC<br />
1996.<br />
<strong>2.</strong> Podlech, D.: Kapesní atlas léčivé rostliny, Slovart<br />
2007.<br />
3. Wager, H., Bladt, S., Zgainski, E. M.: Plant drug analysis.<br />
Springer – Verlag 1984.<br />
4. Pawliszyn, J.: Solid Phase Microextraction: Theory and<br />
Practice. Wiley-VCH 1997.<br />
5. Sides, S., Robards, K., Helliwell, S.: Trend.Anal.Chem.,<br />
19, 322 (2000).<br />
6. Český farmaceutický kodex. X-EGEM 1993.
Chem. Listy, 102, s265–s1311 (2008) Environmental Chemistry & Technology<br />
P54 ChANGES IN CAROTENOIDS PATTERN IN<br />
MOugeOTiA sP. ALGAE INDuCED by hIGh<br />
LIGhT STRESS<br />
eDWARD MUnTEAn, VICTOR BERCEA, nICOLETA<br />
MUnTEAn and nICOLAE DRAGOş<br />
University of Agricultural Sciences and Veterinary Medicine<br />
Cluj-Napoca, 3–5 Calea Mănăştur, 400372 Cluj-Napoca,<br />
Romania,<br />
edimuntean@yahoo.com<br />
Introduction<br />
When exposure to light exceeds a maximum that can be<br />
used productively by the photosynthesys, a violaxanthin deepoxidation<br />
leads to antheraxanthin and finally to zeaxanthin,<br />
the excessive energy being then dissipated as heat 1 . At lower<br />
irradiance, zeaxanthin is re-epoxidated back to violaxanthin<br />
by zeaxanthin-epoxidase (Fig. 1.).<br />
Fig. 1. The xanthophyll cycle<br />
This reversible interconversion of zeaxanthin and violaxanthin<br />
via antheraxanthin was called xanthophyll cycle or<br />
violaxanthin cycle, being initially studied in higher plants 6,7 ;<br />
further researches established that it has a photoprotective<br />
role, removing the excess excitation energy from the photosynthetic<br />
antennae 1–4 , protecting in this way photosynthetic<br />
organisms from dammage by excessive light. The aim of this<br />
research was to establish the way in which the carotenoid<br />
biosynthesis is influenced by high light stress in the green<br />
algae Mougeotia sp. Agardt.<br />
Experimental<br />
The carotenoid standards were kindly provided by F.<br />
Hoffmann – La Roche, Basel, Switzerland. All solvents were<br />
HPLC grade purity (ROMIL Chemicals). The green algae<br />
Mougeotia sp. Agardt (AICB 560) originated from the collection<br />
of the Institute of Biological Researches Cluj-napoca;<br />
it was grown in a Bold nutritive solution mixed by introducing<br />
air containing 5 % CO 2 , under continuous illumination<br />
(300 µmol m –2 s –1 , measured with a Hansatech Quantum Sensor<br />
QSPAR), at an average temperature of 20 °C for 15 days.<br />
Extraction and high performance liquid chromatography analysis<br />
(HPLC) were conducted according to a previous published<br />
procedure 5 . Separations were performed on an Agilent<br />
1100 system, using a nucleosil 120-5 C 18 column and the<br />
s439<br />
following mobile phases: A – acetonitrile : water (9 : 1) and<br />
B – ethyl acetate. The flow rate was 1 ml min –1 . and the solvent<br />
gradient was as follows: from 0 to 20 min. – 10 % to 70 % B,<br />
then from 20 to 30 min. – 70 % to 10 % B.Carotenoids identification<br />
was completed based on HPLC co-chromatography<br />
with authentic carotenoid standards.<br />
Results<br />
The HPLC chromatogram from Fig. <strong>2.</strong>a reveals the<br />
carotenoid pattern for the saponified extract of Mougeotia sp.<br />
control sample, dominated by two major carotenoids: lutein<br />
and β-carotene. Besides, four xanthophylls (violaxanthin,<br />
lutein, zeaxanthin and 5,6-epoxy-β-carotene) and four carotenes<br />
(α-carotene, β-carotene, 9Z-β-carotene and 15Z-β-carotene)<br />
were also identified.<br />
When the Mougeotia culture was exposed to a high light<br />
irradiation (4,500 µmol m –2 s –1 ), the content of antheraxanthin<br />
increased strongly as a result of de-epoxidation (Fig. <strong>2.</strong>b,<br />
Table I), the carotenoid pattern being dominated by lutein and<br />
antheraxanthin, while among minor carotenoids 5,6-epoxyβ-carotene<br />
moved out and zeaxanthin appeared.<br />
Table I<br />
The carotenoid concentrations of target carotenoids [μg ml –1<br />
algal suspension]<br />
Control Irradiation Recovery after<br />
Carotenoids sample with 4,500 irradiation<br />
[μmol m –2 s –1 ]<br />
Violaxanthin 0.02 0.01 0.10<br />
Antheraxanthin 0.10 0.60 0.05<br />
Lutein 1.00 0.56 0.37<br />
Zeaxanthin 0.00 0.05 0.02<br />
5,6-epoxy-β-carotene 0.04 0.00 0.03<br />
α-carotene 0.04 0.01 0.02<br />
β-carotene 0.19 0.03 0.10<br />
9Z – β-carotene 0.04 0.01 0.02<br />
15Z – β-carotene 0.01 traces 0.01<br />
The whole carotenoid pattern was affected by the light<br />
stress (Fig. <strong>2.</strong>a and <strong>2.</strong>b), not only the xanthophylls involved<br />
in the xanthophyll cycle. Chromatograms emphasize another<br />
important aspect in the studied matrix: the xanthophyll cycle<br />
converts violaxanthin mainly in antheraxanthin, not in zeaxanthin;<br />
this finding agrees with results reported for Mantoniella<br />
squamata 3 , where they were attributed as consequences for<br />
the mechanism of enhanced non-photochemical energy dissipation.<br />
The recovery after the light stress leads to a reversible<br />
epoxidation to violaxanthin, revealed by the chromatogram<br />
from Fig. <strong>2.</strong>c, the final higher violaxanthin level being correlated<br />
with a strong decrease in antheraxanthin concentration<br />
(Fig. <strong>2.</strong>c, Table I), while the new chromatographic pattern is<br />
dominated by four major carotenoids: lutein, β-carotene, violaxanthin<br />
and 5,6-epoxy-β-carotene.
Chem. Listy, 102, s265–s1311 (2008) Environmental Chemistry & Technology<br />
Fig. <strong>2.</strong> hPLC chromatograms of carotenoids from the Mougeotia<br />
sp. samples: a – control sample; b – illumination with<br />
4,500 μmol m –2 s –1 ; c – recovery after illumination. Peak identities<br />
are: 1: violaxanthin, 2: antheraxanthin, 3: lutein, 4: zeaxanthin,<br />
5: 5,6-epoxy-β-carotene, 6: α-carotene, 7: β-carotene, 8: 9Z<br />
– β-carotene, 9: 15Z – β-carotene<br />
a<br />
b<br />
c<br />
s440<br />
Conclusions<br />
The obtained data reveals the way in which the carotenoid<br />
pattern is affected by high light stress in the analyzed<br />
algal strain, as well as the way this reacts during the recovery<br />
stage.<br />
They proved that the xanthophyll cycle’s regulatory<br />
mechanism is functional in Mougeotia sp. algae, leading to<br />
an almost complete interconversion of violaxanthin to antheraxanthin<br />
and zeaxanthin. However, its contribution to nonphotochemical<br />
quenching is not as significant as in higher<br />
plants; the small amounts of zeaxanthin recorded during<br />
experiments suggesting that this strain posses another dissipation<br />
mechanism(s) which operates together with xanthophyll<br />
cycle.<br />
Hence, HPLC analysis revealed a particular behavior of<br />
Mougeotia spp. algae under intense illumination: the major<br />
de-epoxidation product of violaxanthin is not zeaxanthin, but<br />
antheraxanthin. More than that, the high light stress affects<br />
the whole carotenoid biosynthesis, starting with the violaxanthin<br />
cycle’s precursor: β-carotene.<br />
This work has been supported by 2-CEx06-11-54/ 2006<br />
research grant.<br />
REFEREnCES<br />
1. Darko E., Schoefs B., Lemoine Y.: J. Chromatogr. A.<br />
876, 111 (2000).<br />
<strong>2.</strong> Demmig-Adams B.: Trends Plant Sci. 1, 21 (1996).<br />
3. Goss R., Böhme K., Wilhelm C.: Planta 205, 613<br />
(1998).<br />
4. Masojídekl J., Kopeckýl J., Koblížek M., Torzillo G.:<br />
Plant Biol. 6, 342 (2004).<br />
5. Muntean E., Bercea V.: Studia Universitatis Babeş-<br />
Bolyai, Physica, L, 4b, 668 (2005).<br />
6. Sapozhnikov D. I., Krasnovskaya T. A., Mayevskaya<br />
A. n.: Dok.Acad.nauk.SSSR, 113, 465 (1957).<br />
7. Yamamoto H., nakayama O. M., Chichester C. O.:<br />
Arch. Biochem.Biophy. 97, 168 (1962).
Chem. Listy, 102, s265–s1311 (2008) Environmental Chemistry & Technology<br />
P55 SIMuLTANEOuS ION ChROMATOGRAPhIC<br />
DETERMINATION OF ANIONS AND CATIONS<br />
IN SuRFACE wATERS FROM FIZES VALLEy<br />
eDWARD MUnTEAn, TAnIA MIHăIESCU, nICOLETA<br />
MUnTEAn and RADU MIHăIESCU<br />
University of Agricultural Sciences and Veterinary Medicine<br />
Cluj-Napoca, 3–5 Calea Mănăştur, 400372 – Cluj-Napoca,<br />
Romania,<br />
edimuntean@yahoo.com<br />
Introduction<br />
Water Framework Directive 11 demands a concerted<br />
approach in order to achieve a good ecological state for all<br />
water bodies across Europe. The objectives agreed must be<br />
coordinated beyond the level of individual survey areas and<br />
consolidated for the river basin district as a whole.<br />
Fizes catchement, part of Somes catchement tributary of<br />
Tisa watershed, is located in Transylvania Plain, in the northern<br />
part of Romania. A distinctive feature of this area is<br />
the presence of ponds, mainly used for fishery. The major<br />
pollution sources are represented by sediments (generated by<br />
erosional processes and transported in the water bodies) and<br />
diffuse pollution sources (originated from agricultural activities<br />
and the improper septic systems of the localities). Fizes<br />
catchement, through its features of relatively low antropic<br />
pressures and with little structural changes, represents a natural<br />
laboratory for designing and implementing programs of<br />
restorations of watersheds in agricultural landscapes.<br />
In such a context, chemical analysis is usually employed<br />
to identify the aquatic system characteristics including the<br />
assessment of inputs, distribution of various chemical species<br />
and characterization the outputs generated by the physical,<br />
chemical and biological processes developed within the<br />
water bodies. Among the specific chemical indicators, the<br />
inorganic species hold an important place, determining largely<br />
the behavior and evolution of the aquatic system.<br />
The new analytical techniques, generated by the advent<br />
of ion chromatography (IC) deliver a more precise measurement<br />
of the various inorganic species present in the water<br />
body. IC is a high-performance ion-exchange chromatography<br />
technique for the separation and quantification of lowmolecular-weight<br />
ions 1–8 , being in use since 1975, from the<br />
time of the development of the eluent suppressor 6 . Because<br />
of its high accuracy and reliability, IC is nowadays the one<br />
of the most powerful tool for analysis of environmental samples<br />
1,5 , becoming an important technique for the determination<br />
of ionic species for monitoring water quality. This technique<br />
was used for the system of fishing ponds, streams and<br />
ground waters from Fizes Valley watershed (Fig. 1.), which<br />
was studied in order to assess the effects of antropic pollution<br />
through leaching of fertilizers from soils and waste waters<br />
from the villages within its catchement.<br />
An IC method with conductivity detection was developed,<br />
enabling the simultaneous determination of six cations<br />
(Li + , na + , K + , nH 4 + , Mg 2+ and Ca 2+ ) and seven anions (F – ,<br />
s441<br />
Cl – , Br – , nO 2 – , nO3 – , PO4 3– and SO4 2– ) in a single run, saving<br />
thus analytical time, sample pre-treatment and reagents.<br />
Fig. 1. Fizes catchement river network map, with sampling<br />
points’ locations<br />
Experimental<br />
Chemicals for mobile phases’ preparation were of analytical<br />
grade: 4-hidroxybenzoic acid (Acros Organics), lithium<br />
hydroxide (Scharlau) and nitric acid (Merck). Ultrapure water<br />
with a specific resistance of 18.2 MΩ cm –1 was utilized for<br />
preparation of mobile phases as well as for sample dilution,<br />
being obtained from a Direct Q 3UV Smart (Millipore). All<br />
solutions were stored in polyethylene bottles which had been<br />
thoroughly rinsed with ultrapure water. Mobile phases were<br />
filtered through a 0.45 μm membrane (Millipore), and then<br />
degassed using an Elmasonic S30 H ultrasonic bath before<br />
use. Standard working calibration solutions were prepared<br />
from a “six cation standard-II” (Dionex Corporation) and<br />
from “seven cation standard-II” (Dionex Corporation). The<br />
external standard method was used for quantification.<br />
Water samples were collected from seven sources<br />
located in Fizes watershed; samples were passed through a<br />
0.45 μm membrane filter (Millipore), and then were stored<br />
for 24 hours at 4 °C in 0.5 dm 3 polyethylene containers 9,10 ,<br />
each sample was analyzed in triplicates. The samples with<br />
ion concentrations exceeding the calibration range were<br />
diluted accordingly and re-analyzed.<br />
Analyses were performed on a Shimadzu system, consisting<br />
from: a Proeminence DGU 20As online degasser, a<br />
Proeminence LC-20AP solvent delivery module, an automatic<br />
sample injector SIL-10AF, a conductivity detector CDD-<br />
10Avp, a Proeminence CTO-20A column oven, a FCV-10AH 2<br />
valve unit, an Allsep Anion 7u column (150 × 4.6 mm), an<br />
Universal Cation 7u (100 × 4.6 mm) and a Proeminence<br />
CBM-20A system controller in a configuration which is<br />
represented schematically in Fig. <strong>2.</strong> Instrument control, data<br />
acquisition and data analysis were accomplished by a computer<br />
running “LCsolution” ver.1.<strong>2.</strong> software.<br />
300 µl samples were injected in each case; using a temperature<br />
of 40 °C, a total separation of 23 min. was effective<br />
for a good resolution for all seven anions from the mixed
Chem. Listy, 102, s265–s1311 (2008) Environmental Chemistry & Technology<br />
Fig. <strong>2.</strong> Schematic representation of the IC system configuration<br />
used for simultaneous analysis of cations and anions<br />
standard solution (fluoride, chloride, nitrite, bromide, nitrate,<br />
phosphate and sulphate – Fig. 3.) and for all six cations<br />
(lithium, sodium, ammonium, potassium, magnesium and<br />
calcium – Fig. 4.), all peaks being baseline separated.<br />
Fig. 3. Separation for a standard mixture of anions (Allsep<br />
Anion 7u column, using as mobile phase a 4-hidroxybenzoic acid<br />
4mM solution with ph-ul adjusted to 7.5 with LiOh 0.1M, the<br />
flow rate being 0.85 ml min –1 )<br />
Fig. 4. Separation for a standard mixture of cations (universal<br />
Cation 7u column, using as mobile phase a 3 mM hNO3 solution,<br />
the flow rate being 0.5 ml min –1 )<br />
A LGC certified reference material (LGC6020, SPS<br />
ww2) was used for validation.<br />
Results<br />
Calibrations were achieved using five levels of concentration,<br />
for accurately determine the concentration of target<br />
ions. The calibration curves show a good linearity with<br />
R > 0.99 as indicated in Table I, Figs. 5. and 6.<br />
s442<br />
Table I<br />
Results of regression analysis for calibrations<br />
Anion<br />
Linearity<br />
range [ppm]<br />
Regression equation R<br />
F – 4.02–20.10 C = 0.000130278A + 0.83973 0.9978<br />
Cl – 20.40–10<strong>2.</strong>00 C = 0.000117938A – 0.523926 0.9997<br />
nO 2– 20.20–101.00 C = 0.000156194A + 0.11461 0.9997<br />
Br – 20.00–100.00 C = 0.000230581A + 1.34467 0.9995<br />
nO 3– 20.00–100.00 C = 0.000214872A + 0.28929 0.9999<br />
PO 4 3– 40.00–200.00 C = 0.00023591A – 0.68846 0.9994<br />
SO 4 2– 9.94–79.52 C = 0.0001677A – 1.1364 0.9994<br />
Li + 0.99–4.99 C = 0.00000262A – 0.7806 0.9993<br />
na + 4.06–20.30 C = 0.000015644A – <strong>2.</strong>12366 0.9997<br />
nH 4 + 10.30–50.60 C = 0.000015822A + 1.04561 0.9999<br />
K + 5.02–25.10 C = 0.000000898A + 0.62187 0.9997<br />
Ca 2+ 5.04–25.20 C = 0.000000475A + 0.41618 0.9998<br />
Mg 2+ 10.18–50.90 C = 0.000011512A + 1.09553 0.9998<br />
Fig. 5. Calibrations for the reported anions
Chem. Listy, 102, s265–s1311 (2008) Environmental Chemistry & Technology<br />
Fig. 6. Calibrations for the reported cations<br />
s443<br />
From the 13 quantifiable ions, only eight were found<br />
in the analyzed water samples: na + , K + , nH 4 + , Mg 2+ , Ca 2+ ,<br />
Cl – , nO 3 – , PO4 3– and SO4 2– , within a concentration range of<br />
6.64 ppm (for K + ) to 346.27 ppm (for SO 4 2– ). Calibrations for<br />
these ions are presented in figures 5 and 6.<br />
Table II provides information on the anion concentration<br />
while Table III reveals the cation concentration from the<br />
investigated surface waters.<br />
Table III<br />
The anions’ concentrations in the studied water sources (mean<br />
values ± SD)<br />
Location Cl– [ppm] nO 3 – [ppm] SO4 2– [ppm]<br />
Draw well near<br />
Tăul Popii lake<br />
66.99 ± 3.29 79.97 ± 3.97 343.28 ± 17.14<br />
Spring near<br />
Tăul Popii lake<br />
27.53 ± 1.39 – 141.17 ± 7.03<br />
Cătina lake 66.54 ± 3.37 25.63 ± 1.21 346.27 ± 17.31<br />
Geaca lake 57.21 ± <strong>2.</strong>81 23.69 ± 1.15 264.03 ± 13.29<br />
Ţaga lake 94.11 ± 4.70 23.02 ± 0.93 279.85 ± 13.85<br />
ştiucii lake 60.28 ± <strong>2.</strong>96 – 63.69 ± <strong>2.</strong>91<br />
Fizeş river 191.53 ± 9.46 – 254.32 ± 1<strong>2.</strong>62<br />
The higher nitrate concentration in the draw well is<br />
due to the fact that a relatively high nitrate concentration is<br />
a general characteristic for underground water resources in<br />
Fizes catchement; this catchement has substantial diffusion<br />
pollution sources originated by manure and animal breeding.<br />
The chloride concentration ranges from 27.53 ppm (in<br />
a spring located near Tăul Popii lake) to 191.53 ppm (Fizes<br />
river), possible to explain due to the geological substrate of<br />
the area, salt being present as outcrops in the lower part of the<br />
catchement. The sulfate concentration was high in all samples,<br />
ranging from 63.69 ppm (in Stiucii lake) to 347.26 ppm<br />
(in Cătina lake).<br />
All the concentration values are consistent with the<br />
general geological composition of the area. Slightly different<br />
values measured in different points of water surface sampling<br />
points in the same collector (Fizes valley) stream could be<br />
explained as consequence of normal variation due to different<br />
water contact duration among the watershed, during precipitation<br />
events.<br />
Conclusions<br />
This research revealed the state of the water quality<br />
and also clarified some aspects related to the process of self<br />
purifications of the water system in the considered area. The<br />
upstream ponds retain most of the sediment and pollutants<br />
through mechanisms of sedimentation and self-purification,<br />
most of the pollution sources being also located in the upper<br />
part of the catchement.<br />
Data gathered will serve as beneficial experience for<br />
future rehabilitation measures. Using the proposed IC configuration,<br />
the laboratory productivity increases much, as there<br />
is no longer necessary to prepare two sample sets – one for
Chem. Listy, 102, s265–s1311 (2008) Environmental Chemistry & Technology<br />
Table III<br />
The cations’ concentrations in the studied water sources (mean values ± SD)<br />
Location na + [ppm] nH 4 – [ppm] K + [ppm] Mg 2+ [ppm] Ca 2+ [ppm]<br />
Draw well near<br />
Tăul Popii lake<br />
121.60 ± 6.03 15.28 ± 0.73 20.96 ± 1.03 108.05 ± 5.33 76.17 ± 3.80<br />
Spring near<br />
Tăul Popii lake<br />
25.93 ± 1.26 1<strong>2.</strong>02 ± 0.51 6.64 ± 0.30 69.27 ± 3.42 65.43 ± 3.25<br />
Cătina lake 168.31 ± 8.41 1<strong>2.</strong>31 ± 0.44 15.54 ± 0.72 156.96 ± 7.79 76.27 ± 3.73<br />
Geaca lake 158.05 ± 7.84 14.62 ± 0.70 17.52 ± 0.86 151.21 ± 7.53 71.25 ± 3.48<br />
Ţaga lake 103.47 ± 5.15 13.03 ± 0.63 19.15 ± 0.94 104.22 ± 5.19 54.07 ± <strong>2.</strong>65<br />
ştiucii lake 28.79 ± 1.40 1<strong>2.</strong>65 ± 0.59 18.43 ± 0.90 18.80 ± 0.93 9.10 ± 0.41<br />
Fizeş river 275.94 ± 13.78 11.11 ± 0.36 15.52 ± 0.74 14<strong>2.</strong>90 ± 7.17 74.97 ± 3.74<br />
anion analysis, the other for cation analysis. With one injection,<br />
the autosampler introduces the sample in both analysis<br />
channels.The method has potential to be used in water quality<br />
surveys in the purpose of correlating diffuse pollution inputs<br />
with changes in water quality. Specific self purification processes<br />
can also be operatively estimated.<br />
REFEREnCES<br />
1. Cickarik D., Dersek-Timotic I., Onjia A., Rajakovic I.: J.<br />
Serb. Chem. Soc. 70, 995, (2005).<br />
<strong>2.</strong> Gjerde D. T., Fritz J. S., Schmuckler G.: J. Chromatogr.<br />
187, 35 (1980).<br />
3. Gjerde D. T., Fritz J. S.: Ion Chromatography. Hüthig,<br />
Heidelberg, 2000.<br />
4. Helaleh M. I. H., Al-Omair A., Tanaka K., Mori M.:<br />
Acta Chromatogr. 15, 247, (2005).<br />
s444<br />
5. Shpigun O. A., Zolotov Y: A. Ion Chromatography in<br />
Water Analysis. West Sussex, England, Ellis Horwood<br />
Ltd., 1988.<br />
6. Small H., Stevens T. S., Bauman W. C.: Anal. Chem. 47,<br />
1801 (1975).<br />
7. Smith F. C., Chang R. C.: The practice of ion-chromatography.<br />
Wiley, 1984.<br />
8. Weiss J.: Ion Chromatography, VCH, Weinheim, 1995.<br />
9. ISO 5667-1: 1980: Water quality – sampling, part 1: guidance<br />
on the design of sampling programmes.<br />
10. ISO 5667-2: 1991: Water quality – sampling – part 2:<br />
guidance on sampling techniques.<br />
11. Directive 2000/60/EC of the European Parliament and<br />
of the Council of 23.11.2000 establishing a framework<br />
for Community action in the field of water policy.
Chem. Listy, 102, s265–s1311 (2008) Environmental Chemistry & Technology<br />
P56 STRATEGIES TO REDuCE DETECTION<br />
LIMITS IN ThE ANALySIS OF bROMINATED<br />
FLAME RETARDANTS IN <strong>ENVIRONMENTAL</strong><br />
SAMPLES<br />
MICHAELA náPRAVníKOVá, JAnA PULKRABOVá,<br />
PETRA HRáDKOVá, JAKUB SCHůREK, JAn<br />
POUSTKA and JAnA HAJŠLOVá<br />
Institute of Chemical Technology, Prague, Department of<br />
Food Chemistry and Analysis, Technická 3, 166 28 Prague 6,<br />
Czech Republic,<br />
michaela.napravnikova@vscht.cz<br />
Introduction<br />
Polybrominated diphenyl ethers (PBDEs) represent<br />
an important class of brominated flame retardants (BFRs)<br />
which are widely used in various consumer products such as<br />
electronic equipment, textiles and plastics 1 . These chemicals<br />
are highly persistent and bioaccumulative what leads to their<br />
ubiquitous occurrence in the environment 2 , both in abiotic<br />
and biotic matrices.<br />
Compared to major group of organohalogenated persistent<br />
organic pollutants (POPs) such as polychlorinated biphenyls<br />
(PCBs), the levels of PBDEs in respective environmental<br />
compartments are typically lower by one order of magnitude.<br />
On this account, low detection limits (LODs) are needed for<br />
their reliable control.<br />
Gas chromatography coupled to mass spectrometry<br />
(GC/MS) operated in either electron ionization mode (EI)<br />
or in negative chemical ionization (nCI) are commonly<br />
employed analytical procedures of determination these compounds<br />
3 . In nCI mode monitoring of abundant bromine ions<br />
(m/z 79 and 81) provides a more sensitive and selective option<br />
compared to EI. nowadays, comprehensive two-dimensional<br />
(orthogonal) gas chromatography coupled to time-of-flight<br />
mass spectrometry (GC × GC/TOFMS) has become another<br />
challenging alternative to analyze very complex PBDEs mixtures<br />
4 .<br />
In any case, achieving low LODs is also associated with<br />
the amount of sample introduced into GC system. The most<br />
commonly used GC injection technique for PBDEs is a splitless<br />
injection mode 3 , however, several studies were reported<br />
a possibility to employ a large-volume programmed-temperature<br />
vaporizer injection (PTV) in the determination of these<br />
compounds 5 .<br />
This paper presents the method performance characteristics<br />
obtained in several GC systems used for quantification<br />
of PBDEs.<br />
Experimental<br />
For our experiments a standard mixture of most common<br />
PBDE congeners (BDEs no. 28, 47, 49, 66, 85, 99, 100, 153,<br />
154 and 183) purchased from AccuStandard inc. (USA) was<br />
used. The real-life sample containing trace amount of PBDEs<br />
was a purified extract obtained from fish tissue by procedure<br />
s445<br />
described by Hajšlová et al. 6 . To assess LODs achievable<br />
under various GC conditions following set-up were tested:<br />
• PTV-GC/MS (EI),<br />
• PTV-GC/MS (nCI),<br />
• GC/TOFMS (EI),<br />
• PTV-GC/TOFMS (EI).<br />
P T V - G C / M S ( E I ) a n d P T V - G C / M S<br />
( n C I )<br />
GC/MS analyses were performed on an Agilent 6890n<br />
gas chromatograph coupled to a mass selective detector<br />
(Agilent 5975XL Inert MSD) equipped with quadrupole<br />
analyzer operated in nCI or EI mode using splitless or PTV<br />
injection. The GC conditions were as follows: a DB-XLB<br />
capillary column (15 m × 250 μm i.d. × 0.1 μm, J&W Scientific);<br />
a oven temperature program: from 105 °C (held for<br />
vent time) to 260 °C (held for 1 min) at 50 °C min −1 then to<br />
300 °C at 20 °C min –1 and held for 3 min; carrier gas: helium<br />
with constant flow 1.5 ml min −1 . The MS was operating in the<br />
selected ion monitoring (SIM) mode (monitored ions were<br />
m/z 79, 81, 159, 161 and m/z 406, 484, 564, 484, 562 for<br />
nCI and EI mode, respectively). The MS (nCI) parameters<br />
were as follows: reagent gas: methane; temperatures of MSD<br />
interface, ion source, and quadrupole: 280 °C, 150 °C, and<br />
150 °C, respectively. The temperatures of MSD interface,<br />
ion source and, quadrupole for MS (EI) system were 280 °C,<br />
230 °C and, 150 °C, respectively.<br />
Four parameters for PTV injection were tested: vent<br />
time (VT), vent flow (VF), injection volume (IV) and splitless<br />
period. Starting injection temperature was 50 °C (held<br />
4.6 min) and it was ramped to 350 °C at 500 °C min –1 .<br />
G C / T O F M S a n d P T V - G C / T O F M S<br />
The analyses were performed on a Pegasus 4D instrument<br />
(Leco, USA) consisting of an Agilent 6890n gas chromatograph<br />
equipped with splitless and/or PTV injector and<br />
a Leco Pegasus III high-speed time-of-flight mass spectrometer.<br />
The same, DB-XLB capillary column was used for<br />
determination of analytes. The GC conditions were similar<br />
to PTV–GC/MS system. The interface temperature was<br />
280 °C. The MS acquisition rate was 11 Hz, the mass range<br />
35–850 amu, the ion-source temperature 300 °C, and the detector<br />
potential –1875 V.<br />
Results<br />
In the first part of this study, the implementation and optimalization<br />
of a PTV injection coupled with GC/MS (EI and/<br />
or nCI mode) was realized. A solvent standard solution of<br />
above mentioned PBDE congeners was used for optimalization<br />
PTV injection conditions. Optimal parameters assessed<br />
by the comparison of a peak height of individual analytes<br />
were as follows:<br />
•<br />
•<br />
vent time: 90 s<br />
vent flow: 60 ml min –1
Chem. Listy, 102, s265–s1311 (2008) Environmental Chemistry & Technology<br />
Table I<br />
LODs of individual PBDE congeners [ng ml –1 isooctane] for the GC/MS techniques tested<br />
•<br />
•<br />
GC/MS (EI) GC/MS (nCI)<br />
Analyte PTV–GC/MS (EI) PTV–GC/MS GC/TOFMS (EI) PTV–GC/TOFMS<br />
(splitless) (splitless) (nCI)<br />
BDE 28 1.0 0.05 0.1 0.01 <strong>2.</strong>3 0.3<br />
BDE 47 1.0 0.1 0.1 0.01 3.1 0.6<br />
BDE 49 1.0 0.1 0.1 0.01 <strong>2.</strong>5 0.4<br />
BDE 66 1.0 0.1 0.1 0.01 3.7 0.6<br />
BDE 85 <strong>2.</strong>0 0.2 0.3 0.01 1.3 0.7<br />
BDE 99 1.5 0.1 0.3 0.01 3.0 0.4<br />
BDE 100 1.5 0.1 0.1 0.01 0.6 0.6<br />
BDE 153 5.0 0.1 0.6 0.02 3.2 0.9<br />
BDE 154 3.5 0.1 0.3 0.02 <strong>2.</strong>5 0.7<br />
BDE 183 3.0 0.2 0.2 0.06 7.1 1.5<br />
injection volume: multiple injection 2 × 10 μl<br />
splitless period: 2 min.<br />
The repeatability of the PTV–GC/MS injection,<br />
expressed as a relative standard deviation (RSD, n = 10)<br />
ranged from 3.8 to 6.3 % and 3.8 to 10.3 % for nCI and EI<br />
mode, respectively. Similar RSD values for multiple injections<br />
were obtained (3.8–9.2 % and 1.7–10.8 % for nCI and<br />
EI mode, resp.) were determined for spiked fish lipid extract<br />
(1 ng g –1 lipid weight).<br />
LODs calculated as a quantity of analyte that generates<br />
a response 3-time higher than the noise level of the detection<br />
system (based on the injection of solvent standard solution<br />
mixture) are summarized in Table I. LOQs were the minimum<br />
concentrations of analytes that was possible to quantify<br />
with acceptable accuracy and precision. Under these conditions,<br />
the LOQ was the lowest calibration level and corresponded<br />
for particular analyte to 3 × LOD. Generally, in nCI<br />
mode, significantly lower LODs were obtained compared to<br />
EI mode. On the other hand, the identification of individual<br />
PBDEs was only based on their retention times. PBDEs are<br />
eluted in order of increasing bromine number and intensity<br />
Fig. 1. Chromatogram of mixed standard of PbDEs obtained<br />
by GC/MS (NCI)<br />
s446<br />
of appropriate responses was obtained in following order in<br />
case of GC/MS (nCI) system: BDE 28 > BDE 49 ~ BDE<br />
47 ~ BDE 66 ~ BDE 100 > BDE 99 ~ BDE 85 ~ BDE<br />
154 ~ BDE 153 > BDE 183 (see Fig. 1.). Similar chromatogram<br />
obtained by PTV-GC/TOFMS (EI) is documented<br />
in Fig. <strong>2.</strong><br />
Fig. <strong>2.</strong> Chromatogram of mixed standard of PbDEs obtained<br />
by PTV–GC/TOFMS (EI)<br />
Table I shows a significant reduction of LODs by almost<br />
one order of magnitude (to values 0.01–0.06 ng ml –1 by the<br />
use of PTV which allowed introduction of 1–250 µl of sample<br />
(only 1–5 µl were injected by pulsed splitless).<br />
PTV–GC/TOFMS provide LODs similar to PTV–GC/<br />
MS (EI) and values were ranged from 0.3 to 1.5 ng ml –1 . The<br />
main advantage of this technique is availability of full mass<br />
spectral information for all sample components, i.e. confirmation<br />
of target analytes.<br />
Conclusions<br />
In the present work, LODs of individual PBDE congeners<br />
were reduced using various GC systems in analysis<br />
of these analytes in various matrices such as environmental<br />
samples (fish muscle, sediment etc.). Four different injection
Chem. Listy, 102, s265–s1311 (2008) Environmental Chemistry & Technology<br />
techniques, three of them employing PTV, were tested in our<br />
study.<br />
•<br />
•<br />
•<br />
Generaly, the nCI mode provided signifficantyl lower<br />
LODs compared with EI mode coupled to all tested GC/<br />
MS system.<br />
The lowest LODs were obtained by GC/MS coupled to<br />
the PTV injection operated in nCI mode, under these<br />
conditions large quantity of analytes without solvent<br />
(due to PTV injection) and high selectivity for bromine<br />
ions (due to MS-nCI mode) could be performed.<br />
PTV-GC/TOFMS employing splitless injection provided<br />
similar results in comparison with GC/MS (nCI)<br />
using splitless injection.<br />
This study was undertaken within the projects MSM<br />
6046137305 and NPV II (2B06151) both supported by the<br />
Ministry of Education, Youth and Sports of the Czech Republic.<br />
s447<br />
REFEREnCES<br />
1. Čajka T., Hajšlová J., Kazda R., Poustka J.: J.Sep.Sci.<br />
28, 601 (2005).<br />
<strong>2.</strong> Mariani G., Canuti E., Castro-Jiménez J., Christoph E.<br />
H., Eisenreich S. J., Hanke G., Skejo H., Umlauf G.:<br />
Chemosphere (2008), in press.<br />
3. Covaci A., Voorspoels S., de Boer J.: Environ. Int. 29,<br />
735 (2003).<br />
4. Dallüge J., Beens J., Brinkman U. A. Th.: J. Chromatogr.<br />
A. 1000, 69 (2003).<br />
5. Tollbäck P., Björklund J., Östman C.: J. Chromatogr. A<br />
991, 241 (2003).<br />
6. Hajšlová J., Pulkrabová J., Poustka J., Čajka T., Randák<br />
T.: Chemosphere 69, 1195 (2007).
Chem. Listy, 102, s265–s1311 (2008) Environmental Chemistry & Technology<br />
P58 SIMuLTANEOuS DETERMINATION OF<br />
MERCuRy, LEAD AND CADMIuM IN<br />
AQuEOuS SAMPLES uSING PECTIC ACID-<br />
MODIFIED CARbON PASTE ELECTRODE<br />
JOSE H. SAnTOS and SEAn GERARD WARD<br />
Department of Chemistry, University of Brunei Darussalam,<br />
Tungku Link, Gadong BE1410, Brunei Darussalam,<br />
joey@fos.ubd.edu.bn<br />
Introduction<br />
Anodic stripping voltammetry (ASV) and its variants are<br />
the most sensitive electroanalytical techniques employed for<br />
trace heavy metal analysis. Mercury electrodes have been widely<br />
used for ASV due to their ease of use and compatibility<br />
with a number of heavy metal species. Recently, however,<br />
there are major concerns regarding the use of mercury in the<br />
laboratory because of hazards it poses to humans and other<br />
living organisms. Prompted by environmental issues, some<br />
of the applications of modified carbon paste electrodes (CPE)<br />
are aimed at the development of mercury-free electrodes for<br />
ASV 1 . In this paper, we investigated the use of pectic acid as<br />
a modifier for CPE and its utilization for the analysis of some<br />
representative heavy metal species.<br />
Pectic acid, also known as polygalacturonic acid, is a<br />
natural polymer found in citrus rinds. It consists of chains of<br />
300 to 1000 units of galacturonic acid monomer joined with<br />
α 1 → 4 linkages. When incorporated in a CPE, the exposed<br />
carboxylic acid groups are responsible for the accumulation<br />
of heavy metal ions on the electrode surface presumably through<br />
ion-exchange or complex-formation processes.<br />
The aim of this study is to fabricate pectic acid-modified<br />
CPE and examine various experimental conditions that affect<br />
the analytical signal when used as a working electrode for the<br />
ASV of mercury, lead and cadmium in aqueous samples.<br />
Experimental<br />
Pectic acid isolated from orange peel was obtained from<br />
Fluka and used without further purification. Mineral oil,<br />
graphite powder were purchased from Sigma-Aldrich while<br />
1,000-ppm standard solutions of Hg (II), Pb (II) and Cd (II)<br />
were from Sharlau (Spain). All other chemicals used were at<br />
least AR grade.<br />
All electrochemical experiments were carried out using<br />
a BAS 100B Electrochemical System (BioAnalytical System)<br />
in the Osteryoung square wave stripping voltammetry mode<br />
(OSWSV) or cyclic voltammetry (CV) utilizing Ag/AgCl<br />
reference electrode and a Pt wire counter electrode.<br />
Modified carbon paste was prepared by thoroughly<br />
mixing 4 : 1 (w/w) ratio of graphite powder to powdered<br />
pectic acid and enough mineral oil to form a paste typical<br />
for conventional CPEs. A portion of prepared paste was then<br />
tightly packed on the cavity (2-mm dia.) of previously cut<br />
200-ml pipette tip where a copper rod was inserted on the<br />
other end to establish electrical contact.<br />
s448<br />
The modified CPE was first immersed in a sample solution<br />
containing the heavy metal ion being analyzed. After a<br />
predetermined period of time, referred to as accumulation<br />
time, the electrode was removed from the sample and rinsed<br />
thoroughly with water. The electrode was then transferred<br />
into a voltammetric cell containing deoxygenated 0.1M<br />
HCl for ASV. The accumulated metals were first reduced by<br />
applying a sufficiently negative potential of –800 mV for<br />
60 s, then re-oxidized while anodically scanning the potential.<br />
The peak-type I-E plots resulting from the anodic scan<br />
were recorded and evaluated.<br />
Results and Discussion<br />
P r e l i m i n a r y S t u d i e s<br />
Cyclic voltammetric experiments revealed that pectic<br />
acid-modified CPE possesses a useful potential window<br />
ranging from –900 mV to 1200 mV relative to the Ag/AgCl<br />
reference electrode when the supporting electrolyte used was<br />
deoxygenated 0.1M HCl. Preliminary investigations also<br />
showed that Cd, Pb and Hg undergoes redox transformations<br />
at about –690, –470 and +100 mV, respectively, using the<br />
above CPE and electrolyte combination. In principle, these<br />
metal species may be simultaneously detected and conveniently<br />
analyzed with well resolved analytical peaks using the<br />
modified CPE.<br />
I n d i v i d u a l A n a l y s i s<br />
Results of ASV experiments using laboratory prepared<br />
solutions containing a single metal species are consistent<br />
with the literature 2,3 . For all the three heavy metal species,<br />
as the concentration increases or the accumulation time is<br />
prolonged, the peak current also increases in a linear fashion<br />
until such an instance where current signal plateaus and further<br />
increase in concentration or accumulation time does<br />
not anymore amplify the peak height. This is due to the fact<br />
that the higher the concentration or the longer the electrode<br />
is immersed into the solution containing the analyte; more<br />
metal ions are able to accumulate on the surface, which consequently<br />
provides a higher current. Saturation point is attained<br />
when the active sites for metal accumulation are maximized<br />
resulting to levelling of current response. Using an<br />
accumulation time of 2 min and other parameters described in<br />
the experimental section, the sensitivities and detection limits<br />
are reported in Table I. Sensitivities were calculated from the<br />
slopes of individual calibration curves within the linear dynamic<br />
range while detection limits (LOD) were estimated based<br />
on three times the standard deviation of the blank. Further<br />
Table I<br />
Analytical data for pectic acid-modified CPE<br />
Metal<br />
Sensitivity LOD LOL<br />
[μA ppm –1 ] [ppm] [ppm]<br />
cadmium 20 0.25 20<br />
lead 50 0.15 50<br />
mercury 10 0.40 50
Chem. Listy, 102, s265–s1311 (2008) Environmental Chemistry & Technology<br />
improvements in LOD and limits of linearity (LOL) were<br />
observed upon increasing or decreasing the accumulation<br />
time, respectively.<br />
Fig. 1. ASV for solutions containing 1 ppm Pb, 3 ppm hg and<br />
varying Cd: (a) 1, (b) 3, (c) 5, (d) 10 ppm<br />
Fig. <strong>2.</strong> ASV for solutions containing 1 ppm Cd, 3 ppm hg and<br />
varying Pb: (a) 1, (b) 3, (c) 5, (d) 10 ppm<br />
s449<br />
Fig. 3. ASV for solutions containing 1 ppm Cd, 1 ppm Pb and<br />
varying hg: (a) 3, (b) 5, (c) 10, (d) 20 ppm<br />
S i m u l t a n e o u s A n a l y s i s<br />
When two or three metals studied in this project are present<br />
in the same solution, well resolved peaks with characteristic<br />
potentials corresponding to specific metal species are<br />
observed as shown in Figs. 1., <strong>2.</strong> and 3.<br />
Although linearity between peak height and concentration<br />
is maintained, careful inspection of individual peaks<br />
revealed that sensitivity decreases when the three metal ions<br />
co-exist. Moreover, as the concentration of one metal increases,<br />
the current signal for the other two decreases. This is<br />
presumably due to competition for binding sites among the<br />
metal ions and their varying affinities to carboxylate groups<br />
in pectic acid.<br />
Acknowledgement (This work has been supported by the<br />
Ministry of Development of Brunei Darussalam).<br />
REFEREnCES<br />
1. Wang J.: Electroanalysis 3, 255 (1991).<br />
<strong>2.</strong> YantaseeW., Lin Y., Fryxell G. E., Busche B. J.: Anal.<br />
Chim. Acta 502, 207 (2004).<br />
3. Ghiaci M., Rezaei B., Kalbasi R. J.: Talanta 73, 37<br />
(2007).
Chem. Listy, 102, s265–s1311 (2008) Environmental Chemistry & Technology<br />
P59 DETECTION OF FOREIGN ORGANIC<br />
SubSTANCES IN wATER AND bIOLOGICAL<br />
SAMPLES<br />
e. SAVELIEVA, n. KORYAGInA, n. KHLEBnIKOVA,<br />
n. GOnCHAROV and A. RADILOV<br />
Research Institute of Hygiene, Occupational Pathology and<br />
Human Ecology, Saint-Petersburg, Russia,<br />
esavelieva59@mail.ru<br />
Introduction<br />
The chemical analysis of biomedical samples (bodily<br />
fluids, tissues) aimed at revealing exposure to toxic chemicals<br />
(TCs) can be directed to the following targets:<br />
(i) TCs themselves, when their metabolism is slow<br />
enough,<br />
(ii) Low-molecular metabolites of TCs,<br />
(iii) High-molecular adducts of TCs with proteins.<br />
Right choice of target (marker) with account for the life<br />
cycle of a TC (adsorption–distribution – metabolism – excretion)<br />
predetermines success of analysis. The targets (i) and<br />
(ii) are more convenient to determine by conventional GC-<br />
MS methods but are unsuitable for retrospective analysis in<br />
view of their short life time in the organism. We developed<br />
procedures for the determination in biomedical samples of all<br />
the three groups of biomarkers of TCs.<br />
Results and Discussion<br />
Direct analysis of a TC in biomedical samples was considered<br />
to be a rational approach in toxicokinetic research<br />
on fluoroacetic acid, one of the most potent metabolic poinsons<br />
(FAA). Salts of FAA are still used in some countries for<br />
rodent population control; deadly poisoning of humans and<br />
farm animals was also described. At our laboratory, procedures<br />
for the determination of O-alkyl esters of methylphosphonic<br />
acid (low-molecular metabolites of organophosphorus<br />
warfare agents, OPWAs) and thiodiglycol (metabolite of<br />
sulfur mustard) were also developed. These metabolites are<br />
products of both biogenic and abiogenic hydrolysis of the<br />
parent agents, and, therefore, their determination in environmental<br />
samples is actual for retrospective analysis aimed at<br />
establishing the fact and degree of environmental pollution<br />
with the corresponding agents. Of particular importance for<br />
forensic analysis are universal procedures suitable both for<br />
water and for biological fluids. We developed universal procedures<br />
for the determination of FAA, methylphosphonic acid<br />
(MPA), ethyl MPA (marker of VX), isopropyl MPA (marker<br />
of sarin), isobutyl MPA (marker of Russian VX), pinacolyl<br />
MPA (soman marker), and thiodiglycol in water, urine, and<br />
blood plasma.<br />
For retrospective establishment of exposure to TCs,<br />
procedures for the determination of reactivation products<br />
of blood plasma butyryl cholinesterase (BChE) inhibited by<br />
OPWAs and of thiodiglycol isolated by alkaline hydrolysis<br />
from albumin adducts. These procedures all are based on GC/<br />
MS combined with solid-phase microextraction (SPME).<br />
s450<br />
Solid-phase microextraction is a unique method that<br />
allows one to combine on a single stage extraction from a<br />
matrix, concentration, and injection of a sample. SPME offers<br />
a great advantage of analyzing the whole sample rather<br />
than its aliquot, and, therefore, is more than about an order<br />
of magnitude more sensitive compared with traditional separation<br />
and concentration methods. SPME poses no threat of<br />
contamination of a GCMS system by matrix components. Of<br />
key importance for successful SPME analysis is right choice<br />
of microfiber, conditions for sorption (temperature, time,<br />
sample mixing mode, ionic strength of analyzed solution)<br />
and desorption (temperature, delay time).<br />
Therefore, in developing an SPME procedure, one<br />
should optimize the following parameters:<br />
•<br />
•<br />
•<br />
•<br />
Type of microfiber<br />
Sorption and thermodesorption temperatures of target<br />
analytes<br />
Sorption and thermodesorption times<br />
Ionic strength of the solution.<br />
Before GC/MS analysis nonvolatile target compounds<br />
were derivatized either in situ with subsequent concentration<br />
of the volatile derivative on microfiber (analysis for FAA)<br />
or directly on microfiber with vapors of derivatizing agents<br />
(analysis for MPA and its O-alkyl esters).<br />
In what follows we schematically represent certain of<br />
the mentioned procedures. Fig. 1. shows the block scheme of<br />
the determination of sodium fluoroacetate in various media.<br />
In view of the fact that the volatile derivative, ethyl fluoroacetate,<br />
is sampled from equilibrium vapor, the sample matrix<br />
scarcely affects the results of analysis. The developed procedure<br />
is universal and can be applied both for control of drinking<br />
water and for toxicokinetic and forensic investigations.<br />
Fig. 1. Block scheme of the unified procedure for the determination<br />
of sodium fluoroacetate in water and biomedical samples<br />
by SPME-GCMS<br />
The detection limits are 0.001 mg ml –1 for drinking<br />
and natural waters, 0.01 mg ml –1 for blood plasma, and<br />
0.01 mg ml –1 for organ homogenates (without recounting for<br />
dry weigh). The procedure is described in detail in ref. 1 .<br />
For the determination of the low-molecular metabolites<br />
of organophosphorus warfare agents, MPA and its alkyl
Chem. Listy, 102, s265–s1311 (2008) Environmental Chemistry & Technology<br />
esters, in urine we suggested a procedure involving extraction<br />
of the analytes on microfiber, their silylation with N-tertbutyldimethylsilyl-N-methyltrifluoroacetamide<br />
(MTBSTFA)<br />
directly on microfiber, thermodesorption of the resulting derivatives<br />
in a hot GC injector, GC separation, and MS detection<br />
in the SIM mode. Three types of microfibers of various polarities<br />
were tested: 50/30 µm DVB/Сarboxen/PDMS, 85 µm<br />
Сarboxen/PDMS, and 70 µm Carbowax/DVB (Fig. 1.). The<br />
best results were obtained on the first microfiber.<br />
Unlike certain related techniques, SPME provides a<br />
unique possibility for experimenting with various types of<br />
microfibers differing from each other in chemical nature and<br />
micropore size. Development of an SPME procedure always<br />
begins with searching for an optimal microfiber. This process<br />
is illustrated in Fig. <strong>2.</strong><br />
Fig. <strong>2.</strong> Efficiency of various microfibers for the determination<br />
of MPA and O-AMPAs as tert-butyldimethylsilyl derivatives<br />
In vivo animal (rats) experiments gave evidence for the<br />
possibility of revealing exposure to OPWAs at the ≥0.5 LD 50<br />
level within no less than 48 h after exposure. Urinary metabolites<br />
of OPWAs could, in principle, be detected within two<br />
weeks after exposure, but even if sufficiently high doses of<br />
OPWAs were applied. The procedure is schematically represented<br />
in Fig. 3 and described in detail in ref. 2 .<br />
For retrospective establishment of exposure to OPWAs<br />
we developed an SPME-GCMS procedure based on reactivation<br />
of inhibited BChE (Fig. 4.). Reactivation of blood BChE<br />
inhibited by OPWAs by the action of fluoride ion gives rise<br />
to the parent compounds in the case of G-type agents or fluoroanhydrides<br />
in te case of V-type agents. SPME is especially<br />
efficient in this case, since the reactivation products are trapped<br />
by microfiber and thus eliminated from the reaction zone,<br />
which drives the reactivation process. Soman is best retained<br />
by microfiber. In should be noted that the developed procedure<br />
is feasible for the determination of total soman and for<br />
the separate determination of reactivated and intact soman.<br />
s451<br />
Fig. 3. block scheme of the procedure for the determination of<br />
O-AMPAs in urine by SPME-GCMS<br />
Conclusions<br />
Procedures for the determination in biomedical samples<br />
of biomarkers of TCs have been developed. For fluoroacetic<br />
acid, the detection limits are 0.001 mg ml –1 for drinking<br />
and natural waters, 0.01 mg ml –1 for blood plasma, and<br />
0.01 mg g –1 for organ homogenates (without recounting for dry<br />
Fig. 4. block scheme of the determination of blood plasma<br />
bChE reactivation products by SPME-GCMS<br />
weigh). For organophosphorus warfare agents, the detection<br />
limits in the analyzed sample volumes are 0.01 mg dm –3 for<br />
sarin and 0.002 mg dm –3 for soman. The analysis time (including<br />
sample preparation) is <strong>2.</strong>5 h. Exposure to OPWAs by the<br />
results of analysis for inhibited BChE reactivation products<br />
can be revealed within 2 and more weeks after intoxication<br />
with high doses.<br />
REFEREnCES<br />
1. Koryagina n. L., Savelieva E. I., Khlebnikova n. S.,<br />
Goncharov n. V., Jenkins R. O., Radilov A. S.: J. Anal.<br />
Bioanal. Chem. 386, 1395 (2006).<br />
<strong>2.</strong> Savelieva E. I., Koryagina n. L., Khlebnikova n. S.,<br />
Feld V. E., Radilov A. S.: Sixth International Chemical<br />
and Biological Medical Treatment Symposium. p. 64,<br />
Spiez, Switzerland 2006.<br />
3. Savelieva E. I., Koryagina n. L., Radilov A. S., Khlebnikova<br />
n. S., Feld V. E.: Fourth World Congress on<br />
Chemical, Biological and Radiological Terrorism. p. 18,<br />
Dubrovnik 2007.
Chem. Listy, 102, s265–s1311 (2008) Environmental Chemistry & Technology<br />
P60 DETERMINATION OF SuLFONAMIDES IN<br />
wATER uSING MuLTI-wALLED CARbON<br />
NANOTubES SPE AND hPLC wITh<br />
FLuORESCENCE DETECTOR<br />
STEFAnIA SIMOn a , DAn LUPU a , ALEXAnDRU BIRIS a<br />
and COnSTAnTIn BELE b<br />
a National Institute for Research and Development of Isotopic<br />
and MolecularTechnologies, R-400293, Cluj-Napoca, Romania,<br />
b University of Agricultural Sciences and Veterinary<br />
Medicine,R-400372,Cluj-Napoca, Romania,<br />
stefania@itim-cj.ro<br />
Introduction<br />
Multi-walled carbon nanotubes (MWCnTs) are a novel<br />
carbon material, repeatedely discussed in the literature for<br />
the solid phase extraction (SPE) of several organic contaminants.<br />
1–3<br />
In this paper a sensitive method was developed for the<br />
determination of six commonly sulfonamides (SAs) in water<br />
by SPE using MWCnTs as adsorbent. Final analysis was carried<br />
out by HPLC coupled with fluorescence detection.<br />
Experimental<br />
R e a g e n t a n d W a t e r S a m p l e s<br />
Sulfadimethoxine (SDM), sulfadiazine (SDZ), sulfamethoxazole<br />
(SMX), sulfamerazine (SMR), sulfanilamide<br />
(SnA), sulfaguanidine (SGn) and fluorescamine were obtained<br />
from Sigma-Aldrich. MWCnTs were purchased from<br />
Institute for Research and Development of Isotopic and<br />
Molecular Technologies Cluj-napoca, Romania. Deionized<br />
and redistilled water was prepared on Milli-Q Plus (Millipore).<br />
Acetonitrile, ortophosphoric acid (H 3 PO 4 ) and dipotassiumphosphate<br />
(K 2 HPO 4 ) were purchased from Merck. A<br />
river water sample was collected from Somes (Cluj-napoca)<br />
and filtered through 0.45 μm nylon membrane and stored at a<br />
temperature of 4 °C.<br />
C h r o m a t o g r a p h i c S y s t e m a n d<br />
C o n d i t i o n s<br />
All experiments were carried out by using Shimadzu VP<br />
Series liquid chromatograph equipped with a degasser and<br />
a mixer of mobile phase. A fluorescence (FL) detector FR-<br />
10 AXL with excitation wavelength of 405 nm and emission<br />
wavelength of 495 nm was used to analyse the tested solutions.<br />
Chromatographic separation was performed on a Alltima<br />
RP C-18 column (250 mm × 4.6 mm, 5 μm). Gradient<br />
elution with a mixture of acetonitrile (solvent A) – phosphate<br />
buffer pH 3.5 (solvent B) at a flow rate of 1 ml min –1 was<br />
applied. The initial gradient conditions were: 65 % solvent B<br />
for the first 25 min, decreasing to 50 % in 25 min, finally it<br />
was brought back to 65 % in 5 min and held for 5 min until<br />
the next injection.<br />
s452<br />
E x t r a c t i o n P r o c e d u r e<br />
The cartridge packed with 200 mg MWCnTs was prepared<br />
in a 6ml polypropylene syringe and the sorbent was<br />
retained by two polyethylene frits. The solutions (water<br />
sample or water sample spiked with analytes) adjusted to<br />
pH 6 were loaded at a flow rate of 4 ml min –1 .Then, SAs<br />
were eluted using a mixture of 3 ml ammonium acetate<br />
water solution (0.2M) and 6 ml acetonitrile.The eluate was<br />
evaporated to about 3 ml under nitrogen stream in a 35 °C<br />
block heater. Then 3 ml of methylene chloride was added and<br />
each samples was mixed and separated. The lower layer was<br />
evaporated to near dryness. The extract was reconstituted in<br />
1.0 ml mobile phase. The analytes were quantified by HPLC<br />
with a pre-column derivatization with fluorescamine (400 μl<br />
of sample + 400 μl of fluorescamine 0.1 %).The whole solution<br />
was mixed with a vortex mixer. The sample was filtered<br />
through a 0.45 μm nylon filter and after standing for 30 min<br />
at ambient temperature was ready for analysis.<br />
Results<br />
The effect of the pH was investigated over the range of<br />
pH 4–8 and it was found that the pH of sample solutions in<br />
the whole range nearly had no influence on the extraction of<br />
SAs.<br />
To investigate the influence of sample volume, different<br />
volumes of pure water were spiked with a constant mass of<br />
0.25 μg of each analyte. It was found that the recoveries of<br />
SAs<br />
decreased slightly with the increase of sample volume. When<br />
the volume was 200 ml, the recoveries of 55–93 % were<br />
obtained for the six SAs.<br />
For elution of SAs we selected a mixture of ammonium<br />
acetate and acetonitrile 1 : 2 (v/v) and better recoveries were<br />
obtained when eluent volume amounted to 9 ml.<br />
The results of the linearity of SAs determined under the<br />
optimized conditions and using 200 ml of spiked pure water<br />
are reported in Table I. The linearity of each compound measured<br />
by HPLC method was good from 0.05 to 5 ng ml –1 .<br />
The correlation coefficient of the calibration curves were<br />
above 0.999.<br />
Table I<br />
Retention time (t R ) and linearity of SAs<br />
Sulfonamide t R [min] b a a b<br />
SMX 11.23 21.694 0.564<br />
SnA 17.69 20.944 0.574<br />
SDZ 20.43 9.402 0.245<br />
SMR 2<strong>2.</strong>94 16.644 –0.192<br />
SGn 4<strong>2.</strong>32 8.021 0.071<br />
SDM 46.68 5.560 0.104<br />
b a : Slope<br />
a b : Intercept<br />
The recoveries of analytes were evaluated using 200 ml<br />
of environmental water samples (Somes river) spiked with
Chem. Listy, 102, s265–s1311 (2008) Environmental Chemistry & Technology<br />
the mixture of SAs at 0.25 and <strong>2.</strong>5 ng ml –1 and enriched and<br />
analyzed by this system. The results are listed in Table II.<br />
Table II<br />
Recoveries of SAs spiked water samples (n = 3)<br />
Sulfonamides Spiked [ng ml –1 ] Recovery [%]<br />
SMX<br />
SnA<br />
SDZ<br />
SMR<br />
SGn<br />
SDM<br />
0.25 57 ± 5.2<br />
<strong>2.</strong>5 55 ± 6.4<br />
0.25 74 ± 7.3<br />
<strong>2.</strong>5 73 ± 6.8<br />
0.25 82 ± 4.3<br />
<strong>2.</strong>5 77 ± 3.7<br />
0.25 58 ± 5.4<br />
<strong>2.</strong>5 56 ± 7.6<br />
0.25 93 ± 4.1<br />
<strong>2.</strong>5 88 ± 6.9<br />
0.25 87 ± <strong>2.</strong>5<br />
<strong>2.</strong>5 79 ± 5.3<br />
The chromatogram of the river water sample spiked with<br />
SAs is shown in Fig. 1.<br />
Conclusions<br />
The HPLC method with fluorescence detection characterized<br />
by a good reliability for quantitative determination of<br />
six different kinds of SAs from environmental samples has<br />
been developed. The results showed that MWCnTs could be<br />
used as a potent SPE sorbent for SAs.<br />
This work has been supported by the Natio-nal Authority<br />
for Scientific Research of Romania, CEEX project no.<br />
62/2006.<br />
s453<br />
Fig. 1. SPE-LC-FL chromatogram of river water sample<br />
spiked with <strong>2.</strong>5 ng ml –1 of each compound. (1) SMx; (2) SNA; (3)<br />
SDZ; (4) SMR; (5) SGN; (6)SDM<br />
REFEREnCES<br />
1. niu H., Cai Y., Shi Y., Wei F., Liu J., Mou S., Jiang G.:<br />
Anal. Chim. Acta 594 , 81(2007).<br />
<strong>2.</strong> Fang G.Z., He J.X., Wang S.: J. Chromatogr. A 1127, 12<br />
(2007).<br />
3. Zhao H., Wang L., Qiu Y., Zhou Z., Zhong W., Li X.:<br />
Anal. Chim. Acta 586, 399 (2007).
Chem. Listy, 102, s265–s1311 (2008) Environmental Chemistry & Technology<br />
P61 MICRObIOLOGIAL REMEDIATION OF<br />
METAL-CONTAMINATED SOIL<br />
VALéRIA SnOPKOVá<br />
Department of Biotechnology, Institute of Geotechnics the<br />
Slovak Academy of Sciences,<br />
Watsonova 45, 043 53 Košice, Slovak Republic.<br />
snopkova@saske.sk<br />
Introduction<br />
Soil contamination with anthropogenic heavy metals,<br />
which mainly comes from industrial activity, atmospheric<br />
deposition and land application of sewage sludge, has received<br />
much attention in the recent years. The anthropogenic<br />
heavy metals are to be easily accumulated in the topsoil1,<br />
resulting in potential problems such as toxicity to plants and<br />
animals 1,2 , accumulation in food chain, perturbation of the<br />
ecosystem and adverse health effects 4,5 . Metals, which are<br />
significantly toxic to human beings and ecological environment,<br />
include chromium (Cr), cooper (Cu), lead (Pb), mercury<br />
(Hg), zinc (Zn), manganese (Mn), cadmium (Cd), nickel<br />
(ni), arsenic (As) and iron (Fe), etc. 6 .<br />
Contaminated soil is notoriously difficult to treat because<br />
the contaminants are often tightly bound to the soil particles.<br />
Conventional remediation technologies are becoming less<br />
popular due to the high treatment costs and bioremediation<br />
processes to improve the contaminant removal efficiency<br />
and cost effectiveness. However, as an innovative technology,<br />
there are many factors to be investigated with the future<br />
development 7 .<br />
bioremediation<br />
Bioremediation is defined as a method using living organisms,<br />
or their particles (enzymes) to reduce, eliminate, fixate<br />
or transform contaminants presented in the soil, in sediments,<br />
in waters or in the air 8,9 . In the bioremediation processes<br />
bacteria, fungi, yeasts and plants present the most imposed<br />
organisms. Recently, the ability of algaes and planktons are<br />
being researched. Some technologies are based on the use<br />
of general or genetically modificated organisms 8 . Bioremediation<br />
works by either transforming or degrading contaminants<br />
to non-hazardous or less hazardous chemicals. These<br />
processes are called, respectively, biotransformation and<br />
biodegradation. Biotransformation is any alteration of the<br />
molecular or atomic structure of a compound by microorganisms.<br />
Biodegradation is the breaking down of organic substance<br />
by microorganisms into smaller organic or inorganic<br />
components 9 .<br />
Metal – Microbe Interactions<br />
Microorganisms, especially bacteria, exist in complex<br />
biogeochemical matrices in subsurface sediments and soils 9<br />
and are known to mediate many geochemical processes 10,11 .<br />
They can interact with metals via many mechanisms, some of<br />
which may be used as the basis of the potential bioremediation<br />
strategies 9 . Microbes can mobilize metals through autot-<br />
s454<br />
rophic and heterotrophic leaching, chelation by microbial<br />
metabolites and siderophores, and methylation, which can<br />
result in volatilization. Conversely, immobilization can result<br />
from sorption to cell components or exopolymers, transport<br />
into cells and intracellular sequestration or precipitation as<br />
insoluble organic and inorganic compounds, e.g. oxalates 12,13<br />
sulphides or phosphates 14,15 .<br />
M e t a l M o b i l i z a t i o n<br />
bioleaching. Metals can be leached from solid matrices<br />
via autotrophic and heterotrophic leaching. Chemolitotrophic<br />
and heterotrophic bacteria have the major role.<br />
Most autotrophic leaching is carried out by chemolithotrophic,<br />
acidophilic bacteria which fix carbon dioxide and<br />
obtain energy from the oxidation of ferrous iron or reduced<br />
sulfur compounds, which causes the solubilization of metals<br />
because of the resulting production of Fe(III) and H 2 SO 4 16,17 .<br />
The microorganisms involved include sulfur-oxidizing bacteria,<br />
e.g., Acidihiobacillus thiooxidans, iron- and sulfur-oxidizing<br />
bacteria, e.g., Acidithiobacillus ferrooxidans and ironoxidizing<br />
bacteria, e.g., Leptospirillum ferrooxidans 18,19 .<br />
In the case of oxide, carbonate and silicate ores, limits<br />
are set for the use of thiobacilli. For such ores, research is<br />
being done on the use of heterotrophic bacteria. In this case,<br />
metals are dissolved by organic acids, or complexing, or chelating<br />
agents produced by the bacteria. Heterotrophic bacteria<br />
require organic supplement for growth and energy supply.<br />
Among the bacteria, members of the genus Bacillus are most<br />
effective in metal solubilization 19 .<br />
Siderophores are low molecular weight Fe(III) coordination<br />
compounds that are excreted under iron-limiting conditions<br />
by microorganisms, particularly bacteria and fungi,<br />
to enable accumulation of iron from the environment 20,21 .<br />
Although primarily produced as a means of obtaining iron,<br />
siderophores are also able to bind other metals such as magnesium,<br />
manganese, chromium (III), gallium (III) and radionuclides<br />
such as plutonium (IV) 22,23 .<br />
biomethylation of Hg, As, Se, Sn, Te and Pb can be<br />
mediated by a range of bacteria under aerobic and anaerobic<br />
conditions. Methyl groups are enzymatically transferred to<br />
the metal, and the given species may transform a number of<br />
different metal(-loid)s. Methylated metal compounds formed<br />
by these processes differ in their solubility, volatility and<br />
toxicity 23 .<br />
M e t a l I m o b i l i s a t i o n<br />
bioacumulation and biosorption. Bacteria can physically<br />
remove heavy metals from solution through association<br />
of these contaminants with biomass. Bioaccumulation is the<br />
retention and concentration of substance within an organism.<br />
In bioaccumulation, metals are transported from the outside<br />
of the microbial cell trough the cellular membrane, into the<br />
cell cytoplasm, where the metals are sequestred 9,24 . Biosorption<br />
describes the association of soluble substances with the<br />
cell surface. Sorption does not require an active metabolism.<br />
The amount of metal biosorbed to the exterior of bacterial
Chem. Listy, 102, s265–s1311 (2008) Environmental Chemistry & Technology<br />
cells often exceeds the amount predicted using information<br />
about the charge density of the cell surface 9,25 .<br />
bioprecipitation. Sulfate reduction is an example for<br />
the precipitation of metals ions in solution. Sulfate-reducing<br />
bacteria form metal sulfides that are insoluble. The stability<br />
of these sulfides depends on maintenance of anoxic conditions<br />
7,24 , and nutrients are also inevitable. Stimulating sulfate<br />
reducion can increase pH also and form metal hydroxides and<br />
oxides that precipitate and do not migrate in soil and groundwater<br />
7 .<br />
biooxidation, bioreduction. Microorganisms are also<br />
known to oxidize and reduce metal contaminants. Mercury<br />
and cadmium can be oxidized while arsenic and iron can<br />
be reduced by microorganisms. Cr(VI) can be oxidized to<br />
Cr(III) that is less mobile and toxic. Bacteria such as Bacilus<br />
subtilis and SRB in the presence of sulfur can perform this<br />
reaction 7 .<br />
bioremediation Technologies<br />
According to the site, bioremediation technologies are<br />
divided to:<br />
in-situ – are carried out at the place of the contamination,<br />
ex-situ – the contaminated matter is taken off from the<br />
natural locality and it is consequently processed26 •<br />
•<br />
.<br />
Ex situ bioremediation is usually realized on the specific<br />
revised place or in the reactor. The pre-treating of contaminated<br />
matter increases the efficiency of this process 26 . Ex-situ<br />
methods have been around longer and are better understood,<br />
and they are easier to contain, monitor, and control. However,<br />
in-situ bioremediation has several advantages over ex-situ<br />
techniques. In-situ treatment is useful for contaminants that<br />
are widely dispersed in the environment, present in dilute<br />
concentrations, or otherwise inaccessible (e.g., due to the presence<br />
of buildings or structures). This approach can be less<br />
costly and less disruptive than ex-situ treatments because no<br />
pumping or excavation is required. Moreover, exposure of<br />
site workers to hazardous contaminants during in-situ treatment<br />
is minimal 27 .<br />
Broadly, bioremediation strategies can be further divided<br />
into natural attenuation, biostimulation, and bioaugmentation<br />
strategies 27 .<br />
bioaugmentation presents an addition of microorganisms<br />
or their products, such as biosurfactants or enzymes28.<br />
Thus, inoculation of ‘specialized’ biomass may allow for<br />
an increased biodegradation of target pollutants as well as a<br />
more effective detoxification of the solid matrix 29 . Another<br />
common result of bioaugmentation is the dramatic reduction<br />
of remediation times 30,31 . Indigenous or exogenous, standard<br />
or modified microorganisms are used 32,33 . Generally, they<br />
present mixed cultures of microorganisms, but it could be<br />
also pure bacterial strains adapted onto the aimed contaminant<br />
in the laboratory 34,35 .<br />
biostimulation can be aggressive or passive, in that<br />
electron donors, electron acceptors, and trace nutrients can<br />
s455<br />
be injected into the environment to stimulate indigenous<br />
organisms to increase biomass or activity to affect the contaminant.<br />
Passive biostimulation techniques include simple<br />
infiltration galleries or simply spreading fertilizer on surface<br />
without any pumping or mixing 25,27 .<br />
Natural attenuation relies on the intrinsic bioremediation<br />
capabilities of that environment. Environments high<br />
in organic carbon and energy sources, low contaminant concentrations,<br />
and without significant nutrient deficiencies may<br />
be able to degrade or transform the contaminants of concern<br />
without any intervention 27 .<br />
Conclusions<br />
Environmental biotechnologies with applications of<br />
bacteria are eco-friendly and cost effective. They present<br />
natural technologies for treatment of toxic metals from soil.<br />
The following development is desirable, because of the high<br />
specificity and the time-consuming of biological processes<br />
and because of the difficulty to control them.<br />
Acknowledgement (This work has been supported by<br />
Slovak Academy of Science No. VEGA 2/0049/08<br />
REFEREnCES<br />
1. Samsoe-Petersen L., Larsen E.H., Larsen P.B., Bruun P.:<br />
Environ. Sci. Technol. 36, 3057 (2002).<br />
<strong>2.</strong> Ma Y., Dickinson n.M., Wong M.H.: Biol. Fertil. Soils<br />
36, 79 (2002).<br />
3. Berti W.R., Jacobs L.W.: J. Environ. Qual. 25, 1025<br />
(1996).<br />
4. Forstner U., 1995. In: Metal Speciation and contamination<br />
of Soil. (Allen H.G., Huang C.P., Bailey G.W.,<br />
Bowers A.R. ed.), CRC Press, Boca Raton, FL, (1995).<br />
5. Stalikas C.D., Mantalovas Ach., Pilidis G.A.: Sci. Total<br />
environ. 206, 17 (1997).<br />
6. Meena A.K., Mishra G.K., Rai P.K., Rajagopal Ch.,<br />
nagar P.n.: J. Hazard. Mater. 112, 161 (2005).<br />
7. Mulligan C.n., Yong, R.n, Gibbs B.F.: Eng. Geol. 60,<br />
193 (2001).<br />
8. Dercová K., Makovníková J., Barančíková B., Žuffa J.:<br />
Chemické listy 99, 682 (2005).<br />
9. Tabak H.H., Lens P., van Hullebusch E.D., Dejonghe<br />
W.: Environ. Sci. Technol. 4, 115 (2005).<br />
10. Ehrlich H.L.: Appl. Microbiol. Biotechnol. 48, 687<br />
(1997).<br />
11. Ledin M.: Earth Scien. Rev. 51, 1 (2000).<br />
1<strong>2.</strong> Gharieb M.M., Sayer J.A., Gadd G.M.: Mycol. Res.<br />
102, 825 (1998).<br />
13. Sayer J.A., Gadd G.M.: Mycol. Res. 101, 653 (1997).<br />
14. White C., Gadd G.M.: Microbiol. 142, 2197 (1996).<br />
15. Yong P. Macaskie L.E.: J. Chem. Technol. Biotechnol.<br />
63, 101 (1995).<br />
16. Rawlings D.E.: in: Biomining: Theory, Microbes and<br />
Industrial Processes (Rawlings D.E., ed.) Springer-Verlag,<br />
Berlin, 1997.
Chem. Listy, 102, s265–s1311 (2008) Environmental Chemistry & Technology<br />
17. Schippers A., Sand W.: Appl. Environ. Microbiol. 65,<br />
319 (1999).<br />
18. Ewart D.K., Hughe, M.n.: Adv. Inorg. Chem. 36, 103<br />
(1991).<br />
19. Bosecker K.: FEMS Microbiol. Rev. 20, 591 (1997).<br />
20. John S.G.: Environ. Sci. Technol. 35, 2942 (2001).<br />
21. White Ch., Wilkinson S. C., Gadd G.M.: Internat. Biodet.<br />
Biodeg. 35, 17 (1995).<br />
2<strong>2.</strong> Birh L., Bachofen R.: Experienta 46, 827 (1990).<br />
23. Gadd G.M.: Geoderma 122, 109 (2004).<br />
24. Gaszó L.G.: Cejoem 7, 178 (2001).<br />
25. Palmisan A., Hazen T., Bioremediation of metals and<br />
radionuclides. Prepared for the nABIR, LBnL – 42595<br />
(2003).<br />
26. Kubal M., Burkhard J., Březina M.: in Dekontaminační<br />
technológie. VŠCHT, Praha 200<strong>2.</strong><br />
27. Hazen T.C., Tabak H.H.: Environ. Sci. Technol. 4, 157<br />
(2005).<br />
s456<br />
28. Gentry T.J, Josephson K.L., Pepper I.L.: Biodegrad. 15,<br />
67 (2004).<br />
29. Silva E., Fialho A.M., Sá-Correia I., Burns R.G., Shaw<br />
L.J.: Environ. Sci. Technol. 38, 632 (2004).<br />
30. Zhang C., Hughes J.B., nishino S.f., Spain J.C.: Environ.<br />
Sci. Technol. 34, 2810 (2000).<br />
31. Robles-Gonzales I.V., Fava F., Poggi-Voraldo H.M.:<br />
Microb. Cell. Fact. 7, 1 (2008).<br />
3<strong>2.</strong> Boon n., Goris J., de Vos. P., Verstraet W., Top E.M.:<br />
Appl. Environ. Microbiol 66, 2906 (2000).<br />
33. Vidali M., Pure Appl. Chem. 73, 1163 (2001).<br />
34. Ramasamy K., Parwin Banu K., Parwin Banu S.: in:<br />
Enviromental bioremediation technologies. (Singh S.n.,<br />
Tripathi R.D., ed.), p.7. Springer, new York 2004.<br />
35. Dercová K.: Odpady 4, 16 (2004).
Chem. Listy, 102, s265–s1311 (2008) Environmental Chemistry & Technology<br />
P62 DISTRIbuTION OF PhThALIC ACID ESTERS<br />
(DEhP, DbP) IN ChICKEN TISSuES AND<br />
ORGANS<br />
VLASTA STAnCOVá a , ALŽBETA JAROŠOVá a , LEnKA<br />
KRáTKá a , JIří HARAZIM b and PAVeL SUCHý c<br />
a Mendel University of Agriculture and Forestry Brno<br />
Faculty of Agronomy, Zemědělská 1, 613 00, Brno, Czech<br />
Republic,<br />
b Central Institute for Supervising and Testing in Agriculture,<br />
Hroznová 2, 656 06, Brno, Czech Republic,<br />
c University of Veterinary and Pharmaceutical Sciences Brno,<br />
Palackého 1/3, 612 42, Brno, Czech Republic,<br />
xwegsch0@node.mendelu.cz<br />
Introduction<br />
Phthalates, ubiquitous food and environmental contaminants,<br />
are the most frequently used plasticizers for PVC. Due<br />
to the widespread use of plasticized PVC for a vast number<br />
of technical purposes and for some food contact materials,<br />
the phthalates are produced in huge amounts. Several million<br />
tons of phthalates are used per year worldwide in the production<br />
of soft polyvinyl chloride and other plastics. Phthalates<br />
are not chemically bound in to the products and are released<br />
continuously into the air or leach from the products 1 . The<br />
migration of phthalates from packaging materials containing<br />
these compounds to fatty foodstuffs is a well-known source<br />
of food contamination 2 . Major and most toxic phthalic acid<br />
esters (PAEs) associated with food are di-2-ethylhexyl phthalate<br />
(DEHP) and di-n-butyl phthalate (DBP). PAEs entering<br />
the human body are rapidly hydrolyzed to the monoesters and<br />
than metabolized and excreted with urine and feces 1 .<br />
PAEs are considered highly hazardous to human health<br />
because they disrupt the hormonal balance and impair reproduction<br />
and development. Some of them are considered as<br />
potential carcinogens, teratogens and mutagens. Additionally,<br />
phthalates are suspected to trigger asthma and dermal diseases<br />
in children. The main objective of the present work is to<br />
investigate the real content of DEHP and DBP in samples of<br />
chicken’s muscle, skin, fat and liver 3 .<br />
Experimental<br />
M e t h o d s<br />
Phthalates content measurement in lyophilisated chicken<br />
tissues is made in four separate steps, where every sample<br />
is analyzed in parallel which brings additional measurement<br />
correctness check. Blank is important for glass cleaness<br />
check and to specify chromatography background. First<br />
step consists of fat extraction from tissues using mixture of<br />
organic solvents (acetone : hexane; 1 : 1). In second step, after<br />
dissolving co-extracts in mobile phase (dichlormethane:<br />
cyclohexane; 1 : 1), they are separated by Bio-Beads S-X3<br />
gel-permeation chromatography. Third step comprise of cleaning<br />
of eluate with usage concentrated sulfuric acid. High<br />
performance liquid chromatography on Separon SGX C 18<br />
with UV detection at 224 nm was last, fourth step. The mobile<br />
s457<br />
phase was acetonitrile – water (1 : 1) pumped at a flow-rate<br />
of 1.0 ml min –1 . Retention time of DBP was ca. 3.5 min. and<br />
DEHP ca 8 min.<br />
M a t e r i a l s<br />
32 chickens ROSS 308 were used in our work. Chickens<br />
were separated into four groups of eight Chickens depending<br />
on ingredients in feeding mixture. Chickens in second group<br />
were fed common feeding mixture fortificated by 3% coleseed<br />
oil with low phthalate content into BR2 and 5% into<br />
BR3. In this case, vegetative oil was stored in the tin container.<br />
Common feeding mixture with 3% coleseed oil with<br />
high phthalate content added into BR2 and 5% into BR3 was<br />
fed by third group. Coleseed oil for third group was stored in<br />
plastic wrapping. The fourth group was comprised by chickens<br />
fed by routine feeding mixture with addition 3% animal<br />
fat into BR2 and 5% into BR3. 42 days old chickens were<br />
butchered and their muscles, skin, fat and liver were used for<br />
making samples for analysing. Samples were lyophilisated<br />
and before next analysing were hold in freezer in –18 °C.<br />
Table I illustrates contents of both phthalates in feeding mixture<br />
used in our work.<br />
Table I<br />
Contents of both phthalates in ingredients added to feeding<br />
mixture<br />
DBP DEHP ΣDBP + DEHP<br />
[mg kg –1 ] [mg kg –1 ] [mg kg –1 ]<br />
Coleseed oil<br />
(tin)<br />
15.56 <strong>2.</strong>25 17.81<br />
Coleseed oil<br />
(plastic)<br />
51.35 < 0.20 51.35<br />
Animal fat 43.28 <strong>2.</strong>10 45.38<br />
Results<br />
Figs. 1.–4. represents chickens separated into four groups<br />
groups depending on kind of ingredients in feeding mixture.<br />
Each figure expresses average value of contents DEHP and<br />
DBP in edible part of chicken’s body. Fig. 1. demonstrates<br />
real average contents of phthalates in muscle (0.35 mg kg –1<br />
DEHP; 0.22 mg kg –1 DBP), skin (1.18 mg kg –1 DEHP;<br />
0.36 mg kg –1 DBP), fat (1.36 mg kg –1 DEHP; 0.47 mg kg –1<br />
DBP) and liver (0.16 mg kg –1 DEHP; 0.02 mg kg –1 DBP) in<br />
group of chickens fed by common feeding mixture without<br />
phthalate addition. Findings in muscle (0.08 mg kg –1 DEHP;<br />
0.08 mg kg –1 DBP), skin (1.10 mg kg –1 DEHP; 0.51 mg kg –1<br />
DBP), fat (1.92 mg kg –1 DEHP; 0.49 mg kg –1 DBP) and liver<br />
(0.24 mg kg –1 DEHP; 0.11 mg kg –1 DBP) of second group is<br />
depicted in Fig. <strong>2.</strong> Contamination of muscle (0.32 mg kg –1<br />
DEHP; 0.15 mg kg –1 DBP), skin (1.38 mg kg –1 DEHP;<br />
0.57 mg kg –1 DBP), fat (3.27 mg kg –1 DEHP; 1.28 mg kg –1<br />
DBP) and liver (0.16 mg kg –1 DEHP; 0.03 mg kg –1 DBP) of<br />
chickens of third group shows Fig. 3. In fourth group we determined<br />
following contents of phthalates: muscles (0.39 mg kg –1<br />
DEHP; 0.22 mg kg –1 DBP), skin (1.60 mg kg –1 DEHP;
Chem. Listy, 102, s265–s1311 (2008) Environmental Chemistry & Technology<br />
0.44 mg kg –1 DBP), fat (1.85 mg kg –1 DEHP; 0.74 mg kg –1<br />
DBP) and liver (0.23 mg kg –1 DEHP; 0.13 mg kg –1 DBP).<br />
Fig. 1. First group of chickens fed by common feeding mixture<br />
Fig. <strong>2.</strong> Second group of chickens fed by common feeding mixture<br />
with addition of coleseed oil with low phthalates content<br />
Conclusions<br />
Our measurements proved lipophilic character of phthalates,<br />
which were accumulated in chicken’s fat tissue and<br />
skin. That means that fat tissue is useful indicator of phthalates<br />
contamination. Liver, despite containing more fat than<br />
muscles, had lower values of phthalates mainly because of<br />
their enzymatic base, which were transforming phthalates to<br />
metabolites. Relatively high contents of phthalates in control<br />
group points at ubiquitous content of these contaminants.<br />
The values of DEHP and DBP were identically higher in all<br />
samples.<br />
s458<br />
Fig. 3. Third group of chickens fed by common feeding mixture<br />
with addition with coleseed oil with high phthalates content<br />
Fig. 4. Fourth group of chickens fed by common feeding mixture<br />
with addition of animal fat<br />
Acknowledgement (This work has been supported by<br />
Czech National Agency for Agriculture Research (NAZV CR),<br />
project QG60066/2005).<br />
REFEREnCES<br />
1. Wormuth M., Scheringer M., Vollenweider M., Hungerbuhler,<br />
K.: Risk Anal. 26, 803 (2006).<br />
<strong>2.</strong> Schmidt R. H., Rodrick G. E.: Food Safety Handbook.<br />
Wiley, new Jersey 2003.<br />
3. Schettler T.: Int. J. Androl. 29, 134 (2006).
Chem. Listy, 102, s265–s1311 (2008) Environmental Chemistry & Technology<br />
P63 PuRIFICATION PROCESS INFLuENCE ON<br />
ThE PAh DETERMINATION IN REAL SOIL<br />
SAMPLES<br />
MICHAELA STOUPALOVá, MILADA VáVROVá,<br />
LUDMILA MRAVCOVá and VLADIMíR VEČEREK<br />
University of Veterinary and Pharmaceutical Sciences Brno,<br />
Faculty of Veterinary Hygiene and Ecology<br />
Palackého 1–3, 612 42 Brno, Czech Republic,<br />
stoupalovam@vfu.cz<br />
Introduction<br />
The analytical procedure usually consists of several partial<br />
steps: the isolation of analytes, extract purification, and<br />
the concentration of monitored analytes 1 . environmental<br />
analysis currently tends to use such analytical procedures to<br />
allow the reliable and fast determination of monitored substances<br />
at the lowest possible costs. In the field of sample preparation,<br />
attention is devoted particularly to the combination<br />
of methods which enable the selective extraction of analytes<br />
followed by their concentration. The accuracy and precision<br />
of measurement in particular are monitored in the instrumental<br />
end-point as they are closely linked to the selectivity and<br />
sensitivity of analytical instruments. A special emphasis is<br />
laid on the confirmation techniques which should prove the<br />
results obtained using a typical method and reduce the risk of<br />
false-positive and false-negative results 2,3 .<br />
Polycyclic aromatic hydrocarbons (PAHs) are formed<br />
in the incomplete combustion of organic matter, for example<br />
during combustion of fossil fuel or wood, in running engines<br />
of motor vehicles, during fire and during free incineration of<br />
biomass or municipal waste 4 . They are also produced naturally,<br />
for example in active volcanoes.<br />
Individual PAHs differ significantly by their properties<br />
which define their potential risks. They are characterized by<br />
great variability in terms of toxic, physicochemical and chemical<br />
properties that may affect the environment. They produce<br />
different effects on individual species and the link<br />
between toxicity of individual PAHs and their structure<br />
is currently being investigated 5 .<br />
Experimental<br />
The effect of the purification procedure on the content of<br />
analytes was investigated in samples of soil. The isolation of<br />
PAHs from soil was performed using microwave extraction.<br />
Samples were purified using column chromatography. HPLC<br />
was used as final analytical method.<br />
e x t r a c t i o n<br />
The isolation of PAHs from soil was performed using<br />
microwave extraction. The extraction step lasted 25 minutes,<br />
at a temperature of 120 °C and an input of 1,200 W, by using<br />
20 ml of a hexane/acetone (1 : 1) mixture. Microwave extraction<br />
provided two sets of samples; each set was subsequently<br />
subjected to a different purification method.<br />
s459<br />
P u r i f i c a t i o n<br />
We monitored influence of the purification process on<br />
the determination of monitored analytes. We carried out comparison<br />
of two purification process.<br />
Purification 1: Samples were cleaned-up using column<br />
chromatography on a silica column (5 g). The sample was<br />
applied on the top of the column; 10 ml of hexane were<br />
applied on the top of the column prior to the complete adsorption<br />
of the sample on the column, followed by elution with<br />
5 ml of an eluting mixture consisting of hexane : dichloromethane<br />
(1 : 1) and finally with 10 ml of the same mixture. The<br />
last fraction was collected.<br />
Purification 2: The samples in the second set were purified<br />
using column chromatography on a column with silica<br />
gel (4 g) and florisil (4 g). The sample was applied directly<br />
on the prepared column. The column was washed with 60 ml<br />
of a hexane : dichloromethane (1 : 1) mixture prior to the complete<br />
adsorption of the sample into the sorbent. The whole<br />
eluate was collected.<br />
H P L C<br />
The determination itself was performed using the HPLC<br />
Agilent 1100 Series with a DAD and FLD detectors. The<br />
HPLC determination was carried out under following conditions:<br />
gradient elution (A = 60 % water/40 % acetonitrile;<br />
B = 100 % acetonitrile); 0 min A, 30 min B, 40 min. B, 42<br />
min A For separation SUPELCOSIL LC-PAH column was<br />
used (25 cm × <strong>2.</strong>1 mm × 5 µm). The flow-rate of the mobile<br />
phase was constant, 0.4 ml min –1 , temperature 30 °C. FLD<br />
settings were: 0–17.4 min λ ex = 260 nm, λ em = 350 nm;<br />
17.4–42 min λ ex = 260 nm, λ em = 420 nm. DAD setting was:<br />
λ = 225 nm.<br />
Results<br />
The main aim of this work was to investigate the effect<br />
of the purification process on the content of monitored PAHs<br />
in the real samples of soil. For better clarity, the results are<br />
provided in graphs and expressed in percentage; for assessment,<br />
the values determined in the first set of samples (purification<br />
on silica) were chosen as 100 % for assessment purposes.<br />
The results are presented in Figs. 1.–3. for individual<br />
samples of soil.<br />
It follows from Fig. 1. that both purification techniques<br />
provided comparable results. Fig. <strong>2.</strong> shows the results for<br />
Fig. 1. Influence of a purification procedure – soil A
Chem. Listy, 102, s265–s1311 (2008) Environmental Chemistry & Technology<br />
Fig. <strong>2.</strong> Influence of a purification procedure – soil B<br />
Fig. 3. Influence of a purification procedure – soil E<br />
soil B, better results were obtained using the first purification<br />
method where the third fraction was the only fraction<br />
analysed. Samples of soil C exhibited a common trend for<br />
lower-molecular-weight PAHs where the method of extract<br />
s460<br />
purification had hardly any effect on the final content in the<br />
given matrix. On the contrary, the second purification method<br />
using two sorbents (silica gel and florisil) was proven optimal<br />
for the PAHs with higher molecular weight.<br />
Conclusions<br />
However, in this context it is important to point out that<br />
the yield of pre-analytical techniques is significantly influenced<br />
by the sample matrix by the way of matrix effects. The<br />
structure and chemical qualities of individual PAH also plays<br />
an important role.<br />
This work has been supported by by the grant given by<br />
Ministry of Education, Youth and Sports of the Czech Republic<br />
no. 621571240<strong>2.</strong><br />
REFEREnCES<br />
1. Poustka J.: Dissertation. VSCHT Prague, Prague, Czech<br />
Republic, 1995.<br />
<strong>2.</strong> Kocourek V., Hajšlová J., Holadová K.: Methods of<br />
xenobiotics determination in food. Laboratory Manual.<br />
Part III. VÚPP, STIPP Prague, 199<strong>2.</strong><br />
3. Kocourek V., Vávrová M., Uhnák J.: Methods of xenobiotics<br />
determination in food. Laboratory Manual. Part<br />
II. VÚPP, STIPP Prague, 1990.<br />
4. Jech L. Polycyclic aromatic hydrocarbons (PAHs).<br />
AXYS-VARILAB s.r.o., Prague, 2006.<br />
5. Jelínková G.: Diploma thesis. VUT Brno, Brno, Czech<br />
Republic, 2003.
Chem. Listy, 102, s265–s1311 (2008) Environmental Chemistry & Technology<br />
P64 OPTIMALIZATION OF SPME METhOD<br />
FOR SPICE CONTENTuAL SubSTANCES<br />
DETERMINATION<br />
MICHAELA STOUPALOVá, MILADA VáVROVá,<br />
HAnA PLESKAČOVá, LUDMILA MRAVCOVá and<br />
VLADIMíR VEČEREK<br />
University of Veterinary and Pharmaceutical Sciences Brno,<br />
Faculty of Veterinary Hygiene and Ecology<br />
Palackého 1–3, 612 42 Brno, Czech Republic<br />
stoupalovam@vfu.cz<br />
Introduction<br />
The SPME method can be used to extract analytes from<br />
different matrices. It has been employed in the isolation of<br />
analytes from the air, food, water, and other matrices 1 . The<br />
SPME method has a number of major advantages such as fast<br />
rate, high sensitivity and good accuracy; the detection limit<br />
regularly achieved for the above-mentioned matrices ranges<br />
in ng kg –1 . First published in 1989, the SPME method is now<br />
a well established extraction method whose application has<br />
been assessed and documented 2 .<br />
The analyses of organic, fragrant, and flavouring components<br />
as well as sample preparation are usually started<br />
with the concentration of an analyte. If one considers a time<br />
demand, the passive SPME sampling technique is the quickest,<br />
with sample preparation not exceeding 30 minutes 3 .<br />
The consistency of the results and the reliability of detection<br />
with SPME as well as repeatability and reproducibility<br />
are influenced by a number of factors, like polymer polarity<br />
and the thickness of a polymer layer (stationary phase) on<br />
the surface of a fibre, the sampling method, the pH, the ionic<br />
strength of a solution, sample temperature, agitation, etc.<br />
Experimental<br />
The objective of this paper was the optimization of solid<br />
phase microextraction (SPME) method, which is used for<br />
determination of the essential oils in spice. Analytes were<br />
analysed by GC/MS.<br />
S P M E<br />
The SPME method was investigated with different<br />
fibers (polydimethylsiloxane – 100 μm thickness and polydimethylksiloxayne-divinylbenzene<br />
– 65 μm), extraction time<br />
(1; 2; 5; 10; 15; 20; 30; 40 and 60 minutes), extraction temperature<br />
(30; 40 and 50 °C) and incubation of sample (0; 5;<br />
10; 15; 20 minutes).<br />
G C / M S<br />
The determination itself was performed using the<br />
GC 6890n (Agilent Technologies, USA) with a massspectrometric<br />
detector 5973n MSD (Agilent Technologies,<br />
USA); for separation HP-5MS capillary column was used<br />
(30 m × 0.25 mm × 0.25 μm). The injector temperature was<br />
270 °C, the ion source temperature was 230 °C and the<br />
Transfer Line temperature was 250 °C. The temperature<br />
s461<br />
programme was 45 °C for period of 2 minutes, 5 °C min –1<br />
to 200 °C, 200 °C for period of 2 minutes; the total analysis<br />
time was 35 minutes. The flow-rate of the carrier gas (He)<br />
was constant, 1 ml min –1 .<br />
Results<br />
The aim hereof was to optimise the SPME method for<br />
determination of the essential oils in spice. We monitored<br />
influence of the stationary phase on the sorption of monitored<br />
analytes. We carried out comparison of two PDMS fibres<br />
(100 μm) and PDMS-DVB (65 μm). The results obtained are<br />
stated in Fig. 1. From it follows that the PDMS-DVB fibre<br />
(65 μm) shows higher sorption effectivity for all the monitored<br />
pesticides.<br />
Fig. 1. Influence of the fibre type on response of detectors for<br />
the monitored analytes<br />
Also the influence of temperature on sorption of the target<br />
compounds was monitored. The following temperatures<br />
were tested: 30, 40 and 50 °C. Lower-molecular-weight terpenes<br />
were shown to have the best responses at a temperature<br />
of 30 °C while for the medium-molecular-weight terpenes<br />
(around 150 g mol –1 ), the effect of different temperature on<br />
the adsorption of analytes wasn’t so strong. Terpenes with the<br />
highest molecular weight (204 g mol –1 ) exhibited the highest<br />
response at a temperature of 50 °C. On the basis of the results<br />
and literature data, the sorption value at 30 °C was selected.<br />
Various sorption times were measured (1; 2; 5; 10; 15;<br />
20; 30; 40, and 60 minutes) at temperature of 30 °C. The time<br />
of 15 minutes seems to be suitable for both the sensitivity and<br />
a good repeatability.<br />
This study also investigated the effect of sample conditioning<br />
before analyte sorption. The conditions of analysis<br />
Fig. <strong>2.</strong> Influence of the incubation time on response of detectors<br />
for the monitored analytes
Chem. Listy, 102, s265–s1311 (2008) Environmental Chemistry & Technology<br />
Table I<br />
RSD in determination of analytes<br />
Analyte RSD Analyte RSD<br />
α-pinene 13 menthone 32<br />
camphene 11 borneol 18<br />
sabinene 14 estragol 28<br />
β-pinene 9 α-cubebene 12<br />
β-myrcene 7 thymol acetáte 38<br />
α-phellandrene 10 ylangene 31<br />
3-carene 7 copaene 27<br />
α-terpinene 7 α-bourbonene 34<br />
2-nitro-p-cymene 3 isocaryophyllene 35<br />
limonene 23 β-caryophyllen 26<br />
eucalyptol 8 humulene 31<br />
γ-terpinene 4 α-caryophyllen 36<br />
β-terpineol, cis- 15 isoledene 32<br />
linalool 13 α-muurolene 36<br />
thujone 22 epizonarene 36<br />
camphor 12 karyophyllene oxide 34<br />
were as follows: the duration of sorption was 15 minutes at<br />
a temperature of 30 °C. This temperature was also used for<br />
sample conditioning. Fig. <strong>2.</strong> shows the comparison between<br />
the different durations of sample conditioning (0; 5; 10; 15;<br />
20 minutes) and it is seen that the 5-minute conditioning is<br />
the most suitable as it gives the highest response for the majority<br />
of target analytes.<br />
The repeatability of the method was determined based<br />
on 5 repetitions and is expressed as a relative standard devi-<br />
s462<br />
ation (Table I). Terpenes are listed in the table according to<br />
their increasing molecular weight. It follows from the results<br />
that lower-molecular-weight terpenes have better repeatability<br />
than more volatile terpenes with higher molecular weight.<br />
Standard deviations vary in a rather wide range of 28–38 %<br />
for substances with higher molecular weight which may be<br />
attributed to the optimization of the SPME method where<br />
some parameters (particularly the duration and temperature<br />
of sorption) were chosen at such levels to match for the whole<br />
group of 32 monitored substances.<br />
Conclusions<br />
SPME conditions used for optimalization of head-space<br />
method were follows: 15 min exposition of PDMS-DVB<br />
(65 µm) fiber at 30 °C in head-space above 0.5 g of spice<br />
sample in vial. The incubation of sample was 5 minutes at<br />
extraction temperature 30 °C.<br />
This work has been supported by by the grants given by<br />
Ministry of Education, Youth and Sports of the Czech Republic<br />
no. 621571240<strong>2.</strong><br />
REFEREnCES<br />
1. Shao Y. et al.: Flavour and Fragrance Journal 18, 5<br />
(2003).<br />
<strong>2.</strong> López P., et al.: Analytica Chimica Acta 559, 97 (2006).<br />
3. Holadová K., Prokůpková G., Hajšlová J., et al.: Analytica<br />
Chimica Acta 582, 24 (2007).
Chem. Listy, 102, s265–s1311 (2008) Environmental Chemistry & Technology<br />
P65 DTA AND FLuORESCENCE SPECTRA OF<br />
huMIC ACIDS AS INDICATORS OF huMAN<br />
INFLuENCE ON SOIL<br />
nORA SZOMBATHOVá a , JÖRG LUSTER b , BOŽEnA<br />
DEBSKA c , AnTOn ZAUJEC a , MILAn MACáK a ,<br />
VLADIMíR ŠIMAnSKý a , ERIKA TOBIAŠOVá a and<br />
JURAJ CHLPíK a<br />
a Department of pedology and geology, Slovak University of<br />
Agriculture, Tr. A. Hlinku 2, 949 76 Nitra, Slovakia,<br />
b Swiss Federal Research Institute WSL, Zürcherstrasse 111,<br />
CH-8903 Birmensdorf, Switzerland,<br />
c Department of Environmental Chemistry, University of<br />
Technology and Agriculture, Bernardynska 6, 85-225 Bydgoszcz,<br />
Poland,<br />
nora.szombathova@uniag.sk<br />
Introduction<br />
Humic substances (HS) are the most abundant and stable<br />
organic C forms found in soil. Based on their solubility in<br />
alkaline and acid solutions they can be divided into humic<br />
acids (HA), fulvic acids (FA) and humin. Spectroscopic measurements<br />
provide valuable information on the nature of soil<br />
HS, they are nondestructive, require only small amounts of<br />
sample, and are experimentally simple as referred by Stevenson<br />
6 . Thermal analysis curves, heat fluxes, absorption and<br />
fluorescence properties can provide useful information on<br />
nature, origin, chemistry and structure of HS Blaser et al. 2 ;<br />
Gonet et al. 3 , Senesi et al. 5 .<br />
In this study we investigated differences in absorptive,<br />
fluorescence and thermal characteristics between humic acids<br />
isolated from humus horizons of soils with different land use<br />
(agroecosystem and forest ecosystem).<br />
Experimental<br />
Samples were collected from A-horizons of soil pits<br />
dug on cultivated and nearby oak-hornbeam forest soils from<br />
locality Báb (south-western Slovakia). The parent material<br />
was calcareous loess. Samples were compared in two pairs:<br />
• Profiles 1 and 2 – located at an upland position, 80 m<br />
apart: 1 – forest soil, Luvic Phaeozem, 2 – cultivated<br />
soil, Haplic Chernozem<br />
• Profiles 3 and 4 – located at a colluvial foot slope, 60 m<br />
apart: 3 – forest soil, 4 – cultivated soil, both on Orthic<br />
Luvisol<br />
Humic acids (HA) were isolated by Orlov 4 method.<br />
Total luminescence spectra (TLS) of HA were recorded on a<br />
Shimadzu RF5000 spectrometer, and absorption spectra on a<br />
Shimadzu UV 240. For measuring, the stock solutions were<br />
diluted to organic C concentration 10 mg dm –3 , and adjusted<br />
to pH 7. TLS excitation slit width was set to 5 nm, emission<br />
to 3 nm. TLS were recorded as a series of 10 synchronous<br />
scan spectra with differences between excitation and emission<br />
wavelength (λ ex /λ em ) of 25 nm.<br />
s463<br />
Thermal properties were recorded on Derivatograph C<br />
– MOM Hungary. Detailed information concerning differential<br />
thermal analysis (DTA) was presented by Gonet et al. 3 .<br />
Based on the results, value “Z”, proportional to “aliphaticity”<br />
of HA was calculated. It expresses the ratio of weight loss in<br />
low temperature (endo + exo1) to weight loss in high temperature<br />
range (exo2).<br />
Results and Discussion<br />
The absorbance ratios of UV-VIS spectra are listed in<br />
Table I. Stevenson 6 stated that UV-VIS spectra of HA are<br />
broad, featureless and monotonously decreasing with increasing<br />
wavelength, thus absorbance ratios were used in determining<br />
their chemical structure. A 280/465 ratio reflects the<br />
proportion between the lignin structures more resistant to<br />
humification and materials at the initial stage of transformation,<br />
A 280/665 – ratio between groups resistant to humification<br />
and strongly humified ones, A 465/665 decreases with increasing<br />
molecular weight and condensation. In our study, higher<br />
values of absorbance ratios indicated that HA from forest soil<br />
content more lignin type compounds and had lower degree of<br />
aromatic structures condensation than that from the cropped<br />
soil.<br />
Table I<br />
Ratios of humic acid absorbances, fluorescence peak positions<br />
and intensities<br />
λ ex /λ em λ ex /λ em<br />
Profile A 280/665 A 280/465 A 465/665 455/515 310/480<br />
peak intensities [a.u]<br />
forest,<br />
upland<br />
5.25 28.33 5.40 280 245<br />
cultivated,<br />
upland<br />
4.53 2<strong>2.</strong>46 4.96 > 350 < 350<br />
forest,<br />
slope<br />
5.06 28.00 5.53 315 280<br />
cultivated,<br />
slope<br />
4.67 21.54 4.62 > 350 315<br />
Table II<br />
Thermal properties of humic acids<br />
Area under DTA effects<br />
Profile [% of total] Z<br />
endo exo1 exo2<br />
forest, upland 4.1 57.6 38.3 1.61<br />
cultivated, upland <strong>2.</strong>6 35.6 61.8 0.62<br />
forest, slope 4.4 51.6 44.0 1.27<br />
cultivated, slope 5.7 31.3 63.0 0.59<br />
Three-dimensional total luminescence spectra (TLS)<br />
enable detailed view with more complete information than<br />
simple excitation, emission, or synchronous scan spectra<br />
Blaser et al. 2 . TLS of studied HA (Table I) performed two
Chem. Listy, 102, s265–s1311 (2008) Environmental Chemistry & Technology<br />
major peaks, a first at λ ex /λ em = 455/515 indicating highly<br />
conjugated aromatic compounds, like disubstituted<br />
coumarins, xanthones and quinones and a second peak at<br />
λ ex /λ em = 310/480 nm indicating simple phenolics like hydroxysubstituted<br />
benzoic and cinnamic acid derivatives<br />
Senesi et al. 5 . Peaks occured at the same positions, and differed<br />
only in fluorescence intensity, which was the highest at<br />
λ ex /λ em = 455/515 nm. This is evidence that HA from cultivated<br />
soils were more humified and polycondensed. Alberts<br />
et al. 1 reported, that the peak with similar λ ex /λ em = 455.7/<br />
510.6 nm was observed in HA form Hungarian soils.<br />
Thermal properties, mainly the degree of aliphaticity<br />
“Z” (Table II) was lower in HA isolated from cultivated soil<br />
(0.62 and 0.59) than HA from forest soil (1.61 and 1.27),<br />
what confirmed higher condensation of aromatic structures<br />
or humification degree of HA from cultivated soil.<br />
Conclusions<br />
Results of the present study confirmed that absorbance,<br />
fluorescence and thermal characteristics of HA can be a sensitive<br />
index of structural changes between cultivated and<br />
s464<br />
natural soils, thus, they can be used as an indicator of anthropogenic<br />
influence on soil.<br />
This work has been supported by grant VEGA 1/4432/07<br />
and VEGA 1/0092/08.<br />
REFEREnCES<br />
1. Alberts J. J., Takács M.: Org. Geochem. 35, 243 (2004).<br />
<strong>2.</strong> Blaser P., Heim A., Luster J.: Environ. Int. 25, 285<br />
(1999).<br />
3. Gonet S. S., Cieslewicz, J.: Environ. Int. 24, 629<br />
(1998).<br />
4. Orlov D. S., Grischina L. A.: Praktikum po chimii<br />
gumusa. MGU, Moskva, 1981.<br />
5. Senesi n., Miano T., Provenzano M. R., in: Humic Substances<br />
in the Aquatic and Terrestrial Environment.<br />
(Allard B., Borén H., Grimvall A., ed.), chapter V, p. 63.<br />
Springer, Berlin 1991.<br />
6. Stevenson F. J.: Humus chemistry. Genesis, composition,<br />
reactions. Wiley, new York 1994.
Chem. Listy, 102, s265–s1311 (2008) Environmental Chemistry & Technology<br />
P66 EVALuATION OF hEAVy METALS MObILITy<br />
IN SEDIMENTS FROM ThE hNILEC RIVER,<br />
SLOVAKIA<br />
OľGA ŠESTInOVá, Ján BREHUV, JOZEF<br />
HAnČUľáK, TOMISLAV ŠPALDOn and ERIKA<br />
FEDOROVá<br />
Institute of Geotechnics, Slovak Academy of Sciences, Watsonova<br />
45, 043 53 Košice, Slovak Republic,<br />
sestinova@saske.sk<br />
Introduction<br />
The contribution deals with the content and mobility of<br />
heavy metals: copper, nickel and lead in the samples of sediment<br />
load from drainage basin of the Hnilec River.<br />
The former mining activities with the following treatment<br />
of iron and copper ores have had negative effect on the<br />
region of Middle Spiš. The main anthropogenic sources of<br />
the contamination of environment come from the localities<br />
Krompachy, Rudňany and the surroundings of Spišská nová<br />
Ves, and also the river-basin of the Hnilec, the Ružín no. 1,<br />
the Palcmanská Maša reservoirs and an old environmental<br />
loads after mining activities in Smolník area. The flooded<br />
deposit in Smolník produces heavily mineralized acid waters<br />
that contaminate water and sediments of Smolník stream,<br />
Hnilec River and even Ružín reservoir. The deposit is not<br />
stable and negatively influences the surroundings 1 .<br />
Many sequential extraction methods were employed for<br />
the determination of particular forms of heavy metals contained<br />
in the sediments, differing in the number of the extraction<br />
steps, extraction solvents used extraction procedures.<br />
Leachate contains a group of elementary forms with similar<br />
physical and chemical properties. The extraction process evaluates<br />
the strength of bonding of the metal forms to different<br />
soil phases, to ion-renewable, carbonated, reducible, oxidable<br />
and finally to resistant residue 2 . The best known is the fivestep<br />
sequential extraction of soil published by Mc Laren and<br />
Crawford and Tessier 3 . This method can differentiate heavy<br />
metals held in the sediments in five steps. It can be applied to<br />
provide a quick indication of changed element mobility in the<br />
monitored locality 4 .<br />
Experimental<br />
C h a r a c t e r i s t i c o f t h e S e d i m e n t s<br />
The one-shot sequential extraction procedures were<br />
applied on eight sediment samples collected from the industrially<br />
polluted region of Central Spiš, Slovakia, localities of<br />
the Ružin no. 1 reservoir, the Palcmanská Maša reservoir and<br />
stream Smolník situated on the Hnilec River. The reference<br />
material of sediment from river Labe was also used for analysis.<br />
Sampling was realized in the year 2007 and total content<br />
of copper, nickel and lead were determined. Finally, the samples<br />
were dried, quartered, sieved under 1 mm and mineralised<br />
in a microwave pressure digestion system MWS-3.<br />
s465<br />
S e q u e n t i a l E x t r a c t i o n<br />
The sequential extraction was conducted under the following<br />
procedures: Fraction: A – released forms were determined<br />
in the extract of extraction solvent – 2M HnO 3 . The<br />
supernatant was filled up to 100 ml. The rest was used in the<br />
second step. This fraction contains metals bonded to sulphide<br />
and phosphate. Fraction: b – potentially mobile forms<br />
were determined in the extract of extraction solvent – 0.05M<br />
EDTA. This fraction contains metals in ion-changing form<br />
and bonded to carbonates. Fraction: C – mobile forms were<br />
determined in the extract of extraction solvent 0.1M CaCl <strong>2.</strong><br />
This fraction contains metals in ion-changing form. Fraction:<br />
D – residual forms presents extracted phase e. g. metals<br />
bonded to silicate structure and to a crystal lattice of primary<br />
minerals. The residuals were dried at room temperature.<br />
After drying and homogenization, the single extracts were<br />
measured by the absorption spectrometry method. Copper<br />
was determined by flame atomization and nickel and lead by<br />
graphite furnace atomic absorption spectrometry (VARIAn,<br />
Australia).<br />
Results<br />
Active soil reaction (pH) and oxidation-reduction potential<br />
is presented in Table I. It has shown that only sample SP<br />
(stream Smolník – mine Pech) was an acid sediment and the<br />
rest are slightly alkaline sediments. The increase of pH causes<br />
the growth of copper adsorption by colloid, clayey and<br />
organic material and thereby the mobility of copper in soil<br />
decreases 5 .<br />
Table I<br />
The description of sampling places and chemical composition<br />
of sediments taken in area of the Hnilec Rriver in 2007<br />
Locality pH<br />
Redox Organic Dry<br />
potential [mV] portion [%] basis [%]<br />
Ruzin VDR1 7.55 259 10.02 36.40<br />
Ruzin VDR2 7.25 254 10.18 54.52<br />
Ruzin VDR3 7.52 257 4.50 4<strong>2.</strong>40<br />
Pal. Masa PM1 7.52 257 18.85 29.54<br />
Pal. Masa PM2 7.60 259 13.78 34.86<br />
Pal. Masa PM3 7.73 262 15.89 31.25<br />
Pal. Masa PM4 8.06 265 18.20 39.9<br />
Smolník SP 3.3 355 26.01 53.7<br />
The results of copper, zinc, nickel and cadmium content<br />
determined in extraction solvents after extraction of sediments<br />
using sequential extraction are given in Table II.<br />
The results of sequential extraction are presented as the<br />
percentage yield of metal from sequential extraction, where<br />
100 % is total concentration of metal in sediment.<br />
The results in cumulation histogram (Fig. 1.) show that<br />
the highest concentrations of copper were determined in the<br />
fraction A in released forms and the highest percentage yield<br />
in sample VDR1, 2 with values 65.7 and 60.3 % respectively.<br />
The yields in the potentially mobile and mobile forms were
Chem. Listy, 102, s265–s1311 (2008) Environmental Chemistry & Technology<br />
Fig. 1. Cumulation histogram of the copper yields in fractions<br />
A–D of the sequential extracts of the sediments, RM – Reference<br />
Material-sediment, VDR1 – 3 Ružin No. 1 reservoir, PM1–4 Palcmanska<br />
Masa reservoir, SP – stream Smolník, mine Pech<br />
Fig. <strong>2.</strong> Cumulation histogram of the nickel yields in fractions<br />
A–D of the sequential extracts of the sediments, RM – Reference<br />
Material-sediment, VDR1 – 3 Ružin No. 1 reservoir, PM1–4 Palcmanska<br />
Masa reservoir, SP – stream Smolník, mine Pech<br />
s466<br />
Fig. 3. Cumulation histogram of the lead yields in fractions<br />
A–D of the sequential extracts of the sediments, RM – Reference<br />
Material-sediment, VDR1 – 3 Ružin No. 1 reservoir, PM1–4<br />
Palcmanska Masa reservoir, SP – stream Smolník, mine Pech<br />
low. In fraction D the highest values of yield were confirmed<br />
in samples PM2 64.1 % and SM 55.2 %.<br />
The Fig. <strong>2.</strong> presents the distribution of nickel in fractions.<br />
The highest concentration of nickel was determined in<br />
fraction D, where the highest yield was in sample PM4 80 %<br />
and the least in sample SP 16 %. In the other forms, the nickel<br />
content in yield was very low.<br />
According to Fig. 3., the highest concentrations of lead<br />
were found in fraction A, where the highest values of yield<br />
were in samples PM 3 64.2 % and PM 2 – 1 (54.4–51.6 %).<br />
In fraction B–C, the content of was in low percentage yield<br />
and the yield was higher in fraction D.<br />
The results of yield are given in Table III, where the total<br />
content of particular heavy metals Cu, ni, Pb in sediments<br />
were compared with the sum of metal concentrations in fraction<br />
A–D from sequential extraction. In sample PM2, 100 %<br />
yield of copper was determined.<br />
Table II<br />
Copper, nickel and lead content determined in extraction solvents after extraction of sediments using sequential extraction<br />
method, RM – Reference Material-sediment, VDR1 – 3 Ružin no. 1 reservoir, PM1–4 Palcmanska Masa reservoir, SP – stream<br />
Smolník, mine Pech<br />
Fraction Element Sediment contents [mg kg –1 ]<br />
RM VDR1 VDR2 VDR3 PM1 PM2 PM3 PM4 SP<br />
Cu 33.5 160.0 178.2 166.0 14.6 10.0 19.6 18.4 216.0<br />
A ni 3.3 9.6 4.6 5.7 7.0 5.1 7.4 4.5 0.3<br />
Pb 33.9 34.7 40.4 35.3 26.3 55.5 18.0 17.1 34.9<br />
Cu 6.0 13.4 2<strong>2.</strong>6 29.4 4.0 1.8 5.0 4.0 35.0<br />
B ni <strong>2.</strong>0 0.6 07 1.3 <strong>2.</strong>4 1.4 5.4 5.0 0.1<br />
Pb 4.1 <strong>2.</strong>9 4.2 6.4 3.7 6.7 <strong>2.</strong>7 <strong>2.</strong>1 4.4<br />
Cu <strong>2.</strong>0 5.2 6.8 <strong>2.</strong>8 0.8 0.5 1.0 1.2 6.2<br />
C ni 1.3 1.2 1.6 0.6 0.6 0.4 1.1 1.4 0.3<br />
Pb 1.7 1.6 <strong>2.</strong>3 0.8 0.8 1.1 0.8 0.6 1.2<br />
Cu 23.7 45.2 64.2 11.2 18.9 2<strong>2.</strong>0 0.3 20.8 306<br />
D ni 26.7 38.5 27.3 27.4 47.2 4<strong>2.</strong>6 51.3 47.4 7.1<br />
Pb 15.6 5.4 7.3 9.8 4.4 <strong>2.</strong>7 2 <strong>2.</strong>4 8.7
Chem. Listy, 102, s265–s1311 (2008) Environmental Chemistry & Technology<br />
Table III<br />
Analysis comparison of total dissociation and the sum of metal concentrations in the sequential extraction procedure of the<br />
sediment samples<br />
element<br />
Sediment [mg kg–1 RM VDR1 VDR2<br />
]<br />
VDR3 PM1 PM2 PM3 PM4 SP<br />
Sum of ex.st. 65.2 223.8 271.8 309.4 38.3 34.3 48.6 44.4 563.2<br />
Cu Total cont. 79.9 243.5 295.5 353.9 45.8 34.3 49.5 47.9 57<strong>2.</strong>0<br />
Yield % 81.6 91.9 9<strong>2.</strong>0 87.4 83.6 100 98.2 9<strong>2.</strong>7 98.5<br />
Sum of ex.st. 33.3 49.9 34.2 35.0 57.2 49.5 65.2 58.7 7.8<br />
ni Total cont. 35.5 66.0 8<strong>2.</strong>3 67.4 79.6 60.1 80.0 59.2 44.2<br />
Yield % 93.8 75.6 41.5 51.9 71.8 8<strong>2.</strong>4 81.5 98.5 17.6<br />
Sum of ex.st. 55.3 44.6 54.2 5<strong>2.</strong>3 35.2 66 23.5 2<strong>2.</strong>2 49.2<br />
Pb Total cont. 77.6 108 121 80 51 102 28 37 92<br />
Yield % 71.3 41.3 44.8 65.4 69 64.7 83.9 60 53.5<br />
The comparison of the sum of metal concentrations in<br />
the sequential extraction procedure with of total dissociation<br />
verified the suitability of the used method. Moreover,<br />
the RM LGC River Sediment was applied, where metal contents<br />
are copper – 83. 6 mg kg –1 , zinc – 439 mg kg –1 , nickel<br />
– 34.7 mg kg –1 and cadmium – <strong>2.</strong>7 mg kg –1 .<br />
Conclusions<br />
The one-shot sequential extraction, which characterise<br />
the individual forms of heavy metals bonds in the sediments,<br />
was used for the determination of heavy metals mobility in<br />
the contaminated sediments from the Hnilec River (Slovakia)<br />
area. 2M HnO 3 was used to define the released content<br />
including different fractions of elements according to their<br />
solubility. Potentially mobile and mobile forms represent the<br />
sum of risk element forms for the evaluation of sediment biotoxicity.<br />
In this connection, the sediments had low content<br />
of copper, nickel and lead in potentially mobile and mobile<br />
forms (fractions B–C). This fraction contains metals in ionchanging<br />
form and bond to carbonates.<br />
Lead and copper reached higher values and nickel was<br />
in the least concentration in fraction A (realised forms) in<br />
s467<br />
order Pb > Cu > ni. This fraction contains metals bonded to<br />
sulphide and phosphate.<br />
This work was supported by the Slovak Research and<br />
Development Agency, No 20-027705 and by the Slovak Grant<br />
Agency for Science VEGA.<br />
REFEREnCES<br />
1. Luptakova A.,: Flowed deposit Smolnik – the source of<br />
acid mining waters, 3rd Conference on Environment<br />
engineering, 81-85, 2006.<br />
<strong>2.</strong> Zavadska M., Zemberyova M., Farkasovska I.: Chem.<br />
papers 93, 391 (1999).<br />
3. Tessier A., Campbell P. G. C., Bisson M.: Anal. Chem.<br />
57, 844 (1979).<br />
4. Vojtekova V., Krakovska E.: Chem. papers 100,1096<br />
(2006).<br />
5. Takac P., Kozakova L., Valkova M., Zelenak F.: Acta<br />
Montanistica Slovaca 13(1), 82 (2008).
Chem. Listy, 102, s265–s1311 (2008) Environmental Chemistry & Technology<br />
P67 ELIMINATION OF SuLPhATES FROM wASTE<br />
wATER OF OLD MINING LOADS<br />
TOMISLAV ŠPALDOn, Ján BREHUV, JOZEF<br />
HAnČUľáK, OLGA ŠESTInOVá and ERIKA<br />
FEDOROVá<br />
Institute of Geotechnic of the Slovak academy of science,<br />
Watsonova 45, 043 53 Košice, Slovak republic,<br />
spaldon@saske.sk<br />
Introduction<br />
Heavy industry and the impact of mining, although being<br />
in decay, significantly facilitate the deterioration of quality<br />
of surface waters. Besides the technological water from the<br />
existing plants, there is a huge amount of secondarily polluted<br />
mining waters due to the rainfall. The rainfall water in the<br />
underground areas in old mining works gradually chemically<br />
and chemically and biologically reacts with the surrounding<br />
rock environment and brings amounts of harmful substances<br />
to the surface that pollute the surface waters. They include<br />
mainly heavy metals, sulphates, chlorides, phosphates and<br />
other substances.<br />
From the point of view of quality of surface waters the<br />
area in the vicinity of the municipality of Smolník has been<br />
known as one of the worst in Slovakia for a longer period of<br />
time and the brook of Smolník is ranked in the worst – the<br />
fifth degree of quality as a highly polluted brook.<br />
This work aims at the following: study the possibility<br />
of reduction of the concentration of the content of sulphates<br />
and other heavy metals set by the EU directives in the mining<br />
waters flowing from the old mining load of the deposit of<br />
Smolník.<br />
Table I<br />
Trend of mine water quality from Smolník in period from<br />
1986 to 2004 2<br />
Year SO 4 2– Fe Cu Mn<br />
[mg dm –3 ] [mg dm –3 ] [mg dm –3 ] [mg dm –3 ]<br />
1986 6,004 7<strong>2.</strong>0 37.2 43.3<br />
1987 4,634 51.2 39.4 65.8<br />
1991 1,155 7.0 11.1 1<strong>2.</strong>3<br />
1992 1,233 19.9 10.7 13.5<br />
1993 1,481 61.3 5.3 1<strong>2.</strong>8<br />
19941 1,350 57.8 7.2 11.3<br />
19942 4,000 155.0 11.8 11.0<br />
19943 9,512 914.7 51.3 104.7<br />
1995 5,825 77<strong>2.</strong>4 7.4 136.2<br />
1997 4,133 421.4 3.9 37.2<br />
2000 4,170 137.6 4.3 41.3<br />
2001 3,461 556.0 <strong>2.</strong>8 37.9<br />
2002 2,296 620.0 1.7 38.4<br />
2003 2,680 501.0 1.5 33.4<br />
2004 2,723 425.0 1.5 27.9<br />
s468<br />
Physical and Chemical Characteristics of the Mining<br />
water from the Deposit of Smolník<br />
Qualitative parameters of the running mining water<br />
were monitored systematically. The values often move significantly.<br />
They depend on the amount of rainfall, rainfall intensity,<br />
period of being held in the mining areas, place (depth),<br />
etc. A large number of floods and mainly fires in the mine<br />
caused huge increases of presence of Fe and Cu in the mining<br />
water. The mining fire by spontaneous combustion of pyrite<br />
in 1896–97 caused the increase of the Cu concentration up<br />
to 150 g dm –3 , in 1910 the Cu concentration increased even<br />
to 180 g dm–3 due to the fire! In 1923 57.6 tonnes of copper<br />
flew into the recepient. 1<br />
Table I evidently shows the gradual increase, culmination<br />
and finally the decrease of value of almost all indicators.<br />
Those changes were caused due to flooding and its completion.<br />
After almost four-year exposition of mining waters in<br />
the rock environment a strong mineralisation occurred and<br />
concentration of all components exceeded all permissible<br />
concentrations (they are exceeded today as well).<br />
E l i m i n a t i o n o f S u l p h a t e s u s i n g<br />
P r e c i p i t a t i o n a n d A l - I o n s .<br />
The concentration of sulphate ions in the tested water was<br />
2,984 mg dm –3 and pH 3.34. When making experiments with<br />
the mining water a HACH spectrophotometer, type DR 2000<br />
and a digital pH-meter WTW 330i were at our disposal.<br />
P r e c i p i t a t i o n o f S O 4 2 – I o n s O n l y<br />
a t P r e s e n c e o f C a ( O H ) 2 W i t h o u t<br />
A l 3 + I o n s<br />
•<br />
•<br />
•<br />
Methodological procedure of precipitation:<br />
Ca(OH) 2 – 15 minutes of mixing at 200 rpm,<br />
suspension filtering,<br />
determination of the content of sulphates and the pH<br />
value (see in Table II).<br />
Table II<br />
Results of mine water desulphatation by Ca(OH) 2 , Pech pit<br />
Ca(OH)<br />
Sample no. 2 pH SO4 2- effect<br />
[mg dm –3 ] [mg dm –3 ] des. [%]<br />
1 6 1<strong>2.</strong>59 2,400 19.6<br />
2 8 1<strong>2.</strong>60 2,362 20.8<br />
3 10 1<strong>2.</strong>61 2,385 20.1<br />
untreated<br />
water<br />
0 3.34 2,984 –<br />
As the required pH value is 1<strong>2.</strong>4 and more, Table II<br />
shows that the sufficient amount of Ca(OH) 2 is 5–6 g dm –3 .<br />
Higher amounts do not impact the pH values any longer.<br />
At the same time, one can observe that adding of lime itself<br />
has no significant impact on the reduction of the content of<br />
sulphates either. Out of the original approximate amount of<br />
2,984 g only 600 g were precipitated and that constitutes the<br />
efficiency of only about 20 %.
Chem. Listy, 102, s265–s1311 (2008) Environmental Chemistry & Technology<br />
P r e c i p i t a t i o n o f S O 4 2 – I o n s a t<br />
P r e s e n c e o f C a ( O H ) 2 a n d S o d i u m<br />
A l u m i n a t e ( A L R - F )<br />
Methodological procedure of precipitation is based on<br />
long range experiments of the scientific group from Technical<br />
university in Ostrava 3 : Best results of sulphates precipitation<br />
were obtained at pH value close to 1<strong>2.</strong>5.<br />
•<br />
•<br />
•<br />
•<br />
Ca(OH) 2 – 15 minutes of mixing at 200 rpm<br />
ALR-F –30 minutes of mixing at 200 rpm<br />
suspension filtering<br />
determination of the content of sulphates and the pH<br />
value<br />
Al ions changes to form hydrated calcium aluminates<br />
and part of arisen mineral ettringite, Fe ions change from<br />
bivalent to trivalent ferrous hydroxide and also remain in the<br />
mud.<br />
The results of those experiments are shown in<br />
Table III 5 .<br />
Table III<br />
Results of mine water desulphatation from Pech pit at optimal<br />
reagents dosing 4<br />
Sample Ca(OH) 2 ALR-F<br />
pH SO4 2– effect<br />
no.: [g dm –3 ] [ml dm –3 ] [mg dm –3 ] desul. [%]<br />
1 5.2 3.2 1<strong>2.</strong>56 118.28 96.03<br />
2 5.2 3.4 1<strong>2.</strong>56 199.60 93.31<br />
3 5.2 3.6 1<strong>2.</strong>56 49.92 98.32<br />
4 5.2 3.8 1<strong>2.</strong>56 45.28 98.48<br />
5 5.4 3.2 1<strong>2.</strong>56 64.40 97.84<br />
6 5.4 3.4 1<strong>2.</strong>56 123.28 95.87<br />
7 5.4 3.6 1<strong>2.</strong>55 65.00 97.82<br />
8 5.4 3.8 1<strong>2.</strong>55 49.64 98.33<br />
9 5.6 3.2 1<strong>2.</strong>58 114.40 96.17<br />
10 5.6 3.4 1<strong>2.</strong>58 4<strong>2.</strong>96 98.56<br />
11 5.6 3.6 1<strong>2.</strong>58 0.48 99.98<br />
12 5.6 3.8 1<strong>2.</strong>58 0.97 99.97<br />
E l i m i n a t i o n o f S u l p h a t e s U s i n g<br />
S o r b e n t s a n d I o n E x c h a n g e r s<br />
As opposed to the static regime when a sorbent or precipitation<br />
reagents are added to the water container when<br />
they are slowly mixed for a certain optimal time, in case of<br />
a dynamic regime the treated water continuously flows through<br />
the column the bed of which consists of a sorbent,<br />
a ion exchanger or a mixture with the sorbent. Experiments<br />
with the mining water from the shaft of Pech – Smolník<br />
were performed. The water was stabilised in the ratio of 5 ml<br />
HnO 3 (2M) per 1 litre. Elimination of sulphates can be reali-<br />
sed using the following methods:<br />
•<br />
•<br />
•<br />
•<br />
raw stabilised mining water,<br />
sorbent – active coal,<br />
ion exchanger – mixture 50 : 50 catex and anex,<br />
sorbent – zeolite (nižný Hrabovec) mineral form –clinoptilolite,<br />
structure - tectosilicate, empiric formula<br />
– (Ca,K 2 ,na 2 ,Mg) 4 Al 8 Si 40 O 96 . 24H 2 O,<br />
s469<br />
•<br />
•<br />
•<br />
•<br />
•<br />
mixture of 80 % of zeolite, 20 % cent of A–C,<br />
mixture 80 %of zeolite, 20 % of C–A,<br />
ion exchanger – cation exchanger – catex-strog acid<br />
Ostion,<br />
ion exchanger – anion exchanger – anex – light basic<br />
annex with styrene-DVB skeleton – Amberlite IRA-96,<br />
sorbent – slovakite (inorganic composite sorbent) – it<br />
is sorbent based on advantages of various minerals properties.<br />
Fig. 1. Graphic presentation of the desulphurisation effect at<br />
individual procedures<br />
Discussion to the Measured Results.<br />
Sulphates reduction is possible by various methods, like<br />
reversing osmosis, electrodialysis, ultrafiltration, diaphragm<br />
processes, but these methods are too expensive. Biological<br />
methods are long-lasting, that is why we used chemical processes,<br />
i.e. sorption by active coal, various sorbents and ion<br />
exchangers and precipitation by Al and Ca ions.<br />
Based on the results shown in Fig. 1. the success rate<br />
of individual reagents can be definitely set. The inorganic<br />
component sorbent slovakite may be considered as relatively<br />
successful. It was tested in the static regime as well and it was<br />
rather unsuccessful there. The result was surprising in case of<br />
the dynamic sorption. The efficiency of elimination of sulphates<br />
reached approximately 60 %. The efficiency of 43 %<br />
in case of the mixture of zeolite and the cation exchanger and<br />
the anion exchanger was caused only due to the small amount<br />
of the anion exchanger in the reagent. There was no practical<br />
effect of zeolite itself. Almost 100% efficiency was achieved<br />
by means of the anion exchanger what is in case of anion<br />
elimination logical 6 .<br />
Conclusion<br />
As the strict limits for waters discharged to the surface<br />
flows set by the European Union begin to come into force<br />
also in the recently acceded EU countries the issue of waters<br />
discharged from the old mining load of Smolník will have to<br />
be dealt with seriously very soon. Several options are offered.<br />
The use of ion exchangers would be probably very costly<br />
although a very efficient solution. The most probable solu-
Chem. Listy, 102, s265–s1311 (2008) Environmental Chemistry & Technology<br />
tion will be the use of physical and chemical methods, and<br />
namely their different combinations, such as neutralisation,<br />
precipitation by means of Al ions or sorption by means of<br />
composite sorbents.<br />
This paper was made under support of the Slovak grant<br />
agency VEGA within the project 2/7045/27 and the Agency<br />
for support of Research and Development based on Contract<br />
No. APVV-51-027705)<br />
REFEREnCES<br />
1. Jaško V.: Smolník: Komplexné hydrogeologické a hydrochemické<br />
posúdenie ložiska Cu – Fe rúd, Štúdia, Bratislava<br />
1966.<br />
<strong>2.</strong> Šlesárová A.: Doktorandská dizertačná práca. Košice<br />
2007.<br />
s470<br />
3. Vidlář J., Schejbal C. : Důlní vody s nadlimitním obsahem<br />
síranů a možnosti jejich čištění, Sborník vědeckých<br />
prací Vysoké školy báňské-Technické univerzity<br />
Ostrava, 1999.<br />
4. Heviánková S., Vidlář J., Špaldon T.: Tests of precipitation<br />
of sulphates from mining water, kwartalnik Górnictwo<br />
i Geoinžynieria, zeszit 3/2, Krakow 2005.<br />
5. Luptáková A., Špaldon T., Bálintová M.: Remedation of<br />
acid mine drainage by means of biological and chemical<br />
methods, IBS 2007, Frankfurt am Main, Biohydrometallurgy:<br />
From the single cell to the environment, p. 285,<br />
ttp Trans Tech publications Switzerland, 2007.<br />
6. Špaldon T.: Doktorandská dizertačná práca, Vysoká<br />
škola báňská, Ostrava 2007.
Chem. Listy, 102, s265–s1311 (2008) Environmental Chemistry & Technology<br />
P68 ARSENIC REMOVAL FROM wATER by<br />
SyNThETIC AKAGANEITE<br />
MIROSLAVA VáCLAVíKOVá a,c , KATARínA<br />
ŠTEFUSOVá a , GEORGE P. GALLIOS b and ŠTEFAn<br />
JAKABSKý a<br />
a Institute of Geotechnics, Slovak Academy of Sciences, Watsonova<br />
45, 043 53 Košice, Slovakia,<br />
b Laboratory of General. & Inorganic Chemical Technology,<br />
School of Chemistry, Aristotle University, 540 06 Thessaloniki,<br />
Greece,<br />
c School of Chemistry, Royal Military Academy, Renaissancelaan<br />
30, 1000 Brussels, Belgium,<br />
vaclavik@saske.sk<br />
Introduction<br />
Arsenic is considered one of the most toxic contaminants<br />
found in water-streams. It poses serious health risks<br />
to humans (e.g. cancer, cardiovascular and neurological effects).<br />
There are two main groups of arsenic pollution sources;<br />
natural (dissolution of As containing mineral ores) and<br />
anthropogenic sources (e.g. arsenic-based insecticides and<br />
pesticides, fertilizers, coal combustion, mining, semiconductor<br />
industies). The maximum contaminant level of arsenic in<br />
drinking water (both in EU and USA) is 10 μg dm –3 .<br />
Arsenic has several oxidation states (–3, 0, + 3, + 5) but<br />
the most common forms in natural waters are trivalent arsenite<br />
[As (III)] and pentavalent arsenate [As (V)]. The pH and<br />
the redox potential (Eh) of the aqueous system determine the<br />
predominant form of As; As (III) is dominant in reducing<br />
conditions while As (V) in oxidizing conditions. Generally,<br />
As (III) is considered to be more toxic than As (V) 1 .<br />
There are various methods for arsenic removal from<br />
water streams, such as sorption, ion-exchange, precipitation,<br />
coagulation and flocculation, reverse osmosis, membrane<br />
technologies, electrodialysis, biological processes as well as<br />
lime softening. A good overview 2 and a critical review 3 of the<br />
available methods are given recently. An effective and commonly<br />
used method for water treatment is sorption of arsenic<br />
on natural or synthetic sorbents. The most commonly used<br />
sorbents can be classified in two main groups: (i) sorbents<br />
based on iron compounds, which are the most frequently used<br />
(e.g. several iron (III) oxides/hydroxides, materials based on<br />
iron oxides/hydroxides, natural iron ores and waste materials<br />
containing iron particles) and (ii) sorbents based on aluminium<br />
compounds (e.g. activated alumina or gibbsite). Several<br />
other sorbents (clays, manganese dioxide, activated carbon,<br />
ion-exchange resins, biosorbents, etc.) have also been studied<br />
for As removal 2 .<br />
Experimental<br />
R e a g e n t s<br />
Analytical grade chemicals were used in all experiments.<br />
Model solutions were prepared by dissolving<br />
AsHna 2 O 4 . 7H2 O in deionized water, 0.01 M nanO 3 and<br />
s471<br />
0.1 M nanO 3 . The pH of the solutions was adjusted with suitable<br />
concentrations of naOH and HnO 3 .<br />
P r e p a r a t i o n a n d C h a r a c t e r i z a t i o n<br />
o f S o r b e n t<br />
Synthetic akaganeite was prepared by hydrolysis of partially<br />
neutralized FeCl 3 by addition of naOH. The precipitate<br />
thus obtained was centrifuged and it was subsequently submitted<br />
to dialysis to remove Cl – ions. The material was dried and<br />
used for arsenic sorption. XRD analysis 4 confirmed that the<br />
material produced was akaganeite. The specific surface area<br />
(measured by BET) was 151.3 m 2 g –1 .<br />
S o r p t i o n E x p e r i m e n t s<br />
The effect of pH, initial arsenic concentration, sorbent<br />
dose and temperature as well as ionic strength effect at arsenic<br />
sorption were studied in batch type experiments. The<br />
experiments were performed in a rotary shaker set at 30 rpm<br />
and equilibrium time 24 hours. Preliminary experiments have<br />
shown that equilibrium was established. The arsenic quantity<br />
in solutions was determined by AAS and spectrophotometry<br />
before and after the sorption experiments. The sorption capacity<br />
(Q) of akaganeite was calculated using the equation:<br />
C − C<br />
Q =<br />
C<br />
0 eq<br />
s<br />
where C 0 and C eq are the initial and equilibrium arsenic concentration,<br />
respectively and C s is the sorbent concentration<br />
in solution.<br />
Results<br />
E f f e c t o f S o l u t i o n p H<br />
It is well known that the solution pH plays an important<br />
role in all sorption experiments in aqueous systems. It determines<br />
the aquatic chemistry of the system under study (in this<br />
case As speciation) and also the charge density of the solid<br />
surface (sorbent). It is related to the sorption mechanisms and<br />
reflects the nature of the physicochemical interactions of the<br />
species in solution and the active sites on the sorbent 5 .<br />
The effect of solution pH on As (V) sorption on akaganeite<br />
was examinated at pH values <strong>2.</strong>0–9.0 at ambient temperature.<br />
Sorbent concentration in solution was 2 g dm –3 and<br />
initial arsenic concentration was 100 mg dm –3 . The results are<br />
given in Fig. 1. for various electrolyte (nanO 3 ) concentrations.<br />
The best sorption is observed at pH <strong>2.</strong>0. However, in<br />
this case, akaganeite is dissolved and iron was determined in<br />
filtrates. For this reason, all sorption experiments were carried<br />
out at pH 3.5, where no iron was found in solution. At<br />
this pH, the sorption capacity was a bit smaller than at pH <strong>2.</strong>0<br />
and around 40 mg As (V) g –1 of sorbent. This is considered<br />
quite good compared to the average value reported in the literature<br />
3 . The effect of the ionic strength was also studied by<br />
adding 0.01 and 0.1 M nanO 3 . It is shown that (Fig. 1.) the<br />
(1)
Chem. Listy, 102, s265–s1311 (2008) Environmental Chemistry & Technology<br />
effect can be considered as negligible. In a previous study 4<br />
the zeta potential of akaganeite was studied and the point of<br />
zero charge was found at pH 7.5. At pH 3.5, the zeta potential<br />
was around +20 mV and the predominant As (V) species<br />
is H 2 AsO 4 – . So, attractive electrostatic forces favour<br />
sorption. However, at pH 8.0, the zeta potential is negative<br />
and the predominant species is HAsO 4 –2 . electrostatic forces<br />
are repulsive but still sorption is achieved due to the existence<br />
of specific forces. Calculations with Geochemist Workbench<br />
(data not shown here) show that in the presence of<br />
iron mineral As (V) can form scorodite (iron arsenate) on the<br />
mineral surface and the maximum is obtained at pH <strong>2.</strong>0, This<br />
coincides very well with the maximum sorption at pH <strong>2.</strong>0 in<br />
our experiments (Fig. 1.). The existence of scorodite on akaganeite<br />
surface was also proved by FTIR spectra 6 . The chemical<br />
nature of the sorption can also explain the sorption of<br />
As (V) at pH 8.0. In our results, the effect of ionic strength<br />
was negligible. However, in the literature 6 a significant effect<br />
was observed, but with KnO 3 and in smaller sorbent<br />
concentrations (< 2 g dm –3 ). The effect was decreasing with<br />
increasing sorbent concentrations. This was attributed to<br />
the elimination of the negative charge of akaganeite by the<br />
potassium cations and the easier approach of As (V) species<br />
to the surface of the sorbent. It is well known that the increase<br />
of the ionic strength decreases the effective radius of the<br />
electric double layer. The arsenate species can come closer to<br />
the surface so that the attractive chemical forces overcome<br />
the electrostatic repulsion forces and sorption is achieved.<br />
Fig. 1. Effect of solution ph on As (V) sorption<br />
E f f e c t o f I n i t i a l A r s e n i c<br />
C o n c e n t r a t i o n<br />
The effect of initial arsenic concentration (20–<br />
200 mg dm –3 ) was studied with 2 g dm –3 sorbent concentration,<br />
ambient temperature and pH values 3.5 and 7.0. The<br />
results are given in Fig. <strong>2.</strong> (data points: experimental data,<br />
lines: isotherms). Sorption isotherms were evaluated (from<br />
experimental data) using the Freundlich model:<br />
Q KC<br />
= (2)<br />
b<br />
eq<br />
s472<br />
where Q is amount sorbed per unit mass of sorbent, K and b<br />
are constants and C eq is the equilibrium concentration. Freundlich<br />
sorption parameters (K, b, R 2 ) were calculated and are<br />
given in Table I. The maximum sorption capacity was around<br />
53 and 37 mg g –1 for pH values 3.5 and 7.0 respectively. The<br />
R 2 values show a good agreement of the model to the experimental<br />
data. As is expected, the K value (which shows the<br />
affinity of akaganeite to As (V) ) decreases with the increase<br />
of the pH.<br />
Fig. <strong>2.</strong> Sorption isotherms<br />
Table I<br />
Freundlich adsorption parameters<br />
pH Freundlich parameters<br />
K b R 2<br />
3.0 3<strong>2.</strong>26 0.10 0.98<br />
7.5 1<strong>2.</strong>84 0.23 0.97<br />
E f f e c t o f t e m p e r a t u r e<br />
The effect of temperature on arsenic sorption was investigated<br />
at initial arsenic concentration 100 mg dm –3 , sorbent<br />
concentration 2 g dm –3 and 4 different temperatures (ambient,<br />
30, 40 and 50 °C). The experimental results are presented<br />
in Table III. The maximum sorption capacity increased with<br />
increasing temperatures indicating an endothermic reaction<br />
6 . The maximum sorption capacity (at 50 °C) was around<br />
43 mg g –1 .<br />
Table II<br />
The effect of temperature<br />
T [°C] Q [mg g –1 ]<br />
ambient temperature 37<br />
30 38<br />
40 40<br />
50 43<br />
E f f e c t o f S o r b e n t D o s e<br />
The effect of sorbent dose was studied at ambient temperature,<br />
initial arsenic concentration 100 mg dm –3 and sorbent
Chem. Listy, 102, s265–s1311 (2008) Environmental Chemistry & Technology<br />
concentration range 0.5–10 g dm –3 . The results are presented<br />
in Table II. Increase of the sorbent dose in solution caused<br />
a decrease of akaganeite sorption capacity. However, this is<br />
not a good indicator of sorption ability, because with bigger<br />
sorbent concentrations all the available active sorption sites<br />
are not occupied. It is important to see what is the remaining<br />
As (V) concentration after treatment. In a real system this is<br />
the important factor; the remaining concentration should be<br />
below the limits. In the last column of Table III the remaining<br />
concentrations are given. It is observed a significant decrease<br />
of the remaining As (V) conc. with increase of the sorbent<br />
dose. It seems that a good dose is 5 g dm –3 , which gives a<br />
96 % removal and a satisfactory final As concentration of<br />
4 mg dm –3 .<br />
Table III<br />
The effect of sorbent dose<br />
C S [g dm–3 ] Q [mg g –1 ] C eq [mg dm –3 ]<br />
0.5 43.0 78.5<br />
1.0 41.4 58.6<br />
<strong>2.</strong>0 36.3 27.4<br />
5.0 19.2 4.0<br />
10.0 9.6 4.0<br />
Conclusions<br />
Synthetic akaganeite is a suitable sorbent for arsenic<br />
removal, especially at acidic environment. It is a low cost<br />
sorbent, as it is prepared from easily available cheap inorganic<br />
materials and has a good efficiency (above the average<br />
s473<br />
reported in the literature). It removes arsenic by chemical<br />
sorption favored by an increase of temperature and the best<br />
results are obtained at pH 3.5. However, at pH 7.0, gives<br />
also satisfactory results. This is important for the treatment<br />
of drinking water. The capacity of the material was not affected<br />
significantly with increased ionic strength (up to 0.1 M<br />
nanO 3 ). The experimental data follow (with good agreement)<br />
the Freundlich isotherm.<br />
Acknowledgement (This work has been supported by<br />
Slovak Research and Development Agency project No APVT-<br />
51-017104 and Scientific Grant Agency VEGA, project no.<br />
2/0087/08)<br />
REFEREnCES<br />
1. Smedley P. L., Kinniburgh D. G.: Appl. Geochem. 17,<br />
517 (2002).<br />
<strong>2.</strong> Vaclavikova M., Gallios G. P., Hredzak S., Jakabsky S.:<br />
Clean. Techn. Environ. Policy. 10, 89 (2007).<br />
3. Deliyanni, E. A., Peleka, E. n., Gallios, G. P., Matis, K.<br />
A.: Int J Envir & Waste Manag, (in press).<br />
4. Štefušová K., Václavíková M., Gallios G. P., Jakabský<br />
Š., Kozáková I., Ivaničová L., Gešperová D.: Proceedings<br />
of the 11th International Conference on Environment<br />
and Mineral Processing, Ostrava, 31 May –2 June<br />
2007, (Fečko P., Čablík V., ed.), Part II, p. 71 (Lecture).<br />
5. Aksu Z., Gönen F.: Process Biochem 39, 599 (2004).<br />
6. Deliyanni, E. A., Bakoyannakis, D. n., Zouboulis, A. I.,<br />
Matis, K. A.: Chemosphere 50, 155 (2003).
Chem. Listy, 102, s265–s1311 (2008) Environmental Chemistry & Technology<br />
P69 ThE EPR STuDy OF PARTICuLATE MATTER<br />
nADEŽDA ŠTEVULOVá, ADRIAnA EŠTOKOVá and<br />
PAVeL STOPKA<br />
Technical University of Košice, Civil Engineering Faculty,<br />
Institute of Building and Environmental Engineering, Vysokoškolská<br />
4, 042 00 Košice, Slovak Republic,<br />
Nadezda.Stevulova@tuke.sk<br />
Introduction<br />
In recent years the role of particulate matter in environmental<br />
and health areas has come under increased attention<br />
of experts and public. The PM 10 and PM <strong>2.</strong>5 (particle fractions<br />
related to their size) concentrations show higher correlation to<br />
the negative health effects in comparison to the total suspended<br />
particulate matter 1 . Building constructions and materials<br />
play an important role in indoor particulate matter contamination<br />
due to particles infiltration through joint construction<br />
leakages and material distribution and deposition processes 2 .<br />
The dust particles are dangerous not only because of<br />
their high concentrations in dependence on their particle size<br />
but also because of their nature 3 . The surface of the inhaled<br />
particles which determines the biological response is large.<br />
The surface reactivity of particles depends on the number of<br />
reactive spots on the dust particles surface and on the distribution<br />
of various sites (free radicals and paramagnetic species)<br />
at the surface 4 . It determines the pathogenic potential of<br />
inhaled particles.<br />
This work is concerned with the particulate matter reactivity<br />
investigation by concentration of surface active centres.<br />
Experimental<br />
Both total suspended particles (TSP) and PM 10 measurement<br />
includes integral sampling onto a collection material<br />
(membrane filter Synpor 0.8 µm pore size, 35 mm in diameter)<br />
by sampling equipment VPS 2000 (Envitech, Trenčín) at<br />
flow rate of 960 dm 3 h –1 during sampling period of approximately<br />
24 hours.<br />
The surface reactive spots concentrations of suspended<br />
particulate matter were detected on the spectrometer ERS<br />
220 (GAS, Berlin) with a resonator RSX 216 at room temperature<br />
under following conditions: the microwave power<br />
10 mW, modulation amplitude 0.02 mT, time constant 0.5 s.<br />
The relative intensity of the signals measured for investigated<br />
dust samples was determined by comparing them with those<br />
of Mn(II)/ZnS a Cr(III)/MgO as standard samples. The EPR<br />
spectrum was recorded as the first derivation of the absorption<br />
spectrum at the speed record 14.3 mT min –1 .<br />
The quantitative and qualitative interpretation of obtained<br />
spectra was performed by computer software Origin.<br />
Results<br />
Typical EPR spectra of investigated total suspended particulate<br />
mater and PM 10 samples are illustrated in Figs. 1.–3.<br />
s474<br />
Fig. 1. EPR spectra of total suspended particulates<br />
Fig. <strong>2.</strong> EPR spectrum of PM 10<br />
Fig. 3. Detail of PM 10 EPR spectrum<br />
Wide singlet peak centered at g factor value was identified<br />
in EPR spectra of particulates. The g factors range from<br />
<strong>2.</strong>010 to <strong>2.</strong>093 for measured particle samples as the Table I<br />
shows.<br />
Singlet peak superponed by triplet peak with factor<br />
values g 1 = <strong>2.</strong>1162, g 2 = <strong>2.</strong>0700, g 3 = <strong>2.</strong>0191 was identified<br />
in EPR spectrum of total particulate matter in Fig. 1. It<br />
could be an isotropic triplet (g = <strong>2.</strong>07) with splitting constant<br />
a = 7.6375 +/ 0.5495 mT.
Chem. Listy, 102, s265–s1311 (2008) Environmental Chemistry & Technology<br />
Table I<br />
G-factor values, ΔH pp and spin concentrations<br />
Sample g-factor ΔHpp [mT]<br />
Spin concentration<br />
[spin mg –1 ]<br />
TSP <strong>2.</strong>070 34.6 3.84 × 10 18<br />
TSP <strong>2.</strong>015 40.0 3.68 × 10 17<br />
TSP <strong>2.</strong>020 40.0 1.64 × 10 18<br />
TSP <strong>2.</strong>010 40.0 <strong>2.</strong>22 × 10 18<br />
PM10 <strong>2.</strong>093 472 <strong>2.</strong>01 × 10 18<br />
PM10 <strong>2.</strong>080 554.9 <strong>2.</strong>02 × 10 17<br />
PM10 <strong>2.</strong>055 410.8 <strong>2.</strong>06 × 10 17<br />
PM10 <strong>2.</strong>070 345.65 1.09 × 10 19<br />
The signals on EPR spectra recorded on the particulate<br />
samples were identified as a superposition of signals arising<br />
from various paramagnetic species. It is mainly the presence<br />
of transition metal ions in a low oxidation state, typically<br />
iron, which have to be regard as a possible cause of toxicity.<br />
In accordance with results obtained in paper 4 , the appearance<br />
of Fe 2+ on the surface of the dust particles and its subsequent<br />
oxidation to Fe 3+ in octaedric configuration leads to production<br />
of free radicals at solid-liquid interphase by direct<br />
reduction of atmospheric molecular oxygen. These sites may<br />
be implicated in the formation of dangerous active oxygen<br />
species in vivo.<br />
The total surface spin concentrations of particulate samples<br />
were determined in range from 3.68 × 10 17 to 3.84 ×10 18<br />
spin.g -1 for total suspended particulate matter and from<br />
<strong>2.</strong>02 ×10 17 to 1.09 ×10 19 spin g –1 for PM 10 . The significant<br />
difference between spin concentrations values of total<br />
s475<br />
suspended particulate matter and PM 10 was not found. The<br />
determined spin concentrations values are approximately 10 2<br />
times higher than spin concentrations values of mechanically<br />
activated quartz and silicon powders 5 .<br />
Conclusions<br />
The determined surface spin concentrations obtained<br />
from EPR spectra were high. But based on these experimental<br />
results of paramagnetic centres occurrence study explicitly,<br />
it cannot be expressily considered particulate matter to have<br />
toxic properties. The paramagnetic ions testing in special<br />
chemical reactions 6 used for this purpose may more accurately<br />
indicate potential risk of particulate matter toxicity.<br />
Acknowledgement: This work has been supported by<br />
Grant Agency of Slovak Republic (project No. 1/3342/06).<br />
REFEREnCES<br />
1. Marconi A.: Proceeding of Conference Healthy Buildings,<br />
p. 531. Helsinky, 2000.<br />
<strong>2.</strong> Sverak T.: Int. J. Mineral. Proces. 74, S379 (2004).<br />
3. Seinfeld J. H.: Atmospheric Chemistry and Physics of<br />
Air Pollution. Wiley, new York 1985.<br />
4. Volante M., Giamello E. et al: Proceeding of the 1 st<br />
International Conference on Mechanochemistry, p.125.<br />
Cambridge Interscience Publishing, Cambridge, 1994.<br />
5. Tkáčová K., Števulová n.: J. Mater. Res. 10, 2728<br />
(1995).<br />
6. Fenoglio I., et al: J. Mater. Synth. Proces. 8, 145<br />
(2000).
Chem. Listy, 102, s265–s1311 (2008) Environmental Chemistry & Technology<br />
P70 SELECTION OF PACKING MATERIALS FOR<br />
bIOFILTER DEVELOPMENT<br />
IVETA ŠTYRIAKOVá and ALEXAnDRA VAŠKOVá<br />
Institute of Geotechnics of the Slovac Academy of Sciences,<br />
Watsonova 45, 043 53 Košice, Slovakia,<br />
bacil@saske.sk<br />
Introduction<br />
natural materials that are available in large quantities<br />
may have potential as inexpensive sorbents. Cost effective<br />
alternative technologies or sorbents for treatment of metals<br />
contaminated waste streams are needed. A study 1 reported<br />
that zeolites, clinoptilolite in particular, demonstrate strong<br />
affinity for Pb and other heavy metals. Adsorbing Cd and<br />
Zn examined by both modifications with natural bentonite 2 .<br />
Results showed that the acid-treatment decreased the adsorption<br />
capacity, while the heat treatment did improve capacity.<br />
Retention of Pb and Zn on pure calcite was the subject of a<br />
number of investigations 3,4 . On the contrary, the number of<br />
sorption studies of both ions on magnesite is very limited.<br />
Investigations on the biosorption mechanism of heavy<br />
metals show that the metal ions are deposited by adsorption<br />
to the functional groups present on the cell wall. Dead as well<br />
as living cells are used in the removal of metal ions 5,6 . The<br />
batch adsorption experiments demonstrate that the surface<br />
complexation approach can be used successfully to quantify<br />
the adsorption of Cd in a mixed B. subtilis – quartz system as<br />
functions of both pH and solute/sorbent ratios 7 .<br />
We are interested in the surface complexation approach<br />
of zeolite, bentonite, calcite, magnezite and also these materials<br />
with bacteria in the behavior various heavy metals in the<br />
batch experiments. The objectives of this work were to determine<br />
the differences of mineral/water and mineral-bacteria/<br />
water interface in sorption capacities of metals.<br />
Experimental<br />
The biosorption experiments were carried out in Erlenmeyer<br />
flasks which contained 10 g samples and 100 ml<br />
medium. The medium contained (per liter) 0.5 g naH 2 PO 4 ,<br />
1.0 g (nH 4 ) 2 SO 4 , 0. g naCl, and 2 g glucose. The flasks were<br />
inoculated with a mixture of Bacillus cereus and B. megaterium<br />
(0.1 g wet bacteria dm –3 ) that had been previously isolated<br />
from Horná Prievrana. The two strains were purified by<br />
heat treatment at 80 °C for 15 min followed by streak plating<br />
on nutrient agar cultures. The isolates were identified with<br />
the BBL Crystal Identification System (Becton, Dickinson<br />
and Co., Franklin Lakes, nJ). For identification, the isolates<br />
were cultivated on Columbia agar plates per manufacturer’s<br />
instructions.<br />
The flasks were incubated under dynamic conditions<br />
(150 rev min –1 ) for 3 hours at 25 °C. The liquid phase was<br />
contained individual metals in 0.5mM concentration in the<br />
forms ZnSO 4 , CuSO 4 , PbCO 3 . The spent media (leachates)<br />
were sampled for metal analysis. The chemical controls<br />
s476<br />
did not receive an inoculum but were incubated under otherwise<br />
similar conditions.<br />
Solid residues were analyzed by X-ray diffraction using<br />
a Philips X’Pert SW–binary diffractometer with CuKα radia tion (40 kV, 50 mA), equipped with an automatic divergence<br />
slit, sample spinner, and a graphite secondary monochromator.<br />
Data were collected for 2–60 °2Θ with a step width of<br />
0.05 ° and a counting time of 30 s per 0.05 °. The mineralogy<br />
has been evaluated in quantitative terms from X-ray powder<br />
diffraction patterns using a Rietveld-based data processing<br />
technique.<br />
Quantitative changes in the liquid phase were measured<br />
with a Model 30 Varian atomic absorption spectrometer<br />
(Varian, Inc., Melbourne, Vic., Australia).<br />
Batch experiments were conducted to measure:<br />
• Zn, Cu, Pb and zeolite adsorption in a mixed singly<br />
metals – zeolite – Bacillus system<br />
• Zn, Cu, Pb and bentonite adsorption in a mixed singly<br />
metals – bentonite – Bacillus system second<br />
• Zn, Cu, Pb and quartz sands adsorption in a mixed singly<br />
metals – quartz sands – Bacillus system<br />
• Zn, Cu, Pb and calcite adsorption in a mixed singly<br />
metals – calcite – Bacillus system<br />
• Zn, Cu, Pb and magnezite adsorption in a mixed singly<br />
metals – magnezite – Bacillus system<br />
Z e o l i t e<br />
The natural materials, zeolite was obtained from nižný<br />
Hrabovec location in Slovakia. The mineralogical composition<br />
of zeolite was clinoptilolite 51–68 %, quartz + cristobalite<br />
9–20 %, feldspars 8–13 %, mica 13 % and iron minerals<br />
0.3 %.<br />
Table I<br />
Chemical composition of zeolite<br />
Components SiO 2 Al 2 O 3 Fe 2 O 3 MgO na 2 O<br />
% wt. 67.0 1<strong>2.</strong>3 1.3 0.7 0.7<br />
B e n t o n i t e<br />
The natural materials, zeolite was obtained from Lastovce<br />
location in Slovakia. The mineralogical composition<br />
of bentonite was smectite 63%, quartz 21%, kaolinite 11%,<br />
feldspars 4-6% and calcite 2%.<br />
Table II<br />
Chemical composition of bentonite<br />
Components SiO 2 Al 2 O 3 Fe 2 O 3 MgO na 2 O<br />
% wt. 59.2 18.6 <strong>2.</strong>8 4.2 0.7<br />
Q u a r t z S a n d s<br />
The natural materials, zeolite was obtained from nižný<br />
Hrabovec location in Slovakia. The mineralogical composi
Chem. Listy, 102, s265–s1311 (2008) Environmental Chemistry & Technology<br />
tion of zeolite was quartz 85 %, kaolinite 8 %, mica 6 % and<br />
iron minerals 3–5 %.<br />
Table III<br />
Chemical composition of quartz sands<br />
Components SiO 2 Al 2 O 3 Fe 2 O 3 MgO na 2 O<br />
% wt. 96.1 1.7 0.4 0.05 0.03<br />
C a l c i t e<br />
The natural materials, calcite was obtained from Horné<br />
Srnie location in Slovakia. The mineralogical composition of<br />
rock was calcite 80 %, quartz 5 %, kaolinite 2 %, plagioclase<br />
0.5 %, and iron minerals 0.7 %.<br />
Table IV<br />
Chemical composition of calcite<br />
Components SiO 2 Al 2 O 3 Fe 2 O 3 MgO na 2 O<br />
% wt. 11.8 3.9 1.2 0.8 0.05<br />
M a g n e z i t e<br />
The fired material of magnezite was obtained from Jelšava<br />
location in Slovakia. The mineralogical composition of<br />
sample was periclase 98 %.<br />
Table V<br />
Chemical composition of fired magnezite<br />
Components SiO 2 CaO Fe 2 O 3 MgO K 2 O<br />
% wt. 0.02 0.11 0.01 97.3 0.06<br />
Results<br />
The individual mineral phases of silicates (zeolite, bentonite,<br />
quartz sands) and carbonates (magnezite, calcite) can<br />
control the efficiency of biofiltration when sorption and precipitation<br />
of metals occurs. Moreover, in both cases, Zn, Cu,<br />
Pb were accumulated at the mineral and cell surface as precipitates.<br />
An important parameter for packing material is the<br />
removal capacity of the minerals.<br />
Removal of Zn from solution by silicate was of lower<br />
efficiency, 20 % Zn by zeolite, 46 % by bentonite, 21 % by<br />
quartz sands was removed, while up to 55 % by calcite and<br />
88 % by magnezite (Fig. 1.).<br />
Removal of Cu was similar approximately 24 % by<br />
these minerals (Fig. <strong>2.</strong>).<br />
Pb was very effective removed 93 % by bentonite and<br />
magnezite and 74 % by zeolite and calcite (Fig. 3.).<br />
The experimental results of the selected natural mineral<br />
materials showed that bentonite has higher adsorption capacities<br />
than zeolite for Pb and Zn. However, magnezite appear<br />
to be more effective than calcite in precipitation of Pb and<br />
Zn.<br />
The affinity series for bacterial removal of these metals<br />
decrease in the order Pb > Zn > Cu with the low sorption<br />
capacity only approximately 0.06 mM dm –3 . At 0.1 g bacte-<br />
s477<br />
ria dm –3 is a small amount of cells for adsorption metals onto<br />
the bacterial surface.<br />
Fig. 1. Time dependence of Zn biosorption and precipitation<br />
by minerals and bacterial cells<br />
Fig. <strong>2.</strong> Time dependence of Cu biosorption and precipitation<br />
by minerals and bacterial cells<br />
Fig. 3. Time dependence of Pb biosorption and precipitation<br />
by minerals and bacterial cells
Chem. Listy, 102, s265–s1311 (2008) Environmental Chemistry & Technology<br />
This biosorption batch experiment represents a mineralsdominated<br />
regime in which the bacterial concentration is low,<br />
and therefore the difference of mineral and cell adsorption<br />
is big in the biological processes of pH change from 7 to 4<br />
during silicate biofiltration and of pH change from 7 to 9<br />
during carbonate biofiltration.<br />
The result dominantly involves decreasing metal concentration<br />
in solution in dependence of time and kind of<br />
minerals. This indicates that the contact time between the<br />
metal solution and the mineral kind and also the bacterial<br />
amount is of crucial importance.<br />
Conclusions<br />
The batch adsorption experiment in ternary and binary<br />
systems with individual sorbents, ternary metal-mineralbacteria<br />
and binary metal-bacteria interaction can be used to<br />
ascertain the effect of bacteria and selected of minerals like<br />
packing materials in development of biofilters. The results<br />
suggest that the adsorption observed in the 0.1 g dm –3 bacterial<br />
dm –3 system dominantly involves the mineral surface<br />
s478<br />
that is why biofiltration need to increase bacterial amount in<br />
packing filter.<br />
This work has been supported by the Slovak Academy of<br />
Sciences (VEGA 2/0049/08).<br />
REFEREnCES<br />
1. Leppert D.: Mining. Eng. 42, 604 (1990).<br />
<strong>2.</strong> Pradas E. G., Sánchez M. V., Cruz F. C., Viciana M. S.,<br />
Pérez M. F.: J.Chem. Tech. Biotechnol. 59, 289 (1994).<br />
3. Elzinga E. J., Reeder R. J.: Geochimica et Cosmochimica<br />
Acta 66, 3943 (2002).<br />
4. Godelitsas A., Astilleros J. M., Hallam K., Harissopoulos<br />
S., Putnis A.: Environ. Sci. Technol. 37, 335 (2003).<br />
5. Panchanodikar V. V., Das R. P.: Int. J. Environ. Stud. 44,<br />
251 (1993).<br />
6. Kuyucak n., Volesky B.: Biotechnol. Lett. 10, 137<br />
(1988)<br />
7. Yee n., Fein J. B.: Chem. Geol. 185, 303 (2002).
Chem. Listy, 102, s265–s1311 (2008) Environmental Chemistry & Technology<br />
P71 ANTIbIOTIC EFFECTS OF ThE<br />
NAPhTOQuINONIC DERIVATIVE ON GRAM-<br />
POSITIVE AND GRAM-NEGATIVE GERMS<br />
RADU TAMAIAn a , nADIA PăUn a , VIOLETA<br />
nICULESCU a , AnDREEA IORDACHE a , RALUCA<br />
VREMERă a and şTEFAnIA BROSCăŢEAn b<br />
a Research and Development Department, National Research<br />
and Development Institute for Cryogenics and Isotopic Technologies<br />
– ICIT Râmnicu Vâlcea, Uzinei Street No. 4 240050,<br />
Râmnicu Vâlcea, Romania,<br />
b S.C. IMOFARM S.R.L., Piscului Street No. 15 040403, Bucu-<br />
reşti, Romania,<br />
tradu@icsi.ro<br />
Introduction<br />
Intestinal motile bacteria Enterobacter aerogenes and<br />
nonmotile coccus Enterococcus faecalis are known as being<br />
contaminating pathogenetic agents of aliments 1–3 and drinking<br />
water 4 . Pathological agents: coccus and bacteria have a<br />
significant multiple-antibiotic resistance at natural drugs and<br />
also at chemically obtained drugs. 5–10<br />
The naphthoquinones are a wide class of plants’ metabolites,<br />
which are currently used for manufacturing cosmetics,<br />
foods or for medicinal purposes 11,12 . Also the natural<br />
naphthoquinones were tested for antitumoral 13 , antiinflamatory<br />
14 and antimicrobial 15,16 activity. For antibiotic activity<br />
is being responsible the compound structure, therefore the<br />
aim of any structure-activity relationship should be to find<br />
the most potent and least toxic compound. In this respect,<br />
we studied the antibiotic effect of dichlor derivative of 1,4naphthoquinone:<br />
2,3-dichloro-1,4 naphthoquinone (dichlone<br />
– Fig. 1.) on Gram-positive nonmotile coccus Enterococcus<br />
faecalis, and Gram-negative motile bacteria Enterobacter<br />
aerogenes.<br />
Fig. 1. Dichlone structure<br />
In order to identify dichlone’s grade of remanence, in the<br />
inoculated culture mediums, it was used HPLC technique.<br />
Experimental<br />
M a t e r i a l s a n d E q u i p m e n t s<br />
Dehydrated culture media: primary culture media TSA<br />
(tryptic soy agar) from Fluka (Buchs, Switzerland) and M-H<br />
broth (Müeller-Hinton broth) from Fluka (Buchs, Switzerland)<br />
for antibiotic susceptibility testing.<br />
s479<br />
Both culture media were rehydrated with ultrapure<br />
water made with water ultra-purifier TKA Smart2Pure UV6<br />
from TKA Wasseraufbereitungssysteme GmbH (niederelbert,<br />
Germany).<br />
Used microbial strains were made by MicroBioLogics<br />
Inc. (Saint Cloud, USA), as following:<br />
•<br />
•<br />
•<br />
KWIK-STIK: Enterococcus faecalis (ATCC 29212);<br />
KWIK-STIK: Enterococcus faecalis (ATCC 19433);<br />
KWIK-STIK: Enterobacter aerogenes (ATCC<br />
13048).<br />
Culture media were sterilised with a Raypa AES-75<br />
autoclave from R.ESPInAR, S.L. (Barcelona, Spain).<br />
All cultures were incubated in a Raypa Incuterm ID-50<br />
incubator from R.ESPInAR, S.L. (Barcelona, Spain).<br />
Barium chloride from Utchim S.R.L. (Râmnicu Vâlcea,<br />
Romania) and sulfuric acid from Utchim S.R.L. (Râmnicu<br />
Vâlcea, Romania) were used for preparation of McFarland<br />
turbidity standards.<br />
Odyssey DR/2500 spectrophotometer from Hach Company<br />
(Loveland, USA) was used for inoculums’ and prepared<br />
McFarland turbidity standards’ OD (optical density) determination.<br />
For antimicrobial susceptibility testing it was used dichlone<br />
from Merck (Darmstadt, Germany).<br />
Dichlone’s grade of remanence was detected with HPLC<br />
equipment: Thermo Finnigan Surveyor system from Thermo<br />
Fisher Scientific Inc. (Waltham, USA). PDA detector set to<br />
254 nm. Hypersil GOLD Column 100 × 4.6 mm.<br />
Dichlone standard for HPLC: dichlone standard from<br />
Supelco (Bellefonte, USA).<br />
•<br />
•<br />
Other reagents for HPLC technique:<br />
Acetonitrile from Merck (Darmstadt, Germany);<br />
Water Chromasolv from Honeywell International Inc.,<br />
Riedel-de Haën (Seelze, Germany).<br />
M e t h o d s<br />
Primary and secondary cultures: the KWIK-STIK<br />
lyophilized microorganisms’ strains (Enterococcus faecalis<br />
ATCC 29212 and ATCC 19433; Enterobacter aerogenes<br />
ATCC 13048) were transferred on Petri dishes with sterile<br />
TSA and incubated at 35 °C for 24 hours (primary cultures);<br />
then, subcultures were made from primary cultures and incubated<br />
also on sterile TSA for 24 hours at 35 °C.<br />
Antimicrobial susceptibility testing by broth microdilution<br />
technique: dichlone’s MIC (minimal inhibitory concentration<br />
– defined as drug concentration at which no growth is<br />
visible) was determined by broth microdilution technique. A<br />
sterile culture tube with M-H broth was inoculated with an<br />
aliquot from the three types of secondary growth. Inoculated<br />
broth’s OD was adjusted at 0.5 McFarland standard with prepared<br />
turbidity standards – aproximatively 1 × 10 8 CFU ml –1 .<br />
Standardised inoculums’ aliquots from all three types of<br />
secondary culture were transferred on culture tubes with sterile<br />
liquid medium: M-H broth. Dichlone’s MIC was tested<br />
on those standardised inoculums, on M-H broth.
Chem. Listy, 102, s265–s1311 (2008) Environmental Chemistry & Technology<br />
Table I<br />
Concentration of dichlone used in MIC testing<br />
Dilution 1 Dilutions 2 Dilutions 3<br />
0.001 μg ml –1 0.125 μg ml –1 16.0 μg ml –1<br />
0.002 μg ml –1 0.25 μg ml –1 3<strong>2.</strong>0 μg ml –1<br />
0.004 μg ml –1 0.5 μg ml –1 64.0 μg ml –1<br />
0.008 μg ml –1 1.0 μg ml –1 128.0 μg ml –1<br />
0.016 μg ml –1 <strong>2.</strong>0 μg ml –1 256.0 μg ml –1<br />
0.032 μg ml –1 4.0 μg ml –1<br />
0.064 μg ml –1 8.0 μg ml –1<br />
HPLC technique: for the identification of 2,3-dichloronaphtoquinone<br />
in the samples a 1 mg ml –1 solution was prepared<br />
in acetonitrile and 10 μl injected into the HPLC system.<br />
The sample was injected three times.<br />
Mobile phase was 60 % acetonitrile with 40 % water.<br />
Chromatograms were registered at 254 nm.<br />
Results<br />
Antimicrobial susceptibility testing results show that the<br />
dichlone have no antimicrobial activity on Gram-negative<br />
bacteria Enterobacter aerogenes; in the same time the growth<br />
of Gram-positive coccus Enterococcus faecalis (both strains)<br />
was completly inhibited, as in Table II.<br />
Table II<br />
Dichlone’s MIC on Enterococcus faecalis strains<br />
Strain MIC [μg ml –1 ]<br />
E. faecalis – ATCC 29212 0.5<br />
E. faecalis – ATCC 19433 0.5<br />
As we mentioned in introduction, dichlone’s grade of<br />
remanence, in the inoculated culture mediums for MIC was<br />
determined by HPLC. The chromatograms of the mentioned<br />
naphtoquinone obtained at the most effective chromatographic<br />
conditions are shown in Figs. <strong>2.</strong> and 3.<br />
The height and area of PDA signal (254 nm) for this<br />
naphtoquinone confirmed the calculated value for MIC.<br />
Fig. <strong>2.</strong> hPLC chromatogram for dichlone’s MIC (e. faecalis<br />
– ATCC 29212)<br />
s480<br />
Fig. 3. hPLC chromatogram for dichlone’s MIC (E. faecalis<br />
– ATCC 19433)<br />
Conclusions<br />
The results of this study show that dichlone has no antimicrobial<br />
activity on Gram-negative germs (Enterobacter<br />
aerogenes). In the mean time, dichlone’s MIC on Gram-positive<br />
germs (Enterococcus faecalis – both strains) it was at<br />
0.5 μg ml –1 in liquid culture media (M-H broth). This concentration<br />
was confirmed by HPLC determination.<br />
This work has been supported by Romanian Ministry<br />
of Education and Research, National Authority for Scientific<br />
Research, National Centre for Programmes Management<br />
on Project No. 1885 NANOQMED: “Obtaining and characterization<br />
of new targeted-nanodrugs with naphtoquinonic<br />
active substance”.<br />
REFEREnCES<br />
1. Clark J. A., Burger C. A., Sabatinos L. E.: Can. J. Microbiol.,<br />
28, 1002 (1982).<br />
<strong>2.</strong> Baudart J., Coallier J., Laurent P., Prévost M.: Appl.<br />
Environ. Microbiol., 68, 5057 (2002).<br />
3. Filipkowska Z.: Acta Microbiol. Pol., 52, 57 (2003).<br />
4. Delbés C., Ali-Mandjee L., Montel M. C.: Appl. Environ.<br />
Microbiol., 73, 1882 (2007).<br />
5. Johnston L. M., Jaykus L. A.: Appl. Environ. Microbiol.,<br />
70, 3133 (2004).<br />
6. Hayes J. R. English L. L. Carr L. E., Wagner D. D.,<br />
Joseph S. W.: Appl. Environ. Microbiol., 70, 6005<br />
(2004).<br />
7. Morosini M. I., Garciá-Castillo M., Coque T. M., Valverde<br />
A., novais A., Loza E., Baquero, Cantón R.: Antimicrob.<br />
Ag. Chemoth., 50, 2695 (2006).<br />
8. Sawant A. A., Hegde n. V., Straley B. A., Donaldson<br />
S. C., Love B. C., Knabel S. J., Jayarao B. M.: Appl.<br />
Environ. Microbiol., 73, 156 (2007).<br />
9. Macovei L., Zurek L.: Appl. Environ. Microbiol., 72,<br />
4028 (2006).<br />
10. Macovei L., Zurek L.: Appl. Environ. Microbiol., 73,<br />
6740 (2007).<br />
11. Masuda K., Funayama S., Komiyama K., Umezawa, I.,<br />
Ito K.: J. nat. Prod., 50, 418 (1987).
Chem. Listy, 102, s265–s1311 (2008) Environmental Chemistry & Technology<br />
1<strong>2.</strong> Papageorgiou V. P., Assimopoulou, A. n., Couladouros<br />
E. A., Hepworth D.; nicolaou K. C.: Angewdte Chem.<br />
Int., 38, 270 (1999).<br />
13. Gokhale1 n., Padhye S., newton C., Pritchard R.:<br />
Metal-Based Drugs, 7, 121 (2000).<br />
14. Steihberg F. M., Gershwin M. E., Rucker R. B.: Jour.<br />
nutr., 1994, 744.<br />
s481<br />
15. de Paiva S. R., Figueiredo M. R., Aragão T. V., Coelho<br />
Kaplan M. A.: Mem. Inst. Oswaldo Cruz, 98, 959<br />
(2003).<br />
16. Brandelli A., Bizanim D., Martinelli M., Stefani V.,<br />
Gerbase A. E.: Braz. Jour. Pharm. Sci., 40, 247 (2004).
Chem. Listy, 102, s265–s1311 (2008) Environmental Chemistry & Technology<br />
P72 PRACTICAL APPLICATION IN AGRICuLTuRE<br />
OF ThE MAGNESIuM PRODuCTS INDuSTRy<br />
wASTE<br />
LIDIA TAUBERT, HORTEnSIA RADULESCU, SánDOR<br />
A. KISS, RUDOLF KASTORI, ECATERInA PRInCZ and<br />
éVA STEFAnOVITS-BánYAI<br />
Chemistry Institute – Timisoara of the Romanian Academy,<br />
Bv. Mihai Viteazu No.24, 300223 – Timisoara, Romania.<br />
lidiat@acad-icht.tm.edu.ro<br />
Introduction<br />
The industrial processes of manufacturing magnesium<br />
compounds – oxide and carbonates mainly, from dolomites,<br />
by carbon dioxide leaching, generate important amounts of<br />
waste 1,2 . The composition of this waste includes calcium carbonate<br />
and precipitated magnesium carbonates (in ratio of<br />
3:1 till 4:1) together with other impurities, presents in the raw<br />
material such as iron, manganese, copper and zinc 3,4 .<br />
The alkaline reaction and the important mineral content<br />
– essential and trace elements – of this waste can be valuated<br />
in agriculture as soil amendment and fertilizer for acid soils<br />
with low fertility 5–7 .<br />
The main objective of this study is to present the influence<br />
of waste types and doses on the fertility characteristics<br />
of an acid soil. The improve of the soil fertility was established<br />
by studying some vegetation characteristics and the protein<br />
content of green oat plants. The paper reports the effects<br />
of several waste doses and types on luvosoil with and without<br />
nitrogen contribution. Two types of waste were experimented,<br />
one from the industrial process (A) and the second resulted as<br />
crusts deposed on the equipment walls (B).<br />
Experimental Part<br />
Luvosoil, having a pH H2O of 6.94 and pH KCl of 5.76 and<br />
a rather low soil fertility, was collected, air-dried, crushed,<br />
mixed and put into pots, each containing 1 kilogram soil. The<br />
soil was treated with two types of waste in different amounts,<br />
having each the composition presented in Table I.<br />
Table I<br />
Composition of the two experimented industrial waste<br />
Specification Waste A Crusts B<br />
Ca, % 28 19<br />
Mg, % 7 14<br />
Fe, mg kg –1 1850 880<br />
Cu, mg kg –1 1.9 51<br />
Mn, mg kg –1 136 51<br />
Zn, mg kg –1 <strong>2.</strong>6 50<br />
The experimental alternatives pursued by this research<br />
consist of four different doses for each waste (A, B), namely<br />
A 1 , A 2 , A 3 , A 4 and B 1 , B 2 , B 3 , B 4 and also a control alternative<br />
(C 0 ), represented by untreated soil. All the experimental<br />
s482<br />
alternatives took place in three replicates (R 1 , R 2 , R 3 ). At the<br />
replicates R 2 and R 3 , 134 mg nitrogen kg –1 soil as ammonium<br />
nitrate was added in each pot. The description of the experimental<br />
alternatives is shown in Table II, in which R represent<br />
the replicate without nitrogen treatment (R 1 ) and R n – the<br />
average of replicates R 2 and R 3 , treated with nitrogen.<br />
All the pots were sown with thirty oat grains. The vegetation<br />
period was that of green plant, pursued for 8 weeks.<br />
The pots were placed in laboratory near the window and<br />
watered every second day by 100 ml water. Along the vegetation<br />
period, some morphological parameters, like number<br />
of risen plants, plant size, fresh and dry weight were pursued.<br />
Some composition features like dry matter and protein content<br />
were determined too. At harvest time, soil samples were<br />
collected in order to establish the impact of waste treatment<br />
on soil fertility. Soil characteristics like pH, essential and<br />
trace elements were analysed.<br />
Soil pH in watery and salin extracts was determined by<br />
a pH-meter. The metal element content in soil at harvest time<br />
was established by AAS-ICP method. The protein content in<br />
oat plants was analysed by using the Kjeldahl method.<br />
Results and Discussion<br />
The impact of waste treatment on soil reaction and macroelements<br />
content is shown in Table III.<br />
Soil reaction was analysed using two analytical methods,<br />
in watery and salt extract. The extraction in KCl solution<br />
hinders salts hydrolysis in soil and therefore the obtained pH<br />
values are more stable but lower by 1.7 pH units in comparison<br />
with those of the watery extract. For both methods, a<br />
buffer process of the soil reaction was established, turning<br />
the low acid soil reaction to an alkaline reaction, proportional<br />
with the increase of the waste dose. The increase of the<br />
pH value took place slowly by adding waste A and suddenly<br />
in case of waste B, which composition contains more magnesium<br />
than that of waste A. The highest pH values were<br />
established for A 4 (pH = 8.354) and B 4 (pH = 8.290). The<br />
nitrogen contribution decreases the pH-values because of the<br />
acid reaction of ammonium nitrate.<br />
Analysing the soil calcium content, a proportional increase<br />
was established once with the growth of the waste dose.<br />
The increase of the calcium content took place suddenly<br />
for waste of type A and slowly for the waste B, remarking<br />
a suddenly growth only for the highest B dose. The highest<br />
waste doses for type A and B generate a calcium content of<br />
<strong>2.</strong>674 g kg –1 (A 4 ) and <strong>2.</strong>717 g kg –1 (B 4 ) respectively.<br />
A growth of the magnesium soil content was established<br />
once with the increase of the waste dose (A, B). Higher<br />
values were determined for waste type B. Alike as for the<br />
calcium content in soil, a nitrogen contribution decreases the<br />
magnesium content values for the alternatives with waste of<br />
type A.
Chem. Listy, 102, s265–s1311 (2008) Environmental Chemistry & Technology<br />
Table II<br />
Description of the experimental alternatives<br />
Experimental Waste nitrogen Mineral Suplimentation<br />
alternative dose, contrib., Ca, Mg, Fe, Cu, Mn, Zn,<br />
mg kg –1 mg kg –1 mg kg –1 mg kg –1 mg kg –1 µg kg –1 µg kg –1 µg kg –1<br />
A1<br />
R<br />
Rn<br />
179<br />
179<br />
-<br />
134<br />
50<br />
50<br />
13<br />
13<br />
0.33<br />
0.33<br />
0.34<br />
0.34<br />
24.3<br />
24.3<br />
0.47<br />
0.47<br />
A2<br />
R<br />
Rn<br />
357<br />
357<br />
-<br />
134<br />
100<br />
100<br />
25<br />
25<br />
0.66<br />
0.66<br />
0.68<br />
0.68<br />
48.7<br />
48.7<br />
0.93<br />
0.93<br />
A3<br />
R<br />
Rn<br />
714<br />
714<br />
-<br />
134<br />
200<br />
200<br />
50<br />
50<br />
1.32<br />
1.32<br />
1.36<br />
1.36<br />
97.4<br />
97.4<br />
1.86<br />
1.86<br />
A4<br />
R<br />
Rn<br />
1429<br />
1429<br />
-<br />
134<br />
400<br />
400<br />
100<br />
100<br />
<strong>2.</strong>64<br />
<strong>2.</strong>64<br />
<strong>2.</strong>72<br />
<strong>2.</strong>72<br />
194.7<br />
194.7<br />
3.72<br />
3.72<br />
B1<br />
R<br />
Rn<br />
263<br />
263<br />
-<br />
134<br />
50<br />
50<br />
37<br />
37<br />
0.23<br />
0.23<br />
13.40<br />
13.40<br />
13.4<br />
13.4<br />
13.20<br />
13.20<br />
B2<br />
R<br />
Rn<br />
526<br />
526<br />
-<br />
134<br />
100<br />
100<br />
74<br />
74<br />
0.46<br />
0.46<br />
26.80<br />
26.80<br />
26.8<br />
26.8<br />
26.40<br />
26.40<br />
B3<br />
R<br />
Rn<br />
1053<br />
1053<br />
-<br />
134<br />
200<br />
200<br />
147<br />
147<br />
0.93<br />
0.93<br />
53.60<br />
53.60<br />
53.6<br />
53.6<br />
5<strong>2.</strong>60<br />
5<strong>2.</strong>60<br />
B4<br />
R<br />
Rn<br />
2105<br />
2105<br />
-<br />
134<br />
400<br />
400<br />
295<br />
295<br />
1.85<br />
1.85<br />
107.30<br />
107.30<br />
107.3<br />
107.3<br />
105.20<br />
105.20<br />
Table III<br />
Impact of waste treatment on soil reaction and macroelements content<br />
Experimental<br />
alternative<br />
pHH2O pH unit<br />
Soil reaction<br />
pHKCl ,<br />
D pH unit D<br />
Ca content<br />
g kg<br />
Mg content<br />
–1 % g kg –1 %<br />
C0 R 6.939 - 5.763 - <strong>2.</strong>136 100.0 0.327 100.0<br />
A1<br />
R<br />
Rn<br />
6.887<br />
7.054<br />
–0.052<br />
0.115<br />
6.093<br />
5.934<br />
0.330<br />
0.171<br />
<strong>2.</strong>267<br />
<strong>2.</strong>222<br />
106.1<br />
104.0<br />
0.348<br />
0.343<br />
106.4<br />
104.9<br />
A2<br />
R<br />
Rn<br />
7.718<br />
7.229<br />
0.779<br />
0.290<br />
6.565<br />
6.174<br />
0.802<br />
0.411<br />
<strong>2.</strong>261<br />
<strong>2.</strong>168<br />
105.8<br />
101.5<br />
0.352<br />
0.337<br />
107.6<br />
103.1<br />
A3 R<br />
Rn<br />
8.178<br />
8.291<br />
1.239<br />
1.352<br />
6.468<br />
6.983<br />
0.705<br />
1.220<br />
<strong>2.</strong>440<br />
<strong>2.</strong>280<br />
114.2<br />
106.7<br />
0.400<br />
0.371<br />
12<strong>2.</strong>3<br />
113.5<br />
A4<br />
R<br />
Rn<br />
8.354<br />
8.435<br />
1.415<br />
1.496<br />
7.307<br />
7.257<br />
1.544<br />
1.494<br />
<strong>2.</strong>674<br />
<strong>2.</strong>607<br />
125.2<br />
12<strong>2.</strong>0<br />
0.464<br />
0.449<br />
14<strong>2.</strong>2<br />
137.3<br />
B1<br />
R<br />
Rn<br />
7.771<br />
7.386<br />
0.832<br />
0.447<br />
6.216<br />
5.908<br />
0.453<br />
0.145<br />
<strong>2.</strong>122<br />
<strong>2.</strong>151<br />
99.3<br />
100.7<br />
0.343<br />
0.330<br />
104.9<br />
100.9<br />
B2<br />
R<br />
Rn<br />
7.734<br />
7.677<br />
0.795<br />
0.738<br />
6.556<br />
6.536<br />
0.793<br />
0.773<br />
<strong>2.</strong>164<br />
<strong>2.</strong>270<br />
101.3<br />
106.3<br />
0.361<br />
0.380<br />
110.4<br />
116.2<br />
B3<br />
R<br />
Rn<br />
8.016<br />
8.215<br />
1.077<br />
1.276<br />
6.881<br />
6.944<br />
1.118<br />
1.181<br />
<strong>2.</strong>254<br />
<strong>2.</strong>390<br />
105.5<br />
111.9<br />
0.412<br />
0.427<br />
126.0<br />
130.6<br />
B4<br />
R<br />
Rn<br />
8.290<br />
8.222<br />
1.351<br />
1.281<br />
7.082<br />
7.360<br />
1.319<br />
1.597<br />
<strong>2.</strong>717<br />
<strong>2.</strong>547<br />
127.2<br />
119.2<br />
0.566<br />
0.480<br />
173.1<br />
146.8<br />
s483
Chem. Listy, 102, s265–s1311 (2008) Environmental Chemistry & Technology<br />
Table IV<br />
Influence of waste type and doses on the soil trace elements content<br />
Experimental alternative<br />
Fe content<br />
µg kg<br />
Mn content Zn content Cu content<br />
–1 % µg kg –1 % g kg –1 % g kg –1 %<br />
C0 R 234.7 100.0 87.84 100 11.400 100.0 3.402 100.0<br />
A1<br />
R<br />
Rn<br />
249.6<br />
251.4<br />
106.3<br />
107.1<br />
84.20<br />
84.30<br />
95.9<br />
96.0<br />
33.100<br />
25.080<br />
290.4<br />
220.0<br />
3.491<br />
3.639<br />
10<strong>2.</strong>6<br />
107.0<br />
A2<br />
R<br />
Rn<br />
244.6<br />
245.1<br />
104.2<br />
104.4<br />
80.06<br />
95.00<br />
91.1<br />
108.2<br />
31.200<br />
11.900<br />
273.7<br />
104.4<br />
3.669<br />
3.669<br />
107.8<br />
107.8<br />
A3<br />
R<br />
Rn<br />
260.3<br />
253.6<br />
110.9<br />
108.1<br />
86.97<br />
85.44<br />
99.0<br />
97.3<br />
13.960<br />
11.910<br />
12<strong>2.</strong>5<br />
104.5<br />
3.462<br />
3.609<br />
101.8<br />
106.1<br />
A4<br />
R<br />
Rn<br />
257.0<br />
264.5<br />
109.5<br />
11<strong>2.</strong>7<br />
73.42<br />
88.00<br />
83.6<br />
100.1<br />
1<strong>2.</strong>920<br />
6.721<br />
113.3<br />
59.0<br />
3.669<br />
3.821<br />
107.8<br />
11<strong>2.</strong>3<br />
B1<br />
R<br />
Rn<br />
23<strong>2.</strong>5<br />
251.1<br />
99.1<br />
107.0<br />
75.56<br />
95.77<br />
86.0<br />
109.0<br />
4.418<br />
4.407<br />
38.8<br />
38.7<br />
3.462<br />
3.609<br />
101.8<br />
106.1<br />
B2<br />
R<br />
Rn<br />
24<strong>2.</strong>5<br />
236.6<br />
103.3<br />
100.8<br />
70.53<br />
81.62<br />
80.3<br />
9<strong>2.</strong>9<br />
4.832<br />
4.821<br />
4<strong>2.</strong>3<br />
4<strong>2.</strong>3<br />
3.358<br />
3.462<br />
98.7<br />
101.8<br />
R 235.0 100.1 94.39 107.5 4.567 40.1 3.787 111.3<br />
B3<br />
B4<br />
Rn 237.8 101.3 73.76 84.0 19.300 169.3 3.506 103.1<br />
R 253.8 108.1 9<strong>2.</strong>62 105.4 4.425 38.8 3.728 109.6<br />
Rn 237.8 101.3 76.49 87.1 10.210 89.6 3.402 100.0<br />
Table V<br />
Influence of waste and nitrogen contribution on some vegetation characteristics of green oat<br />
Experimental alternative<br />
Risen plants<br />
number %<br />
Size of green plants<br />
cm %<br />
Fresh weight<br />
mg piece –1 %<br />
C0 A1<br />
R<br />
R<br />
Rn<br />
21<br />
22<br />
23<br />
70<br />
73<br />
77<br />
51<br />
54<br />
73<br />
100<br />
106<br />
143<br />
362<br />
327<br />
591<br />
100<br />
90<br />
163<br />
A2<br />
R<br />
Rn<br />
27<br />
22<br />
90<br />
73<br />
53<br />
72<br />
104<br />
141<br />
352<br />
623<br />
97<br />
172<br />
A3<br />
R<br />
Rn<br />
28<br />
22<br />
93<br />
73<br />
56<br />
75<br />
109<br />
147<br />
332<br />
650<br />
92<br />
180<br />
A4<br />
R<br />
Rn<br />
23<br />
19<br />
77<br />
63<br />
59<br />
77<br />
116<br />
151<br />
387<br />
737<br />
107<br />
204<br />
B1<br />
R<br />
Rn<br />
22<br />
27<br />
73<br />
90<br />
53<br />
70<br />
104<br />
137<br />
300<br />
537<br />
83<br />
148<br />
B2<br />
R<br />
Rn<br />
24<br />
22<br />
80<br />
73<br />
60<br />
78<br />
118<br />
153<br />
350<br />
600<br />
97<br />
166<br />
R 25 83 52 102 404 112<br />
B3<br />
B4<br />
Rn 28 93 70 137 464 128<br />
R 30 100 53 104 370 102<br />
Rn 22 73 58 114 582 161<br />
s484
Chem. Listy, 102, s265–s1311 (2008) Environmental Chemistry & Technology<br />
Table VI<br />
Impact of waste treatment on some composition features of green oat plants<br />
Experimental alternative<br />
Dry weight<br />
mg piece<br />
Dry matter Protein content<br />
–1 % D.M. % P % %<br />
C0 A1<br />
R<br />
R<br />
Rn<br />
162<br />
159<br />
248<br />
100<br />
98<br />
153<br />
44.8<br />
48.1<br />
41.9<br />
10.08<br />
5.42<br />
1<strong>2.</strong>56<br />
100<br />
53.8<br />
124.6<br />
A2<br />
R<br />
Rn<br />
167<br />
255<br />
103<br />
157<br />
46.9<br />
41.0<br />
4.75<br />
1<strong>2.</strong>65<br />
47.1<br />
125.5<br />
A3<br />
R<br />
Rn<br />
161<br />
255<br />
99<br />
157<br />
47.9<br />
39.2<br />
5.01<br />
13.68<br />
49.7<br />
135.7<br />
A4<br />
R<br />
Rn<br />
183<br />
300<br />
113<br />
185<br />
47.3<br />
41.0<br />
5.03<br />
1<strong>2.</strong>78<br />
49.9<br />
126.8<br />
B1<br />
R<br />
Rn<br />
155<br />
233<br />
96<br />
144<br />
51.3<br />
43.0<br />
5.41<br />
1<strong>2.</strong>31<br />
53.6<br />
12<strong>2.</strong>1<br />
B2<br />
R<br />
Rn<br />
158<br />
273<br />
98<br />
169<br />
45.6<br />
46.0<br />
4.98<br />
11.89<br />
49.4<br />
118.0<br />
R 184 114 46.5 4.63 45.9<br />
B3<br />
B4<br />
Rn 200 123 43.4 1<strong>2.</strong>59 124.9<br />
R 150 93 40.8 5.83 57.8<br />
Rn 250 154 4<strong>2.</strong>9 1<strong>2.</strong>99 128.9<br />
Because of their trace elements content, the soil treatment<br />
with waste of type A and B generates in soil a different<br />
trace element level in comparison to the control alternative,<br />
presented in Table IV.<br />
Analysing the iron content of the experimental alternatives,<br />
it was established that unimportant increases of the iron<br />
content took place once with the growth of both waste type<br />
doses. The highest iron concentrations were found in alternative<br />
A 4 and B 4 representing the highest waste doses and<br />
having an increase of 1<strong>2.</strong>7 % (A) and 8.1 % (B).<br />
The manganese content in soil has lower values for all<br />
the experimental alternatives than that of the control alternative.<br />
An exception is represented by A 2 registering an increase<br />
of 8.2 % and B 1 of 9.0 %, both with nitrogen contribution.<br />
The zinc content in soil decreases once with the increase<br />
of the waste dose. The highest value was registered for A 1<br />
and the increase was of 190.4 %. By addition of waste B, the<br />
zinc content in soil decreases having lower values than the<br />
control alternative.<br />
The copper content in soil remains almost constant after<br />
waste addition. The highest increase was registered for A 4<br />
representing 1<strong>2.</strong>3 %. Treating soil with waste B, the highest<br />
registered increase was 11.3 % for B 3 .<br />
The effects of soil treatment with waste A and B show<br />
an important influence on the development and nutrition of<br />
green oat plants. The results are presented in Table V and<br />
Table VI.<br />
The enhance of the waste A amounts in soil treatment<br />
had a beneficial effect on the grain germination praised by<br />
a higher number of risen plants. Adding nitrogen to soil, the<br />
number of risen plants remained low. The effects are similar<br />
for soil treatment with waste B, except for B 1 and B 3 ,<br />
where the nitrogen contribution increases the number of risen<br />
s485<br />
plants. The highest number of risen plants was established for<br />
B 4 , 30 representing 100 % of the sown oat grains.<br />
Green oat plants grew taller once with the increase of the<br />
waste dose in both cases (waste A and waste B). Adding nitrogen,<br />
an obvious increase of the plant size was established.<br />
The tallest plants were find for alternatives A 4 (highest waste<br />
A dose + nitrogen contribution), namely 77 cm and 78 cm for<br />
B 2 (second waste B dose + nitrogen contribution).<br />
At harvest time, green oat plants for all alternatives were<br />
thinner, having a reduced fresh weight in comparison with the<br />
control alternative for those without nitrogen contribution.<br />
The nitrogen supplement makes the plants more vigorous<br />
having a higher fresh weight and dry weight for all the experimental<br />
alternatives. The fresh weight increase was more<br />
evident for soil treatment with waste A; for the highest waste<br />
dose (A 4 ), the increase was of 104 % in comparison with the<br />
control alternative. Similar to the fresh weight increase, took<br />
place the dry weight increase. The most evident results were<br />
established for the alternatives treated with waste A. The<br />
increase of the dry weight was the highest of 85 % for the<br />
alternative A 4 .<br />
The altering of dry matter was increasing for the alternatives<br />
without nitrogen treatment and decreasing for those<br />
with nitrogen treatment. The highest dry matter value was of<br />
51.3 % for B 1 (lowest waste B dose) and the lowest value was<br />
39.2 % for A 3 (waste A + nitrogen contribution).<br />
The protein content of green oat plants shows, at harvest<br />
time, two different aspects comparative with the control alternative.<br />
For the alternatives in which no nitrogen was added,<br />
the protein content represents half of the control alternative<br />
content. Adding nitrogen, the protein content has increased<br />
and became double given to the alternatives without nitrogen<br />
contribution. The highest protein level was found for
Chem. Listy, 102, s265–s1311 (2008) Environmental Chemistry & Technology<br />
A 3 , namely 13.68 % and 1<strong>2.</strong>99 % for B 4 . The increase of the<br />
waste dose and nitrogen contribution generates an enhance of<br />
the plant protein content.<br />
Conclusions<br />
Considering the obtained results, the two experimented<br />
industrial waste can be used in certain doses as soil<br />
amendment for low fertile acid soil, with or without nitrogen<br />
addition.<br />
Treating soil with different doses of waste, a buffering<br />
effect was established, which rises the pH values from low<br />
acid to low alkaline.<br />
The presence of magnesium and calcium in the waste<br />
composition increases the soil content, proportional with the<br />
growth of the waste dose.<br />
The enhance of the trace elements content in soil is<br />
representative for iron, copper and zinc (waste A).<br />
The experimental waste doses (waste A, waste B) had a<br />
beneficial effect on grain germination improving the number<br />
of risen oat plants by 23 % (waste A) and 30 % (waste B).<br />
At harvest time, the size of green oat plants was taller by<br />
8 cm (waste A) and 9 cm (waste B) comparative to the control<br />
alternative with untreated soil. nitrogen additions increased<br />
their size by 51 % (waste A) and by 53 % (waste B).<br />
The fresh weights of the plants show a decrease proportional<br />
with the increase of the waste doses (A, B) only for the<br />
alternatives without nitrogen addition.<br />
The dry matter values are increasing once with enhance<br />
of dose for both waste in all alternatives without nitrogen<br />
contribution. The addition of nitrogen decreases the dry matter<br />
value at harvest time for all the alternatives comparative<br />
to the control. The decrease of dry matter is more severe for<br />
the alternatives treated with waste A.<br />
Adding nitrogen, the protein content has increased and<br />
became double given to the alternatives without nitrogen<br />
contribution.<br />
s486<br />
This work has been partial supported by a CNCSIS<br />
Grant-Type A of Romania.<br />
REFEREnCES<br />
1. Kohn D., Taubert L., Policec S.: Filtrieren und Separieren<br />
F&S 12, 161 (1998).<br />
<strong>2.</strong> Taubert L., Policec S., Kohn D.: Proceedings of International<br />
Symposium “Regional Multidisciplinary<br />
Research” (Mirton, ed.), p.521 Timisoara, Romania<br />
1998.<br />
3. Taubert L.: Proceedings of the 12th Romanian International<br />
Conference on Chemistry and Chemical Engineering:<br />
Inorganic Chemical Technology (Printech, ed.), p.<br />
201Bucharest, Romania 2001<br />
4. Taubert L.: Proceedings of 9th Symposium on Analytical<br />
and Environmental Problems (SZAB, ed.), p. 41,<br />
Szeged, Hungary 200<strong>2.</strong>.<br />
5. Radulescu H, Kiss A. S., Taubert L., Princz E.: Proceedings<br />
of 12th Symposium on Analytical and Environmental<br />
Problems (SZAB, ed.), p. 467, Szeged, Hungary<br />
2005.<br />
6. Taubert L., Kiss A. S., Radulescu H., Princz E.: Proceedings<br />
of 13th Symposium on Analytical and Environmental<br />
Problems (SZAB, ed.), p.261, Szeged, Hungary<br />
2006.<br />
7. Taubert L., Princz E., Radulescu H., Kiss A. S., Stefanovits-Bányai<br />
é.: 5th International Conference of the Chemical<br />
Societies of the South-East European Countries:<br />
Chemical Sciences at the European Crossroads, Ohrid-<br />
Macedonia, 10–14 Sept. 2006, p. 203, Book of Abstracts<br />
(Grafotissok, ed.),
Chem. Listy, 102, s265–s1311 (2008) Environmental Chemistry & Technology<br />
P73 POSSIbILITy OF ObjECTIVE CONTROL OF<br />
NATuRAL GAS ODORISATION<br />
DAnIEL TEnKRáT, OnDřEJ PROKEŠ and JAn<br />
BERánEK<br />
Institute of Chemical Technology Prague, Department of<br />
Gas, Coke and Air Protection, Technická 5, 166 28 Prague,<br />
Daniel.Tenkrat@vscht.cz<br />
Introduction<br />
natural gas is one of the most important energy carriers<br />
in Europe (in the Czech Republic as well). Total consumption<br />
of natural gas (nG) in the Czech Republic in 2006 was<br />
9,269 × 10 6 m 3 . Within the distribution to end users and also<br />
during natural gas utilization the most important requirement<br />
is the safety of customers.<br />
natural gas odorisation means operations involving the<br />
addition of odorant to gas to ensure characteristic odour of<br />
nG so that a person can judge the odour to be distinctive and<br />
unpleasant so that the presence of gas in air (in concentrations<br />
below lower explosive limit – LEL) is readily detectable.<br />
By the odorant addition any physical or chemical property<br />
(except the smell) of nG cannot be changed. As odorants<br />
organic sulfur compounds are often use (mercaptans and sulfides).<br />
nowadays a new type of sulfur free odorant is being<br />
introduced to the nG market.<br />
The nG odorisation in fact does not have any technological<br />
purpose; its main sense consist in evoking psychological<br />
effect, because the odour of nG must be alarming and<br />
incommutable with any common smell.<br />
In the Czech Republic the odorisation process is specified<br />
by the technical regulation TPG 918 01. This regulation<br />
lists as odorants just organic sulfur compounds. However, it<br />
does not mean that sulfur-free odorants can not be used.<br />
Experimental<br />
The main task of natural gas odorisation is to ensure<br />
such operating condition when natural gas in every part of<br />
the distribution grid fulfils the requirement of a “warning<br />
odour level”. In case of a gas leakage the warning odour level<br />
(see Table I.) must be reached until the 20 % of lower explosive<br />
limit (LEL; Ld ) is reached. Odorisation level can be<br />
verified by:<br />
• The odorisation level control – which can be done by<br />
olfactometry in selected points on distribution grid or by<br />
means of questionnaires at selected representative sample<br />
of customers. In both cases indirect indicators are<br />
taken into account so that both forms are considered to<br />
be subjective methods.<br />
• Odorant concentration measurement – in natural gas can<br />
be estimated continuously or discontinuously in selected<br />
points on grid. In this case particular concentration of<br />
odorant in nG is measured. This is so called objective<br />
method.<br />
s487<br />
The aim of this work was a critical comparison of the<br />
subjective odorisation control (according to TPG 91801)<br />
with the objective odorisation control. It means direct measurement<br />
of an odorant concentration in nG using modern analytical<br />
techniques and comparison with results from olfactometry<br />
measurement.<br />
A n a l y t i c a l E q u i p m e n t<br />
The accurate odorant concentration in nG was estimated<br />
by gas chromatograph HP 6890 equipped with mass<br />
detector MSD 7393 (Hewlett-Packard). For the analysis Supelco<br />
24158 SPB-1 Sulfur (30 m × 320 μm × 4 μm) column<br />
was used. Starting temperature was 30 °C with heating rate<br />
15 °C min –1 . The analysis terminated at 110 °C.<br />
The odorisation level control was estimated by dynamic<br />
olfactometry using olfactometer Ecoma TO 8-8. The procedure<br />
is based on step-by-step evaluation of olfactory perception<br />
of at least four (max. eight) observers. A sample of odorised<br />
natural gas is diluted by synthetic air in ratios between<br />
1 : 131,072 and 1 : 8 (nG:air). As soon as the observer indicates<br />
olfactory perception to be odour treshold (or warning<br />
odour level) the actual dilution of the sample is recorded.<br />
T e r m i n o l o g y<br />
Minimal odorant concentration represents the odorant<br />
content in nG [mg m –3 ] which fulfill the requirement for creating<br />
warning odour level – grade 3 (see Table I).<br />
Estimation of the minimal odorant concentration is<br />
determined by:<br />
K value [mg m –3 •<br />
] which represents the minimal concentration<br />
of an odorant in natural gas-air mixture which<br />
reliably ensures the warning odour level,<br />
• lower explosive limit (Ld ) –expressed by % vol. of natural<br />
gas in air,<br />
•<br />
and from the requirement to evoke the warning odour<br />
level before one fifth (i.e. 20 %) of LEL of natural gas<br />
in air is reached.<br />
Minimal odorant concentration c n can estimated according<br />
to the following formula:<br />
c<br />
n<br />
100 ⋅ K<br />
= [mg m<br />
0.<br />
2 ⋅ L<br />
–3 ]. (1)<br />
d<br />
Typical K values of commonly used odorants are<br />
0.08 for tetrahydrothiophene, 0.03 for mercaptans and<br />
0.07 mg m –3 for the GASODOR S-free odorant.<br />
Odour intensity is the extent of odour perception which<br />
is by the odour evoked. Commonly the odour intensity is evaluated<br />
as an odorisation level. List of odorisation levels can<br />
be found in the Table I.<br />
Results<br />
Two samples of a real odorised “Russian” natural gas<br />
sampled directly from natural gas pipeline into tedlar sam-
Chem. Listy, 102, s265–s1311 (2008) Environmental Chemistry & Technology<br />
ple bags were used for all experiments. Both samples were<br />
analyzed by GC-MS and an overview of obtained odorant<br />
concentrations is given in Table II.<br />
Table I<br />
Odorisation Levels according to TPG 918 01(ref. 2 )<br />
Odorisation<br />
level Olfactory perception Comment<br />
(grade)<br />
0 Odour not detected –<br />
1 Very low intensity Odour threshold<br />
2 Weak odour –<br />
3 Mean odour Warning odour level<br />
4 Strong odour –<br />
5 Very strong odour –<br />
6 Extremely strong Upper limit of intensity<br />
odour<br />
Table II<br />
Samples overview<br />
DMS TBM Total<br />
[mg m –3 ]<br />
Sample 1 <strong>2.</strong>71 3.31 6.02<br />
Sample 2 3.32 4.35 7.67<br />
For the estimation of odorisation level shortened examination<br />
described in technical norm ČSn 38 5550 1 was<br />
applied. In this test the odour threshold (grade 1) is estimated<br />
as a first point and the warning odour level (grade 3)<br />
as a second point. From obtained data (mean value from all<br />
observers mean values) the dependence of odorisation level<br />
on odorant concentration in natural gas was created.<br />
The measurement was carried out by two different<br />
groups of observers.<br />
The first one (GROUP 1), consisted of professional<br />
observers who satisfied the conditions listed in ČSn En<br />
13725 3 for performing the olfactometry measurement.<br />
The second one (GROUP 2), consisted of observers who<br />
are performing the subjective odorisation control in gas distribution<br />
companies.<br />
Obtained data are given in Figs. 1. and <strong>2.</strong> Each of them<br />
represents the dependence of odorisation level on the odorant<br />
concentration in natural gas – air mixture.<br />
Conclusions<br />
Performed measurement shows considerable subjectivity<br />
of an olfactometry measurement of the odorisation<br />
level. While observers from Group 1 respond accurately with<br />
minimal deviations, observers from Group 2 respond in wide<br />
range of dilution with considerably scattered results. This<br />
result is connected with the sensitivity threshold across population<br />
and to some extent with professional deformation of<br />
s488<br />
Fig. 1. Dependence of odorisation level on the odorant concentration<br />
for Sample 1<br />
Fig. <strong>2.</strong> Dependence of odorisation level on the odorant concentration<br />
for Sample 2<br />
employees carrying out the on-site olfactometry odorisation<br />
control of nG at selected points on natural gas grid.<br />
From the data obtained from Group 1, the K value for<br />
the odorant used in samples can be estimated. This value<br />
is considerably lower than the K value, which is currently<br />
used in the Czech Republic (the obtained K value lies under<br />
0.003 mg m –3 comparing to published 0.07 mg m –3 in the<br />
national technical regulation 2 ).<br />
As a main result of accomplished experiments it can be<br />
strictly recommended to prefer objective method for periodic<br />
odorisation control. nowadays gas distribution companies<br />
slowly change the way of odorisation control considering the<br />
objective control as the guarantee of safe gas distribution and<br />
utilization up to end customers.<br />
This work has been partly supported by MSM 604 613<br />
73 04.<br />
REFEREnCES<br />
1. ČSn 38 5550; Odorizace topných plynů, 1986.<br />
<strong>2.</strong> TPG 918 01; Odorizace zemního plynu, 200<strong>2.</strong><br />
3. ČSn En 13 725; Kvalita ovzduší. Stanovení koncentrace<br />
pachových. látek dynamickou olfaktometrií, 2003.
Chem. Listy, 102, s265–s1311 (2008) Environmental Chemistry & Technology<br />
P74 CONTAMINATION OF SOIL AND<br />
ALIMENTARy whEAT IN ZEMPLíNSKA<br />
POLLuTED AREA<br />
Ján TOMáŠ, JURAJ ČéRY, LADISLAV LAHUČKý and<br />
JAnETTE MUSILOVá<br />
Departmentt of Chemistry, Faculty of Biotechnology and<br />
Food Sciences, Slovak University of Agriculture, Tr. A. Hlinku<br />
2, 949 01 Nitra, Slovak Republic,<br />
jan.tomas@uniag.sk<br />
Introduction<br />
Soil is a determining component of environment by<br />
its range and function that belongs to the basic technologic<br />
instruments and it is not an only revealing resource. Agrocosystems<br />
and mainly soil of these actively react on entries<br />
of polluted substances, which cause its biological degradation.<br />
Inorganic contaminants belong to main factors of biological<br />
degradation, heavy metals and metalloids are cummulated<br />
in soil environment. Our soils situated in key area<br />
(Strednozemplínska area) are exposed to an emissions effect<br />
from many sources for a long time period. It is proved mainly<br />
by acidification of soil horizons, exceeded content of heavy<br />
metals in soil and consequently in above-ground mass in this<br />
contaminated were found.<br />
Experimental<br />
We have collected the soil samples from exactly given<br />
places by the GPS system. Then we have processed information<br />
in the OziExplorer program, where the gained points<br />
were also evaluated. We have gained the soil samples from<br />
two depths 0–0.1 m (A horizon) 0.2–0.35 (B horizon). The<br />
soil samples have been taken by geological probe GeoSampler.<br />
The contents of the risky elements has been elevated on<br />
areas with active agricultural activity in Humenné location<br />
where we could assume that the observed area is contaminated<br />
by the reason of widespread industrial activity in this<br />
region. The contents of risky elements were determinated<br />
in aqua regia as a pseudototal content in 2M HnO 3 as the<br />
potential mobilized forms.<br />
Results<br />
The total content of the risky elements in soils includes<br />
all forms of the occurrence of exact element in soil. In our soil<br />
samples we have determined the contents of these chosen risky<br />
elements Cd, Pb, ni, Zn, Cu, Cr, Co. We have evaluated the<br />
measured results by law no. 220/2004 about protection and<br />
exploitation of agricultural soil and resolution no. 531/1994.<br />
The evaluated area has exceeded the limit values in aqua regia<br />
solution in A horizon in the case of four following risky elements<br />
Cd, ni, Zn and Co. Content of Cd was increased in all<br />
gained points in the observed horizon. The interval of values<br />
has been in range of 1.10 to 1.90 mg Cd kg –1 soil. The highest<br />
value presented was exceeding 171 % to the limit value. The<br />
content of ni moved in wide interval of 40.4–70.4 mg ni kg –1<br />
of soil. At the highest content the limit value has exceeded by<br />
s489<br />
40.8 %. The limit value of Zn enhanced in one gained point<br />
where the value presented 153.2 mg kg –1 that means exceeding<br />
at <strong>2.</strong>1 %. The content of Co moved in wide interval from<br />
19.6–29.6 mg kg –1 . The limit value for Co exceeded in all<br />
gained points. Limit value was at the highest concentration<br />
enhanced by 97.3 %.<br />
In B horizon in digestion of aqua regia the limit values<br />
of all metals also exceeded. The content of Cd was increased<br />
in the observed horizon by all gained points. The interval of<br />
the value moved from 1.30 to <strong>2.</strong>0 mg Cd kg –1 of soil. The content<br />
of Pb moved in wider range 39.6–114.8 mg Pb kg –1<br />
of the soil and it was measured in two gained points. The<br />
highest content means increase at 64 %. The content of ni<br />
exceeded in six gained points. The highest content presented<br />
the value 5<strong>2.</strong>8 %. The increased content of Cu and Cr at the<br />
present area has a detailed character; the highest value of<br />
Cu exceeded the limit value at 1<strong>2.</strong>6 %. The highest measured<br />
value of Cr, 86.8 mg kg –1 soil means increasing by 24 %.<br />
Measured values of Co we have found were in a range from<br />
19.2–40.0 mg kg –1 . The limit value for Co was exceeded in<br />
all gained points. The content of heavy metals in 2M HnO 3<br />
solution represented the potential mobilized content which<br />
includes different fraction of elements from the view of their<br />
solubility. The content of Cd in A horizon in Humenné area<br />
has moved in the range of interval 1.9–3.2 mg kg –1 . The value<br />
3.2 mg kg –1 presented 10.6 fold increasing towards the reference<br />
value. The contamination by Cd has a broad character<br />
and affects all the gained points. The measured value of Pb was<br />
in the range 13.1–185.0 mg kg –1 . Other values of the heavy<br />
metals which were measured in A horizon doesn’t express the<br />
enhanced potential mobility and their contents were under the<br />
limit value. The content of Cd in B horizon was in the range<br />
1.9–3.5 mg kg –1 . Its highest value is increased at 11.6 fold<br />
to the reference value. The content of Pb in potential available<br />
form was in the range 100.4–253.6 mg kg –1 in B horizon.<br />
Risky elements have ability to get from the foodstuffs<br />
from soil, water and air as contaminants, some of them could<br />
be natural compounds of foodstuffs. By evaluation of grinding<br />
fractions from the standpoint of heavy metals we have<br />
found out that the limit value of Co has been exceeding. The<br />
value of Co was in the range 0.047–0.287 mg kg –1 the area of<br />
Humenné. The highest acceptable amounts exceeded in the I.<br />
and IV. milling fractions. The limit value has been enhanced<br />
at 218.5 %. The content of Pb was <strong>2.</strong>5 fold higher than the<br />
limit value in the analyzed wheat grain. The cultivated winter<br />
wheat is not suitable for food processing from the point of<br />
Foodstuff Codex.<br />
Conclusions<br />
The contamination in the monitored area has an anthropogenic<br />
character which is caused by the industrial emissions<br />
produced by chemical factories situated in the surroundings<br />
Strážske and Humenné. With the observation of pseudototal<br />
(total) and potentially mobile contents of the risky and trace<br />
elements in area of Humenné, we can state that the contents<br />
of risky elements in A horizon exceeded in the case of Cd,
Chem. Listy, 102, s265–s1311 (2008) Environmental Chemistry & Technology<br />
ni, Co and Zn. The pseudototal contents of the determined<br />
elements show the local enhancement of all heavy metals in<br />
B horizon. The potentially mobilized forms of the risky elements<br />
were assessed in 2M HnO 3 these limit values exceeded<br />
in horizons A and B in the case of Cd and Pb. The highest<br />
acceptable amounts were increased in the I. and IV. milling<br />
fractions.<br />
This work has been supported by project VEGA No.<br />
1/0339/08.<br />
s490<br />
REFEREnCES<br />
1. Linkes V.: Monitoring of soils of the Slovak Republic.<br />
The Research Institute of Soil Fertility, Bratislava,<br />
1997.<br />
<strong>2.</strong> Vollmannová A., Tóth T., Lazor P., Stanovic R., Trebichalský<br />
P.: Input of risk metals into the agricultural<br />
crops cultivated near of old environmental burdens. 12th<br />
Inter. Sci. conf. nitra, 2008.<br />
3. Toth T., Lazor P., Melichacova Arvay J., Harangozo L.:<br />
Risk of application of sludge on soil hygiene. Science of<br />
younger researchers. MZLU, Brno, 2006.
Chem. Listy, 102, s265–s1311 (2008) Environmental Chemistry & Technology<br />
P75 DETERMINATION OF ChANGES IN SOIL<br />
ORGANIC MATTER CONTENT ThROuGh<br />
CARbON AND NITROGEN LAbILE<br />
FRACTIONS<br />
e. TOBIAŠOVá, T. TóTH, and V. ŠIMAnSKý<br />
Slovak Agricultural University in Nitra, Tr. A. Hlinku 2, 949<br />
76 Nitra, Slovak Republic,<br />
Erika.Tobiasova@uniag.sk<br />
Introduction<br />
The quantity and quality of soil organic matter (SOM)<br />
are the most important characteristics, which influence the<br />
sustainable development. Much more sensitive indicators of<br />
dynamic changes of C and n are their fractions, labile carbon<br />
or potentially mineralizable nitrogen 1 . Techniques for<br />
isolating individual carbon fractions are different. Usually<br />
there is acid hydrolysis by H 2 SO 4 with different concentrations<br />
2 or HCl 3 . Other developed method was a fractionating<br />
method of SOM and fractions or substrates of SOM based on<br />
the susceptibility to oxidation by permanganate 4 . Modification<br />
and standardization of KMnO 4 oxidation technique 5 has<br />
increased the precision and simplified the technique, using<br />
only one concentration of KMnO 4, thereby dividing soil carbon<br />
into labile (C L ) and non-labile (C nL ) carbon. Research<br />
focuses on possibilities of SOM changes evaluation through<br />
the C T – total organic carbon, C L – labile carbon, C nL – nonlabile<br />
carbon, L C – lability of soil organic carbon, LI C – lability<br />
index of carbon, CPI – carbon pool index, CMI – carbon<br />
management index, n T – total nitrogen, n L – potentially mine-<br />
Table I<br />
Mean values of parameters of SOM quality<br />
Farming system Plot<br />
ESa ISb 5 7<br />
LC 0.216 ac 0.229 a 0.224 a 0.222 a<br />
LIC 1.045 a 1.170 a 1.100 a 1.117 a<br />
CPI 1.076 a 1.182 a 1.162 a 1.095 a<br />
CMI 1.126 a 1.380 b 1.274 a 1.232 a<br />
Ln 0.109 a 0.078 a 0.103 a 0.085 a<br />
LIn <strong>2.</strong>304 a 1.167 a <strong>2.</strong>079 a 1.392 a<br />
nPI 1.090 a 0.997 a 1.132 a 0.955 a<br />
nMI <strong>2.</strong>542 a 1.123 a <strong>2.</strong>359 a 1.306 a<br />
[g kg –1 ]<br />
CT 1<strong>2.</strong>885 bc 11.422 a 1<strong>2.</strong>205 a 1<strong>2.</strong>102 a<br />
CL <strong>2.</strong>289 a <strong>2.</strong>122 a <strong>2.</strong>220 a <strong>2.</strong>191 a<br />
CnL 8.963 a 9.299 a 8.352 a 9.910 a<br />
[mg kg –1 ]<br />
nT 1338.2 a 1168.3 a 1341.7 a 1164.8 a<br />
nL 129.2 b 100.2 a 12<strong>2.</strong>5 a 106.8 a<br />
nnL 1209.0 a 1068.2 a 1219.2 a 1058.0 a<br />
a Ecological farming system,<br />
b Integrated farming system,<br />
c Values followed by the same letter within each column are<br />
not significantly different at P < 0.05<br />
s491<br />
ralizable nitrogen, n nL –non-labile nitrogen, L n – lability of<br />
soil nitrogen, LI n – lability index of nitrogen, nPI – nitrogen<br />
pool index, nMI – nitrogen management index and selection<br />
of suitable parameters for sensitive reaction on SOM changes<br />
also in agro-ecosystems.<br />
Experimental<br />
The studied territory of Malanta (lat. 18°08’n and long.<br />
18°08’E) is located in the lower part of Selenec creek basin<br />
and its tributaries which belong to the central part of nitra<br />
river basin. The geological substratum is created of few<br />
existing rocks with high quantities of fine materials. The soil<br />
is Orthic Luvisol. The average annual temperature of air was<br />
9.6 °C and mean annual precipitation was 633 mm. The project<br />
with ecological (ES) and integrated (IS) farming systems<br />
was established in 1990. We collected the soil samples in the<br />
period 2005–2007. We determined C T 6 , CL 4 , nT 7 and nL 8 in<br />
soil samples. We calculated C nL , L C , LI C , CPI and CMI 5 . We<br />
used this procedure for evaluating changes of soil nitrogen,<br />
as well. Data were analyzed using analysis of variance and<br />
differences were determined using the Duncan test. We used<br />
correlation to determine the relationships between studied<br />
parameters.<br />
Results<br />
Statistically significant higher average contents of C L<br />
were determined in ES than IS. Higher content of C L was<br />
in fertilized variants than in variants without fertilization<br />
(Table I).<br />
In our study contents of phosphorus (r = 0.599, P < 0.01)<br />
and potassium (r = 0.488, P < 0.05) had statistically significant<br />
influence on C L . L C was higher in fertilized variants (0.223)<br />
than in variants without fertilization (0.202). L C was in negative<br />
correlation with pH KCl (r = –0.452, P < 0.05). Values of<br />
LI C were in correlation with pH KCl (r = –0.471, P < 0.05). On<br />
average, statistically significant higher average CMI value<br />
was in IS (1.38) than in ES (1.13), which showed on higher<br />
changes in organic carbon sources in ES. CMI values showed<br />
whether dominant processes are carbon losses or processes of<br />
new organic substances production. Statistically significant<br />
differences of n L contents were also found between farming<br />
systems. On average higher n L content was in ES 129 mg kg –<br />
1 than in IS 100 mg kg– 1 . Values of nL were in negative correlation<br />
with base exchangeable cations (r = –0.416, P < 0.05)<br />
and degree of saturation (r = –0.404, P < 0.05). Content of<br />
n nL was in positive correlation with content of phosphorus<br />
(r = 0.564, P < 0.01) and potassium (r = 0.664, P < 0.01).<br />
Conclusions<br />
The results focused on the necessity of application,<br />
predominantly of carbon and nitrogen fractions on the evaluation<br />
of quality changes and losses of SOM. According to<br />
statistical assesment suitable parameters for sensitive reaction<br />
on SOM changes in agro-ecosystems seems to be mainly<br />
parameters C L , L C , CMI and n L .
Chem. Listy, 102, s265–s1311 (2008) Environmental Chemistry & Technology<br />
Project supported by the Scientific Grant Agency of Education<br />
Ministry of Slovak Republic and Slovak Academy of<br />
Sciences (No. 1/0092/08 and No. 1/0457/08).<br />
REFEREnCES<br />
1. Schjonning P., Munkholm L., Elmholt S., Olesen J. E.:<br />
Agric. Ecosyst. Environ. 122, 157 (2007).<br />
<strong>2.</strong> Rovira P., Vallejo V. R.: Geoderma 107, 109 (2002).<br />
3. Silveira M. L., Comerford n. B., Reddy K. R., Cooper<br />
W. T., El-Rifai H.: Geoderma 144, 405 (2008).<br />
s492<br />
4. Loginov W., Wisniewski W., Gonet S. S., Ciescinska B.:<br />
Pol. J. Soil Sci. 20, 47 (1987).<br />
5. Blair G. J., Lefroy R. D. B., Lisle L.: Austr. J. Agric.<br />
Res. 46, 1459 (1995).<br />
6. nelson D. W., Sommers L. E., in: Total carbon, organic<br />
carbon and organic matter. (Sparks, D. L., ed.), chapter<br />
III, p. 961. ASA & SSSA, Madison 1996.<br />
7. Bremmer J. M. Nitrogen-total. (Sparks D. L., ed.), chapter<br />
III, p. 1085. ASA & SSSA, Madison, 1996.<br />
8. Standford G., Smith S. J.: Soil Sci. 126, 210 (1978).
Chem. Listy, 102, s265–s1311 (2008) Environmental Chemistry & Technology<br />
P76 DISTRIbuTION OF hEAVy METALS IN SOILS<br />
TOMአTóTH, JURAJ ČéRY, Ján TOMáŠ, ALEnA<br />
VOLLMAnnOVá and PETER LAZOR<br />
Department of Chemistry, Faculty of Biotechnology and Food<br />
Sciences, Slovak Univeristy of Agriculture, Tr. A. Hlinku 2,<br />
949 01 Nitra, Slovak Republic,<br />
tomas.toth@uniag.sk<br />
Introduction<br />
The soil quality is derived from its loading by hazardous<br />
substances. The loading of soil occurs when the soil is not<br />
able to lower the negative influences of the heavy metals. The<br />
reference value, which represents natural content of heavy<br />
metals in soil, forms the basis for evaluation of the content of<br />
heavy metals in soil. The important parameters for the input<br />
of heavy metals from soil into plants are: the soil reaction,<br />
the content and the quality of organic matter, the nutrition<br />
of plants, cation exchange and sorption capacity, the microbiological<br />
activity, the oxidation and reduction potential, the<br />
amount and the quality of the clay fraction of soil and the<br />
methods of soil cultivation, etc.<br />
Experimental<br />
The hazardous heavy metals were determined in eight<br />
soil subtypes. Their choice was concentrated on the lowland<br />
regions (Trnovec n/V. – haplic chernozems, Imeľ – eutric<br />
fluvisols, Čičarovce – luvic stagnosols, Dolný Štál – mollic<br />
fluvisols, Veľké Leváre – haplic arenosols, Malanta – haplic<br />
luvisols). We took four parallel soil samples to be able to examine<br />
the soil homogenity of the monitored area. The samples<br />
from the pedological probe were taken from the depth<br />
of 0–0.1 m; 0.20–0.30 m; 0.35–0.45 m. The state of the soil<br />
hygiene was examined by evaluation of the total contents of<br />
Cd, Pb, Cr, Cu and Zn. The total contents were determined after<br />
the mineralization by wet way H 2 SO 4 , HnO 3 and HClO 4<br />
using the method of atomic absorption spectrometry. We also<br />
determined the heavy metals in the pedological probe to be<br />
able to estimate the anthropogenical and geochemical origin<br />
of the heavy metals. The above mentioned heavy metals<br />
were determined in the extract of 2M HnO 3 and in cold. The<br />
mobilizable forms of heavy metals were determined in the<br />
extract with 0.05M EDTA. The mobile heavy metal forms<br />
were determined in extract of 0.01M CaCl 2 .<br />
Results<br />
The valid legislation was used for the evaluation of soil<br />
hygiene. The evaluation is influenced by determination of the<br />
total contents of heavy metals and by the determination of<br />
heavy metals in 2M HnO 3 leach. Contents of heavy metals<br />
in 2M HnO 3 ; 0.05M EDTA and 0.01M CaCl 2 and the percentage<br />
abundance of Zn, Cu, Cr, Pb and Cd in individual<br />
extractants. The following order of extractability for individual<br />
extractants is evident. The results of determination<br />
of actual mobilizable forms are considered to be the most<br />
acceptable. The percentage contents of individual heavy<br />
s493<br />
metals and the total content of heavy metals in highly contaminated<br />
soil are as follows: Zn 1.7–13.9 %; Cu 14.1–6<strong>2.</strong>6 %;<br />
Cr 0.1–1.3 %; Pb 14.6–24.1 %; Cd 1<strong>2.</strong>9–2<strong>2.</strong>8 %. EDTA and<br />
natrium and ammonium of EDTA are able to form stable<br />
and defined complexes with heavy metal cations and they<br />
cause the solubility of carbonates and oxides Fe and Al. The<br />
exctracted contents of heavy metals were measurable during<br />
the use of flame AAS. The mutual interactions of Zn, Cu, Cr,<br />
Pb and Cd with the soil components influence the pH value,<br />
content and quality of organic substances. Apart from the<br />
above mentioned soil properties, there are many other variable<br />
soil properties. The lowest Zn solubility was determined<br />
in subtypes of luvic stagnosols and eutric cambisols with pH<br />
values in the acid part and the quality of mould expressed<br />
by the ratio of humic acids to fluvic acid was the lowest but<br />
on the other hand the percentage of mould has one of the highest<br />
values. The solubility of Cu in 2M HnO 3 and in 0.05M<br />
EDTA was in all soil subtypes the highest and it is especially<br />
valid for haplic arenosols, haplic chernozems, mollic fluvisols<br />
(FL m ). The order of solubility for the determined elements<br />
and and extractants was as follows: 2M HnO 3 > 0.05M<br />
EDTA > 0.01M CaCl 2 .<br />
The lowest amount of Cd and Pb from haplic arenosols<br />
(RM g ) were extracted by extraction with 2M HnO 3 and<br />
0.05M EDTA and the highest amounts of Cd were obtained<br />
from mollic fluvisols, haplic chernozems. The evaluation of<br />
heavy metal contents extracted from individual extractants<br />
at different pH values, the content of mould and its qualitative<br />
composition is not unequivocal and dependence between<br />
variable soil properties and conditions of environment<br />
disappear.<br />
The solubility of Cu in 2M HnO 3 and in 0.05M EDTA<br />
was in all soil subtypes the highest and it is especially valid<br />
for haplic arenosols, haplic chernozems, mollic fluvisols.<br />
The order of solubility for the determined elements and and<br />
extractants was as follows: 2M HnO 3 > 0.05M EDTA > 0.01M<br />
CaCl 2 . We think that the best extractant is 0.05M EDTA with<br />
restriction to Cd, Pb, Cu and partially for Zn. It is not possible<br />
to find an universal extractant for evaulation of heavy metals<br />
mobility in soil.<br />
Conclusions<br />
(i)The extractability for individual ectractans is evident:<br />
2 mol dm –3 HnO 3 : Cu > Cd > Pb > Zn > Cr; 0.05 mol dm –3<br />
EDTA: Cu > Cd > Pb > Zb > Cr; 0,01 moldm –3 CaCl 2 :<br />
Cd > Cu > Pb > Zn > Cr. (ii) It is necessary to emphasize the<br />
differences in solubility between the highly contaminated<br />
eutric cambisols of Stredný Spiš and other analyzed soils.<br />
The different solubility is in all extractants and heavy metals<br />
except the solubility of chromium in 0.05M EDTA and<br />
0.01M CaCl 2 . It is probably connected with the high portion<br />
of heavy metals of immissional origin. The other analyzed<br />
soil subtypes have a low solubility of Zn in HnO 3 and EDTA<br />
in luvic stagnosols.
Chem. Listy, 102, s265–s1311 (2008) Environmental Chemistry & Technology<br />
This work has been supported by projects KEGA No.<br />
3/4282/08 and VEGA No. 1/0339/08<br />
REFEREnCES<br />
1. Arvay J., Melichacova S., Lahucky L., Musilova J., Bystricka<br />
J.: Food safety and control: The crops quality cultivated<br />
on heavy metals contaminated soil from Region<br />
Hont, Nitra, March 28–29, 2008, Book of Works, nitra,<br />
2007.<br />
<strong>2.</strong> Bajcan D., Lahucky L., Stanovic R., Arvay J.: IX Banskostiavnicke<br />
Days: Agricultural plants hygiene growed<br />
on metalic loaded aluvial soils. Zvolen 2007.<br />
s494<br />
3. Bujnovsky R., Jurani B.: Plant and soil: Quality of soil<br />
its determination and evaluation. The Research Institute<br />
of Pedology and Soil, Bratislava, 1998, 150 p.<br />
4. Linkes V.: Monitoring of soils of the Slovak Republic.<br />
The Research Institute of Soil Fertility, Bratislava,<br />
1997.<br />
5. Makovnikova, J.: Dissertation. The Research Institute of<br />
Soil Fertility, Bratislava, 1998<br />
6. Stanovic R., Harangozo L., Arvay J.: 59 th Chemical<br />
Congress: Influence of sulphur to arsen toxicity in agricultural<br />
plants, ChemZi 1/3 2007.
Chem. Listy, 102, s265–s1311 (2008) Environmental Chemistry & Technology<br />
P77 MuLTICOMPONENT<br />
MICRODETERMINATION OF ARSENIC,<br />
ANTIMONy, TELLuRIuM, SELENIuM<br />
bESIDES OF ThALLIuM by ICP-MS IN<br />
wATERS<br />
KRISTýnA URBánKOVá, JIří MACHáT and LUMíR<br />
SOMMER<br />
Brno University of Technology, Chemistry and Technology of<br />
Environmental Protection, Purkyňova 118, 612 00 Brno,<br />
urbankova@fch.vutbr.cz<br />
Introduction<br />
The concentration of As and Tl in the environment is<br />
controlled by strict guidelines. Since considerable affection<br />
of the human organism is described for As and Tl 1,2 . Te is<br />
more toxic than Se but little is known about its requirements.<br />
Se is longely known for its ambivalency and particular essentiality<br />
for the human and animal organism and its implication<br />
in various enzymes on trace levels. Arsenic compounds are<br />
an important dopant for the semiconductor silicon production<br />
and a modifier of mechanical properties in lead and copper<br />
alloys. Complicated hydrolytic equilibria can be present in<br />
dilute aqueous solutions in dependence on pH 3 .In fact, these<br />
equilibria in aqueous solutions have little influence on the<br />
results of ICP-MS only. The multicomponent microdetermination<br />
of inorganic As, Sb, Se, Te and Tl with ICP-MS is<br />
remarkable selective and sensitive and has not been studied<br />
in detail 4 .<br />
Experimental<br />
C h e m i c a l s<br />
Standard solutions of Se, Te, As, Sb and Tl with<br />
100 μg dm –3 were prepared by dilution from original solutions<br />
containing 1.000 ± 0.002 g dm –3 metals which were<br />
purchased from Analytica s.r.o., Prague.<br />
A multicomponent standard containing<br />
1.000 ± 0.002 g dm –3 Al, Ba, Ca, Cd, Co, Cr, Cu, Fe, Mg, Mn,<br />
na, ni, Pb, Ti, Zn was also from Analytica s.r.o. Prague.<br />
The tuning solutions for ICP-MS were 1 mg dm –3 of<br />
Ce 3+ , Li, Y, and Tl + in 2% HnO 3 . In such solution must be<br />
the ratio CeO + /Ce + ≤ 1.5 % and Ce 2+ /Ce + ≤ 3 % for bivalent<br />
ions. The solution containing 1 mg dm –3 of Co 2+ in 1% HCl<br />
was used for tuning with the Helium collision cell.<br />
I n s t r u m e n t a t i o n<br />
An ICP-MS spectrometer Agilent 7500ce Japan was<br />
used with a plasma generator of 27.12 MHz and the power<br />
output 1,500 W. The sample nebulized by a concentric silica<br />
nebulizer MicroMist with a cooled Scott chamber entered<br />
by an injector of <strong>2.</strong>5 diameters into the plasma.<br />
The flow of the carrier argon trough the nebulizer was<br />
1 dm 3 min –1 and contained the make up argon 0.33 dm 3 min –1 .<br />
A constant temperature 2 °C of the nebulising chamber was<br />
maintained.<br />
s495<br />
Results<br />
no polyatomic interferences were observed for selected<br />
isotopes 75 As, 82 Se, 121 Sb, 125 Te and 205 Tl such as Ar 2+ , ArH + ,<br />
ArO + and Arn + . Six-points calibration plots for selected element<br />
isotopes were strictly linear for concentrations less than<br />
1,000 μg dm –3 in solutions containing 0.5% HnO 3 . The signal<br />
intensity considerably decreases with the increasing concentration<br />
of acids. For the hydrochloric acid the decrease is<br />
6 % for 205 Tl and 11% for 75 As with 5% HCl, With HnO 3 ,<br />
the decrease is 30% for 82 Se and 125 Te but for 75 As and 205 Tl<br />
15%. The medium of 0.5% HnO 3 is optimal and recommended<br />
for the measurement.<br />
I n t e r f e r e n c e s<br />
The effect of 1–250 mg dm –3 of na, K, Ca, Mg, Al,<br />
Fe(III), on the signal intensity was evaluated for 100 μg dm –3<br />
in 0.5 % HnO 3 . For 1–10 mg dm –3 of the matrix element the<br />
error for the microelement signal does not exceed 5 %. For<br />
50 mg dm –3 of the matrix element, the error for the microelements<br />
increased to 15–20 % in the presence to Ca, Mg,<br />
Al and Fe(III). On the other hand, 250 mg dm –3 of na and K<br />
cause less than 10% error for 100 μg dm –3 As, Se, Sb, Te, Tl.<br />
In the presence of 1–100 μg dm –3 of multicomponent<br />
solution containing Al, Ba, Ca, Cd, Co, Cr, Cu, Fe, Mg, Mn,<br />
na, ni, Pb, Ti, Zn with 100 μg dm –3 of 75 As, 82 Se, 121 Sb, 125 Te<br />
and 205 Tl a considerable interference was observed and the<br />
signal decreased up to 70 %. The error can be decreased in<br />
the presence of 100 μg dm –3 of internal standard. 72 Ge was<br />
suitable for 75 As in the He mode and 82 Se in the normal mode<br />
and 209 Bi was suitable for the remaining elements measured<br />
in normal mode (Fig. 1.).<br />
A p p l i c a t i o n o f W a t e r S a m p l e s<br />
Five-point strictly linear calibration plots with spiked<br />
microelements were carried out for all kinds of waters. The<br />
slopes of the regression lines were compared with that of ultra<br />
pure water to evaluate the influence of the matrix which cause<br />
some signal decrease by 5 %. This error can be diminished by<br />
using internal standards especially for sea and mine waters.<br />
Fig. 1. The influence of multicomponent standard on the intensity<br />
of signal of 100 μg dm –3 of 75 As, 82 Se, 121 Sb, 125 Te and 205 Tl in<br />
the presence or absence of internal standard ( 72 Ge and 209 bi)
Chem. Listy, 102, s265–s1311 (2008) Environmental Chemistry & Technology<br />
The detection limits were expressed according to UPAC 5 .<br />
For 75 As was the limit of detection 0.05–0.08 μg dm –3 ,<br />
for 82 Se 0.04–0.03 μg dm –3 , 121 Sb 0.03–0.01 μg dm –3 ,<br />
125 Te 0.3–0.02 μg dm –3 and for 205 Tl 0.005–0.2 μg dm –3 .<br />
The evaluation of the contents of microelements resulted<br />
form spikes 1, 3 and 5 μg dm –3 in solutions containing 0.5%<br />
HnO 3 . The proper contents of the microelements in the sea<br />
and mine waters resulted from the corrected calibration plot<br />
by the standard addition method since their contents is higher<br />
than the detection limit of these elements.<br />
For the drinking, surface and mineral waters, the evaluation<br />
was realized directly from the spikes, comparing the<br />
corrected regression equation of the calibration plot. This<br />
was because the amounts of microelements were below their<br />
detection limit.<br />
Selected internal standards 72 Ge for 75 As in the He mode<br />
and 82 Se in the normal mode and 209 Bi for the remaining elements,<br />
measured in normal mode were always used during<br />
evaluation. The confidence intervals according to Dean and<br />
Dixon statistics 6 for triplicate analyses were used.<br />
Table I<br />
Evaluation of results from 1, 3 and 5 μg dm –3 spikes used<br />
Drinking water Surface water Mineral water<br />
205 Tl 1.004 ± 0.005 3.006 ± 0.010 5.004 ± 0.009<br />
125 Te 1.003 ± 0.004 3.004 ± 0.009 5.005 ± 0.012<br />
121 Sb 1.003 ± 0.004 3.003 ± 0.008 5.003 ± 0.009<br />
82 Se 1.003 ± 0.002 3.004 ± 0.006 5.004 ± 0.007<br />
75 As 1.001 ± 0.003 3.001 ± 0.005 5.001 ± 0.004<br />
Conclusions<br />
75 As, 82 Se, 121 Sb, 125 Te and 205 Tl were determined in the<br />
concentration range ≤ 1,000 μg dm –3 in solution with 0.5%<br />
HnO 3 in the absence and presence of internal standards 72 Ge<br />
for 75 As in the Helium mode, 72 Ge for 82 Se in the normal<br />
mode and 209 Bi for 121 Sb, 125 Te and 205 Tl when the normal<br />
mode was used. 100 μg dm –3 of the microelement can<br />
s496<br />
Table II<br />
Evaluation of results by the method of standard deviation in<br />
the sea and mine water a<br />
Sea water Mine water<br />
205 Tl 0.017 ± 0.025 0.811 ± 0.036<br />
125 Te 0.022 ± 0.019 0.421 ± 0.032<br />
121 Sb 0.020 ± 0.013 0.229 ± 0.029<br />
82 Se 0.054 ± 0.015 1.012 ± 0.014<br />
75 As 0.020 ± 0.033 0.537 ± 0.041<br />
a Five-points calibration plots used<br />
be determined in the presence of 50 mg dm –3 of Ca, Mg, Al,<br />
Fe(III) with 15–20% error but in the presence of 200 mg dm –3<br />
of na, K with 10% error only. In the presence of 250 mg<br />
of a multicomponent sample with 100 μg dm –3 of studied<br />
elements the signal decrease. The error was decreased in the<br />
presence of 100 μg dm –3 of internal standard.<br />
For water samples the standard addition method was<br />
used for sea and mine water only to evaluate the microelements<br />
because the concentration of microelements exceeds<br />
the practical detection limits from the IUPAC recommendation.<br />
For surface and potable waters with the amounts<br />
of microelements below the detection limit three spikes were<br />
directly evaluated in triplicate according to Dean and Dixon<br />
statistics in the presence of internal standards.<br />
REFEREnCES<br />
1. Vercruysse A (ed.): Hazardous Metals in Human Toxikology<br />
Part B, Techniques and Instrumentatiton in analytical<br />
Chemistry, Elsevier Press, Amsterdam 1984.<br />
<strong>2.</strong> Das A. K., Chakraborty R., Cervera M. L., De la Guardia<br />
M., Anal.Bioanal.Chem. 385, 665 (2006).<br />
3. Bayes Ch. F., Messner R. E.: The Hydrolysis of Cations,<br />
Wiley, n. York 1976.<br />
4. Balaram V.: Atom. Spectroscopy 14, 174 (1993).<br />
5. Currie L. A.: Pure Appl. Chem 67, 1699 (1995).<br />
6. Dean R. B., Dixon W. J.: Anal. Chem 23, 636 (1951).
Chem. Listy, 102, s265–s1311 (2008) Environmental Chemistry & Technology<br />
P78 SEPARATION AND PRECONCENTRATION<br />
OF ARSENIC, ANTIMONy, SELENIuM AND<br />
TELLuRIuM ON MODIFIED SILICAGELS<br />
FOR ThEIR DETERMINATION by ICP-AES<br />
KRISTýnA URBánKOVá, LUMíR SOMMER and<br />
MARTIn MOOS<br />
Brno University of Technology, Chemistry and Technology of<br />
Environmental Protection,Purkyňova 118, 612 00 Brno,<br />
urbankova@fch.vutbr.cz<br />
Introduction<br />
The determination of toxic or ambivalent microelements<br />
arsenic, antimony, selenium and tellurium in water samples<br />
requires inevitably a preconcentration prior to the determination<br />
by ICP-AES. The separation and preconcentration by<br />
various solid phase extractions were earlier studied and such<br />
technique widely used for water samples. The complexation<br />
of these elements with organic reagents is of particular<br />
interest when interacting with various kinds of silica sorbent<br />
used. 1–5 The combination of organic reagent with cationic<br />
surfactant was examined for sorption in this paper.<br />
Experimental<br />
C h e m i c a l s<br />
All chemicals and solvents used were of analytical grade<br />
quality.<br />
Astasol standards for arsenic, antimony, selenium and<br />
tellurium containing 1.000 ± 0.002 g dm –3 of element were<br />
from Analytica Prague, Czech Republic.<br />
The cationic surfactant 1-ethoxycarbonylpentadecyltrimethylammonium<br />
bromide (Septonex ® ) from Aventa, Czech<br />
Republic and organic reagents 4-(2-Pyridylazo)resorcinol<br />
(PAR), Pyrrollidincarbodithioate (APDC), thiourea (THU)<br />
and 1,2-dihydroxybenzene (PYR) from Lachema, Czech<br />
Republic, diethyldithiocarbamidate (DTC) from Fluka,<br />
Switzerland and 8-hydroxyquinoline-5-sulphonic acid (8-<br />
HQS) from Aldrich, Germany were used.<br />
Modified sorbents were Separon SGX C18, C8, SGX<br />
nH 2 , SGX Cn, SGX RPS and SGX Phenyl with particle size<br />
60 μm, from Tessek Prague, Czech Republic.<br />
I n s t r u m e n t a t i o n<br />
An echelle based ICP-spectrometer with a prism-predisperser<br />
IRIS AP, (Thermo Jarell Ash) and CID detector with<br />
512 × 512 pixels for 195–900 nm, axial plasma discharge of<br />
1.35 kW and echelle grating with 54.4 lines were used.<br />
The following spectral lines [nm] As 228.8, Sb 231.1,<br />
Se 190.6 and Te 214.2 were suitable for final evaluation<br />
only because of their high intensity, selectivity and low background<br />
influences.<br />
s497<br />
Results<br />
S o r p t i o n o f E l e m e n t s o n t h e<br />
S i l i c a S o r b e n t i n t h e P r e s e n c e o f<br />
S u r f a c t a n t<br />
Prior to the sorption, the column was conditioned<br />
successively with 10 ml of distilled water and 10 ml of<br />
5 × 10 –4 – × 10 –2 mol dm –3 aqueous solution of surfactant.<br />
50 ml of solution containing 1 mg dm –3 of As, Sb, Se and<br />
Te (each of them) was always sorbed by a flow rate 1.0–<br />
3.0 ml min –1 at pH 7. The column was then rinsed with 10 ml<br />
of distilled water and the elements eluted with 10 ml of acetone-ethanol<br />
(1 : 1) mixture in the presence of 0.1 mol dm –3<br />
HCl which showed the highest elution efficiency. The organic<br />
eluent was always removed by evaporation under an infra-red<br />
lamp to 1 ml in a suitable Teflon dish.<br />
5 × 10 –3 mol dm –3 Septonex ® is optimal for the retention<br />
of inorganic form of As, Sb, Se and Te. The recovery values<br />
decrease from concentration larger than 1 × 10 –2 mol dm –3<br />
Septonex ® because of the competing influence of micelles<br />
formed under these conditions in solutions. The recovery was<br />
nearly 100 % on SGX C18 (C8) for Sb, Se and Te but for As<br />
it reaches 60 % only. On the other sorbents, the sorption efficiency<br />
decreased. As was retained from 4 % on SGX Phenyl<br />
to 15 % on SGX Cn. 70 % retention of Sb was on SGX nH 2 .<br />
The recoveries for Se were about 90 % for SGX nH 2 , RPS<br />
and Phenyl. On the other hand, more than 40 % of Te was<br />
retained on sorbent SGX RPS and nH 2 .<br />
E f f e c t o f O r g a n i c R e a g e n t s<br />
The retention of monitored microelements was carried<br />
out from 50 ml of solutions containing 1 mg dm –3 of each<br />
metal with organic reagents when the column was previously<br />
conditioned by 5 × 10 –3 mol dm –3 Septonex ® only.<br />
The sorption from solution containing 0.85 × 10 –4 –<br />
3.35 × 10 –4 mol dm –3 PAR was quantitative for Separon<br />
SGX C18, SGX C8, SGX Cn for Sb, Se and Te. On SGX<br />
C18 and C8 the retention of complexes was nearly 100 % for<br />
<strong>2.</strong>77 × 10 –4 –1.1 × 10 –3 mol dm –3 8-HQS and also 6.25 × 10 –4<br />
–8.33 × 10 –3 mol dm –3 PYR. The recoveries about 90 %<br />
were observed for 4.86 × 10 –4 –7.29 × 10 –4 mol dm –3 APDC<br />
and about 80 % for 4.90 × 10 –4 –1.50 × 10 –3 mol dm –3 DTC<br />
or 1.05 × 10 –3 –4.20 × 10 –3 mol dm –3 THU for Sb, Se and<br />
Te. The sorption of As was far from being quantitative.<br />
1.70 × 10 –4 mol dm –3 PAR can be used for the retention of As,<br />
Sb, Te on SGX nH 2 and SGX RPS for As, Sb, Se. On the<br />
other hand, <strong>2.</strong>77 × 10 –4 mol dm –3 8-HQS is optimal for Se on<br />
SGX nH 2 and SGX Phenyl and <strong>2.</strong>43 × 10 –4 mol dm –3 DTC<br />
was suitable for the retention of Te on SGX RPS, SGX Phenyl<br />
and for As on SGX Phenyl.<br />
E f f e c t o f S a m p l e V o l u m e<br />
The influence of sample volume was tested for the retention<br />
from 50–1,000 ml solution containing 0.2–0.01 mg dm –3<br />
each of element in the presence of the particular organic reagents<br />
after conditioning. This corresponds to a 5–100-fold
Chem. Listy, 102, s265–s1311 (2008) Environmental Chemistry & Technology<br />
enrichment of As, Sb, Se and Te which enables the final use<br />
of ICP-AES.<br />
Volumes of up to 1,000 ml have no effect on the retention<br />
efficiency on Separon SGX C18, C8 and SGX RPS.<br />
The sorption is however quantitative from 500 ml only on<br />
SGX nH 2 , SGX Cn and SGX Phenyl. The weakening of the<br />
retention forces of ionic associate or complexes on the surface<br />
of sorbent may supports the subsequent washing out of<br />
the element species from the column.<br />
A p p l i c a t i o n f o r W a t e r S a m p l e s o n<br />
S e p a r o n S G X C 1 8<br />
Standards of folowing elements were spiked to equilibrated<br />
drinking, mineral and river water samples containing<br />
no detectable amounts of these elements. The Separon SGX<br />
C18 was previously conditioned by 10 ml of distilled water<br />
and 10 ml of 5 × 10 –3 mol dm –3 Septonex ® . The sorption was<br />
provided from 250 ml of sample solutions in the presence of<br />
1.68 × 10 –4 mol dm –3 PAR. Conclusions<br />
Table I<br />
The recovery (%) of arsenic and antimony in water samples a<br />
Spikes<br />
[mg dm<br />
c b<br />
element Arsenic Antimony<br />
–3 ] [mg dm –3 ]<br />
Mineral water<br />
0.25 0.01 58.30 ± <strong>2.</strong>44 98.74 ± <strong>2.</strong>70<br />
0.50 0.02 60.02 ± <strong>2.</strong>60 101.3 ± 3.40<br />
1.00 0.04 60.23 ± 3.36<br />
River water<br />
99.54 ± <strong>2.</strong>87<br />
0.25 0.01 59.71 ± 3.14 100.9 ± <strong>2.</strong>39<br />
0.50 0.02 60.90 ± <strong>2.</strong>69 97.26 ± 3.53<br />
1.00 0.04 6<strong>2.</strong>34 ± <strong>2.</strong>43 100.9 ± 3.09<br />
aThe analysis was carried out in triplicate and evaluated<br />
according Dean and Dixon6 bConcentration in 250 ml of water sample<br />
s498<br />
Table II<br />
The recovery (%) of selenium and tellurium in water samples<br />
a<br />
Spikes c element b<br />
Selenium Tellurium<br />
[mg dm –3 ] [mg dm –3 ]<br />
Mineral water<br />
0.25 0.01 100.5 ± <strong>2.</strong>57 100.5 ± 3.06<br />
0.50 0.02 98.60 ± 3.00 99.50 ± 3.07<br />
1.00 0.04 99.23 ± <strong>2.</strong>66 99.78 ± <strong>2.</strong>33<br />
River water<br />
0.25 0.01 99.78 ± <strong>2.</strong>71 100.8 ± <strong>2.</strong>35<br />
0.50 0.02 98.90 ± <strong>2.</strong>80 99.64 ± <strong>2.</strong>47<br />
1.00 0.04 101.7 ± <strong>2.</strong>11 100.2 ± 1.73<br />
a The analysis was carried out in triplicate and evaluated according<br />
Dean and Dixon 6<br />
b Concentration in 250 ml of water sample<br />
The separation and preconcentration of arsenic,<br />
antimony, selenium and tellurium in the presence of<br />
1.68 × 10 –4 mol dm –3 4-(2-Pyridylazo) resorcinol after previous<br />
conditioning with 5 × 10 –3 mol dm –3 Septonex ® was<br />
described in this paper. This procedure was successfully used<br />
for determination of these elements by ICP-AES in real water<br />
samples.<br />
REFEREnCES<br />
1. Sturgeon R. E., Willie S. n., Berman S. S.: Anal. Chem.<br />
57, 6 (1985).<br />
<strong>2.</strong> Jitmanee K., Oshima M., Motomizu S.: Talanta 66, 529<br />
(2005).<br />
3. Gabros S., Rzepecka M., Bulska E., Hulanicki A.:<br />
Spectrochim. Acta Part B 54, 873 (1999).<br />
4. Zhang L., Merita Y., Sakuragawa A., Isozaki A.: Talanta<br />
72, 723 (2007).<br />
5. Dressler V. L., Pozebon D., Curtius A. J.: Spectrochim.<br />
Acta Part B, 1527 (1998).<br />
6. Dean R. B., Dixon W. J.: Anal. Chem. 23, 636 (1951).
Chem. Listy, 102, s265–s1311 (2008) Environmental Chemistry & Technology<br />
P79 TREATING wASTEwATER by uSING OF<br />
bIOCERAMIC FILTERS<br />
A. VAŠKOVá, I. ŠTYRIAKOVá and V. SnOPKOVá<br />
Department of Biotechnology, Insitute of Geotechnics of the<br />
Slovac Academy of Sciences , Watsonova 45, 043 53 Košice,<br />
Slovakia,<br />
avaskova@saske.sk<br />
Introduction<br />
nowadays, the control and treatment of industrial effluents<br />
has become one of the most important steps of the productive<br />
process, since the regulatory offices have been very<br />
rigorous about this subject 1 .<br />
Heavy metals are a group of contaminants that are high<br />
toxic to humans, animals, and aquatic lives and are commonly<br />
found in many munic pal and industrial wastes 4 . The<br />
toxicity of copper released into the environment has triggered<br />
a number of studies aimed at its removal from aqueous<br />
solutions. As a treatment approach, sorption in columns has<br />
widely been used in water treatment 2 . The using of bioceramic<br />
filters based on iron oxides, quartz sand, clay minerals,<br />
and bacteria could be an alternative way to remove heavy<br />
metals from industrial effluents. Iron oxides, a common constituent<br />
of soils, sediments, and aquifers, have high surface<br />
areas and are capable of adsorbing a significant quantity of<br />
metals. They are dominant adsorbents in many environments<br />
because of their capability to be finely dispersed and act as<br />
coatings on other particles 3 . A number of studies on metal<br />
uptake using quartz sands and clay minerals, have been conducted<br />
and results have shown good adsorption properties<br />
due to its metal-binding capacity and high surface area. Bacteria,<br />
in particular, are effiecient sorbents of heavy metals,<br />
although subtle differences can be seen between species and<br />
under various physicochemical conditions. Previous studies<br />
showed that the gram-positive bacteria Bacillus sp. was<br />
able to retain several heavy metals as silicate minerals or as<br />
oxyhydroxides at 20 and 4 °C under laboratory simulations<br />
of natural conditions.<br />
The concentration of some of the toxic metals are higher<br />
than permissible discharge levels in effluents. It, therefore,<br />
becomes necessary to remove these heavy metals from these<br />
wastewaters by an appropriate treatment before releasing<br />
them into the enviroment.<br />
Experimental<br />
The adsorption of copper by bioceramic filters was studied<br />
by column technique. In this study two types of filters<br />
were used and compared in sorption efficiency.<br />
M a g n e t i t e P r e p a r a t i o n<br />
Iron oxides can be easily synthetize in laboratory conditions.<br />
Synthetic magnetite (Fe 3 O 4 ) used in this work was<br />
prepared by partial oxidation of Fe 2+ solution at temperature<br />
90 °C under anoxic conditions in the presence of nitrogen ions<br />
-oxidizing agent. The surface area was 13 m 2 g –1 and particle<br />
s499<br />
size range from 0.05–0.2 µm. The main mineral phase was<br />
confirmed by RTG diffraction, IR spectroscopy and Mössbauer<br />
spectroscopy method.<br />
Fig. 1. xRD-pattern of synthetic magnetite<br />
C h a r a c t e r i z a t i o n o f Q u a r t z S a n d<br />
a n d C l a y M i n e r a l s<br />
Quartz sand used in this work was obtained from Šaštín<br />
Stráže deposit (Slovakia) and composed of quartz (88–90 %),<br />
feldspar (8–10 %), heavy minerals (1 %) and clay minerals<br />
(1 %) of grain size 0–1 mm. The clay mineral used in this<br />
study was bentonit composed of montmorillonite (60–80 %)<br />
obtained from Jelšový potok deposit.<br />
Table I<br />
Chemical composition of quartz sand<br />
Element [%] QS<br />
SiO 2 9<strong>2.</strong>7<br />
Al 2 O 3 3.95<br />
Fe 2 O 3 0.32<br />
TiO 2 0.06<br />
CaO 0.16<br />
MgO 0.15<br />
na 2 O 0.93<br />
K 2 O 1.32<br />
Cr 2 O 3 0.004<br />
MnO 0.02<br />
B a c t e r i a<br />
In this study two bacterial strains were isolated from<br />
the copper pollluted waste water of industry plant: Bacillus<br />
megaterium and Pseudomonas diminuta. The resistance of<br />
bacterial strains to copper was tested. The bacterial isolate<br />
Bacillus megaterium could grow at a concentration ranging<br />
from 52–260 mg Cu dm –3 and Pseudomonas diminuta at<br />
a concentration max 52 mg Cu dm –3 , at temperature 25 °C.<br />
Therefore Bacillus sp. isolate was used for this study. The<br />
bacterial isolate Bacillus sp. was inoculated into flask containing<br />
nutrient broth (Merck) and aerobically cultivated
Chem. Listy, 102, s265–s1311 (2008) Environmental Chemistry & Technology<br />
at 25 °C by the agitating at the speed of 150 rpm. The cells<br />
were harvested from the growth medium by membrane filtration<br />
(pore size 0.85 µm). Bacteria suspension was prepared<br />
with concentration of bacteria 1.2 × 10 9 ml –1 in accordance to<br />
MacFarland standards.<br />
P r e p a r a t i o n o f C o p p e r M o d e l<br />
S o l u t i o n s<br />
The model solution of Cu (II) was prepared by dissolving<br />
of CuSO 4 . 5H2 O in deionized water in various concentrations<br />
ranging from 0.01; 0.02; 0.04; 0.06; 0.1; 0.5; 1; 1.5; 2; <strong>2.</strong>5;<br />
3 to 5 mM. Previous studies showed that at pH 5 is the most<br />
effective copper sorption. The initial pH of the solutions was<br />
adjusted to 5 by adding 0.1M HnO 3 or 0.1M naOH for the<br />
biosorption experiments. Various Cu(II) concentrations and<br />
concentration after sorption process were measured by atomic<br />
absorption spectrofotometer (Varian AA240 Z, AA240<br />
FS, Australia).<br />
C o l u m n S t u d i e s<br />
In this study glass columns were used for experiments.<br />
The filtration column was 130 mm high with an inner diameter<br />
of 40 mm. Column was packed with appropriate amounts<br />
of each sorbent in layers (100 g of quartz sand, 0.5 g of bentonite<br />
and 0.1 g of synthetic magnetite). 50 ml of bacteria suspension<br />
was passed through the column to adjusted the adhesion<br />
of bacteria cells. Two types of filtration columns were<br />
prepared. In both types there was 45 mm depth of ceramic<br />
medium, one reached with bacteria (biotic filter) and another<br />
filter without bacteria medium (abiotic filter). Then 50 ml of<br />
Cu(II) model solution was passed through the column at a<br />
constant flow rate of 1.5 ml min –1 .<br />
Fig. 3. Sorption columns<br />
Results<br />
Bioceramic filters composed of quartz sand + bentonite<br />
+ synthetic magnetite + bacteria were used for the sorption<br />
of copper. These two types of filters were compared in<br />
sorption efficiency. The effect of initial concentration on the<br />
percentage removal of copper by biotic and abiotic filters is<br />
s500<br />
shown in Fig. <strong>2.</strong> Fig. <strong>2.</strong> demonstrates that sorption was more<br />
effective in case of biotic filters. The work was carried out at<br />
the pH (5) of model solution because this pH value is for copper<br />
sorption optimum. The maximum removal of Cu(II) was<br />
attained at a concentration 63.5 mg dm –3 Cu. High removal<br />
efficiency (> 95 %) was obtained over the copper (II) concentration<br />
range 1–100 mg dm –3 . However the removal percentage<br />
decreased with increasing the copper (II) concentration<br />
( > 100 mg dm –3 ). Therefore this method seems to be suitable<br />
for the removal of relatively lower concentration of copper.<br />
Fig. <strong>2.</strong> Effect of initial copper concentration on percent removal<br />
of copper by biotic and abiotic filter<br />
Conclusions<br />
The present study showed that the bioceramic filters<br />
based on quartz sand, bentonite, synthetic magnetite and bacteria<br />
can be used as an effective adsorbent of copper. The<br />
results of experiments showed high removal of copper by<br />
both types of model filters at concentrations ranging from<br />
0.01 to 1.5 mM Cu(II). At higher concentrations removal<br />
of copper decreased. The percentage removal was more effective<br />
in biotic filters with baceria medium; however the<br />
difference compared with abiotic filter was not so marked.<br />
Therefore in further experiments bacteria medium with higher<br />
concentration of bacteria cells is needed. In the further<br />
study various iron oxides (hematite, goethit) and clay minerals<br />
(zeolite, kaolinite) will be used in experiments and their<br />
sorption efficiency will be compare.<br />
This work has been supported by the Slovak Academy of<br />
Sciences (VEGA 2/0049/08).<br />
REFEREnCES<br />
1. Cassela R. J.: Microchem. J. 72, 17 (2002).<br />
<strong>2.</strong> Meena A. K., Mishra G. K., Rai P. K., Rajagopal Ch.,<br />
nagar I.: J. Hazard. Mater. B122, 161 (2005).<br />
3. Kooner Z. S.: Environ. Geol. 21, 242 (1993).<br />
4. Wu. G., Li L. Y.: J. Contam. Hydrol. 33, 313 (1998).
Chem. Listy, 102, s265–s1311 (2008) Environmental Chemistry & Technology<br />
P81 DETERMINATION OF SuRFACTANTS<br />
INCLuDED IN SEwAGE wATER<br />
MILADA VáVROVá a,b , LEnKA LAnGOVá a ,<br />
KRISTýnA KUBíČKOVá b , HELEnA ZLáMALOVá<br />
GARGOŠOVá a , MICHAELA STOUPALOVá b and<br />
VLADIMíR VEČEREK b<br />
a Brno University of Technology, Faculty of Chemistry,<br />
Purkyňova 118, 612 00 Brno,<br />
b University of Veterinary and Pharmaceutical Sciences Brno,<br />
Faculty of Veterinary Hygiene and Ecology,<br />
vavrova@fch.vutbr.cz<br />
Introduction<br />
Surfactants or detergents belong to a group of organic<br />
substances that adsorb at a low concentration in the interface,<br />
thereby decreasing interfacial or surface energy. Detergents<br />
therefore show surface activity which manifests itself by the<br />
formation of foam in aqueous solutions 1 . Such properties<br />
facilitate the wetting of surfaces and the removal of impurities<br />
2 .<br />
Detergents can be divided according to their dissociation<br />
properties into the following groups: anionic detergents, cationic<br />
detergents, ampholytic detergents, and non-ionogenic<br />
detergents 2 . There are many kinds of individual detergents.<br />
During wastewater treatment, detergents account for<br />
a high percentage of chemical oxygen demand. Detergents<br />
are also able to increase the solubility of other toxic organic<br />
components in water and soil. When adsorbed in sludge, they<br />
may impair sludge dewatering. Generally, the concentration<br />
of detergents at the outflow from a wastewater treatment<br />
plant depends on the efficiency and technological parameters<br />
of the facility.<br />
Wastewater usually contains different kinds of detergents.<br />
For biological treatment, the level of detergents in<br />
wastewater should not exceed 1,000 mg dm –3 (ref. 4 ). In countries<br />
where the consumption of washing powders and cleaning<br />
agents is high, the concentration of anion-active detergents<br />
in municipal wastewater varies in a range of 10–20 mg dm –3 .<br />
Increased concentrations of detergents can be detected in<br />
wastewater from textile industry, the production of washing<br />
and cleaning agents and cosmetic production plants, and<br />
may exceed 100 mg dm –3 . High levels of detergents are also<br />
present in wastewater originating from laundries and car<br />
washes 5 . The limit concentration of anion-active detergents<br />
in drinking water is 0.2 mg dm –3 . This parameter is used to<br />
indicate the level of pollution in underground water or treated<br />
surface water with sewage 2 .<br />
Experimental<br />
The samples of wastewater to be analysed were collected<br />
at both the inflow and outflow of the wastewater treatment<br />
plant of the University of Veterinary and Pharmaceutical<br />
Sciences (VFU Brno). The samples of wastewater taken at<br />
the outflow were collected before chlorination to prevent the<br />
distortion of the results. The sample of water was measured<br />
s501<br />
immediately after collection; the transfer of the sample took<br />
approximately 10 minutes.<br />
Detergents were determined using Merck spectrophotometric<br />
cuvette tests. The method for the determination of<br />
anion-active detergents can be used for concentrations ranging<br />
from 0.05 to <strong>2.</strong>0 mg dm –3 . This method is similar to<br />
EPA 425.1, US Standard Methods 5540 and En 903. Cationactive<br />
detergents are determined using a spectrophotometric<br />
method in a concentration range of 0.05–1.5 mg dm –3 . The<br />
determination of non-ionogenic detergents was carried out in<br />
a range of 0.1–7.5 mg dm –3 .<br />
Results<br />
The levels of anion-active, cation-active and non-ionogenic<br />
detergents were measured at both the inflow and outflow<br />
of the wastewater treatment plant during one week. It<br />
follows from the overview of the results provided in Table I<br />
that the samples of wastewater contain mainly anion detergents<br />
whose level is three orders higher than that of other<br />
detergents. The results in the table also demonstrate that the<br />
level of detergents in water – particularly anion-active detergents<br />
– decreased significantly as a result of wastewater treatment;<br />
the highest level detected was 0.97 mg dm –3 and was<br />
determined on Friday while the lowest level (0.29 mg dm –3 )<br />
was found on Tuesday. The highest concentration of cationic<br />
detergents (0.24 mg dm –3 ) was detected on Monday and<br />
decreased markedly on other days (0.025 mg dm –3 ). The presence<br />
of highly toxic cationic detergents is alarming.<br />
Table I<br />
Comparison of the levels of anion-active detergents in the<br />
inflow and outflow [mg dm –3 ]<br />
Inflow Outflow<br />
1 20.00 0.40<br />
2 1<strong>2.</strong>90 0.29<br />
3 18.30 0.49<br />
4 13.90 0.49<br />
5 14.00 0.97<br />
Table II<br />
Comparison of the levels of cation-active detergents in the<br />
inflow and outflow [mg dm –3 ]<br />
Inflow Outflow<br />
1 0.400 0.240<br />
2 0.020 0.025<br />
3 0.690 0.025<br />
4 0.025 0.025<br />
5 0.025 0.025<br />
The levels of non-ionogenic detergents in wastewater<br />
collected at the outflow were the same in all cases<br />
– 0.05 mg dm –3 . The differences between individual findings<br />
(the highest and the lowest levels) are difficult to explain; it is
Chem. Listy, 102, s265–s1311 (2008) Environmental Chemistry & Technology<br />
possible that other biologically active compounds such as<br />
pharmaceuticals may also be present in wastewater affecting<br />
the biological stage of wastewater treatment in the respective<br />
wastewater treatment plant.<br />
Table III<br />
Comparison of the levels of non-ionogenic detergents in the<br />
inflow and outflow [mg dm –3 ]<br />
Inflow Outflow<br />
1 0.69 0.05<br />
2 0.89 0.05<br />
3 <strong>2.</strong>40 0.05<br />
4 1.40 0.05<br />
5 <strong>2.</strong>61 0.05<br />
Conclusions<br />
Detergents are closely related to the environment. From<br />
an environmental point of view, the impact of detergents on<br />
water resources management, their biodegradability, toxicity<br />
and eutrophication caused by detergents is very significant.<br />
Since a large number of synthetic detergents exhibits insufficient<br />
biodegradability, water courses are becoming polluted<br />
with these substances. Even low concentrations of surfactants<br />
were shown to endanger the organisms in the environment.<br />
s502<br />
In order to minimize their concentrations in the environment,<br />
generally valid rules should be implemented to help protect<br />
our environment.<br />
Financial support from Ministry of Education, Youth<br />
and Sports under MSM 6215712402 and grant COST, action<br />
636, project No. OC – 183.<br />
REFEREnCES<br />
1. Kizlink, J.: Technologie chemických látek II. Zpracování<br />
ropy, paliva a petrochemie, chemické speciality, pesticidy,<br />
dezinfekční látky, tenzidy, plasty a kaučuk, aditiva<br />
a pomocné chemikálie, výbušniny, biotechnologie, organizace<br />
pro chemii. VUT Brno, Brno, 2001.<br />
<strong>2.</strong> Pitter, P.: Hydrochemie. VŠCHT, Praha, 1999.<br />
3. Venhuis S. H., Mehrvar M.: Int. J. Photoenergy 6, 115<br />
(2004).<br />
4. Dhouib, Hamad, Hassaı¨ri, Sayadi. Process Biochem.<br />
38, 1245 (2003).<br />
5. nařízení vlády č. 61/2003, o ukazatelích a hodnotách<br />
přípustného znečištění povrchových vod a odpadních<br />
vod, náležitostech povolení k vypouštění odpadních vod<br />
do vod povrchových a do kanalizací a o citlivých oblastech.<br />
Sbírka zákonů, no. 24, p. 898, 2003.
Chem. Listy, 102, s265–s1311 (2008) Environmental Chemistry & Technology<br />
P82 ExAMINATION OF ThE MuTuAL<br />
INTERACTION OF hEAVy METALS IN<br />
COuRSE OF ADSORPTION FROM MODEL<br />
SOLuTIONS<br />
Ján VEREŠ a , TOMአBAKALáR b , MILAn BÚGEL b<br />
and MARTIn SISOL b<br />
a Institute of Geotechnics, Slovak Academy of Science, Watsonova<br />
45, 043 53 Kosice, Slovakia,<br />
b Technical University of Kosice, Faculty of Mining, Ecology,<br />
Process Control and Geotechnology, Letna 9, 042 00 Kosice,<br />
Slovakia,<br />
veres@saske.sk<br />
Introduction<br />
Heavy metals contamination occures in aqeous waste<br />
streams of many industries, such as metal plating facilities,<br />
mining operations, tanneries etc. Heavy metals are not biodegradable<br />
and tend to accumulate in living organisms, causing<br />
various diseases and disorders and environmental problems.<br />
Treatment processes for metals contaminated waste streams<br />
include chemical precipitation, ion exchange, membrane<br />
separations (ultrafiltration, reverse osmosis, electrodialysis)<br />
and adsorption. natural materials that are available in large<br />
quantities, or certain waste products from industrial or agricultural<br />
operations, may have potential as inexpensive sorbents.<br />
Due to their low cost, after these materials have been<br />
expended, they can be disposed of without expensive regeneration.<br />
Cost is an important parameter for comparing the<br />
sorbent materials. Adsorption is considered to be the simplest<br />
and most cost-effective technique. The removal of heavy<br />
metal ions from industrial wastewaters using different adsorbents<br />
is currently of great interest 1 .<br />
Zeolites are naturally occuring hydrated aluminosilicate<br />
minerals. They belong to the class of minerals known<br />
as “tectosilicates”. The structures of zeolies consist of threedimensional<br />
frameworks os SiO 4 and AlO 4 tetrahedron. This<br />
structure causes zeolite to have negatively charged surface.<br />
The negative charge is balanced by the exchangable cation<br />
(calcium, sodium or potassium). The fact that zeolite exchangeable<br />
ions are relatively harmless makes them particularly<br />
suitable for removing undesirable heavy metal ions from<br />
industrial effluent waters. 2–4<br />
The zeolite samples from different regions show different<br />
behaviour in ion-exchange processes 5 . The ion exchange<br />
process in zeolites is influenced by several factors such as<br />
concentration and nature of cations and anions, pH value and<br />
crystal structure of the zeolite. In this study, the adsorption<br />
properties of the natural zeolite and synthetic zeolite Slovakite<br />
® with respect to some heavy metal cations in solution<br />
were investigated 6 .<br />
Experimental<br />
M a t e r i a l s a n d C h e m i c a l s<br />
A natural zeolite was obtained from Slovakia (nizny<br />
Hrabovec). The main phase is clinoptilolite and the chemi-<br />
s503<br />
cal compositions are SiO 2 (73.42 %), Al 2 O 3 (1<strong>2.</strong>43 %), CaO<br />
(<strong>2.</strong>94 %), K 2 O (<strong>2.</strong>61 %) and Fe 2 O 3 (1.05 %). The synthetic<br />
zeolite Slovakite ® is patented product and the chemical composition<br />
is unrevealed by the producent.<br />
Inorganic chemicals were supplied as analytical reagents<br />
and deionized water was used. The studied metal ions were<br />
Pb 2+ , ni 2+ , Cu 2+ and Zn 2+ . Solution of lead and nickel was prepared<br />
by using their nitrate salts, Pb(nO 3 ) 2 , ni(nO 3 ) 2 .6H 2 O.<br />
The solution of copper and zinc was prepared from their sulphate<br />
salts, CuSO 4 . 5H2 O, ZnSO 4 . 7H2 O.<br />
A d s o r p t i o n T e s t s<br />
The ion exchange of heavy metals on natural zeolite and<br />
on synthetic zeolite Slovakite ® were carried out using the<br />
batch metod. Batch adsorption experiments were conducted<br />
using 2 g of adsorbent with 200 ml of solutions in flasks containing<br />
heavy metal ions of desired concentrations at constant<br />
temperature (25 °C). The initial concentration of heavy<br />
metals in stock solutions was in the range at 5–1,000 mg dm –3 .<br />
Sorption experiments were carried out at pH 5.5. The flasks<br />
were then agitated in an orbital shaker at a speed of 200 rpm<br />
for a period of 2 h. The quantity of elements in solution has<br />
been determined both before the introduction of sorbent and<br />
after the equilibrium time of 24 hours by AAS.<br />
The amount of adsorbed metal was calculated using the<br />
equation:<br />
q<br />
eq<br />
c 0 –ceq<br />
= (1)<br />
c<br />
s<br />
where c 0 and c eq [mg dm –3 ] are the concentrations of the metal<br />
ion in initial and final solutions and c s [g dm –3 ] is the sorbent<br />
concentration.<br />
Results and Discussion<br />
A d s o r p t i o n o f M e t a l s o n n a t u r a l<br />
Z e o l i t e<br />
The adsorption of Pb 2+ , ni 2+ , Cu 2+ , and Zn 2+ onto<br />
natural zeolite as a function of their concentrations was<br />
studied at 25 °C by varying the metal concentration from<br />
5 to 1,000 mg dm –3 while keeping all other parameters constant.<br />
The experimental data were modeled with Langmuir,<br />
Freundlich and Redlich-Peterson isotherms. The adsorption<br />
isotherms which are the most suitable to fitting the adsorption<br />
processes on natural zeolite in single system are shown<br />
in Figs. 1. and <strong>2.</strong> The isotherm analyses showed different<br />
adsorption behaviour for Pb 2+ , ni 2+ , Cu 2+ and Zn 2+ . Metal<br />
adsorption increased in the following order: Pb 2+ > ni 2+ ><br />
Cu 2+ > Zn 2+ (Figs. 1. and <strong>2.</strong>). Fig. 1. illustrates the dynamic<br />
adsorption process of Cu 2+ and Zn 2+ on natural zeolite. As<br />
shown Fig. 1., the maximum sorption capacity of natural<br />
zeolite was already exhausted (the equilibrium capacity was<br />
achieved) when the metal concentration in solution was in<br />
low range. Fig. <strong>2.</strong> presents that the sorption capacity of sorbent<br />
was not expended even by the highest initial concentration<br />
of Pb 2+ and ni 2+ in solution.
Chem. Listy, 102, s265–s1311 (2008) Environmental Chemistry & Technology<br />
Fig. 1. Adsorption isotherms of Cu 2+ and Zn 2+ on natural zeolite<br />
Fig. <strong>2.</strong> Adsorption isotherms of Pb 2+ and Ni 2+ on natural zeolite<br />
The Langmuir and Freundlich models effectively<br />
described the sorption data with all R 2 values > 0.95.<br />
A d s o r p t i o n o f M e t a l s o n S y n t h e t i c<br />
Z e o l i t e S l o v a k i t e ®<br />
The adsorption of Pb 2+ , ni 2+ , Cu 2+ , and Zn 2+ onto synthetic<br />
zeolite Slovakite ® as a function of their concentrations<br />
was studied in the same conditions as on natural zeolite.<br />
Figs. 3. and 4. illustrate the adsorption isotherms of selected<br />
heavy metals on Slovakite® in single component system.<br />
Comparing the two isotherms on Fig. 3., Cu 2+ adsorption is<br />
usually higher than Zn 2+ . For Zn 2+ , equilibrium adsorption<br />
approaches the value of 42 mg g –1 while for Cu 2+ equilibrium<br />
adsorption still shows higher value than 130 mg g –1 . Fig. 4.<br />
shows a comparison of Pb 2+ and ni 2+ adsorption. For both<br />
metals, equilibrium adsorption still shows an increasing trend<br />
at higher equilibrium concentrations. The cations sorbed from<br />
the solutions followed the same order as on natural zeolite<br />
but the sorption capacity of Slovakite ® was much higher.<br />
The Langmuir and Freundlich models effectively<br />
described the sorption data with all R 2 values > 0.98.<br />
Conclusions<br />
These results show that natural zeolite from nizny Hrabovec<br />
and Slovakite ® can be used effectively for the removal<br />
s504<br />
Fig. 3. Adsorption isotherms of Cu 2+ and Zn 2+ on synthetic<br />
zeolite Slovakite ®<br />
Fig. 4. Adsorption isotherms of Pb 2+ and Ni 2+ on synthetic zeolite<br />
Slovakite ®<br />
of heavy metal cations from solutions. Best sorption capacity<br />
was obtained on synthetic zeolite Slovakite ® , decrease in this<br />
order Pb 2+ > ni 2+ > Cu 2+ > Zn 2+ .The selectivity sequence of<br />
cations is the same on both sorbents, but the sorption capacity<br />
of synthetic zeolite is much higher. The main disadvantage of<br />
synthetic zeolite Slovakite ® its higher cost.<br />
This work has been supported by Scientific Grant Agency<br />
VEGA, project no. 1/4184/07.<br />
REFEREnCES<br />
1. Bailey S. E., et al.: Wat. Res. 33(11), 2469 (1999).<br />
<strong>2.</strong> Barer R. M.: Zeolites and Clay Minerals as Sorbent and<br />
Molecular Sieves, Academic Press, new York, 1987.<br />
3. Breck D. W.: J. Chem. Edu. 41, 678 (1964).<br />
4. Hafez M. B., nazmy A. F., Salem F., Eldesoki M.: J.<br />
Radioanal. Chem. 47, 115 (1978).<br />
5. Matik M., Václavíková M., Gallios G., Hredzák S., Ivanicova<br />
L.: Chem.listy 99, 49 (2005).<br />
6. Vereš J.: Diploma thesis. Technical University in Košice,<br />
Slovakia, Košice 2007.
Chem. Listy, 102, s265–s1311 (2008) Environmental Chemistry & Technology<br />
P83 FuNGICIDAL EFFECT OF PRINTED<br />
TITANIuM DIOxIDE LAyERS<br />
MáRIA VESELá, MICHAL VESELý, PETR DZIK,<br />
JAnA CHOMOUCKá and LEnKA ŠUPInOVá<br />
Brno University of Technology, Faculty of Chemistry, Purkyňova<br />
118, 612 00 Brno, Czech republic,<br />
vesela@fch.vutbr.cz<br />
Introduction<br />
Microorganisms are crucial and inevitable part of life on<br />
Earth. They are found basially everywhere – in air, soil, in<br />
animal and human bodies, even in places with extreme conditions.<br />
Microbial contamination is a serious issue which has<br />
to be dealt with in numerous cases of everyday life. Various<br />
sterilization and dissinfecting methods have therefore been<br />
developed so far.<br />
Photocatalytic processes on thin layers of titanium dioxide<br />
represent a new approach to the everlasting struggle<br />
against microbial contamination. Reactive oxygen species<br />
generated on the surface of irradiated TiO 2 inactivate most<br />
type of microbes 1 . Apparently, titanium dioxide coated surfaces<br />
self-reducing the population of microbes to minimal level<br />
and preventing their growth would be of a great importance.<br />
Most photodegradation reactions on organic substrates<br />
are based on the oxidative power of photoinduced electronic<br />
holes or are mediated by HO • radicals. Such reaction usually<br />
lead to a complete mineralization of organic substrate to carbon<br />
dioxide and water. However, it is necessary to provide a<br />
reducible reactant (i.e. electron acceptors) which would react<br />
with photogenerated electrones. In most cases of photocatalytic<br />
degradation reactions, oxygen is present and it acts<br />
as primary electron acceptor. Oxygen is thus transformed to<br />
superoxide radical (O 2 •– ) and in this way a hydroxyl radical<br />
can be produced:<br />
TiO (h ) + H O → TiO + HO + H<br />
+ • +<br />
2 vb 2 ads 2 ads<br />
TiO (e ) + O + H → TiO + HO ↔ O + H<br />
– + • • – +<br />
2 cb 2ads 2 2 2<br />
(1)<br />
Experimental<br />
M a t e r i a l a n d M e t h o d s<br />
Sol and substrate preparation. Sol-gel technique<br />
was applied to titanium dioxide thin films preparation using<br />
titanium(IV) propoxide as titanium precursors. A mixture<br />
of absolute ethanol and acetylacetone (ACAC) was added<br />
to titanium(IV) propoxide (TTP) under continuous stirring.<br />
Then a small amount of water in ethanol was dropped at<br />
last to the previously mixed solution. Soda lime glass plates<br />
with sizes of 50 × 50 × 1.5 mm were chosen as a substrate for<br />
immobilization of TiO 2 thin films. Soda lime glasses were<br />
treated in boiling 9M sulphuric acid. Before the preparation<br />
of the thin films, each glass was pre-treated in order to eli-<br />
(2)<br />
(3)<br />
s505<br />
minate the dust, grease and other residues using liquid surfactants<br />
and dried under air flow.<br />
Sol application was performed in a novel innovative<br />
way utilizing a modified office inkjet printer. Ink cartridges<br />
were removed from the printer and the ink tubing and printhead<br />
were flushed and purged with anhydrous propanol.<br />
“Virgin empty” spongeless carts were supplied by MIS Associates,<br />
USA. Sol was filtered through 0.2 μm mesh size<br />
syringe filter and loaded into one “virgin empty” cart. This<br />
cart was installed into the printer in the black position and after<br />
a series of head cleaning cycles a perfect nozzle check pattern<br />
was obtained. Cleaned glass plates were then mounted<br />
into a modified CD holder, fed into the printer and printed<br />
with “black only” driver setting. The colour of the printed<br />
pattern was varied in different shades of grey (100 %, 95 %,<br />
90 %, 80 %, 70 %, 60 %) and thus glasses with varying sol<br />
loading were printed. The resolution, print speed and media<br />
settings were also varied and their influence on the resulting<br />
TiO 2 layer properties was evaluated. Two way of printer setting<br />
were chosen for thin layer of TiO 2 preparation – slow (S)<br />
and rapid (R). The sample marked as 100 R corresponds to<br />
100 % of sol loadings printed by rapid way.<br />
Layer treatment. After this procedure, the coated glass<br />
plates were dried in the oven at 110 °C for 30 min. Finally,<br />
the deposited layers were thermally treated in a calcination<br />
furnace at 450 °C for 4 hours.<br />
P h o t o c a t a l y t i c I n a c t i v a t i o n o f<br />
Y e a s t s<br />
A 24-hour culture of yeast Candida vini CCY 29-39-3<br />
(provided by Slovak Yeast Collection, Bratislava) was prepared<br />
at 25 °C. After the cultivation, 10 ml of culture medium<br />
was sampled into a plastic test tube, rinsed twice and centrifuged<br />
at 4,000 rpm for 6 minutes. The supernatant was discarted<br />
and the yeast sediment was diluted with 1 ml of distilled<br />
water an throroughly mixed.<br />
A titanum dioxide coated glass plate was irradiated by<br />
UV lamp for 30 minutes in order to obtain a superhydrophilic<br />
surface. 25 μl of diluted yeast suspension was pipetted onto<br />
the glass plate and evenly spread across its surface. Then the<br />
glass plate with yeast suspension was placed in a sreaction<br />
chamber. The chamber consisted of a Petri dish with reflective<br />
aluminum foil bottom and quartz glass cover. A few<br />
drops of water were aplse placed into the reaction chamber in<br />
order to maintain the humidity.<br />
The reaction chamber was irradiated by 4 fluorescent<br />
lamps Sylvania Lynx-S 11 W with emission maximum at<br />
350 nm. The irradiation intensity was 1 mW cm –2 within<br />
290–390 nm spectral region. Irradiated samples were dyed<br />
and observed by fluorescent microscopy.<br />
S u r v i v a l R a t i o C a l c u l a t i o n<br />
The exposed yeast suspension was mixed with 25 μl acridine<br />
orange solution (1 × 10 –4 mol dm –3 ) in phosphate buffer<br />
of pH = 6. After thorough mixing, the sample was observed<br />
with epi-fluorescent microscope nikon Eclipse E200.
Chem. Listy, 102, s265–s1311 (2008) Environmental Chemistry & Technology<br />
20 digital images of randomly chosen different places ocross<br />
the glass plate were recorded using CCD camera PixeLInK<br />
PL-A662 mounted on the nikon microscope. At every recorded<br />
image, the number of living cells N L (green flurescence)<br />
and dead cells N D (orange fluorescence) was counted. Then,<br />
the survival ratio SR was calculated:<br />
NL<br />
SR =<br />
N +<br />
L D<br />
Results<br />
After irradiating Candida vini suspension deposited on<br />
the 100 R glass plate a significant inactivation was observed<br />
– the SR dropped to 0.032 ± 0.023 within 70 minutes. On the<br />
other hand, the non-irradiated sample showed no inactivation<br />
within 70 minutes. These observations are in a good compliance<br />
with the results of Seven et al. 4 , who also observed<br />
no inactivation of microbes on titanium dioxide in darkness.<br />
Only very small inactivation was observed on an irradiated<br />
bare glass without the catalyst layer. (Figs. 1., <strong>2.</strong>).<br />
These results are in agreemnet with the observations<br />
made by Kühna et al. 3 , who irradiated bacteria Pseudomonas<br />
aeruginosa on a glass plate covered with titanium dioxide.<br />
They found out that bacreial cell inactivation takes place.<br />
This phenomenon was explained to be caused by the oxidative<br />
stress of oxygen radicals inside cells during the exposure<br />
by UV-A radiation. Once the stress rises over a certain<br />
threshold, the cell dies.<br />
Fig. 1. SR comparison for Candida vini at different conditions<br />
on R substrates<br />
A constant decrease of SR in a certain time from the<br />
reaction start was observed by Benabbou et al. 2 in the case of<br />
Escherichia coli. Cell mebrane damage resulting from photocatalytical<br />
processes leads to an increase in membrane permaebility<br />
and eventually to free outflow of cell fluids. Therefore<br />
both bacterial cells as well as molecules of intracellural<br />
organels can become the substrate of reactive oxygen species<br />
(ROS) attack. ROS react simultaneously with the cytoplasmatic<br />
membrane of living cells and with the remains of dead<br />
(4)<br />
s506<br />
Fig. <strong>2.</strong> SR comparison for Candida vini at different conditions<br />
on S substrate<br />
cells (polysycharides, lipids) at the same time. Our results<br />
also confirm this hypothesis.<br />
When we compare the inactivation rates for Candida vini<br />
on R and S substrates (Fig. <strong>2.</strong> and Fig. 1.) it becomes clear<br />
that the inactivation rate of Candida vini does not depent on<br />
the structure and topology of the catalyst layer, as long as the<br />
glass surface is well couted by titanium dioxide.<br />
Conclusions<br />
When comparing the photocatylic inactivation rate of<br />
Candida vini on two types of immobilised catalyst (rapidly<br />
printed and slowly printed titanium dioxide layers) it is<br />
possible to conclude that significant inactivation was observed<br />
on glass plates with very high sol loading, i.e. with very<br />
well covered surface (samples 100 R, 95 R, 95 S). We also<br />
observe a certain decrease in the inactivation rate after reachicg<br />
the SR value of appr. 50 %. This might be caused by the<br />
simultaneous consuption of ROS both by the still living cells<br />
membrane as well as the organic remains of already killed<br />
cells. Almost constant SR value between 25 and 35 minutes<br />
suggest a competitive reaction pathway.<br />
Authors thank to Ministry of Education, Youth and Sports<br />
of Czech Republic for support by project MSM0021630501.<br />
REFEREnCES<br />
1. Huang n., Xiao Z., Huang D., Yuan Ch.: Supramol. Sci.<br />
5, 559 (1998).<br />
<strong>2.</strong> Benabbou A. K., Derriche Z., Felix C., Lejeune P., Guillard<br />
C.: Appl. Catal. B Environ. 76, 257 (2007).<br />
3. Kühn K. P., Chaberny I. F., Massholder K., Stickler M.,<br />
Benz V. W., Sonntag H-G., Erdinger L.: Chemosphere<br />
53, 71 (2003).<br />
4. Seven O., Dindar B., Aydemir S., Metin D., Ozinel M.<br />
A., Icli S.: J. Photochem. Photobiol. Chem. 165, 103<br />
(2004).
Chem. Listy, 102, s265–s1311 (2008) Environmental Chemistry & Technology<br />
P84 PhOTOCATALyTIC DISINFECTION OF<br />
wATER uSING Ag/TiO 2<br />
MáRIA VESELá, MICHAL VESELý, JAnA<br />
CHOMOUCKá and MICHAELA LIPEnSKá<br />
Brno University of Technology, Faculty of Chemistry, Purkyňova<br />
118, 612 00 Brno,<br />
vesela@fch.vutbr.cz<br />
Introduction<br />
Photocatalytic oxidation of organic compounds represents<br />
a major potential to be applied in environmental technologies.<br />
The photocatalytic process is capable to decompose<br />
most organic matter to water and carbon dioxide. Conventional<br />
cleaning technologies such as ozonization or chlorination<br />
have their limits. For example, ozone decomposes readily<br />
and chlorine, which is used widely for the dissinfection of<br />
drinking water, can react with organic compounds to form<br />
toxic byproducts 1. Methods utilizing ozone a UV radiation<br />
are expensive and often technically challenging.<br />
Reactive oxygen radicals are are produced in the presence<br />
of adsorbed oxygen and electron donor. These radical<br />
can cause rapid microbe cell death and at the same time<br />
decompose organic compounds.<br />
The fungicidal effect of TiO 2 can be mediated by the<br />
presence of a noble metal, such as silver, at the catalyst surface<br />
1 . Therefore, the deposition of silver nanoislets on the catalyst<br />
surface can lead to the production of a highly effective<br />
dissinfecting agent.<br />
Experimental<br />
M u l t i - T u b e F l o w R e a c t o r<br />
Suspension of yeast was colected in 3-neck flask and<br />
was circulated with peristaltic pump through tubes irradiated<br />
by 4 Sylvania LYnX lamps with total power output 44<br />
W (Fig. 1.). A flow rate was 50 ml min –1 . A transmitance of<br />
glass wall of tubes was 93 % at maximum light output of Sylvania<br />
LYnX lamp at 350 nm. Irradiance was maintaned at<br />
1.0 mW cm –2 by lamp distance adjustment.<br />
The inner walls of reactor were covered by titanium dioxide<br />
layer using sol-gel process based on tetraisopropoxide<br />
solution stabilized with acetoecetone. The inner glass walls<br />
were coated by dip-coating method. For experiment with Ag/<br />
TiO 2 the metallic silver was deposited on TiO 2 layer by photocatalytic<br />
process from silver nitrate solution wih ethanol.<br />
Tubes with 1.2 % mol. and <strong>2.</strong>4 % mol. of silver were<br />
prepared.<br />
Y e a s t S u s p e n s i o n a n d C F U<br />
E v a l u a t i o n<br />
The yeast Hansenula anomala CCY 38-1-30, supplied<br />
by Slovak Collection of Yeasts, Bratislava, was cultivated<br />
in malt extract at 28 °C. After 24 hours a 10 ml was taken<br />
into test-tube for centrifugation. The pelets were washed<br />
with sterile distilled water and centrifugated. This process<br />
was repeated twice. The pelets were resuspended in 10 ml of<br />
s507<br />
Fig. 1. Multi-tube flow reactor: 1 – Sylvania LYNX lamps<br />
(4 × 11 W), 2 – tubes, 3 – multi-neck flask with yeast suspension<br />
(250 ml), 4 – peristaltic pump<br />
water and number of cells was calculated using Bürker chamber.<br />
This suspension was used for preparation of suspnesions<br />
with various cell concentration.<br />
From the multi-tube flow reactor were taken samples in<br />
regular intervals. number of colony forming units (CFU) was<br />
evaluated by indirect way: 100 μl of sample was spread on<br />
malt extract agar in 3 Petri dishes. After 48 hours of cultivation<br />
a number of colonies were enumerated and an average<br />
value was expresed as CFU ml –1 .<br />
Results<br />
We conducted experiments with photocatalytic inactivation<br />
of yeast cells in a multi-tube flow reactor with varying<br />
concentrations of cells (500 to 5,000 CFU ml –1 ). We showed<br />
that during the experiment, the number of viable yeast cells<br />
decreases. The cell wall of Hansenula anomala is quite thick<br />
with a rigid structure, therefore we can expect it to be very<br />
resistant against ROS attact. nevertheless, a total cell inactivation<br />
was achieved within 160 minutes.<br />
We also observed the photocatalytic inactivation of<br />
Hansenula anomala (Fig. <strong>2.</strong>) on TiO 2 photocatalyst layer<br />
overcoated with a very small amount of metallic silver. We<br />
also observed a decrease in the size of colonies grown from<br />
survivng cells. This phenomenon was noted also by Erkan et<br />
al. 6 , who described diminishing colonies of Saccharomyces<br />
cerevisiae after irradiation in TiO 2 . In this case, however,<br />
the titanium dioxide was overcoated with paladium and the<br />
diminishment is believed to be caused by the weakening of<br />
surviving cells.<br />
It is well known that pure silver, copper, zinc and their<br />
ions pose antimicrobial properties. If these metals are deposited<br />
onto TiO 2 thin films, their antimicrobial effect will act<br />
together with the antimicrobial effect of bare TiO 2 . We can<br />
expect the metallic silver to prevent elcetron-hole recombination<br />
on the surface of the photocatalyst and thus improve the<br />
efficiency of the photocatalytic process. In this case the pho-
Chem. Listy, 102, s265–s1311 (2008) Environmental Chemistry & Technology<br />
tocatalyst would ensure the surface sterility upon the irradiation<br />
by UV and metal ions will do their job in the darkness 7 .<br />
According to Semikin a Skulachev, the interaciton of Ag + a<br />
SH groups of respiratory enzymes can lead to cell membrane<br />
permeability changes, resulting into major disorders in the<br />
whole cell. Apart from the membrane permaebility change, a<br />
cell-membrane separation is possible as well. Eventually, the<br />
possibility of Ag + addition to the bacterial genetic material<br />
was reported, too 4 .<br />
Fig. <strong>2.</strong> Photocatalytic inactivation of Hansenula anomala cells<br />
on TiO 2 and Ag/TiO 2 layers in multi-tube flow reactor<br />
We showed that yeast cells of Hansenula anomala are<br />
not capapble of regeneration, which is otherwise usual, especially<br />
in the case of bacteria. The cells are probably damaged<br />
in such extend that they loose their reproduction ability. Identical<br />
effect was observed on combined surface of Ag/TiO 2<br />
(Fig. 3.).<br />
Conclusions<br />
The collected result indicate that it is possible to photocatalytically<br />
inactivate cells even with a very rigid cell wall<br />
(Hansenula anomala). In this way, a complete photocatalytic<br />
dissinfection of water can be performed. A very small amount<br />
of metallinc silver deposited on the surface of titanium dioxide<br />
photocatalyst enhanced the inactivation rate.<br />
s508<br />
Fig. 3. Photocatalytic inactivation of Hansenula anomala cells<br />
on Ag/TiO 2 layer in multi-tube flow reactor. The lamp was powered<br />
off after 120 minutes<br />
We also showed that in the case of Hansenula anomala,<br />
the surviving cells are not able to reproduce after the irradiation<br />
is terminated. The cells lose their reproduction ability.<br />
Similarly, the cells lose their reproduction ability after their<br />
irradiation on TiO 2 surface doped with silver islets (1.2 a<br />
<strong>2.</strong>4 % mol. silver).<br />
Authors thank to Ministry of Education, Youth and Sports<br />
of Czech Republic for support by project MSM0021630501.<br />
REFEREnCES<br />
1. Kubacka A., Ferrer M., Martínez-Arias A., Fernández-<br />
Garciá M.: Appl. Catal. B Environ. 2007, in press<br />
<strong>2.</strong> Yip H. Y., Yu J. C. M., Chan S. C., Zhang L. Z., Wong P.<br />
K.: J. Water Environ. Tech. 3, 47 (2005).<br />
3. Keleher J., Bashant J., Heldt n., Johnson L., LI Y.: World<br />
J. Microbiol. Biotechnol. 18, 133 (2002).<br />
4. Semeykina A. L., Skulachev V. P.: FEBS Lett. 269, 69<br />
(1990).<br />
5. Pratap Reddy M., Venugopal A., Subrahmanyam M.:<br />
Water res. 41, 379 (2007).<br />
6. Erkan A., Bakir U., Karakas G.: J. Photochem. Photobiol.<br />
Chem. 184, 313 (2006).
Chem. Listy, 102, s265–s1311 (2008) Environmental Chemistry & Technology<br />
P85 LAbORATORy STuDy OF ARSENIC<br />
MObILITy IN STREAM SEDIMENTS AND<br />
IMPOuNDMENT MATERIAL uSING COLuMN<br />
ExPERIMENTS<br />
VEROnIKA VESELSKá and EDGAR HILLER<br />
Comenius University in Bratislava, Faculty of Natural<br />
Sciences, Department of Geochemistry, Mlynská dolina,<br />
842 15 Bratislava, Slovak Republic,<br />
veselska@fns.uniba.sk<br />
Introduction<br />
High arsenic contents in the impoundment situated near<br />
the village of Poša in the upper part of the catchment of the<br />
Kyjov brook in eastern Slovakia, represent an environmental<br />
problem because of As mobilization and transport from<br />
the impoundment material and significant contamination<br />
of surface water of the Kyjov brook (the mean As values<br />
of 11,385 μg As dm –3 , 1,778 μg As dm –3 and 295 μg As dm –3<br />
measured in the Kyjov brook during 2000, 2005 and 2007<br />
respectively) 1 . Decreasing concentrations of As in surface<br />
water are involved in delimited using of impoundment in last<br />
few years.<br />
Arsenic distribution in different stream sediment constituents<br />
and its mobilization determine As concentration in<br />
aquatic environment and affect its bioavailability and toxicity<br />
to the biosphere 2,3 .<br />
The major processes controlling As leaching from sediments<br />
to natural waters include mineral (co)precipitation/<br />
dissolution, adsorption/desorption, chemical and biological<br />
transformations. The conditions present such as pH, redox<br />
potential, solution composition, the sediment properties and<br />
mineralogical composition of the sediment determine the<br />
dominant processes affecting the environmental fate of As in<br />
the stream sediments and ist leaching behaviour 4,5 .<br />
The main objective of this study was to investigate leaching<br />
behaviour of As from the heterogeneous impoundment<br />
material and the three stream sediments and the evaluation of<br />
the total As mobility.<br />
Experimental<br />
The samples used in this work are either the stream<br />
sediments of the Kyjov brook taken at the distance of 100,<br />
1,000 and 2,000 m from the impoundment (denoted as KY-<br />
100, KY-1000 and KY-2000) or the impoundment material<br />
(denoted as KY-0).<br />
Continuous column leaching experiments were conducted<br />
under standard conditions (25 ± 3°C, 101,325 Pa) to<br />
provide information about As release, its binding and desorption<br />
kinetic. The experiments were run in duplicates. Each of<br />
the two glass columns per one sample was filled with 50 g of<br />
a dry sample (a < 1 mm fraction) and columns were during<br />
five days flushed with 1.3 dm 3 of 0.0125M solution, that was<br />
prepared to resemble the composition of surface waters of the<br />
Kyjov brook and contained by 2 × 10 –5 M PO 4 3– , <strong>2.</strong>8 × 10 –3 M<br />
Cl – and 3.2 × 10 –3 M SO 4 2– . The upward flow was regulated at<br />
s509<br />
a rate of 0.2 ml min –1 . During the experiment, 14 samples of<br />
leachates were collected from each of the columns, pH values<br />
were measured and the concentrations of As were determined<br />
by graphite furnace atomic absorption spectrometry (Perkin-<br />
Elmer 4110 ZL).<br />
Results<br />
The results of the column experiments showed that<br />
theAs release from the solid samples was likely controlled<br />
by Fe and Mn oxohydroxides, pH values of the geosorbents<br />
and leachates and also organic carbon content. It was also<br />
observed that the time was an important factor influencing<br />
the As release.<br />
Significant correlations of the amounts of As released<br />
from the solid samples with its total contents (r = 0.975,<br />
P < 0.05) (Fig. 1.) as well as with total organic carbon contents<br />
(r = 0.942; P < 0.05) were found. The total organic carbon<br />
content was measured using a Leco RC-412 multiphase<br />
determinator at 550 °C.<br />
The impoundment material (KY-0) has the highest total<br />
organic carbon content (37 %), which is likely attributed to<br />
the fact that stored sludge consists of fly ashes derived from<br />
coal and chemical waste combustion. Alkaline character of<br />
the KY-0 (pH = 8.55) as well as high leachate pH (pH ~ 9.0)<br />
enhance release of As and its transport to the liquid phase.<br />
The results of various studies showed that the amounts of As<br />
oxyanions released from different solid geosorbents increase<br />
in alkaline conditions, mainly when pH > 8(ref. 6 ) The maximum<br />
As concentration in column leachates from KY-0 was<br />
determinated after 25 hours, when the easily soluble fraction<br />
of As weakly bound on the solid surface was released. The<br />
late hindered As release from KY-0 could be caused by the<br />
presence of mullites and vitreous phases. It is suggested here<br />
that some fraction of As may be only hardly available to be<br />
released because of its strong binding within the heterogenous<br />
components.<br />
Fig. 1. Relationships between the amounts of As released and<br />
total contents of As, Fe as a ammonium-oxalateextractable Alox,<br />
Feox in the log-log form
Chem. Listy, 102, s265–s1311 (2008) Environmental Chemistry & Technology<br />
notably high accumulation of trace elements including<br />
As in the most contaminated sample KY-100 (3,208 mg As kg –1 )<br />
with the lowest relative mobility, is likely due to high contents<br />
of the Fe, Al, Mn oxohydroxides. The relative mobility<br />
of As was inversely related to the oxalate-extractable<br />
Mn content (r = –0.960, P < 0.05) and not significantly to the<br />
oxalate-extractable Fe content such that diffusion in hydrated<br />
micropores of amorphous Fe and Mn oxides might be the rate<br />
limiting mechanism of the As release (Fig. <strong>2.</strong>).<br />
Fig. <strong>2.</strong> Relationship between the relative mobility of As and the<br />
ammonium oxalate-extractable Mn, Fe contents in the log-log<br />
form<br />
The amount of As released from samples KY-1000 and<br />
KY-2000 increased rapidly within short extraction times, reaching<br />
the apparent equilibrium after 174 min. The relative<br />
mobility of As in KY-1000 and KY-2000 was approximately<br />
s510<br />
the same as in impoundment material although the total Fe,<br />
Mn contents in KY-1000, 2000 are 2-times lower as compared<br />
with KY-0. The total contents of elements Cd, Cr, Fe, Hg,<br />
Mn, Pb, Zn, Al, As and Sb were determined after digestion<br />
with acid mixture.<br />
Conclusions<br />
The fractions of As released in column experiments were<br />
generally less than 10 % (5.32–7.83 %) of its total contents,<br />
but they represented high absolute amounts of readily available<br />
and water-soluble As (83 mg kg –1 ). The fraction released<br />
from the source impoundment material (132 mg kg –1 ) represented<br />
high As concentration in its leachates, reaching up to<br />
8,000 μg dm –3 . As concentrations in the leachates from all<br />
the samples exceed maximum permissible level in drinking<br />
water (10 μg dm –3 ; Decision of the Slovak Health Ministry<br />
no. 151/2004).<br />
This work has been supported by the Slovak Grant<br />
Agency under VEGA project No.1/2037/05.<br />
REFEREnCES<br />
1. Jurkovič ľ., Kordík J., Slaninka I.: Slovak Geol. Mag.<br />
12, 31 (2006).<br />
<strong>2.</strong> Tao Y., Zhang S., Jian W., Yuan CH., Shan X.: Chemosphere<br />
65, 1281 (2006).<br />
3. Williams L. E., Barnett M. O., Kramer T. A., Melville<br />
J. G.: J. Environ. Qual. 32, 841 (2003).<br />
4. Gao S., Fujii R., Chalmers A. T., Tanji K. K.: Soil Sci.<br />
Soc. Am. J. 68, 89 (2004).<br />
5. Smith E., naidu R., Alston A.M.: J. Environ. Qual. 31,<br />
557 (2002).<br />
6. Ganne P., Cappuyns V., Vervoort A., Buvé L., Swennen<br />
R.: Sci. Total Environ. 356, 69 (2006).
Chem. Listy, 102, s265–s1311 (2008) Environmental Chemistry & Technology<br />
P86 ANTIbIOTICS IN ThE ENVIRONMENT<br />
H. VíTEČKOVá, L. VYDROVá, D. VELEBOVá, M.<br />
VáVROVá and L. MRAVCOVá<br />
Brno University of Technology, Faculty of Chemistry, Purkyňova<br />
118, Brno 612 00, Czech Republic,<br />
viteckova@fch.vutbr.cz<br />
Introduction<br />
Tetracyclines (TC) present a class of antibacterial<br />
drugs. Due to their broad antibacterial spectrum and economic<br />
advantages, tetracyclines have been commonly used in<br />
veterinary medicine and in human medicine for the purpose<br />
of prevention and treatment of disease. However, their widespread<br />
utilization could lead to TC residues in animal-originated<br />
food and in the environment. The antibiotics in food<br />
and water consumed for long periods can also cause problems<br />
regarding the spread of drug-resistant microorganisms 1 .<br />
It is well known that the principal pathway of antibiotics<br />
into the aquatic environment is via wastewater systems following<br />
consumption and excretion by humans, and via effluents<br />
from landfills and farms 2 . Presently conventional wastewater<br />
treatment plants (WWTPs) were designed without<br />
consideration of antibiotics removal from wastewater. Many<br />
previous studies have shown that, while some antibiotics<br />
may be eliminated in the WWTPs, some other may be hardly<br />
removed in the process, therefore they can reach the aquatic<br />
environment 3,4 . Due to irremovable antibiotics, wastewater<br />
treatment plants become an important point source of emissions<br />
into the environmen 1,2,3 .<br />
Experimental<br />
To monitor the tetracycline residues a reliable method is<br />
needed. SPE for purification and preconcentration of analytes<br />
was used. Spectrophotometric method for antibiotic determination<br />
was used.<br />
S a m p l i n g<br />
Waste water samples have been taken from the waste<br />
water treatment plant (WWTP) in the University of Veterinary<br />
and Pharmaceutical Sciences Brno campus in one-day<br />
intervals into amber glass sampling bottles. In this WWTP,<br />
we decided to deal with the antibiotics in particular because<br />
these drugs samples were taken from the WWTP inlet and<br />
compared with the samples taken from WWTP outlet.<br />
The samples were processed immediately or stored<br />
in a refrigerator till the following day.<br />
R e a g e n t s<br />
During the process, the following chemicals have been<br />
used: oxalic acid, p.a. sulfuric acid p.a., dinatrium phosphate<br />
dodecahydrate p.a., all from Lachema, CZ; acetonitrile for<br />
HPLC, methanol for HPLC, from Riedel-de-Haen, SRn; citric<br />
acid, p.a. Onex, CZ; Chelaton III, p.a. Penta,CZ;<br />
Tetracycline, Chlorotetracycline and Oxytetracycline,<br />
standards for HPLC, were from Sigma Aldrich, CZ.<br />
s511<br />
McIlvain buffer: citric acid (1<strong>2.</strong>9 g dm –3 ), natrium salt of<br />
ethylenediaminetetraacetate (37.2 g dm –3 ), dodecahydrate of<br />
dinatrium phosphate (30.2 g dm –3 ) in deionized water<br />
Elution mixture: 20 mmol dm –3 oxalic acid in methanol.<br />
S a m p l e T r e a t m e n t<br />
Samples were filtered using paper filters to remove particles.<br />
Volume of 200 ml samples were extracted 20 minutes<br />
with McIlvain buffer in an ultrasonic bath.<br />
A Phenomenex Strata C18-E SPE column (55 μm,<br />
500 mg 6 ml –1 ) was conditioned with 4 ml of methanol followed<br />
by 3 ml of McIlvain buffer. After sample loading, the<br />
column was washed with 3 ml deionized water. The column<br />
was dried using the vacuum of the SPE manifold. Then the<br />
tetracyclines were eluted with 10 ml of elution mixture.<br />
S p e c t r o p h o t o m e t r i c A n a l y s i s<br />
The analyses were carried out on UV-VIS spectrophotometer<br />
Spectronic Helios (UK). Deuterium and wolfram lamp<br />
was used for determination.<br />
At first the absorption spectrum was measured in the<br />
range 230–450 nm step by step 2 nm. Tetracyclines have two<br />
absorption maximas as resulting from absorption spectrum<br />
and with accordance to published data: 246 nm and 360 nm 4 .<br />
Spectrophotometer was adjusted to zero value through the use<br />
of elution reagent. Subsequently, real samples were measured<br />
to determine the absorbance value at absorption maximum.<br />
Quartz cuvette with optical path 1 cm was used.<br />
Fig. 1. Absorption spectrum of tetracycline in various concentrations<br />
[mg ml –1 ]<br />
Fig. <strong>2.</strong> Concentration of tetracycline in real samples
Chem. Listy, 102, s265–s1311 (2008) Environmental Chemistry & Technology<br />
Results<br />
All tetracyclines have typical absorption spectrum. They<br />
have two characteristical absorption maximas, 264 nm and<br />
360 nm. Due to their characteristic we could determinate<br />
tetracyclines and their metabolites together by spectrophotometry.<br />
Inlet concentrations of analytes were always higher than<br />
outlet concentrations. This indicates that these pharmaceuticals<br />
are removed partially in the wastewater treatment plant.<br />
The change of tetracycline concentration may be caused by<br />
photodegradation.<br />
Conclusions<br />
As the use of pharmaceuticals is increasing, fast sample<br />
preparation and determination method is required.<br />
Samples were taken from wastewater treatment plant<br />
placed in Veterinary and Pharmaceutical university Brno<br />
campus, from inlet and outlet.<br />
s512<br />
Samples were filtered before extraction.<br />
SPE was optimized for preparation and preconcentration<br />
of wastewater samples.<br />
An efficient method for determination of tetracyclines in<br />
wastewater, using spectrophotometry, was developed.<br />
Spectrophotometry was used because this is commonly<br />
used in laboratories and machine operation is cheap.<br />
This work has been supported by grant COST, action<br />
636, project no. OC-183.<br />
REFEREnCES<br />
1. Pavlović D. M. et al.: Trends Anal. Chem. 26, 1062<br />
(2007).<br />
<strong>2.</strong> Hirsch R. et al.: Sci. Tot. Env. 225, 109 (1999).<br />
3. Hernando M. D. et al.: Talanta 69, 334 (2006).<br />
4. Fritz J. W.: Food. Chem. 105, 1297 (2007).
Chem. Listy, 102, s265–s1311 (2008) Environmental Chemistry & Technology<br />
P87 ThE FLuORIMETRIC DETERMINATION OF<br />
ALuMINIuM, GALLIuM AND INDIuM wITh<br />
8-hyDROxyQuINOLINE-5-SuLPhONIC ACID<br />
IN AQuEOuS AND SubMICELLAR MEDIuM<br />
ŠIMOn VOJTA and LUMíR SOMMER<br />
Institute of Environmental Protection, Faculty of Chemistry,<br />
Brno University of Technology, Purkyňova 118, 612 00 Brno,<br />
Czech Republic,<br />
halapaloosa@email.cz<br />
Introduction<br />
The complexing and analytical properties of 8-Hydroxyquinoline-5-sulphonic<br />
acid (QSA) are similar to 8-Hydroxyquinoline<br />
but the solubility of complexes in aqueous solutions<br />
increases and no fluorescence of the reagent in the large<br />
pH interval has been observed. The QSA was formerly used<br />
as a fluorogenic reagent for a number of metal ions including<br />
Mg 2+ , Zn 2+ , Cd 2+ , Ce 3+ and Al 3+ (ref. 1 ). The fluorimetry<br />
of Gallium and Indium complexes in aqueous solutions was<br />
only briefly mentioned.<br />
The fluorescence of metal complexes with QSA can be<br />
considerably enhanced in the presence of surfactants in submicellar<br />
and micellar medium 2,3 . The fluorescence properties<br />
of the metal species with QSA were tested in the presence<br />
of surfactants and exploited chromatographically in very low<br />
concentrations.<br />
Thus the cationic surfactants were widely used for the<br />
enhancement of fluorescence of metal complexes with QSA 4 .<br />
The attention was also paid to the fluorimetric determination<br />
of Al with QSA also in mixtures with Zn using derivative<br />
synchronous scan in the presence of surfactant 5 . The Partial<br />
Least Square Method (PLS) in combination with pH gradient<br />
FIA was used in binary mixtures of ions in complexes with<br />
QSA whose fluorescence was enhanced by the surfactant 6 .<br />
In this paper the fluorescent Al 3+ , Ga 3+ and In 3+ complexes<br />
with QSA were studied in detail in the absence and<br />
presence of surfactants and optimal conditions were recommended<br />
for the determination of particular metals in the presence<br />
of Zephyramine. normal and first derivative spectra<br />
were evaluated.<br />
Experimental<br />
I n s t r u m e n t s<br />
Spectrofluorimeter Aminco Bowman, Series 2 with<br />
1 cm quartz cells, 4 nm exit slits, photomultiplier under 450–<br />
850 V. Sample cell was tempered to 20 °C.<br />
The calculation of the first derivative was made by using<br />
the instrument software using Golay-Savitzky 11-point convolution.<br />
C h e m i c a l s<br />
Standards used, Analytica s.r.o., Prague:<br />
Aluminium chloride 1.000 ± 0.002 g dm –3 containing 5 % HCl<br />
Gallium chloride 1.000 ± 0.002 g dm –3 containing 10 % HCl<br />
Indium chloride 1.000 ± 0.002 g dm –3 •<br />
containing 10 % HCl<br />
s513<br />
•<br />
•<br />
•<br />
•<br />
•<br />
•<br />
•<br />
•<br />
•<br />
8-Hydroxyquinoline-5-sulphonic acid hydrate (QSA),<br />
Sigma–Aldrich was used without purification<br />
0.1M Benzyldimethyltetradecylammonium chloride<br />
(Zephyramine ® ) – Sigma-Aldrich Co.<br />
0.1M 1-ethoxykarbonylpentadecyltrimethylammonium<br />
bromide (Septonex ® )–Sigma-Aldrich Co.<br />
0.1M Dodecylbenzyldimethylammonium bromide (Ajatin<br />
® ) – Sigma-Aldrich Co.<br />
1% Didodecyldimethylammonium bromide – Sigma-<br />
Aldrich Co.<br />
1% Polyoxyethylene(23) lauryl ether (Brij 35) – Sigma-<br />
Aldrich Co.<br />
1% Hexadecyltrimethylammonium chloride – Fluka.<br />
1% 4-(1,1,3,3-Tetramethylbutyl)phenyl-polyethylene<br />
glycol (Triton X-100) – Calbiochem Co.<br />
0.1 M Sodium dodecylsulphate (SDS) - BDH Chemicals,<br />
England.<br />
E v a l u a t i o n o f D a t a<br />
The limits of detection X D α and XD β calculated according<br />
to Graham 7 follow from the calibration plots and their<br />
confidence intervals were compared with those from multiple<br />
measurements of the background according to IUPAC 8 .<br />
The stoichiometry of complexes was evaluated by using<br />
the modified continuous variations method 9 in the absence<br />
and presence of cationic surfactant Zephyramine. The fluorescence<br />
was measured for several sums of equimolar solutions,<br />
where c o = c M + c L .<br />
Results<br />
The complexes of 8-Hydroxyquinoline-5-sulphonic acid<br />
with Al, Ga, and In produce an outstanding fluorescence for<br />
wavelengths over 430–600 nm with λ max at 495 nm for Al,<br />
λ max at 504 nm for Ga and λ max at 519 nm for In. The corresponding<br />
excitation λ max are 360 nm, 365 nm and 367 nm.<br />
The fluorescence shows considerable pH dependence which<br />
reaches the maximum in solution with c L = 7.4 × 10 –5 M<br />
Fig. 1. Excitation(a) and emission(b) spectra of Aluminium(III)<br />
in the presence of 7.4 × 10 –5 mol dm –3 QSA at 620 V in dependence<br />
on concentration of Al(III) at ph 4<br />
1 – 1.6 μg cm –3 , 2 – 0.8 μg cm –3 , 3 – 0.4 μg cm –3 , 4 – 0.2 μg cm –3 ,<br />
5 – 0.05 μg cm –3 , 6 – 0 μg cm –3
Chem. Listy, 102, s265–s1311 (2008) Environmental Chemistry & Technology<br />
at pH 4 for Al 3+ , c L = 1.5 × 10 –5 M at pH 3 for Ga 3+ and<br />
c L = 3.5 × 10 –5 M at pH 8 for In 3+ (Figs. 1. and <strong>2.</strong>).<br />
no fluorescence was observed for the sole reagent in this<br />
pH interval.<br />
Fig. <strong>2.</strong> Fluorescence intensity dependence on ph for each complex<br />
(0.3 μg cm –3 of each element) at optimal conditions<br />
The first derivations of the fluorescence and excitation<br />
spectra under the same conditions as the normal spectra with<br />
λ max(em) = 460 nm (AlQSA), λ max(em) = 472 nm (GaQSA)<br />
and λ max(em) = 478 nm (InQSA)are given in Fig. 3. Higher<br />
derivations could not be used because of a big noise of the<br />
instrument.<br />
The calibration plots are stricly linear in solution with<br />
c L = 7.4 × 10 –5 M for Al 3+ at pH 4 or c L = 5.8 × 10 –5 M QSA<br />
for Ga 3+ at pH 3 and c L = 1.78 × 10 –5 M and pH 8 for In 3+ .<br />
Although the calibration plots are strictly linear till<br />
2 μg cm –3 , the meaningful metal concentration range was<br />
0.04–1 μg cm –3 . The decrease of QSA concentration in solution<br />
negatively influence the extent of the linear part of the<br />
calibration plot, the increase of QSA concentration causes<br />
quenching.<br />
There is no considerable difference in the values of detection<br />
limits for normal spectra, derivative spectra and values<br />
in the presence of 0.0012 M cationic surfactant Zephyramine<br />
Fig. 3. The first derivative excitation(a) and emission(b) spectra<br />
of Aluminium(III) in the presence of 7.4 × 10 –5 mol dm –3 QSA<br />
at 620 V in dependence on concentration of Al(III).<br />
1 – 1.6 μg cm –3 , 2 – 0.8 μg cm –3 , 3 – 0.4 μg cm –3 , 4 – 0.2 μg cm –3 ,<br />
5 – 0.05 μg cm –3 , 6 – 0 μg cm –3<br />
s514<br />
when values according to Graham and IUPAC recommendation<br />
are compared.<br />
Cationic surfactants increase considerably the intensity<br />
of fluorescence with no λ max shift, but some little bathochromic<br />
shift (lesser than 20 nm) of excitation maximum is observed.<br />
The fluorescence increase is time dependent and takes<br />
1 hour either during radiation or when the sample is left in<br />
darkness. Since the largest effect of the cationic surfactant is<br />
often observed for the CMC the formation of a fluorescent<br />
ion associate is assumed with the anionic metal complexes.<br />
The fluorescence, however, slowly decreases after reaching<br />
the micellar concentration of the surfactant.<br />
The largest positive effect was found for 0.0012 M<br />
Zephyramine but for the subsequent increase of concentration<br />
a considerable decrease of fluorescence is observed for<br />
all cationic surfactants.<br />
The anionic surfactants such as dodecylsulphate have<br />
a negative influence with the increasing concentration. no<br />
effect is observed for selected non ionic surfactants such as<br />
Triton X 100 and Brij 35, and β-cyclodextrine.<br />
The effect of various surfactants follows from the Fig. 4.<br />
which shows relative fluorescence intensity dependence<br />
on surfactant concentration for GaQSA. The influence of<br />
surfactants for the AlQSA and InQSA is similar to that of<br />
GaQSA complex.<br />
Fig. 4. Surfactants influence on the GaQSA complex at pH 3.<br />
Septonex, Zephyramine, Ajatine, SDS – mol dm –3 , CTAC (hexadecyl<br />
trimethyl ammonium chloride – c/4 [mol dm –3 ], DDAb<br />
(Didodecyldimethyl ammonium bromide), β-Cyklodextrine –<br />
c/5 [mol dm –3 ], Triton x 100 – c/4 × 10 –5 [ppm], brij –<br />
c/15 [mol dm –3 ].<br />
Critical micellar concentrations are highlighted by the fulfilled<br />
marks<br />
The fluorimetric method of continuous variations for at<br />
least two concentrations c o gives unambiguously the simple<br />
mole ratio M : L = 1 : 1 in the Al 3+ , Ga 3+ and In 3+ complexes<br />
at pH 3–4. For the increasing pH 8 and In 3+ a higher complex<br />
is also indicated (Fig. 5.).<br />
In the presence of constant concentration 0.0012 M of<br />
cationic surfactant Zephyramine a ratio M : L = 1 : 3 appears<br />
which may indicate the formation of a ternary species, ML 3 3–<br />
.3 T + .
Chem. Listy, 102, s265–s1311 (2008) Environmental Chemistry & Technology<br />
Fig. 5. Continuous variations of AlQSA complex at ph 4.<br />
1 – c 0 = 1.1 × 10 –4 M, 635 V, 2 – c 0 = 5.6 × 10 –5 M, 705 V,<br />
3 – 5.6 × 10 –5 M, 0.0012 M Zephyramine, 660 V<br />
There are no interferences observed for na + and K + at<br />
1,000 : 1 molar ratio. The effects of some other ions at optimalized<br />
conditions are summarized in Fig. 6. no considerable<br />
difference in the interferences is observed for the absence or<br />
presence of cationic surfactant Zephyramine (Fig. 6.).<br />
Fig. 6. Interferences for 0.3 μg cm –3 of each element at optimal<br />
conditions in the presence of 0.0012 M Zephyramine<br />
For the application, 0.04–1 μg cm –3 of Al 3+ , Ga 3+ and<br />
In 3+ are determined in the excess of QSA in the presence of<br />
0.0012 M Zephyramine and 0.05 M hexamethylentetramine<br />
at pH 4 for Al, pH 3 for Ga and in the presence of 0.05 M<br />
tetraborate at pH 8. In the presence of 0.05 M hexamethylentetramine<br />
or sodium tetraborate 10% lower fluorescence<br />
intensity is observed. 0.05 M MES is not suitable because of<br />
larger fluorescence intensity decrease about 15 %.<br />
s515<br />
Conclusions<br />
The collinear fluorescence spectra of complexes with<br />
8-Hydroxyquinoline-5-sulphonic acid were used for the<br />
study of Al, Ga, In complexes and determination of these<br />
elements at pH 4, 3 or 8. Strictly linear calibration plots for<br />
0.04 – 1 μg cm –3 of the metal ion are observed under optimized<br />
conditions for the normal and first derivative spectra or in<br />
the presence of cationic surfactant.<br />
The efficiency of fluorescence intensity increases in<br />
the presence of submicellar concentrations of cationic surfactants,<br />
especially Zephyramine. The detection limits from<br />
normal or first derivative spectra and in the submicellar media<br />
are practically identical (0.03–0.05 μg cm –3 ), but sensitivity is<br />
significantly increased in the presence of Zephyramine. Fatal<br />
interferences are observed from Fe 3+ and PO 4 3– only.<br />
For the individual determination of Al, Ga and In with<br />
QSA hexamethylentetramine or sodium tetraborite buffers<br />
are suitable. The multicomponent determination of these ions<br />
can be carried out by approaching the PLS method 10 .<br />
REFEREnCES<br />
1. Bishop J. A.: Anal. Chim. Acta 29, 172 (1963).<br />
<strong>2.</strong> Alonso J. I. G., Garcia M. E. D., Medel A. S.: Talanta<br />
31, 361 (1984).<br />
3. Prat M. D., Compañó R., Beltrán J. L., Codony R.: Journal<br />
of Fluorescence 4, 279 (1994).<br />
4. Soroka K., Vithanage R. S., Phillips D. A., Walker B.,<br />
Dasgupta P. K.: Anal. Chem. 59, 629 (1987).<br />
5. Salinas F., Delapena A. M., Duran M. S.: Anal. Letters<br />
21, 1457 (1988).<br />
6. Porter n., Hart B. T., Morrison R., Hamilton I. C.: Anal.<br />
Chim. Acta 308, 313 (1995).<br />
7. Graham R. C.: Data Analysis for the Chemical Sciences.<br />
A Guide to Statistical Techniques. VCH Publishers<br />
(1993).<br />
8. Currie L. A.: Pure and Applied Chemistry 67, 1699<br />
(1995).<br />
9. Vosburgh W. C., Cooper G. R.: J. Am. Chem. Soc 63,<br />
437 (1941).<br />
10. Vojta S., Jančář L., Sommer L.:, Journal of Fluorescence<br />
18, 339 (2007).
Chem. Listy, 102, s265–s1311 (2008) Environmental Chemistry & Technology<br />
P88 SuRGICAL POLyESTER FAbRIC<br />
IMPREGNATED by CROSS-LINKED<br />
COLLAGEN<br />
PAVeL FILKA, LUCY VOJTOVá and JOSEF JAnČář<br />
Brno University of Technology, Faculty of Chemistry,<br />
Institute of Materials Chemistry, Purkyňova 464/118, 612 00<br />
Brno, Czech Republic,<br />
xcfilka@fch.vutbr.cz<br />
Introduction<br />
Collagen is a widely applicable protein in medical applications.<br />
The main advantage of this biomaterial is its ability<br />
to create fibers with a high strength and stability by using different<br />
cross-linking agents or physical methods. Collagen’s<br />
significant properties are biocompatibility and resorbability in<br />
organism, which might be particularly used at surface modification<br />
of surgical fabrics based on polyester silk (PES). The<br />
collagen modified PES nets used in surgery for longtime fixation<br />
or reinforcing different organs may accelerate healing<br />
injury as well as reduce inflammation of a tissue surrounding<br />
the implanted fabrics 1 .<br />
natural crosslinking gives collagen special properties,<br />
namely higher rigidity and endurance against proteolytical<br />
cleavage. However, during processing and utilization the<br />
collagen loses those particular properties. That is why the<br />
collagenous material is additionally cross-linked by chemical<br />
or physical methods in order to regenerate original net<br />
behaviours.<br />
Chemical methods employ bifunctional compounds<br />
(e.g. aldehydes, epoxides, isocyanides, carbodimides, acrylic<br />
acid etc.) which can react with amino groups of collagen<br />
in two different places resulting in generation of a new<br />
strengthing bond. Their main disadvantage is toxicity of<br />
used chemicals 2 . Instead of toxic aldehydes it might be used<br />
nontoxic 1-ethyl-3-(-dimethylaminopropyl) carbodiimide<br />
(EDC), which is soluble in water. For reaction acceleration<br />
the n-hydroxysuccinimide (nHS) as catalyst can be added to<br />
the system with EDC 3 .<br />
In this work cross-linking agents based on melaminformaldehyde<br />
resin (named as LYOFIX and MH – 83) as<br />
well as carbodiimide (system EDC/nHS) were used for<br />
crosss-linking collagen impregnated on the polyester surgical<br />
net CHS 100. Swelling behaviours in the water and degradation<br />
at 37 °C in physiological solution with the purpose of<br />
increasing biocompatibility of commercial surgical net were<br />
examined.<br />
Experimental<br />
Modified derivative of alkylmelamineformaldehyde in<br />
aqueous solution (LYOFIX, Ciba, Hungary), hexamethylolmelamineformaldehyde<br />
resin (MH-83, Draslovka a.s. Kolin,<br />
CZ), 1-ethyl-3-3-dimethylaminopropyl)-carbodiimide hydrochloride<br />
(EDC, Sigma-Aldrich s.r.o.), n- hydroxysukcinimide<br />
(nHS 98 %, Sigma-Aldrich s.r.o.), na 2 HPO 4 . 12H2 O<br />
(Lach-ner a.s. CZ), collagen type I (8 %, VUP a.s., Brno),<br />
net for surgical purposes (CHS 100 – knitwork made from<br />
s516<br />
polyester silk, VUP a.s., Brno), ultra - clean demineralize and<br />
deionize MILIQ water (prepared in arrangement of Millipore<br />
S.A. at FCH BUT, CZ).<br />
P r e p a r a t i o n o f a C o l l a g e n F i l m s<br />
Polyester fabric CHS 100 was cut into same size square<br />
pieces of about 1 cm 2 which were diped layed on the 5 ml<br />
of 1% collagen solution (prepared from 100% freeze – dried<br />
collagen) embedded with extra 5 ml of 1% collagen solution.<br />
This sample was air-dried for approximately 48 h to the constant<br />
weight.<br />
C r o s s - L i n k i n g<br />
Collagenous films were cross-linked by 2% solution<br />
of LYOFIX and Mn-83 resins for a period of 12 mins.<br />
Subsequently the samples were five times washed by the<br />
distilled water for 5 mins and dryied by air to the constant<br />
weight.<br />
Collagenous films were cross-linked by the ethanol solution<br />
containing 50 mmol dm –3 of EDC and 25 mmol dm –3 of<br />
nHS. After 4 h of cross-linking the samples were washed out<br />
for 2 h in 0.1M solution of na 2 HPO 4 . 12H2 O and finally four<br />
times for half an hour in the distilled water followed by airdrying<br />
to the constant weight.<br />
S w e l l i n g<br />
Swelling characteristics were evaluated to compare the<br />
cross-linking effectivity by each agent. Swelling proceeded<br />
for a period of 40 min to 1 h in MILIQ water at a laboratory<br />
temperature. Quantity of absorbed water was weighted in five<br />
minute intervals. Both water content (OV) and swelling ratio<br />
(SB) of each sample were calculated according to equation<br />
(1) and (2), where mc is weight of swollen sample in a given<br />
time and ms is weight of dry sample prior the swelling 4 .<br />
m<br />
OV [%] =<br />
c −ms<br />
⋅ 100<br />
(1)<br />
mc SB [–] = m c<br />
m s<br />
D e g r a d a t i o n<br />
Each sample was placed in the physiological solution<br />
with addition of sodium azide (0.1% naCl + 0.02% na 3 n)<br />
and placed into the incubator set to 37 °C to determine the<br />
hydrolytic degradation. Prepared samples were every day<br />
taken out from the incubator, dried by the filtration paper,<br />
consequently weighted and immediately placed back with<br />
fresh physiological solution. Degradation was expressed as<br />
percentual decrease of collagen weight in certain time having<br />
the zero point at the maximum of swelling according to equations<br />
(3) and additionaly (4)–(6).<br />
(2)
Chem. Listy, 102, s265–s1311 (2008) Environmental Chemistry & Technology<br />
Degradation = 100 – ((Wk . 100)/Wb) (3)<br />
Wk = W – W sb<br />
Wsb = W ss + W ss . OV 13<br />
(4)<br />
(5)<br />
W<br />
OV13 =<br />
sb<br />
−Wss<br />
⋅ 100<br />
(6)<br />
W<br />
sb<br />
Wk represents weight of swollen collagenous sample<br />
without wet net, Wb is weight of swollen collagenous sample<br />
at maximum of swelling, Wsb is weight of wet net, Wss is<br />
weight of dry net, W is weight of swollen collagenous sample<br />
with net and OV 13 is water in net after 13 days of swelling<br />
(%).<br />
M o r p h o l o g y<br />
Morphology of samples was observed by the scanning<br />
electron microscope Philips Quanta 200. On the sample surface<br />
conductive lay of 3–4 nm were steamed by the sputter<br />
Polaron SC7640 prior the analysis.<br />
Result and Discussion<br />
S w e l l i n g R a t i o<br />
Swelling ratio (SB) of all prepared samples shows Fig. 1.<br />
It can be seen that the highest swelling ratio attained non<br />
cross-linked collagen (SB = 42 in 25 min), then non crosslinked<br />
collagen coated on the net (SB = 14 in 25 min). Crosslinked<br />
collagens have almost same swelling ratio (SB = 3–4<br />
in 25 min). The lower amount of water absorbed polyester<br />
net (SB = 1 in 25 mine).<br />
Fig. 1. Dependence of swelling ratio on time for samples crosslinked<br />
by the EDC – NhS (), LyOFIx (), Mh-83 (), non<br />
cross-linked collagen with net (), non cross-linked collagen<br />
without the net () and the net without collagen ().<br />
s517<br />
D e g r a d a t i o n<br />
From the degradation behavior dependence of collagen<br />
in the physiological solution at 37 °C on time (Fig. <strong>2.</strong>) it is<br />
assumed that the fastest degradation yielded non cross-linked<br />
collagen within 21 days of incubation. After 23 days degraded<br />
non cross-linked collagen coupled to the net resulting in<br />
net maintain. The slowest degradation in the physiological<br />
solution showed the collagen cross-linked by EDC-nHS<br />
which recorded 59 % of degradation in 78 days of incubation.<br />
The shortest degradation of cross-linked collagen embodied<br />
sample treated by LYOFIX resin (17 % of degradation<br />
in 24 days) followed by MH-83 resin (32 % of degradation<br />
in 35 days).<br />
Fig. <strong>2.</strong> Dependence of degradation on time of collagenous samples<br />
coss-linked by the EDC – NhS (), LyOFIx (), Mh 83<br />
(), non cross-linked collagen on the net (), non cross-linked<br />
collagen without the net ()<br />
M o r p h o l o g y<br />
Scanning electron microscope picture in Fig. 3.a (sight<br />
angle of 54 °) shows good adhesion between the non crosslinked<br />
collagen coated on the PES net as well as between the<br />
collagen cross-linked by the EDC-nHS and the PES fabric<br />
(Fig. 3.b).<br />
Cross-linked samples after the degradation were observed<br />
in environmental mode. From the Fig. 4. it is evident<br />
the separation of collagen from the polyester net in this case<br />
(a) (b)<br />
Fig. 3. Morphology of collagen built – up on the net ChS100<br />
non cross-linked (a) and cross-linked by the EDC – NhS (b)
Chem. Listy, 102, s265–s1311 (2008) Environmental Chemistry & Technology<br />
cross-linked by the EDC – nHS after the 78 days of incubation<br />
in the physiological solution.<br />
Fig. 4. Morphology of degraded collagen coated on the net and<br />
cross-linked by the EDC – NhS<br />
Conclusions<br />
The all cross-linked collagen samples embodied very<br />
good adhesion to the net when coated and did not show any<br />
separation until the total degradation. Samples cross-linked<br />
by the new system of EDC-nHS attained approximately the<br />
same swelling ratio like samples cross-linked by the resins of<br />
LYOFIX and MH-83. The biggest strength of polymeric net<br />
and hydrolytic degradation resistivity showed sample crosslinked<br />
by the EDC-nHS system, which were stable against<br />
s518<br />
the degradation for 78 days in physiological solution at 37 °C<br />
(confirmed by microscopy). Due to the obtained properties<br />
the new cross-linked collagen might enhance the biocompatibility<br />
of commercially used net CHS 100 since it is coated<br />
and implanted. Moreover, collagen itself might be modified<br />
(e.g. with hyaluronic acid) in order to speed up the wound<br />
healing process or reduce the tissue inflammation in the net<br />
surrounding environment.<br />
This work was supported by the Ministry of Education,<br />
Youth and Physical Training of the Czech Republic under the<br />
research project MSM 0021630501<br />
REFEREnCES<br />
1. Lee Chi H., Singla A., Lee Y.: Int. J. Pharm. 221, 1<br />
(2001).<br />
<strong>2.</strong> Dijkstra P. J., Damink L. H. H., Feijen J.: Cardiovasc.<br />
Path 01. 5, 286 (1996).<br />
3. Damink L. H. H., Dijkstra P. J., Van Luyn M. J. A., Van<br />
Wachem P. B., nieuwenhuis P., Feijen J.: Biomaterials<br />
17, 765 (1996).<br />
4. nam K., Kimura T., Kishida A.: Biomaterials 28, 1<br />
(2007).
Chem. Listy, 102, s265–s1311 (2008) Environmental Chemistry & Technology<br />
P89 SOIL hyGIENE IN OLD <strong>ENVIRONMENTAL</strong><br />
buRDEN AREAS<br />
ALEnA VOLLMAnnOVá a , Ján TOMአa , DAnIEL<br />
BAJČAn a and PETER KOVáČIK b<br />
a Department of Chemistry, Faculty of Biotechnology and<br />
Food Sciences,<br />
b Department of Agrochemistry and Plant Nutrition, Faculty<br />
of Agrobiology and Food Resources, Slovak University of Agriculture,<br />
Tr. A. Hlinku 2, 949 01 Nitra, Slovak Republic<br />
Alena.Vollmannova@uniag.sk<br />
Introduction<br />
The necessity of old environmental burden areas remedy<br />
is one of present environmental problems. The negative effect<br />
of the anthropogenic breach into the environment arised<br />
in the past still exists. It can be often a potential source of risk<br />
element input into the all components of the environment.<br />
The old scrap-heaps, mines, landfills, industrial, biological 1<br />
and chemical wastes, heavy metals 2 and oil products are<br />
important factors of the environment contamination.<br />
In our research work the soil hygiene of three various<br />
old environmental burden areas of Slovakia is evaluated.<br />
The first one is the wider surrounding of previous nickel<br />
smeltery in Sereď situated in the loaded region Dolný Váh,<br />
one of 12 regions of the Slovak Republic with the most contaminated<br />
soils by risk elements 3 . The second observed region<br />
is the alluvial area near of Štiavnica river running through the<br />
area long-time burden by intensive mine activity 4 . The third<br />
surveyed locality is the wider surrounding of Iron ore mines<br />
in Rudňany. This enterprise belonged in the past to the one<br />
of determining sources of the emission contamination of the<br />
environment in loaded area of Stredný Spiš.<br />
The risk of heavy metal input from residual metallic burden<br />
soil into the food plants as well as into the whole human<br />
food chain is in observed regions evident.<br />
Experimental<br />
The observation of risky elements in soils were realized<br />
on parcels in cadasters of villages: Zavar, Križovany, Vlčkovce,<br />
Hoste, Malá Mača and Veľká Mača in the distance<br />
of 5 to 9 km in northern and nort-western direction and in<br />
cadasters of villages Veľká Mača, Šintava and Vinohrady nad<br />
Váhom in the distance of 2 km south-western, <strong>2.</strong>8 km eastern<br />
and 3.5 km north-eastern from former emmission source of<br />
nickel smeltery Sereď.<br />
In longitudinal north-southern direction of river Štiavnica<br />
alluvium 11 soil samples from cadastres of villages Prenčov,<br />
Hontianske nemce, Hontianske Tesáre, Terany, Dudince,<br />
Hokovce, Horné Semerovce, Tupá, and Hrkovce were taken.<br />
The river length is 54.6 km. The distance between Prenčov<br />
and Hrkovce is about 36 km.<br />
In the Stredný Spiš region the soil samples were taken<br />
in cadaster of Markušovce in the distance of 10–1<strong>2.</strong>5 km<br />
north-western, Matejovce 7.6 km northern, Chrasť nad Hro<br />
s519<br />
nom 10 km north-eastern and Poráč 6 km eastern of former<br />
emmission source ŽB Rudňany.<br />
The samples with pedological probe from surface soil<br />
layer were taken from 33 experimental sites. Analyses were<br />
conducted in samples of soil ground on fine soil I. and from<br />
this fine soil the representative sample was taken and sieved<br />
through the sieve with average 0.2 mm (fine soil II). The total<br />
content of risky elements was determined by the AAS method<br />
in soil extract gained after total decomposition of soil by wet<br />
way with the mixture of acids HF + HnO 3 + HClO 4 .<br />
Results<br />
The soil hygiene was evaluated after Resolution of the<br />
Ministry of Agriculture of the Slovak Republic no. 531/1994-<br />
-540, which determines the hygienic limits for soil contents<br />
of 15 selected risk elements. The reference value A means<br />
that the soil is not contaminated if the substance concentration<br />
is below this value, the indicative value B means that soil<br />
contamination was analytically proven, the indicative value C<br />
means the necessity of the soil sanitation. The soils surround<br />
of previous nickel Smeltery Sereď could be considerated<br />
from the standpoint of risky metals contents as relatively<br />
„clean“, in spite of moderately enhanced contents of Cd, Cu,<br />
ni and Co. There was no content value meaning analytical<br />
proof of soil contamination. The Cd content was in the range<br />
from 1.6 to <strong>2.</strong>5-fold of background value A (0.8 mg Cd kg –1 )<br />
in all observed parcels. The ni content exceeded the value<br />
A (35 mg ni kg –1 ) in all parcels with the exception of Vinohrady<br />
nad Váhom locality, while it was enhanced from 1.1 to<br />
1.4-fold. The Cu content was increased in all localities with<br />
the exception of Zavar and Veľká Mača (1.03 to 1.93-fold of<br />
value A 36 mg Cu kg –1 ). The enhanced soil content of Co was<br />
observed in Zavar, Hoste, Veľká Mača and Šintava (1.06 to<br />
1.22-fold of value A 20 mg Co kg –1 ). All of the determined<br />
values were deeply under the hygienic limit for the soil contamination.<br />
In soils of the second observed region of alluvium Štiavnica<br />
river the soil contamination by high contents of Cu, Zn,<br />
Cd and Pb was confirmed. The determined Pb contents were<br />
extremely high in all of analysed soil samples and they even<br />
markedly exceeded the indicative limit value for soil sanitation<br />
C (600 mg Pb kg –1 ) given by valid legislative.The Cu<br />
and Pb contents in observed soils were the highest in Prenčov<br />
(<strong>2.</strong>6-fold of indicative value B 100 mg Cu kg –1 resp. 5.4-fold<br />
of indicative value C for Pb), the highest Zn and Cd contents<br />
were determined in soil of Hontianske nemce (5.52-fold<br />
resp. 4.24-fold of indicative values B 500 mg Zn kg –1 resp.<br />
5 mg Cd kg –1 ). The lowest Cu soil content was determined<br />
in Horné Semerovce (on the level of the indicative value<br />
B), the lowest Zn, Cd and Pb contents were determined in<br />
Hontianske Tesáre (Zn on the level of the limit value B, Cd<br />
30% under the limit and Pb 1.78-fold of the indicate value B<br />
150 mg Pb kg –1 ).<br />
The situation in the wider surrounding of the third<br />
surveyed site of the former emmission source was different.<br />
The enormly high content of Hg was found out in Markušovce
Chem. Listy, 102, s265–s1311 (2008) Environmental Chemistry & Technology<br />
in locality Olšanské pole, which was even exceeding the hygienic<br />
limit determining the soil sanitation (1.9 to 3.8-fold of<br />
value C 10 mg Hg kg –1 ). Similarly the extremely high content<br />
of Hg was determined in Poráč, where the 3.2-fold higher<br />
exceeding of this limit value was determined. The contamination<br />
of soil by Hg was obvious also in localities: Pod horky,<br />
Zemkovské (Markušovce) and na stráni (Matejovce because<br />
of the exceeding of limit value B (2 mg Hg kg –1 ) for the soil<br />
contamination at 4.65-fold. Similarly the soil contamination<br />
by As was proved in Markušovce (locality Olšanské pole),<br />
where the limit value B (30 mg As kg –1 ) was exceeded 1.45fold<br />
and Poráč (locality Pasienky) with 1.06-fold In Poráč the<br />
soil contamination by Cu was evident (1.15-fold of limit B).<br />
Conclusions<br />
The residual soil burden by heavy metals and potential<br />
follow contamination of the food chain in observed areas presents<br />
the potential risk for the human health. Therefore it is<br />
important to monitor the risk metal contents as in soils as in<br />
agricultural plants and in case that it is necessary to realise<br />
s520<br />
the remedy for the inhibition of the risk heavy metal input<br />
into the human food chain.<br />
This work has been supported by projects KEGA No.<br />
3/5081/07 and VEGA No. 1/3455/06<br />
REFEREnCES<br />
1. Toth, T.: Acta Envir. Univ. Comenianae 15(1), 66<br />
(2007).<br />
<strong>2.</strong> Hegedusova, A., Hegedus, O., Musilova, J.: Risks of soil<br />
contamination by cadmium. Monograph. CPU nitra,<br />
2006<br />
3. Bedrna, Z.: Environmental pedology. SAS Bratislava,<br />
2002<br />
4. Arvay, J., Melichacova, S., Lahucky, L., Musilova, J.,<br />
Bystricka, J.: Food safety and control : The crops quality<br />
cultivated on heavy metals contaminated soil from<br />
Region Hont, nitra, 28–29. 3. March 2008, Book of<br />
Works, SAU nitra, 2007.
Chem. Listy, 102, s265–s1311 (2008) Environmental Chemistry & Technology<br />
P90 EPR STuDy ON PhOTOINDuCED PROCESSES<br />
OF NOVEL QuINOLONE DERIVATIVES<br />
ZUZAnA VRECKOVá, VLASTA BREZOVá, MAROŠ<br />
BELLA, VIKTOR MILATA and SOňA JAnTOVá<br />
Institute of Physical Chemistry and Chemical Physics, Faculty<br />
of Chemical and Food Technology, Slovak University of<br />
Technology in Bratislava, Radlinského 9, 812 37 Bratislava,<br />
Slovak Republic,<br />
zuzana.vreckova@stuba.sk<br />
Introduction<br />
4-Oxo-1,4-dihydroquinoline derivatives (4-quinolones)<br />
represent one of the largest classes of antimicrobial agents<br />
used nowadays in the medical care 1 . Specific members of<br />
this drug family display also high activity against eukaryotic<br />
type II topoisomerases, as well as against cultured mammalian<br />
cells 2 . These antineoplastic quinolones represent a prospective<br />
source of new anticancer agents. The presence of<br />
extended π-electron system of quinolone derivatives results<br />
in their photosensitive properties; therefore UVA irradiation<br />
can induce their photosensitive reactions with phototoxic<br />
responses. Previously we demonstrated that excitation of nitrogen<br />
heterocycle molecules by UVA radiation may significantly<br />
enhance their biological activities 3 .<br />
novel 7-substituted 6-oxo-6,9-dihydro[1,2,5]selenadiaz<br />
o-lo[3,4-h]quinoline derivatives were synthesized as potential<br />
anticancer and antimicrobial agents and their ability to<br />
produce Reactive Oxygen Species (ROS) upon irradiation<br />
was tested using Electron Paramagnetic Resonance (EPR)<br />
spectroscopy. Additionally, their cytotoxic/phototoxic effects<br />
on human leukemia cells HL60 were characterized.<br />
Experimental<br />
The synthesis of 7-substituted 6-oxo-6,9-dihydro[1,2,5]selenadiazolo[3,4-h]quinoline<br />
derivatives was performed<br />
according to the reaction pathways published in ref. 4 .<br />
Table I summarizes the structure, substitution and abbreviation<br />
of the synthesized selenadiazoloquinolones.<br />
E P R P h o t o c h e m i c a l E x p e r i m e n t s<br />
EPR measurements at the X-band were performed with<br />
an EMX EPR spectrometer (Bruker, Germany) using a TE 102<br />
(ER 4102ST) resonator. Samples were irradiated at 295 K<br />
directly in the EPR spectrometer cavity using HPA 400/30S<br />
lamp (400 W, l max = 365 nm, Philips, UVA irradiance<br />
3 mW cm –2 ). A Pyrex glass filter was applied to eliminate<br />
the radiation wavelengths below 300 nm. The experimental<br />
EPR spectra acquisition and simulation was carried out using<br />
WIN EPR and SimFonia programs (Bruker).<br />
The photoinduced generation of free radicals was monitored<br />
by spin trapping technique with 5,5-dimethyl-1-pyrroline<br />
n-oxide (DMPO) and 5-(diisopropoxyphosphoryl)-5-methyl-<br />
1-pyrroline n-oxide (DIPPMPO) as the spin traps. The selective<br />
oxidation of 4-hydroxy-2,2,6,6-tetramethylpiperidine<br />
(TMP) via singlet oxygen to the paramagnetic nitroxyl radi-<br />
s521<br />
cal 4-hydroxy-2,2,6,6-tetramethylpiperidine n-oxyl (Tempol)<br />
was applied for 1 O 2 detection by EPR spectroscopy. The<br />
aerated solutions of 7-substituted [1,2,5]selenadiazolo[3,4h]quinolo-nes<br />
in dimethylsulphoxide (DMSO) mixed immediately<br />
before EPR experiments, were transferred into a flat<br />
cell (WG-808-Q, Wilmad) suitable for TE 102 cavity, and the<br />
EPR spectra were monitored in situ.<br />
UV/visible spectra were recorded in DMSO by means of<br />
a Shimadzu UV-3600 spectrophotometer.<br />
Table I<br />
Structure, substitution and abbreviation of investigated 7substituted6-oxo-6,9-dihydro[1,2,5]-selenadia-zolo[3,4h]quinoline<br />
derivatives<br />
Structure 7-Substitution Abbreviation<br />
H 7-H-SeQ<br />
COOC 2 H 5 7-COOEt-SeQ<br />
COOCH 3 7-COOMe-SeQ<br />
COOH 7-COOH-SeQ<br />
COCH 3 7-Ac-SeQ<br />
Cn 7-Cn-SeQ<br />
C y t o t o x i c / P h o t o t o x i c E f f e c t<br />
The murine leukemia cell line HL60 (obtained from<br />
American Type Culture Collection, Rockville, MD, USA)<br />
was used. These cells were grown in RPMI medium in 5 %<br />
CO 2 at 37 °C under conditions specified in ref. 4 . A starting<br />
inoculum <strong>2.</strong>6 × 10 5 HL60 cells ml –1 in the exponential phase<br />
of growth was used. 5 ml of the suspension were added<br />
into Petri dishes (diameter 60 mm), then 20 μl of derivative<br />
7-Ac-SeQ at various concentrations were added to the cells.<br />
One part of the dishes was irradiated with HPA 400/30S lamp<br />
upon UVA dose of 0.4 J cm –2 . After 24, 48 and 72 h cultivation,<br />
the number of cells per culture dishes was counted in a<br />
Bürker chamber and viability of treated and control irradiated/non<br />
irradiated cells were determined by 0.4 % trypan<br />
blue staining.<br />
Results<br />
7-Substituted 6-oxo-6,9-dihydro[1,2,5]selenadiazolo[<br />
3,4-h]quinoline derivatives absorb UV radiation with three<br />
absorption maxima about 400, 340 and 300 nm, which are<br />
only slightly influenced by the substituents properties, as is<br />
shown in Fig. 1. The presence of acetyl substituent in 7-Ac-<br />
SeQ derivative caused bathochromic shift of the low-energy<br />
band to 410 nm with a shoulder at 485 nm.<br />
Upon photoexcitation, all 7-substituted 6-oxo-6,9-dihy<br />
dro[1,2,5]selenadiazolo[3,4-h]quinoline derivatives demonstrated<br />
the ability to generate super-oxide anion radicals trapped<br />
as • DMPO-O 2 – or • DIPPMPO-O2 – spin adducts.<br />
Fig. <strong>2.</strong>a shows the time-course of 11 individual EPR<br />
spectra monitored upon continuous UVA irradiation of 7-<br />
COOEt-SeQ, indicating the efficient generation of twelveline<br />
EPR signal with spin Hamiltonian parameters corresponding<br />
to • DMPO-O 2 – (an = 1.275 mT; a H β = 1.032 mT;
Chem. Listy, 102, s265–s1311 (2008) Environmental Chemistry & Technology<br />
Absorbance<br />
0.8<br />
0.6<br />
0.4<br />
0.2<br />
0.0<br />
300 400 500 600 700<br />
Wavelength, nm<br />
7-COOEt-SeQ<br />
7-COOH-SeQ<br />
7-Ac-SeQ<br />
7-CN-SeQ<br />
Fig. 1. uV/VIS spectra of 7-substituted 6-oxo-6,9-dihydro[1,2,<br />
5]selenadiazolo[3,4-h]quinoline derivatives measured in DMSO<br />
(concentration 40 μM; cell length 1 cm)<br />
a H γ = 0.135 mT and g-value = <strong>2.</strong>0058). Additionally, Fig. <strong>2.</strong><br />
b illustrates the formation of typical three-line EPR signal of<br />
Tempol (a n = 1.575 mT; g = <strong>2.</strong>0060) produced from TMP via<br />
singlet oxygen. However, photogenerated paramagnetic Tempol<br />
is upon prolonged irradiation decomposed to diamagnetic<br />
products, most probably by the termination of its nitroxyl<br />
group with super-oxide anion radicals ( > nO • + O 2 •– ).<br />
a)<br />
b)<br />
0 44 88 132 176 220<br />
Irradiation time, s<br />
Fig. <strong>2.</strong> The time-course of EPR spectra monitored upon photoexcitation<br />
of aerated DMSO solutions of 7-COOEt-SeQ<br />
(c 0 = 3.2 mM) in the presence of: a) DMPO spin trap (magnetic<br />
field sweep, SW = 10 mT); b) TMP (SW = 6 mT)<br />
The EPR experiments confirmed that the photoexcitation<br />
of selenadiazoloquinolones in the presence of molecular<br />
oxygen resulted in the formation of O 2 •– and 1 O2 , and<br />
s522<br />
these processes perform simultaneously. The photoactivity<br />
of 7-sub-stituted 6-oxo-6,9-dihydro[1,2,5]selenadiazolo[3,<br />
4-h]quinoline derivatives upon irradiation of polychromatic<br />
UV source was evaluated using (i) quantum efficiency<br />
of spin-adduct formation of superoxide radical with DMPO<br />
spin trap ( • DMPO-O 2 – ), and (ii) quantum efficiency of Tempol<br />
generation from TMP by singlet oxygen. The values of<br />
quantum efficiencies reflect the donor/acceptor properties of<br />
substituents; the highest value of • DMPO-O 2 – quantum efficiency<br />
was found for 7-acetyl 6-oxo-6,9-dihydro[1,2,5]selen<br />
adiazolo[3,4-h]quinoline (7-Ac-SeQ).<br />
The in vitro cytotoxic effect of six 7-substituted 6-oxo-<br />
6,9-dihydro[1,2,5]selenadiazolo[3,4-h]quinoline derivatives<br />
was investigated on cell proliferation of human leukemia<br />
HL60 cells. Derivatives demonstrated different cytotoxic effects,<br />
which were time- and concentration- dependent, and<br />
the highest impact was found for 7-Ac-SeQ. The application<br />
of UVA irradiation caused an escalation of 7-Ac-SeQ effects<br />
on cell proliferation; the percentage of growth inhibition was<br />
increased in the range of 10–50 %.<br />
Conclusions<br />
EPR and UV/Vis experiments confirmed UVA-induced<br />
excitation of 7-substituted 6-oxo-6,9-dihydro[1,2,5]selenadiazolo[3,4-h]quinoline<br />
derivatives, which is coupled with electron<br />
or energy transfer to molecular oxygen via Type I and<br />
Type II photooxidation mechanisms producing super-oxide<br />
anion radical and singlet oxygen.<br />
Dedicated to Prof. Andrej Staško on the occasion of his<br />
70 th birthday.<br />
This study was financially supported by Scientific Grant<br />
Agency of the Ministry of Education of the Slovak Republic<br />
(Projects VEGA 1/4305/07, 1/0225/08 and VEGA 1/3579/06)<br />
and Research and Development Agency of the Slovak Republic<br />
(contract No. APVV 0055-07).<br />
REFEREnCES<br />
1. Oliphant C. M., Green G. M.: Am.. Family Physician<br />
65, 455 (2002).<br />
<strong>2.</strong> Robinson M. J., Martin B. A., Gootz T. D., Mc-Guirk<br />
P. R., Moynihan M., Sutcliffe J. A., Osheroff n.: J. Biol.<br />
Chem. 266, 14,585 (1991).<br />
3. Jantová S., Letašiová S., Brezová V., Čipák ľ., Lábaj J.:<br />
J. Photochem. Photobiol. B: Biol. 85, 163 (2006).<br />
4. Bella M., Jantová S., Brezová V., Kučerák J., Ondrušová<br />
ľ.: Industrial Toxicology 07, 27 th International Symposium<br />
Proceedings, p. 127. Bratislava, 2007.
Chem. Listy, 102, s265–s1311 (2008) Environmental Chemistry & Technology<br />
P91 ThE bORON IN KRAFT PuLP MILL AND<br />
INFLuENCE IN wASTE wATER<br />
eVA GEMZICKá and MILAn VRŠKA<br />
Department of Chemical Technology of Wood, Pulp and<br />
Paper, Slovak University of Technology, Radlinského 9,<br />
812 37 Bratislava, Slovak Republic,<br />
milan.vrska@stuba.sk<br />
Introduction<br />
The elemental boron almost is not occurred in nature<br />
and it usually is component only its different compounds.<br />
The boron forms boranes with hydrogen. It forms acids of<br />
these types: (HBO 2 ) n and H 3 BO 3 . The borides are boron compounds<br />
with metals (Me) and boron forms BX 3 with halides<br />
(X 3 ). The oxycompounds are formed with boron and oxygen,<br />
i.e. B 2 O 3 and (BO) n . B 2 O 3 (l) [molten] dissolves oxides of<br />
metals (borax pearls). Wide range of boron compounds exists<br />
with different stoichiometry and structure (see Fig. 1.). The<br />
boron more often exists as borax in nature. The molten borax<br />
covers molten other metal and so it is protective compound<br />
against oxidation. The mixture boron and na 2 CO 3 is used for<br />
dissociation of geological and hard dissolving samples 1,2 .<br />
Fig. 1. Chart for boron reaction<br />
Borax is used in recovery line for process improvement<br />
in kraft pulp mill too. The conventional recovery cycle<br />
with addition of borates; this produces 10 % of the formed<br />
naOH (partial autocaustification). The borates react in two<br />
places in the recovery cycle: the recovery boiler and the<br />
smelt dissolver. In the former sodium carbonate reacts with<br />
a sodium-lean borate, forming a sodium-rich borate formed:<br />
s523<br />
naBO 2 (l) + na 2 CO 3 (l) = na 3 BO 3 (l) + CO 2 (g). In this reaction,<br />
the borates and the sodium carbonates are in a smelt<br />
phase, which implies that the reaction rate is high. In the dissolver,<br />
na 3 BO 3 reacts with water: na 3 BO 3 (l) + H 2 O = 2naO<br />
H(aq) + naBO 2 (aq)(ref. 3 ).<br />
Fig. <strong>2.</strong> borax Na 2 b 4 O 7 . 10h2 O i.e. Sodium tetraborate. It is applied<br />
in different industry: metallurgy, glass industry, ceramic<br />
industry and in some pulp mill<br />
Boron compounds are occurred in fresh/salt water and<br />
in waste water too. Concentration of boron compounds is<br />
app. 5 mg dm –3 in salt water 4 . Boron occurs naturally in fresh<br />
water at an average of 1 mg dm –3 or less many times. High<br />
boron concentrations may be toxic to freshwater fish regarding<br />
concentration of 10–300 mg dm –3 (e.g. for Rainbow trout<br />
24-day LC50 is 88 mg dm –3 ) in flowing water. Mainly borate<br />
is hazardous for water plants (e.g. for Green algae 96-hr IC10<br />
is 24 mg dm –3 ). Any definitive ecotoxicological conclusions<br />
don’t exist about genotoxic, carcinogenic or mutagenic effects<br />
to water organisms, but still under investigation 5 .<br />
Experimental<br />
The autocaustification was realized in kraft pulp mill.<br />
Trial was started on December 1, 2007 till December 14, 2007<br />
and restarted again on January 4, 2008. This trial was finished<br />
on February 25, 2008. Waste water was monitored for<br />
boron concentrations in two different laboratories. The boron<br />
concentration was determined in the first laboratory (spectrophotometry<br />
with azomethin at 415 nm) as calculation from<br />
borates. The boron also was analyzed using OES ICP method<br />
(in 2 nd laboratory) the first time in different samples of waste<br />
water, which were from different pH and COD. Alkali waste<br />
water, acid waste water, waste water of sewage water treatment<br />
plant, water from river and output to river were analyzed<br />
for boron in two steps, i.e. during trial and after trial in<br />
2 nd laboratory with OES ICP.<br />
Borax was added into dissolvent tank for green liquor<br />
step by step. Boron concentration was increased in waste<br />
water in February, when borax was added more in recovery<br />
line.<br />
Results<br />
Boron analysis was difficult because of small particulates,<br />
which were filtrated from samples, but boron concentration<br />
was estimated from samples, which were not filtrated.
Chem. Listy, 102, s265–s1311 (2008) Environmental Chemistry & Technology<br />
Fig 3. Comparison of b analysis<br />
Note : w.w. = waste water, MWWT = mechanical waste water<br />
treatment, SWTP = sewage water treatment plant<br />
Fig. 4. boron concentrations<br />
The results are from these samples, because boron could be<br />
component in small particulates of waste water samples.<br />
Boron concentration is low in waster water which is cleaned<br />
in SWTP. The limits are not specified by low for boron concentration<br />
in waste water to the water recipient.<br />
In the Danube, water (Komárno – Bratislava) was<br />
determinate to have a natural concentration on the level of<br />
s524<br />
39 µg dm –3 (ref. 6 ) and for river is the level of 20 µg dm –3 in<br />
the river after the biological waste water treatment plant and<br />
20 µg dm –3 in recipient to pulp mill. Boron concentration was<br />
low in lime sludge too. Boron was accumulation in system<br />
and its output was waste water, but boron concentration was<br />
low.<br />
Conclusions<br />
In this work was studied effect of adding boron compound<br />
to recovery line on the water quality.<br />
• Boron is component in very small particulates in waste<br />
water, therefore boron concentration is better without<br />
filtration of samples for boron determination. Boron<br />
concentration is not total in waste water by filtration.<br />
• Boron concentration is low in output - waste water to<br />
river, what corresponding accumulation of boron compounds<br />
in system of pulp mill.<br />
• There was little decreasing of boron concentration after<br />
trial, but boron compounds were in system.<br />
Open question:<br />
• What about deposits in recovery line and pipeline of<br />
waste water?<br />
This work has been supported by Kraft pulp mill.<br />
REFEREnCES<br />
1. Internet: Referat – prvky p1 a p2<br />
<strong>2.</strong> www.chtf.stuba.sk/kach/support/ACh_prednaska06.pdf<br />
3. Richards T., nohlgren I., Warnqvist B., Theliander H.:<br />
nordic Pulp and Paper Research Journal 17(3), 213<br />
(2002).<br />
4. http://sk.wikipedia.org/wiki/B%C3%B3r<br />
5. Safety data sheet for commercial product [borax]<br />
6. www.gabcikovo.gov.sk/vvb/vr2004/priloha%20D/text.<br />
Chem. Listy, 102, s265–s1311 (2008) Environmental Chemistry & Technology<br />
P92 CONTENTS OF DIFFERENT FRACTIONS OF<br />
SuLPhuR IN SLOVAKIA SOILS<br />
AnTOn ZAUJEC a , LýDIA JEDLOVSKá a and MELánIA<br />
FESZTEROVá b<br />
a Faculty of Agrobiology and Food Resources, Slovak University<br />
of Agriculture, Tr. A. Hlinku 2, 949 76 Nitra, Slovakia,<br />
b Faculty of Natural Sciences, Constantine the Philosopher<br />
University, Tr. A. Hlinku 1, 949 74 Nitra,<br />
Anton.Zaujec@uniag.sk<br />
Introduction<br />
In the past there were high sulphur contents in the soil,<br />
mostly from the atmospheric inputs. nowadays, in some<br />
localities deficit of sulphur was observed. In the last time<br />
advanced quality of environment is required by society. The<br />
aim of this work was to identify the distribution of sulphur<br />
fractions in different soil types of Slovakia.<br />
Experimental<br />
Basic sulphur fractions that we assessed in soil samples<br />
were: chloride soluble sulphur (CISS), sulphate sulphur (SS),<br />
heat soluble sulphur (HSS) by Williams-Steinbergs. Soil<br />
samples were taken from similar depths from 52 localities<br />
including basic soil types: Haplic Chernozems (CHH), Haplic<br />
Luvisols (LVH), Phaeozems (PH), Eutric Cambisols (CME),<br />
Dystric Planosols (PLD), in 1999–2006 years. Analytical<br />
methods of sulphur fractions determination were described<br />
by Jedlovská, Feszterová 1 .<br />
Results and Discussion<br />
C h l o r i d e S o l u b l e S u l p h u r F r a c t i o n<br />
( C l S S )<br />
The chloride soluble sulphur values (ClSS) were determined<br />
as extremely hight in Phaeozems, in localita Maňa,<br />
Žitavský luh 2,744.5 mg kg –1 (depth: 0–0.1 m) and in locality<br />
Okoč 1,173.6 mg kg –1 (0–0.4 m). Generally, the contents<br />
of ClSS varied with depth, the highest values were observed<br />
in subsoil layers. The minimum values were determined in<br />
vineyard on Eutric Cambisols 3.2 mg kg –1 (0.3–0.6 m; Tokaj)<br />
and in textural light Haplic Luvisols 4.4 mg kg –1 (0.5–0.6 m;<br />
Rišňovce).<br />
S u l p h a t e S u l p h u r F r a c t i o n ( S S )<br />
The highest sulphate sulphur content was in Haplic Luvisols<br />
locality Golianovo (1,191.7 mg kg –1 ; depth: 0–0.2 m)<br />
and nové Sady (856.1 mg kg –1 ; 0.2–0.4 m). The content of<br />
sulphate sulphur varies by soil types and depth of soil profiles.<br />
The minimum values (from 1.2 mg kg –1 to 3.7 mg kg –1 )<br />
were observed in topsoil of Haplic Chernozems (locality Štefanovičova),<br />
Eutric Cambisols (locality Viničky) and Haplic<br />
Luvisols (Rišňovce).<br />
s525<br />
Table I<br />
Contents of chloride soluble sulphur (ClSS)<br />
Soil types/ Depth Mean Standard<br />
(numbers) [m] [mg kg –1 ] deviation<br />
0.0–0.2 19<strong>2.</strong>5 175.2<br />
Haplic 0.2–0.4 9<strong>2.</strong>8 61.2<br />
Chernoyems 0.4–0.6 151.0 13<strong>2.</strong>5<br />
(14) 0.6–0.8 98.7 71.8<br />
0.8–1.4 70.0 66.1<br />
0.0–0.2 234.0 151.4<br />
Phaeozems<br />
(6)<br />
0.2–0.4<br />
0.4–0.6<br />
0.6–0.8<br />
373.7<br />
358.0<br />
453.2<br />
271.5<br />
220.4<br />
303.0<br />
0.8–1.4 261.7 81.8<br />
0.0–0.2 305.3 274.3<br />
0.2–0.4 299.9 259.8<br />
Haplic 0.4–0.6 299.1 254.7<br />
Luvisols 0.6–0.8 375.3 333.6<br />
(17) 0.8–1.0 384.4 299.7<br />
1.0–1.2 395.5 275.0<br />
1.2–1.4 244.3 201.6<br />
0.0–0.2 8<strong>2.</strong>0 77.0<br />
Dystric 0.2–0.4 45.4 3<strong>2.</strong>5<br />
Planosols 0.4–0.6 63.7 20.3<br />
(5) 0.6–0.8 106.2 7<strong>2.</strong>4<br />
0.8–1.4 121.8 118.5<br />
0.0–0.2 130.0 125.9<br />
Eutric 0.2–0.4 157.4 157.3<br />
Cambisols 0.4–0.6 159.2 154.3<br />
(10) 0.6–0.8 171.8 156.4<br />
0.8–1.4 187.7 115.0<br />
H e a t S o l u b l e S u l p h u r F r a c t i o n<br />
( H S S )<br />
The lowest values of HSS fraction were determined<br />
in comparison to the mentioned sulphur fractions. The highest<br />
HSS content was in Phaeozems locality Žitavský luh<br />
(1,837.4 mg kg –1 ; depth: 0–0.1 m), in Haplic Luvisols locality<br />
Revúca (617.5 mg kg –1 ; 0–0.3 m) and in Haplic Chernozems<br />
locality Sládkovičovo- nový Dvor (433.8 mg kg –1 ;<br />
0.5–0.7 m). The minimum of HSS (from 0.28 mg kg –1 to<br />
1.2 mg kg –1 ) were observed in topsoil of Eutric Cambisols<br />
(Tokaj), of Haplic Luvisols (Tesárske Mlyňany) and in sandy<br />
loam Haplic Chernozems (Dulovce).<br />
Conclusions<br />
The contents of sulphur fractions (ClSS, SS, HSS) varied<br />
by depth of soil profiles and soil types. The maximumn values<br />
of ClSS fraction were observed in Phaeozems (336.1 mg kg –1 )<br />
and Haplic Luvisols (329.1 mg kg –1 ). The values under<br />
average values of ClSS (206.2 mg kg –1 ) were in Eutric Cambisols<br />
(161.2 mg kg –1 ), Haplic Chernozems (121.0 mg kg –1 )<br />
and Dystric Planosols (83.8 mg kg –1 ). The highest contents<br />
of SS fraction were determined in Haplic Chernozems
Chem. Listy, 102, s265–s1311 (2008) Environmental Chemistry & Technology<br />
Table II<br />
Contents of sulphate sulphur (SS)<br />
Soil types/ Depth Mean Standard<br />
(numbers) [m] [mg kg –1 ] deviation<br />
0.0–0.2 16<strong>2.</strong>1 134.2<br />
Haplic 0.2–0.4 184.2 144.9<br />
Chernozems 0.4–0.6 116.9 97.9<br />
(14) 0.6–0.8 149.7 108.7<br />
0.8–1.4 120.9 87.0<br />
0.0–0.2 213.2 125.7<br />
Phaeozems<br />
(6)<br />
0.2–0.4<br />
0.4–0.6<br />
0.6–0.8<br />
218.4<br />
263.2<br />
428.9<br />
5<strong>2.</strong>0<br />
140.7<br />
187.2<br />
0.8–1.4 377.3 145.5<br />
0.0–0.2 323.0 320.3<br />
0.2–0.4 389.5 234.6<br />
Haplic 0.4–0.6 234.2 117.7<br />
Luvisols 0.6–0.8 24<strong>2.</strong>0 124.3<br />
(17) 0.8–1.0 223.7 46.7<br />
1.0–1.2 281.4 64.6<br />
1.2–1.4 310.0 6<strong>2.</strong>2<br />
0.0–0.2 38.7 35.9<br />
Dystric 0.2–0.4 53.5 64.3<br />
Planosols 0.4–0.6 53.9 46.7<br />
(5) 0.6–0.8 50.3 36.8<br />
0.8–1.4 4<strong>2.</strong>2 30.5<br />
0.0–0.2 9<strong>2.</strong>4 79.0<br />
Eutric 0.2–0.4 103.1 91.6<br />
Cambisols 0.4–0.6 101.2 87.3<br />
(10) 0.6–0.8 154.3 59.9<br />
0.8–1.4 125.0 8<strong>2.</strong>8<br />
(300.2 mg kg –1 ) and in Haplic Luvisols (286.3 mg kg –1 ), while<br />
in Dystric Planosols the values were only 47.7 mg kg –1 .<br />
The differences between soil types were determined in<br />
HSS fraction, where the highest mean values observed in<br />
Phaeozems and Eutric Cambisols. The lowest value of HSS<br />
fraction was in Dystric Planosols.<br />
Decreasing contents of ClSS fraction, in monitoring of<br />
soils types where: PH > LVH > CH > CME > PLD, the decreasing<br />
contents of SS fraction was LVH > PH > CH > CME > P<br />
LD. Presented results show the possibilities how to evaluate<br />
s526<br />
Table III<br />
Contents of heat soluble sulphur (HSS)<br />
Soil types/ Depth Mean Standard<br />
(numbers) [m] [mg kg –1 ] deviation<br />
0.0–0.2 93.4 89.0<br />
Haplic 0.2–0.4 143.8 115.8<br />
Chernozems 0.4–0.6 13<strong>2.</strong>4 130.7<br />
(14) 0.6–0.8 110.4 89.1<br />
0.8–1.4 115.8 93.4<br />
0.0–0.2 207.4 109.5<br />
Phaeozems<br />
(6)<br />
0.2–0.4<br />
0.4–0.6<br />
0.6–0.8<br />
249.8<br />
227.7<br />
213.3<br />
9<strong>2.</strong>7<br />
96.1<br />
36.2<br />
0.8–1.4 214.7 31.2<br />
0.0–0.2 145.3 106.7<br />
0.2–0.4 161.5 84.8<br />
Haplic 0.4–0.6 15<strong>2.</strong>9 86.8<br />
Luvisols 0.6–0.8 163.5 127.2<br />
(17) 0.8–1.0 146.9 51.8<br />
1.0–1.2 131.3 71.2<br />
1.2–1.4 127.7 48.1<br />
0.0–0.2 53.5 5<strong>2.</strong>5<br />
Dystric 0.2–0.4 76.5 46.2<br />
Planosols 0.4–0.6 77.1 24.3<br />
(5) 0.6–0.8 89.1 31.2<br />
0.8–1.4 56.8 3<strong>2.</strong>0<br />
0.0–0.2 203.6 140.4<br />
Eutric 0.2–0.4 130.0 134.6<br />
Cambisols 0.4–0.6 166.1 144.7<br />
(10) 0.6–0.8 239.8 173.7<br />
0.8–1.4 131.0 83.2<br />
the different fractions of sulphur in different soils types in<br />
Slovakia.<br />
This work has been supported by grant VEGA<br />
1/4432/07.<br />
REFEREnCES<br />
1. Jedlovská, L., Feszterová, M.: Proceedings of 10th<br />
Intern. Scientific Workshop: Topical tasks solved in agrofood<br />
sector. (Vavrišinova K., ed.) p.16, nitra 2004.
Chem. Listy, 102, s265–s1311 (2008) Environmental Chemistry & Technology<br />
P93 FACTORS INFLuENCING ThE SORPTION<br />
bEhAVIOuR OF hERbICIDE ACETOChLOR<br />
IN SOILS AND SEDIMENTS<br />
LEnKA ZEMAnOVá, EDGAR HILLER and ZOLTán<br />
KRASCSEnITS<br />
Comenius University in Bratislava, Faculty of Natural<br />
Sciences, Department of Geochemistry, Mlynská dolina,<br />
842 15 Bratislava, Slovak Republic,<br />
zemanoval@fns.uniba.sk<br />
Introduction<br />
Acetochlor (2-chloro-N-(ethoxymethyl)-N-(2-ethyl-6methylfenyl)acetamide)<br />
is a selective systematic herbicide<br />
used in the production of maize, soybean and other crops 1 .<br />
Ability to predict its mobility in the environment is of major<br />
importance as US EPA has classified acetochlor as a probable<br />
human carcinogen 2 .<br />
The aim of this study was to investigate the sorption and<br />
desorption of acetochlor in various types of natural sorbents<br />
(soils, bottom and river sediments). The attention was paid to<br />
the effect of soil/sediment properties on acetochlor sorption<br />
and desorption.<br />
Experimental<br />
C h e m i c a l s a n d S o r b e n t s<br />
Experiments were conducted with analytical grade acetochlor<br />
(purchased from Sigma Aldrich Kft.), a relatively<br />
non-polar compound (logK ow = <strong>2.</strong>5) with water solubility<br />
223 mg dm –3 at 20 °C 1 .<br />
Eight surface soils (denoted as A1–8) were collected<br />
from cultivated sites in Slovakia. Moreover, one soil collected<br />
from C horizon at the depth of 2 m (SS), three bottom<br />
sediments (BS1–3), and two river sediments (RS1–2) were<br />
used. Basic properties of the soils and sediments studied are<br />
shown in Table I.<br />
S o r p t i o n / D e s o r p t i o n E x p e r i m e n t s<br />
Sorption experiments were conducted using a batch<br />
equilibration method, with two initial concentrations of acetochlor<br />
used (1 and 10 mg dm –3 ). The acetochlor concentration<br />
in supernatant solutions after equilibration was measured<br />
using high performance liquid chromatography with ultraviolet<br />
detection (HPLC-UV) in the national Water Reference<br />
Laboratory for Slovakia (Bratislava).<br />
Desorption experiments followed immediately after<br />
the sorption experiments with an initial concentration of<br />
10 mg dm –3 .<br />
Results<br />
Sorption coefficients for acetochlor are given in Table II.<br />
TOC was found to be the main soil/sediment property correlating<br />
with the extent of acetochlor sorption (r = 0.774;<br />
P < 0.01). Strong affinity of acetochlor to soil organic matter<br />
was reported also by other researchers 2,3 .<br />
s527<br />
Table I<br />
Properties of soils and sediments used in the study<br />
TOC [%] C HA /C FA Clay [%] pH (H 2 O) CaCO 3 [%]<br />
A1 4.59 1.09 11.13 6.93 1.40<br />
A2 1.92 1.12 15.32 7.99 <strong>2.</strong>00<br />
A3 0.89 0.72 2<strong>2.</strong>08 6.76 0.30<br />
A4 <strong>2.</strong>49 1.07 9.08 7.86 1<strong>2.</strong>2<br />
A5 1.21 1.16 5.75 6.32 n.D.<br />
A6 1.19 1.53 11.00 7.96 <strong>2.</strong>74<br />
A7 0.48 0.90 0.60 5.76 0.20<br />
A8 1.57 1.12 37.20 6.11 n.D.<br />
SS 0.60 0.95 4.05 8.20 4.10<br />
RS1 <strong>2.</strong>46 0.42 <strong>2.</strong>16 7.17 0.30<br />
RS2 3.46 0.87 1.89 7.22 3.60<br />
BS1 3.05 0.89 6.41 7.56 3.80<br />
BS2 1.64 1.62 7.85 7.46 <strong>2.</strong>20<br />
BS3 6.39 0.78 <strong>2.</strong>03 6.45 n.D.<br />
The relationship between K d and total organic carbon<br />
content was improved after excluding the soil A8 from the<br />
data set (r = 0.902; P < 0.001). This could be explained by the<br />
significantly higher clay mineral content (especially smectites)<br />
of this soil as compared with other sorbents. Previous<br />
studies of the sorption of organic pollutants in soils have<br />
shown that in soils with the high clay mineral/organic matter<br />
ratio, the mineral fraction can play an important role in binding<br />
organic compounds such as pesticides 4 .<br />
The humic/fulvic acid ratio (C HA /C FA ) is one of the<br />
characteristics of the soil organic matter quality 5 . The results<br />
of this study showed a positive correlation between the<br />
K oc and the C HA /C FA ratio (r = 0.578; P < 0.05). Its signifi-<br />
Table II<br />
Sorption coefficients of acetochlor (Kd and Koc) and percentage<br />
of acetochlor desorbed (P des )<br />
Initial concentration Initial concentration<br />
C 0 = 1 mg dm –3 C 0 = 10 mg dm –3<br />
K d K oc K d K oc P des<br />
[dm 3 kg –1 ] [dm 3 kg –1 ] [dm 3 kg –1 ] [dm 3 kg –1 ] [%]<br />
A1 7.108 155 5.871 128 1<strong>2.</strong>0<br />
A2 3.248 169 <strong>2.</strong>537 132 27.9<br />
A3 1.358 152 1.036 116 37.5<br />
A4 3.406 137 <strong>2.</strong>635 106 19.1<br />
A5 <strong>2.</strong>109 174 1.551 128 35.6<br />
A6 3.344 281 <strong>2.</strong>999 252 23.0<br />
A7 1.018 212 0.840 175 34.3<br />
A8 6.265 399 5.145 328 27.7<br />
SS 1.062 177 0.918 153 41.0<br />
RS1 3.463 141 <strong>2.</strong>579 105 27.0<br />
RS2 4.218 122 3.353 97 2<strong>2.</strong>5<br />
BS1 3.020 99 3.081 101 26.4<br />
BS2 3.854 235 3.378 206 26.2<br />
BS3 6.577 103 5.491 86 16.0
Chem. Listy, 102, s265–s1311 (2008) Environmental Chemistry & Technology<br />
cance increased after excluding the soil A8 from the data set<br />
(r = 0.766; P < 0.01).<br />
The method of step-down multiple regression analysis<br />
was used to determine the soil properties significantly<br />
contributing to the overall acetochlor sorption. The soil A8<br />
appeared to have specific sorption properties, thus it wasn’t<br />
included in the analysis. The analysis yielded the following<br />
equations:<br />
K d = 1.043(TOC %) + 1.725(C HA /C FA )–0.777 (1)<br />
R 2 = 0.888; n = 12; P < 0.001; SE = 0.67<br />
K d = 0.891(TOC %) + 1.723(C HA /C FA )–1.011 (2)<br />
R 2 = 0.914; n = 12; P < 0.001; SE = 0.497<br />
The equations (1) and (2) were acquired when the<br />
results obtained at initial acetochlor concentrations of 1 and<br />
10 mg dm –3 were used, respectively. The K d of acetochlor<br />
was found to depend significantly on the total organic carbon<br />
content of the soil/sediment. The distribution of humus components<br />
expressed as the C HA /C FA ratio is also a significant<br />
factor influencing the acetochlor affinity to the sorbents.<br />
Desorption of acetochlor from all soils and sediments<br />
was less than the amount initially sorbed (Table II). Desorption<br />
extent is significantly (r = –0.81; P < 0.01) influenced by<br />
total organic carbon content, with greater organic carbon contents<br />
reducing the desorption. Significant inverse correlations<br />
were also found between the humic components (C HA and<br />
s528<br />
C FA ) and P des , but no other significant correlations between<br />
P des and soil/sediment properties were observed.<br />
Conclusions<br />
Organic matter appears to be the main sorbent constituent<br />
responsible for acetochlor retention in soils/sediments,<br />
with both quantitative and qualitative parameters playing<br />
important role in its ability to bind acetochlor. The specific<br />
appearance of the clay-rich soil A8 in whole analysis implies<br />
that mineral surfaces can also significantly contribute to acetochlor<br />
immobilization under favourable conditions.<br />
This work has been supported by VEGA projects No.<br />
1/4036/07 and No 1/4047/07. We would like to acknowledge<br />
the Water Research Institute Bratislava.<br />
REFEREnCES<br />
1. Tomlin C. D. S.: The e-pesticide manual, 12 th ed. CD-<br />
ROM form, Version <strong>2.</strong>0. British Crop Protection Council<br />
2001.<br />
<strong>2.</strong> Ye C.: Bull. Environ. Contam. Toxicol. 71, 919 (2003).<br />
3. Ferri M. V. W., Gomes J., Dick D. P., de Souza R. F.,<br />
Vidal R. A.: Rev. Bras. Ci. Solo 29, 705 (2005).<br />
4. Sheng G., Johnston C. T., Teppen B. J., Boyd S. A.: J.<br />
Agric. Food Chem. 49, 2899 (2001).<br />
5. Dousset S., Mouvet C., Schiavon M.: Chemosphere 28,<br />
467 (1994).
Chem. Listy, 102, s265–s1311 (2008) Environmental Chemistry & Technology<br />
P94 ECOTOxICOLOGICAL EVALuATION OF<br />
ThE SLuDGES FROM wASTE wATER<br />
TREATMENT PLANTS<br />
HELEnA ZLáMALOVá GARGOŠOVá, LUCIE<br />
HELLInGEROVá and MILADA VáVROVá<br />
Institute of Chemistry and Technology of Environmental Protection,<br />
Faculty of Chemistry, Brno University of Technology,<br />
Purkyňova 118, 612 00 Brno, Czech Republic,<br />
zlamalova@fch.vutbr.cz<br />
Introduction<br />
The tendency to improve the water quality in the Czech<br />
Republic is linked with building up new waste water treatment<br />
plants (WWTP), what results in growing production of<br />
sewage sludges. Multi-purpose way for efficient utilization or<br />
sludge disposal hasn’t existed till now.<br />
Sewage sludges are very rich in nutrients and organic<br />
matter. This makes the spreading of this kind of waste on<br />
land as a fertilizer or an organic soil improver very suitable.<br />
Unfortunately, the sludge tends to concentrate heavy metals<br />
and organic compounds present in waste waters. The Sewage<br />
Sludge Directive (86/278/EEC) regulates sludge use in such<br />
way to prevent harmful effects on soil, vegetation, animals<br />
and man. In the Czech Republic almost one third of sewage<br />
sludges ends as a waste; this could be hazardeous. In Europe<br />
hazardous wastes are classified by 14 criteria including<br />
ecotoxicity (H 14). Environmental ecotoxicology deals with<br />
the potentially harmful effects of chemicals and wastes on<br />
organisms. For this purpose various testing organisms and<br />
various type of bioassays are used.<br />
The aim of our study was the ecotoxicological testing of<br />
sewage sludges from different waste water treatment plants<br />
by selected ecotoxicity tests with respect to their intended<br />
use. We used following organisms: crustacea Daphnia magna<br />
and Thamnocephalus platyurus and seeds of terrestrial plant<br />
Sinapis alba. The values of 24h-LC50 and 48h-LC50 obtained<br />
for Thamnocephalus platyurus and Daphnia magna and<br />
72h-IC50 values gained for Sinapis alba are the basic data for<br />
the ecotoxicological assessment of the sewage sludges and<br />
for their classification following the Czech legislation 1,2 .<br />
Experimental<br />
Samples of sewage sludges from high-capacity municipal<br />
WWTP, situated in Brno, Modřice and from small WWTP<br />
in Veterinary and Pharmaceutical University Brno were<br />
evaluated. From WWTP Brno, Modřice following sewage<br />
sludges were tested:<br />
•<br />
•<br />
•<br />
anaerobic stabilized sewage sludges (AS)<br />
dewatered anaerobic stabilized sewage sludges<br />
(DWAS)<br />
dessicated anaerobic stabilized sewage sludges (DSAS)<br />
From local WWTP in Veterinary and Pharmaceutical<br />
University Brno primary sludges were tested (PS).<br />
s529<br />
S a m p l e s P r e p a r a t i o n<br />
All samples were collected in pure plastic bottle and untill<br />
testing stored in the dark at 4 °C for less than four days prior<br />
the bioassay experiment. Samples were dried at temperature<br />
105 ± 5 °C and sludge dry residue was determinated gravimetrically.<br />
Two types of water leaches were prepared from<br />
studied sewage sludges. The first batch of samples was prepared<br />
in accordance with Czech legislation; the samples were<br />
mixed in ratio 1 : 10 (sludge dry residue: deionised water).<br />
The second one was diluted with deionised water to have<br />
the same dry matter content as anaerobic stabilized sewage<br />
sludges from WWTP Modřice (3.89 %). Sample tubes filled<br />
with defined quantity of sample and water were shaken at<br />
5–10 rpm (revolutions per minute) for 24 hour at temperature<br />
15–25 °C. After centrifugation the leaches supernatants were<br />
removed and filtered using paper filter (5 μm). To assure suitable<br />
surroundings for each testing organism the supernatants<br />
were enriched by adding specific amounts of salts following<br />
OECD Guidelines 3,4 .<br />
P r i n c i p l e o f E c o t o x i c o l o g i c a l<br />
T e s t s<br />
The general principle of ecotoxicological tests is the<br />
determination of effective concentration (EC50), eventually<br />
lethal concentration (LC50) or inhibition concentration<br />
(IC50). These concentrations of tested compound (substance,<br />
sewage water or leaches of sewage sludges) cause the mortality<br />
of 50 % of testing organisms or 50% inhibition of growth<br />
rate in relation to control tests. The organisms are exposed<br />
to the test substance for a period of 24, 48, and 72 hours in<br />
agreement with requirements of a given test. At least five<br />
test concentrations should be used. A stepwise procedure<br />
involves three steps: the preliminary test, the confirmatory<br />
test and the definitive test. The confirmatory test confirms or<br />
disconfirms results of limit test. In preliminary test undiluted<br />
sewage sludges leaches are used. If results of preliminary<br />
test indicate possible ecotoxicity the definitive test follows.<br />
The highest concentration in definitive test should preferably<br />
result in 100% immobilization (mortality or inhibition) and<br />
the lowest concentration tested should preferably give no<br />
observable effect.<br />
A p p l i c a t i o n o f E c o t o x i c i t y T e s t s<br />
f o r S e w a g e S l u d g e s E v a l u a t i o n<br />
Testing organisms (Daphnia magna, Thamnocephalus<br />
platyurus, Sinapis alba.) were used in preliminary test with<br />
raw water sewage leaches (WSL) and in definitive tests with<br />
various testing concentrations of WSL; 50, 100, 200, 500,<br />
700 ml dm –3 . Under the same conditions tests with control<br />
group of the same organisms in standard freshwater but<br />
without WSL were conducted.<br />
The Daphtoxkit FTM makes use of the dormant eggs<br />
of the crustaceans Daphnia magna, which are protected by<br />
chitinous capsule called ephippium. Ephipia can be stored<br />
for long time without losing their viability. When the testing<br />
organisms are needed it is necessary to put chitinous capsule
Chem. Listy, 102, s265–s1311 (2008) Environmental Chemistry & Technology<br />
into specific environmental conditions and during period of<br />
about 3 days testing organisms are ready for use. Daphnids<br />
aged less than 24 were exposed to the sewage leaching at<br />
a range of concentrations 50, 100, 200, 500, 700 ml dm –3 in<br />
definitive tests for a period of 24 and 48 hours at 20–22 °C<br />
and light intensity of 6,000 lux. Immobilization was recorded<br />
at 24 hours and 48 hours and compared with control values.<br />
The results were analyzed in order to calculate the EC50 at 24<br />
and 48 h. Determination of the EC50 at 24 h is optional.<br />
The Thamnotoxkit FTM uses the testing organism Thamnocephalus<br />
platyurus, aged less than 24 hours. The exposition<br />
was 24 h at a range of the same concentrations at 20–22 °C<br />
and 4,000 lux. The obtained results were analysed and the<br />
values LC50 at 24 h were calculated. Two above mentioned<br />
tests are alternative tests, whilst the test on Sinapis alba represents<br />
standard phytotoxicity test. This root growth inhibition<br />
toxicity test was used as a standard OECD test. The high quality<br />
seeds of Sinapis alba were exposed for 78 hours to tested<br />
solution, at temperature 20 ± 2 °C in the dark. After 78 hours<br />
the lengths of hypocotyls of seeds in tested and in control<br />
group were measured and values of IC50 were evaluated.<br />
For a validation of test it is necessary to apply the following<br />
performance criteria; Daphnotoxkit FTM and Thamnotoxkit<br />
FTM – number of dead and immobile organisms should not<br />
exceeded 10 % in control. In root growth inhibition toxicity<br />
test germinability should be more than 90 %.<br />
Results<br />
On the base of the analysis of obtained ecotoxicological<br />
data the values of EC50, LC50 and IC50 were evaluated<br />
for various samples of sewage sludges. These values made<br />
possible the evaluation of sludges ecotoxicity and also facilitated<br />
their categorization from the point of view of the leacha-<br />
Table I<br />
The ecotoxicity of sewage sludges and their classification<br />
24h-EC50 or<br />
Sewages<br />
sludges 24h-LC50<br />
[ml dm –3 ]<br />
Class of<br />
leachability<br />
AS 2<strong>2.</strong>81 III<br />
DWAS 39.57 II<br />
DSAS 139.64 III<br />
PS 38.17 III<br />
s530<br />
Fig. 1. Comparison of ecotoxicity of tested sewage sludges using<br />
testing organisms Thamnocephalus platyurus<br />
bility. Table I summarizes values of 24h-EC50 or 24h-LC50<br />
for the most sensitive testing organisms, which form the basis<br />
for evaluation and categorization of sewage sludges.<br />
Conclusions<br />
Different sewage sludges were tested in respect to their<br />
possible hazardous characteristic - ecotoxicity. On the bases<br />
of obtained results sewage sludges were classified in term<br />
of their leachability. no sample of sewage sludge exhibit<br />
ecotoxicity following the Czech legislation.<br />
This work has been supported by grant COST, action<br />
636, project No. OC-183.<br />
REFEREnCES<br />
1. Wilke, B. M., Riepert, F., Christiane Koch., Kühne, T.:<br />
Ecotoxicol. Environ. Saf., 70, 283 (2008).<br />
<strong>2.</strong> Kubík, V., Hofman, J., Holoubek, I.: Abstract Book<br />
of SETAC Europe the 16th Annual Meeting. Hague,<br />
netherlands: SETAC, 2006. p. 79. 7.5.2006, Hague, The<br />
netherlands., Issue 2, June 2008, pp 283<br />
3. OECD Environmnetal health and Safety Publications:<br />
OECD Guidelines for Testing Chemicals no. 202<br />
(2004).<br />
4. OECD Environmnetal health and Safety Publications:<br />
OECD Guidelines for Testing Chemicals no. 208<br />
(2006).
Chem. Listy, 102, s265–s1311 (2008) Environmental Chemistry & Technology<br />
P95 MICROwAVE DESuLPhuRIZATION OF COAL<br />
InGRID ZnAMEnáČKOVá, MICHAL LOVáS, SILVIA<br />
ČUVAnOVá and ŠTEFAn JAKABSKý<br />
Institute of Geotechnics, SAS, Watsonova 45, 043 53 Košice,<br />
Slovakia,<br />
znamenackova@saske.sk<br />
Introduction<br />
Microwave heating has been used in several studies of<br />
the coal desulfurization. Desulphurization by microwaves is<br />
closely related to the form of sulphur compound in the coal,<br />
the physical and chemical structure, as well as the chemical<br />
activity of the leachant. The ability of molten naOH to desulfurize<br />
the coal has been known for more than three decades.<br />
The process known as molten caustic leaching (MCL) was<br />
tested for the first time in the USA. The objective was the<br />
removing of the mineral components, pyritic and organic sulfur<br />
by the reaction of coal with a mixture of molten sodium<br />
and potassium hydroxides. The MCL process was effectively<br />
applied for the treatment of the Slovak brown coal 1 . Balaz<br />
et al. reported the use of simultaneous grinding and alkaline<br />
chemical leaching process (GACL) on brown coal and found<br />
that more than 41 % of total sulphur reduction was achieved.<br />
Magnetic methods of mineral removal from coal depend<br />
on the difference in the magnetic moment associated with<br />
mineral particles and coal. The microwave heating enhances<br />
the magnetic susceptibility of the iron mineral, thus rendering<br />
it more amenable to the magnetic separation. The effect of<br />
microwave heating on magnetic processing of the pyrite was<br />
investigated 2 , where different size fractions of the pyrite<br />
were heated in a microwave oven at <strong>2.</strong>45 GHz frequency<br />
and different power levels. Ability of coal desulfurization by<br />
magnetic separation following microwave heating was also<br />
investigated 3 . The microwaves were found as an effective<br />
method to selective heating of pyrite in the coal causing the<br />
formation of pyrrhotite. It was stated that pyrrhotite could be<br />
removed by low-intensity magnetic separation. 4–6<br />
Experimental<br />
C o a l S a m p l e C h a r a c t e r i z a t i o n<br />
In this study, five different coal samples were used. They<br />
were ground to less than 3 mm and the representative samples<br />
were prepared. The results of analyses of the total sulphur<br />
content are listed in Table I.<br />
M i c r o w a v e a n d C l a s s i c a l H e a t i n g<br />
The microwave heating of investigated coal samples<br />
was realized in the microwave oven Whirlpool AVM 434<br />
and Panasonic nn 5251 B with maximum power of 900 W,<br />
adjusted for the laboratory purposes for continuos temperature<br />
measuring of heated material. The temperature was measured<br />
using the contactless thermometer Raynger MX4 in the<br />
range 30–900 °C. The classical heating of coal in the mufle<br />
oven was realized as well.<br />
s531<br />
Table I<br />
Total sulphur content in the coal samples<br />
Locality Grain size [mm] S tot [%]<br />
Handlová (SR) –3 1.5<br />
nováky (SR) –3 3.0<br />
Cígeľ (SR) –3 <strong>2.</strong>27<br />
1–3 5.35<br />
Sokolov (CR) 0.07–0.5 6.85<br />
–0.07 7.52<br />
1–3 0.5<br />
0.5–1 0.5<br />
Donbas (R) 0.2–0.5 0.49<br />
0.07–0.2 0.53<br />
–0.07 0.52<br />
M a g n e t i c S e p a r a t i o n<br />
The magnetic separation of the coal samples was carried<br />
out by means of a roll-type electromagnetic separator Mechanobr,<br />
type 138 T-SEM, intended for dry separation.<br />
M i c r o w a v e R a d i a t i o n a n d M o l t e n<br />
C a u s t i c L e a c h i n g – R M C L<br />
A mixture of 15 g coal + 15 g naOH + 10 ml H 2 O was<br />
used as an input to microwave oven operating in nitrogen<br />
atmosphere. Microwave desulphurizastion of coal was realised<br />
according to the Scheme 1.<br />
Scheme 1<br />
The RMCL (Radiation and Molten Caustic Leaching)<br />
desulphurization of coal<br />
Results<br />
M a g n e t i c S e p a r a t i o n o f C o a l<br />
Coal sample of the grain size 0.05–0.2 mm was heated<br />
before magnetic separation in the microwave oven for<br />
10 minutes at the power 900 W and frequency <strong>2.</strong>45 GHz. The<br />
results of the magnetic separation after microwave radiation<br />
are listed in Table II.<br />
The magnetic separation of the coal sample was ineffective<br />
for our conditions.<br />
T h e M o l t e n C a u s t i c L e a c h i n g o f<br />
C o a l<br />
Effect of ratio of NaOh and coal<br />
The effect of ratio of naOH and coal from the Cígeľ<br />
locality after the microwave radiation (<strong>2.</strong>5 minutes) on reduction<br />
of the total sulphur content is displayed in Fig. 1.
Chem. Listy, 102, s265–s1311 (2008) Environmental Chemistry & Technology<br />
Table II<br />
The results of coal magnetic separation after the microwave<br />
radiation<br />
Grain Magnetic Mass yield of Recovery of<br />
size induction magnetic S pyr in mag.<br />
[mm] [T] product [%] prod. [%]<br />
0.13 4.32 39.6<br />
0.24 4.72 43.2<br />
0.05–0.2 0.42 10.80 44.7<br />
0.51 11.54 45.5<br />
Fig. 1. The influence of ratio of NaOH and coal on the total<br />
sulphur content in coal sample (Cígeľ) after RMCL process, Socontent<br />
of sulphur basic sample<br />
From the obtained results, it is possible to state, that<br />
80 % of the total sulphur content is possible to remove by<br />
ratio of naOH : coal = 3 : 1.<br />
Effect of reaction time<br />
The time dependence of microwave heating on decrease<br />
of the total sulphur content in coal from the Cígeľ locality<br />
by ratio of naOH : coal = 1 : 1 is displayed in Fig. <strong>2.</strong> The sulfur<br />
removal increased to 76 % within 5 minutes and reached<br />
85 % at 10 minutes, but after 10 minutes, the change was not<br />
significant.<br />
The total sulphur content decreased from <strong>2.</strong>27 % to 1.0 %<br />
(56 %) in the mufle oven at the temperature 380 °C (within<br />
reaction time 40 minutes). The main difference between the<br />
Fig. <strong>2.</strong> The change of total sulphur content of the coal samples<br />
with time<br />
s532<br />
thermal and microwave heating was the extremely short time<br />
for desulphurization in the case of microwave experiments.<br />
Effect of the coal deposits<br />
The dependence of sulphur content in the coal samples<br />
from the localities Cígeľ, Handlová, nováky in RMCL proces<br />
is displayed in Fig. 3. The conditions of the microwave<br />
heating were following: temperature 380–400 °C, time 3<br />
minutes, the ratio of naOH : coal = 1 : 1.<br />
It can be seen, that the effect of microwave pretreatment<br />
on reduction of the total sulfur content in samples from<br />
nováky and Cígeľ (52–56 %) is higher than in sample from<br />
Handlová (28 %).<br />
Fig. 3. RMCL for coal samples from Handlová, Nováky, Cígeľ<br />
Effect of the particle size<br />
The influence of particle size on chemical desulfurization<br />
process was also studied. The representative samples<br />
were divided in fractions of 1–3, 0.5–1, 0.07–0.5, < 0.07 mm<br />
and microwave heating of samples from Donbas (500 W and<br />
6 minutes) and Sokolov (750 W and 3 minutes) was realized.<br />
The results are given in Figs. 4. and 5.<br />
The decrease about 25 % of the total sulphur content<br />
was in the sample from Sokolov eminent. The influence of<br />
graine size was negligible.<br />
The decrease about 35 % of the total sulphur content in<br />
black coal from Donbas locality for graine size 1–3 mm was<br />
observed.<br />
Fig. 4. The decrease of the total sulphur content in sample from<br />
Sokolov versus different size fraction in RMCL process
Chem. Listy, 102, s265–s1311 (2008) Environmental Chemistry & Technology<br />
Fig. 5. The decrease of the total sulphur content in sample from<br />
Donbas versus different size fraction in RMCL process<br />
Conclusions<br />
Microwave heating of the coal is advantageous for the<br />
subsequent desulphurization. Conventional procedure of<br />
coal desulphurization requires heating period about 40 minutes<br />
and microwave procedures reduces this heating period<br />
s533<br />
for a few minutes. The use of microwave radiation for the<br />
desulphurisation of coal displays potential and may be soon a<br />
commercial reality. This would allow the use of high sulphur<br />
coals in an environmentally and economically sound way.<br />
This work was supported by the Slovak Research and<br />
Development Agency under the contract No. APVV-51-<br />
035505.<br />
REFEREnCES<br />
1. Balaz, P., LaCount, R. B., Kern, D. G., Turcaniova, L:<br />
Fuel 2001, 80.<br />
<strong>2.</strong> Uslu U, Atalay A. I. Arol A I: Colloids Surf. A, Physicochem.<br />
Eng. Asp. 225, 1 (2003).<br />
3. Uslu U, Atalay A: Fuel Process. Technol. 85, 1 (2004).<br />
4. Jorjani, E., Rezai, B., Vossoughi, M., Osanloo, M: Fuel<br />
83, 7 (2004).<br />
5. Kingman S. W., Rowson n. A.: Min. Eng. 11, 11<br />
(1998).<br />
6. Kingman S. W., Rowson n. A.: J. Microwave Power<br />
Electromagn. Energ. 35, 3 (2000).
Chem. Listy, 102, s265–s1311 (2008) Environmental Chemistry & Technology<br />
P96 ThE bIOLOGICAL ACTIVITy OF 16α(H)-<br />
PhyLLOCLADANE ISOLATED FROM<br />
SLOVAK bROwN COAL<br />
AnTOn ZUBRIK a , AnDREA LAUKOVá b , ALEnA<br />
GáBELOVá c , ZUZAnA VALOVIČOVá c , ľUDMILA<br />
TURČánIOVá a and JOSEF CVAČKA d<br />
a Institute of Geotechnics, Slovak Academy of Sciences, Watsonova<br />
45, 043 53 Košice, Slovakia,<br />
b Institute of Animal Physiology, Slovak Academy of Sciences,<br />
Šoltésovej 4–6, 040 01 Košice, Slovakia,<br />
c Cancer Research Institute, Slovak Academy of Sciences,<br />
Vlárska 7, 833 91, Bratislava, Slovakia,<br />
d Institute of Organic Chemistry and Biochemistry v.v.i., Academy<br />
of Sciences of the Czech Republic,<br />
Flemingovo nám. 2, 166 10 Prague 6, Czech Republic,<br />
zubant@saske.sk<br />
Introduction<br />
The coal research brings novel opportunities for nonfuel<br />
utilization. One of the promising ways is extraction and<br />
isolation of organic compounds (diterpenes, humic acids)<br />
with potential biological activity. The Slovak coals (nováky<br />
lignite and Handlová brown coal) contain high amounts of<br />
tetracyclic diterpene hydrocarbons 1,2 , which can be valuable<br />
precursors for pharmaceutical products. Kauranes and phyllocladanes<br />
are important diastereoisomeric tetracyclic diterpene<br />
biomarkers. Tetracyclic diterpene derivates isolated<br />
from plants show a strong biological activity and they are<br />
active components of many plant medicaments and extracts<br />
used in folk medicine. Kauranes exhibit an anti-microbial,<br />
anti-HIV, anti-inflamatory, anti-fertility, antiparasitic, insect<br />
anti-feedant, antifungal and cytotoxic activities 3 . Phyllocladanes<br />
are very rare in the nature; nevertheless, they were<br />
also identified and isolated from several plants. Orizaterpenol<br />
(phylloklad-15-en-6β,14βdiol) from the rice hull of Oryza<br />
sativa shows cytotoxicity against murine leukemia cells 4 .<br />
The use of phyllocladane diterpenoids for plant growth promotion<br />
and/or retardation is already patented 5 .<br />
The biological activity of tetracyclic diterpenoids isolated<br />
from the geological samples has not been studied yet,<br />
therefore the main goal of our work was to isolate tetracyclic<br />
diterpane from the coal and test its biological activity in<br />
vitro.<br />
Experimental<br />
I s o l a t i o n o f 1 6 α ( H ) - P h y l l o c l a d a n e<br />
f r o m S l o v a k B r o w n C o a l<br />
The brown coal (50 kg) was collected in several places<br />
of the Handlová mining area (Fig. 1.) and a representative<br />
sample was obtained by quartation.<br />
Before the extraction; the Slovak brown coal from Handlová<br />
was physically treated on hydrocyclone 7 to obtain<br />
quality carbon product with A d (ash content) = 7.70 % wt.,<br />
W a (moisture) = 1<strong>2.</strong>26 % wt., C d = 61.6 %, H d = 5.6 %,<br />
n d = 0.7 %, S d = 1.2 %, O d = 23.2 %. Further, the coal (20 g)<br />
s534<br />
Fig. 1. The situation map of Handlová-Nováky coal basin with<br />
Handlová mining area in central part of Slovakia (adapted from<br />
ref. 6 )<br />
was extracted with dichloromethane (250 ml) in microwave<br />
oven (Wirlpool AVM 434, 500 W, <strong>2.</strong>45 GHz) in distilling<br />
flask with reversing reflux system (20 min). After the extraction,<br />
the mixture was filtered and the solvent was evaporated.<br />
The crude extract (367 mg) was re-extracted on SPE column<br />
(Chromabond SiOH, Macharey – nagel GmbH + Co. KG)<br />
with n-hexane (100 ml). The solvent was evaporated and<br />
the purified SPE extract (112 mg) was further separated by<br />
column chromatography on silica gel (5 g of Kieselgel 60,<br />
granularity 0.06 – 0.2 mm, Carl Roth GmbH + Co. KG) with<br />
4 × 20 ml of hexane to four fractions denominated as F1–F4.<br />
All fractions were analyzed by TLC and GC/MS. 16α(H)phyllocladane<br />
was found in the F1 fraction. TLC analysis<br />
of F1 showed presence of a single spot with R F = 0.91, that<br />
contained three compounds: the most abundant component<br />
(81.6 %) was 16α(H)-phyllocladane; second one was isopimarane<br />
(11.2 %) and finally 18-norisopimarane (3.9 %).<br />
Unambiguous identification as 16α(H)-phyllocladane was<br />
achieved by coinjection of the sample and standards in the<br />
laboratory of Prof. Bernd Simoneit (Oregon State University,<br />
USA). The final isolate (36.7 mg) named as TD1 containing<br />
81.6 % of 16α(H)-phyllocladane was used for further biological<br />
tests.<br />
B a c t e r i a l S t r a i n s<br />
All tested Gram + and Gram – bacteria (Enterococcus spp.,<br />
β-hemolytic streptococci, Staphylococcus aureus CCM 3953,<br />
S. aureus SA5, Listeria innocua LMG 13568 Enterobacter<br />
cloacae 5139, 19259, 4417, Klebsiella pneumoniae 1962,<br />
12506, 5182, 1366, Serratia marcescens 19194, Salmonella<br />
enterica serovar Duesseldorf SA31, S. enterica ser. enteritidis<br />
PT4, Shewanella putrefaciens, E. coli K88, E. coli 6295,<br />
5765) were of human or veterinary origin (isolated from the<br />
various wounds, blood, sputum and faeces). The strains were<br />
maintained on the appropriate selective media according to<br />
ISO.
Chem. Listy, 102, s265–s1311 (2008) Environmental Chemistry & Technology<br />
S p o t T e s t<br />
The antimicrobial activity was determined by the diffusion<br />
agar spot test 8 . For the testing, TD1 was dissolved<br />
in n-hexane and the various concentration ranges of TD1<br />
(600 mg ml –1 ; 300 mg ml –1 ; 150 mg ml –1 ; 75 mg ml –1 ) and<br />
several volume doses were used; 5 μl is optimal dosage to<br />
test on solid agar containing the indicator strain. The solvent<br />
n-hexane was used as a control. After 24 hours of incubation<br />
at 37 °C, the inhibitory zones were evaluated. MICs (minimal<br />
inhibitory concentrations) were expressed as the lowest<br />
concentration of TD1 inhibiting the growth of the indicator<br />
bacteria (mg ml –1 ).<br />
C e l l L i n e<br />
The human hepatoma cell line HepG2 was generously<br />
provided by Prof. Andrew R. Collins (University of Oslo,<br />
norway). HepG2 cells were maintained in William´s modified<br />
medium supplemented with 10% fetal calf serum and<br />
antibiotics (penicillin 200 U ml –1 , streptomycin and kanamycin<br />
100 µg ml –1 ) at 37 ºC in humidified 5% CO 2 atmosphere.<br />
C e l l T r e a t m e n t<br />
Hep G2 cells were grown for 48 h until semi-confluency,<br />
prior to exposition to TD1 and positive control. TD1 was dissolved<br />
in ethanol at 40 ºC freshly before use and added to culture<br />
medium to reach the final concentrations ranging from<br />
0.045 to 0.5 mg ml –1 for 24 hours. The concentration of the<br />
solvent never exceeded 0.1 %. Control cells were exposed<br />
to 0.1% ethanol. Cells were exposed to hydrogen peroxide<br />
(150 µM), the positive control, on ice in dark for 5 minutes.<br />
S i n g l e C e l l G e l E l e c t r o p h o r e s i s<br />
( S C G E )<br />
The procedure of Singh et al. 9 , modified by Collins et<br />
al. 10 and Slameňová et al. 11 was followed. The data were evaluated<br />
statistically by the Student’s t-test.<br />
Results and Discussion<br />
The details of isolation and structure elucidation of<br />
16α(H)-phyllocladane (Fig. <strong>2.</strong>) was published previously 2,12 .<br />
Fig. <strong>2.</strong> The structure of 16α(H)-phyllocladane<br />
A n t i m i c r o b i a l A c t i v i t y<br />
TD1 inhibited the growth of 3 Gram – bacteria (Kl. pneumoniae<br />
5182, 1366; E. coli 5765) among 19 tested strains.<br />
MIC value for these strains is 300 mg ml –1 . Others tested bacteria<br />
were not sensitive to TD1. The antibacterial activity of<br />
s535<br />
tetracyclic diterpene (ent-kauren-19-oic acid) was detected<br />
particularly against Gram + bacteria 13 . In our case, this is the<br />
primary and first unique result associated with inhibitory activity<br />
of phyllocladane against Gram - , pathogenic bacteria such<br />
as Klebsiella spp. It is necessary to note that for the further<br />
practical usage, the selectivity of the potential pharmaceutical<br />
compound is one of the principal conditions.<br />
G e n o t o x i c i t y<br />
Based on previous cytotoxicity experiments (data not<br />
shown), the genotoxic activity of TD1 was evaluated at concentrations<br />
0.045–0.5 mg ml –1 (Fig. 3.). In general, only a<br />
weak cytotoxicity (~ 20%) was determined at these highest<br />
concentrations.<br />
A linear dose dependent increase of DnA migration was<br />
detected in TD1-exposed cells (r 2 = 0.8732). A mild but statistically<br />
significant increase of DnA damage was found at<br />
concentrations 0.25–0.5 mg ml –1 (p < 0.05–0.01). There are<br />
limited data concerning the toxicity of phyllocladane-type<br />
diterpenes. Recently, Chung et al. 4 reported a strong cytotoxicity<br />
of orizaterpenol in P388cells.<br />
Fig. 3. The level of DNA damage induced by TD1 in hepG2<br />
cells. Cells were exposed to various concentrations of TD1 for<br />
24 hours. ‡ – positive control – h 2 O 2 (0.15 mM). Significantly<br />
different from control cells determined by Student’s t-test, *<br />
p < 0.05, **p < 0.01 and ***p < 0.001<br />
Conclusions<br />
Biological activity of TD1 (containing 81.4 % of 16α(H)phyllocladane)<br />
from Handlová brown coal was assayed in<br />
vitro using pathogenic bacteria and the human hepatoma cell<br />
line HepG<strong>2.</strong> The selective antimicrobial effect against Gram -<br />
strains of Kl. pneumoniae 5182, 1366, E. coli 5765 was determined<br />
with MIC up to 300 mg ml –1 . In addition, TD1 induced<br />
DnA damage in human tumor cell line HepG2 without strong<br />
cytotoxicity. Further search for biological active compounds<br />
from Slovak coal and others biological tests will be carried<br />
out.<br />
This work was supported by the Slovak Research and<br />
Development Agency under the contracts APVV-51-035505;
Chem. Listy, 102, s265–s1311 (2008) Environmental Chemistry & Technology<br />
SK-CZ-0097-07, the Slovak Grant Agency for Science VEGA<br />
(2/7163/27), the Ministry of Education, Youth and Sports of<br />
the Czech Republic (MEB 080863) and Academy of Sciences<br />
of the Czech Republic (Research project Z40550506). Tested<br />
bacteria were isolated at IAP SAS, Laboratory of Animal<br />
Microbiology, Košice, Slovakia and kindly supplied by Dr.<br />
Vasilková (PI, SAS Košice, Slovakia), Dr. Líšková (Hospital<br />
in Nitra, Slovakia), Dr. Šišák, (IVM, Brno, Czech Republic),<br />
prof. De Vuyst (University Brussel, Belgium).<br />
REFEREnCES<br />
1. Streibl M., Kristín M., Krupčík J. Stránsky K.: An.<br />
Quim. 68, 879 (1972).<br />
<strong>2.</strong> Zubrik A.: Dissertation. Institute of Geotechnics of Slovak<br />
Academy of Sciences, Košice, Slovakia, 2007.<br />
3. Guisalberti E. L.: Fitoterapia 68, 303 (1997).<br />
4. Chung I. M., Ali M., Hahn S. J., Siddiqui n. A., Lim Y.<br />
H., Ahmad A.: Chem. nat. Compd. 41, 182 (2005).<br />
5. Singh A. K., Bagchi G. D., Singh S., Dwivedi P. D.,<br />
Gupta A. K., Khanuja S. P. S.: USP 6673749 (2004).<br />
s536<br />
6. Machájová Z., Verbich F., Sýkorová I.: Acta Montanistica<br />
Slovaca 5, 261 (2000).<br />
7. Hredzák S.: Gospodarka Surowcami Mineralnymi 15,<br />
221 (1999).<br />
8. De Vuyst L., Callewaert R., Pot B.: Syst. Appl. Microbiol.<br />
19, 9 (1996).<br />
9. Singh n. P., McCoy M. T., Tice R. R., Schneider E. L.:<br />
Exp. Cell Res. 175, 184 (1988).<br />
10. Collins A. R., Duthie S. J., Dobson V. L.: Carcinogenesis<br />
14, 1733 (1993).<br />
11. Slameňová D., Gábelová A., Ružeková L., Chalupa I.,<br />
Horváthová E., Farkašová T., Bozsakyová E., Stetina R.:<br />
Mutat. Res. 383, 243 (1997).<br />
1<strong>2.</strong> Zubrik A., Šaman D., Vašíčkova S., Simoneit B. R. T.,<br />
Turčániová ľ., Lovás M., Cvačka J.: Organic Geochemistry<br />
(submitted).<br />
13. Mendoza L., Wilkens M., Urzúa A.: J. Ethnopharmacol.<br />
58, 85 (1997).


