

2. ENVIRONMENTAL ChEMISTRy & TEChNOLOGy 2.1. Lectures
2. ENVIRONMENTAL ChEMISTRy & TEChNOLOGy 2.1. Lectures
2. ENVIRONMENTAL ChEMISTRy & TEChNOLOGy 2.1. Lectures

You also want an ePaper? Increase the reach of your titles
YUMPU automatically turns print PDFs into web optimized ePapers that Google loves.
Chem. Listy, 102, s265–s1311 (2008) Environmental Chemistry & Technology<br />
<strong>2.</strong> <strong>ENVIRONMENTAL</strong> <strong>ChEMISTRy</strong><br />
& <strong>TEChNOLOGy</strong><br />
<strong>2.</strong>1. <strong>Lectures</strong><br />
L02 DEGRADATION PRODuCTS OF<br />
SyNThETIC POLyMERS AS EMERGING<br />
<strong>ENVIRONMENTAL</strong> CONTAMINANTS<br />
JOSEF ČáSLAVSKý, MILADA VáVROVá, DAnIELA<br />
MáCOVá and LUDMILA MRAVCOVá<br />
Institute of Chemistry and Technology of Environmental Protection,<br />
Faculty of Chemistry, Purkyňova 118, 612 00 Brno,<br />
Czech Republic,<br />
caslavsky@fch.vutbr.cz<br />
Introduction<br />
Synthetic polymers belong to attributes of modern life; it<br />
is hard to imagine contemporary lifestyle without them.<br />
These materials came into existence before almost 200<br />
years. In 1811 french pharmacist Henry Braconnot prepared<br />
the first man-made material by treating of wood and cotton<br />
by concentrated nitric acid. This material was called “xyloidin”<br />
and it hasn’t found any practical use. The term “polymer”<br />
was proposed later in 1833 by Jöns Jakob Berzelius.<br />
The first semi-synthetic polymer, vulcanized rubber, was<br />
synthesized by Charles Goodyear in 1839. Very popular and<br />
widely used celluloid was discovered in 1870 by John Wesley<br />
Hyatt; it was prepared from nitrocellulose and camphor. All<br />
these polymers were based on raw materials of natural origin.<br />
The first fully synthetic (and also very popular) polymer was<br />
bakelite, which was prepared between years 1907–1909 by<br />
Belgian chemist Leo Baekeland.<br />
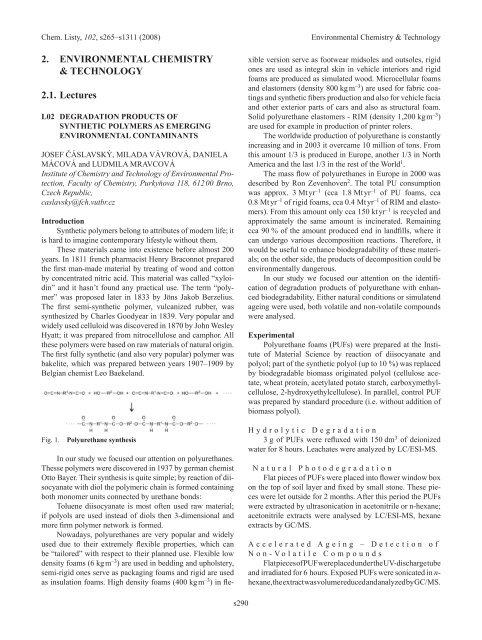
Fig. 1. Polyurethane synthesis<br />
In our study we focused our attention on polyurethanes.<br />
Thesse polymers were discovered in 1937 by german chemist<br />
Otto Bayer. Their synthesis is quite simple; by reaction of diisocyanate<br />
with diol the polymeric chain is formed containing<br />
both monomer units connected by urethane bonds:<br />
Toluene diisocyanate is most often used raw material;<br />
if polyols are used instead of diols then 3-dimensional and<br />
more firm polymer network is formed.<br />
nowadays, polyurethanes are very popular and widely<br />
used due to their extremely flexible properties, which can<br />
be “tailored” with respect to their planned use. Flexible low<br />
density foams (6 kg m –3 ) are used in bedding and upholstery,<br />
semi-rigid ones serve as packaging foams and rigid are used<br />
as insulation foams. High density foams (400 kg m –3 ) in fle-<br />
s290<br />
xible version serve as footwear midsoles and outsoles, rigid<br />
ones are used as integral skin in vehicle interiors and rigid<br />
foams are produced as simulated wood. Microcellular foams<br />
and elastomers (density 800 kg m –3 ) are used for fabric coatings<br />
and synthetic fibers production and also for vehicle facia<br />
and other exterior parts of cars and also as structural foam.<br />
Solid polyurethane elastomers - RIM (density 1,200 kg m –3 )<br />
are used for example in production of printer rolers.<br />
The worldwide production of polyurethane is constantly<br />
increasing and in 2003 it overcame 10 million of tons. From<br />
this amount 1/3 is produced in Europe, another 1/3 in north<br />
America and the last 1/3 in the rest of the World 1 .<br />
The mass flow of polyurethanes in Europe in 2000 was<br />
described by Ron Zevenhoven 2 . The total PU consumption<br />
was approx. 3 Mt yr –1 (cca 1.8 Mt yr –1 of PU foams, cca<br />
0.8 Mt yr –1 of rigid foams, cca 0.4 Mt yr –1 of RIM and elastomers).<br />
From this amount only cca 150 kt yr –1 is recycled and<br />
approximately the same amount is incinerated. Remaining<br />
cca 90 % of the amount produced end in landfills, where it<br />
can undergo various decomposition reactions. Therefore, it<br />
would be useful to enhance biodegradability of these materials;<br />
on the other side, the products of decomposition could be<br />
environmentally dangerous.<br />
In our study we focused our attention on the identification<br />
of degradation products of polyurethane with enhanced<br />
biodegradability. Either natural conditions or simulatend<br />
ageing were used, both volatile and non-volatile compounds<br />
were analysed.<br />
Experimental<br />
Polyurethane foams (PUFs) were prepared at the Institute<br />
of Material Science by reaction of diisocyanate and<br />
polyol; part of the synthetic polyol (up to 10 %) was replaced<br />
by biodegradable biomass originated polyol (cellulose acetate,<br />
wheat protein, acetylated potato starch, carboxymethylcellulose,<br />
2-hydroxyethylcellulose). In parallel, control PUF<br />
was prepared by standard procedure (i.e. without addition of<br />
biomass polyol).<br />
H y d r o l y t i c D e g r a d a t i o n<br />
3 g of PUFs were refluxed with 150 dm 3 of deionized<br />
water for 8 hours. Leachates were analyzed by LC/ESI-MS.<br />
n a t u r a l P h o t o d e g r a d a t i o n<br />
Flat pieces of PUFs were placed into flower window box<br />
on the top of soil layer and fixed by small stone. These pieces<br />
were let outside for 2 months. After this period the PUFs<br />
were extracted by ultrasonication in acetonitrile or n-hexane;<br />
acetonitrile extracts were analysed by LC/ESI-MS, hexane<br />
extracts by GC/MS.<br />
A c c e l e r a t e d A g e i n g – D e t e c t i o n o f<br />
n o n - V o l a t i l e C o m p o u n d s<br />
Flat pieces of PUF were placed under the UV-discharge tube<br />
and irradiated for 6 hours. Exposed PUFs were sonicated in nhexane,<br />
the extract was volume reduced and analyzed by GC/MS.
Chem. Listy, 102, s265–s1311 (2008) Environmental Chemistry & Technology<br />
A c c e l e r a t e d A g e i n g – D e t e c t i o n o f<br />
V o l a t i l e C o m p o u n d s<br />
Flat pieces of PUFs were placed into accelerated ageing<br />
device (Fig. <strong>2.</strong>) composed of quartz tube open on one end<br />
(length 24.5 cm, I.D. 3.5 cm) with input tubing and Teflon<br />
cover. The device was placed under UV discharge tube.<br />
Two SPME devices were inserted into both input and output<br />
tubing (the first with polydimethylsiloxane fibre, the second<br />
with polyacrylate fibre) and the ends of the device together<br />
with SPME holders were covered by aluminium foil to protect<br />
them against the UV light. The irradiation tooks place<br />
for 6 hours. After this period, SPME devices were directly<br />
analyzed by GC/MS.<br />
Fig. <strong>2.</strong> Accelerated ageing device<br />
H P L C / M S<br />
For HPLC/MS the Esquire-LC instrument (Bruker Daltonics,<br />
Bremem, Germany) was used. This system consists<br />
of the Agilent HPLC 1100 Series with binary gradient pump,<br />
electrospray ion source and spherical ion trap analyzer. A Supelcosil<br />
LC-18DB column (<strong>2.</strong>1 × 250 mm, 5 µm particles)<br />
was used (Supelco, USA). Gradient elution from 30 to 100 %<br />
acetonitrile in water in 30 min was used at constant flow rate<br />
of 0.25 ml min –1 . For the detection both UV-VIS detector of<br />
DAD type, and mass spectrometry were used. Drying temperature<br />
in electrospray was 350 °C, nebuilizing gas (n 2 ) pressure<br />
was 50 psi, and drying gas (n 2 ) flow was 14 dm 3 min –1 .<br />
Both positive and negative ions were registered (in separate<br />
runs).<br />
G C / M S<br />
System Agilent 6890n GC/5973 MSD (Agilent Technologies,<br />
Waldbronn, Germany) was employed. The column<br />
was HP-5MS 5 m × 0.25 mm × 0.25 µm, helium at a flow of<br />
1 ml min –1 was used as carrier gas in constant flow mode.<br />
Temperature program was as follows: 50 °C for 1 min, then<br />
to 280 °C at 5 °C min –1 , final isotherm 5 min. 1 µl of sample<br />
was injected in splitless mode at a temperature of 280 °C with<br />
Fig. 3. Structure of PuF hydrolytic degradation product<br />
s291<br />
splitless time of 1 min. Interface temperature was 260 °C,<br />
temperature of ion source and quadrupole 230 and 150 °C,<br />
respectively. Electron ionization at 70 eV electron energy<br />
was used, spectra were registered in scan mode within the<br />
range of 50–450 amu. nIST 05 spectral library was used for<br />
the identification of separated compounds.<br />
Fig. 4. PuF non-volatile degradation products. Compound<br />
identification: 1: bis(2-ethylhexyl) ester of hexanedioic acid;<br />
2: di-tolyl-isocyanate<br />
Results<br />
Typical LC chromatogams of PUF extract show only<br />
two peaks at the beginning. Using the LC/MS/MS experiments<br />
and MS n with direct insfusion of the sample, the probable<br />
structure of main degradation product was proposed (see<br />
Fig. 3.).<br />
This structure is evidently a fragment of polyurethane<br />
polymer chain.<br />
Fig. 4. shows the chromatogram of hexane extract of<br />
polyurethane after UV irradiation. Using the database search<br />
several peaks were successfully identified, but in many cases<br />
the identification was unsuccesfull, in spite of the fact that the<br />
experimental spectrum was of good quality. The most probable<br />
explanation is that the nIST05 database doesn’t contain<br />
Fig. 5. Volati1e degradation products (PDMS fibre). Compound<br />
identification: 1: 2-methyl-1,3-dioxane; 2: 2,6-diisocyanatotoluene;<br />
3: 6,10-dimethyl-5,9-undecadiene-2-one; 4: 2,5-diterc-butyl-1,4-benzochinone;<br />
5: pentadecane; 6: hexadecane; 7:<br />
2,6-bis(1,1-dimethyethyl)-4-(1-oxopropyl)phenol; 8: dodecanoic<br />
acid methylester; 9: 4-decyl-morpholine; 10: heptadecane; 11:<br />
2,6,10,14-tetramethyl-pentadecane; 12: ?? (isoprenoid alkane);<br />
13: tetradecanoic acid isopropylester; 14: 4-undecyl-morpholine;<br />
15: N,N-dimethyl-1-hexadecanamine; 16: 4-tetradecylmorpholine;<br />
17: squalene; 18: 4-hexadecyl-morpholine
Chem. Listy, 102, s265–s1311 (2008) Environmental Chemistry & Technology<br />
Fig. 6. Volati1e degradation products (PA fibre). Compound<br />
identification: 1: 2-(2-ethoxyethoxy)-ethanol; 2: 2-ethylhexanoic<br />
acid; 3: 1,3-dioxane; 4: 2-methyl-1,3-dioxolane; 5:<br />
2-methyl-1,3-diisocyanatobenzene; 6: 2,6-bis(1,1-dimethyethyl)-4-(1-oxopropyl)phenol;<br />
7: 4-decyl-morpholine; 8: 4-undecyl-morpholine;<br />
9: N,N-dimethyl-1-hexadecanamine; 10: 4-tetradecyl-morpholine;<br />
11: 4-hexadecyl-morpholine<br />
mass spectra of compounds of this type. The only possibility<br />
of structure revealing in these cases remains the manual interpretation<br />
using the common fragmentation rules 3 .<br />
Fig. 5. shows the chromatogram of volatile degradation<br />
products of PUF with addition of hydroxyethylcellulose<br />
adsorbed by SPME on PDMS fibre. Various classes of compounds<br />
were found – alkanes, esters of fatty acids, morpholine<br />
derivatives, but also poisonous 2,6-diisocyanatotoluene.<br />
Fig. 6. depicts the same degradation products adsorbed on<br />
polyacrylate fibre. In this case more polar compounds are<br />
preferred like morpholine derivatives, but again toxic 2,6-diisocyanatotoluene<br />
(compound 2) was found.<br />
Composition of the degradation products also depends<br />
on the type of biodegradable filler. Toluene diisocyanate was<br />
found only when hydroxyethylcellulose and cellulose acetate<br />
were applied.<br />
s292<br />
Conclusions<br />
Degradation products of polyurethane foams with enhanced<br />
biodegradability were studied. Both degradation under<br />
natural conditions and accelerated ageing were used, both<br />
non-volatile and volatile compounds were analysed using<br />
liquid and gas chromatography interfaced to mass spectrometry.<br />
The composition of degradation products was influenced<br />
by the type of biodegradable filler used instead of 5 % of<br />
polyether polyol in the polyurethane synthesis. When modified<br />
cellulose was used, poisonous toluene diisocyanate was<br />
identified as volatile degradation product. The identification<br />
of products separated by GC by library search was unsuccesfull<br />
in many cases; the reason is problably caused by the fact<br />
that the used MS library is commonly oriented and doesn’t<br />
contain the spectra of PUF degradation products.<br />
Following research will be focused on the quantitative<br />
analysis of PUF degradation products, either using SPME<br />
and suitable surrogates, or using adsorption tubes with suitable<br />
adsorbent.<br />
The finantial support from the project no.MSM<br />
0021630501 from Ministry of Education, Youth and Sport of<br />
the CR is greatly acknowledged.<br />
REFEREnCES<br />
1 http://www.poliuretanos.com.br/Ingles/Chapter1/<br />
11Market.htm<br />
<strong>2.</strong> Zevenhoven R., Ph.D. Thesis, Helsinki University of<br />
Technology, Helsinki, Finland, 2004<br />
3. McLafferty F., Tureček F.: Interpretation of Mass<br />
Spectra. University Science Books, USA, 1993.
Chem. Listy, 102, s265–s1311 (2008) Environmental Chemistry & Technology<br />
L03 uSAGE OF GAS ChROMATOGRAPhy<br />
AND IMS DETECTION FOR EVALuATION<br />
OF POLyMER bARRIER MATERIAL<br />
PROPERTIES<br />
JAnA DVOřáKOVáa and IVAn MAŠEKb aVOP-026 Šternberk, s.p., division VTÚO Brno, Veslařská<br />
230, 637 00 Brno, Czech Republic,<br />
bFaculty of Chemistry, VUT, Purkyňova 118, 612 00 Brno,<br />
Czech Republic,<br />
dvorakova.j@vtuo.cz<br />
Introduction<br />
The protective properties are the most important parameters<br />
for selection of well-suited materials for construction<br />
of individual protective equipment (IPE). These properties<br />
determine ability of a given IPE against the highly toxic<br />
agents and industrial harmful substances under short time<br />
and/or long time contamination in the gaseous and liquid<br />
phases.<br />
The most frequently used protective materials for IPE<br />
are polymer barrier materials. Their numerous advantages<br />
such as easy availability, possibility of mass production,<br />
relative low cost as well as the broad range of manufactured<br />
qualities determine their use for different protective purposes.<br />
Single-layer or laminated polymers and textile with polymeric<br />
or elastomeric layer are used as barrier materials. It is<br />
possible to use metallic film, PET sheet with layer of SiOx<br />
(e.g. material CERAMIX from company ALCAn) or other<br />
nanolayers, adsorption textile (e.g. SARATOGA with spherical<br />
sorbent or Charcoal Cloth made from activated carbon<br />
fibres) eventually special membranes (e.g. nAFIOn, GORE-<br />
TEX, POROTEX, PURTEX etc.) with specific diffusion properties<br />
for toxic agents.<br />
Resistance of polymer barrier materials against harmful<br />
substances is defined as parameter called breakthrough<br />
time (BT) 1,2,3,4 . Breakthrough time is the most widespread<br />
way of barrier materials evaluation in term of constructional<br />
usage of materials, their manufacture and conditions of their<br />
selection.<br />
Experimental<br />
The procedures for evaluation of protective properties<br />
are elaborated in accordance with the Czech Technical Standard<br />
ČSn ISO En 6529 (October 2001) which results from<br />
American Standard ASTM F 739-99a (August 1999)5,6. The<br />
above-mentioned standard describes experimental methods<br />
used for testing of barrier materials resistance against permeation<br />
of liquid and gaseous substances and, among other<br />
things (e.g. conditions of measurement for closed-loop or<br />
open-loop, continual and discontinual measurement, preparation<br />
of samples etc.) recommends suitable analytical techniques<br />
for evaluation of permeation toxic vapors. The gas<br />
chromatography (GC) is one of these techniques which is<br />
commonly used for detection and identification of chemical<br />
warfare agents (CWA) as well as ion mobility spectrome-<br />
s293<br />
try (IMS)7,8,9,10. The 2, 2’-dichlorodiethylsulfide (sulphur<br />
mustard, HD) was used for measurement of permeation as<br />
testing chemical. The double-sided butyl rubber polyamide<br />
fabric was used as the used tested material.<br />
P e r m e a t i o n M e t h o d<br />
The following methods were selected for evaluation of<br />
barrier properties of polymer materials11,12,14,15. The principle<br />
of these methods is illustrated by visual demonstration<br />
on Fig. 1. where the scheme of alternative permeation cell<br />
that is used for measurement at aerodynamics conditions.<br />
The alternative permeation cell respects requirements of<br />
standard ČSn En ISO 6529. This cell is made from stainless<br />
steel. The clamping system is solved by the one central<br />
withdrawal nut (see scheme on Fig. 1.) that makes possible<br />
not only quick clamping and exchange of tested materials but<br />
also total obturation of samples. The tested material separates<br />
the alternative cell into two parts. Upside of cell contains<br />
testing chemical (here sulphur mustard) and on the other side<br />
the permeating gas or vapor is swept away into the carrier gas<br />
leading to detector. The carrier gas and agent vapors mixture<br />
is then analyzed by suitable detection techniques.<br />
Fig. 1. Scheme of alternative permeation cell used for measurement<br />
at aerodynamics conditions<br />
C o m p o s i t i o n o f E x p e r i m e n t a l<br />
S y s t e m<br />
The experimental system for permeation measurement<br />
of toxic agents was designed in accordance with the standard<br />
ČSn En ISO 6529. The clean air comes through drying<br />
column (the clean air is represented by blue arrows) washes<br />
lower part of tested material. The air stream carry away permeating<br />
vapors of testing chemical to the given detector (the<br />
air containing vapors of testing chemical is represents by red<br />
arrow). This system was modified according to the used kind<br />
of detection (see scheme on Fig. <strong>2.</strong>).<br />
GC and IMS detector GID-3 were used for analysis of<br />
permeating sulfur mustard vapors. The GC equipped with<br />
FID detector, Agilent 6890, was used for separation of gases<br />
and vapors between mobile and stationary phase. The components<br />
are separated on the basis of holding ability of the<br />
stationary phase into the chromatographic column. This analytical<br />
method enables evaluation of taken samples using
Chem. Listy, 102, s265–s1311 (2008) Environmental Chemistry & Technology<br />
Fig. <strong>2.</strong> Composition of usable experimental system for measurement<br />
of permeation of toxic agent through protection barrier<br />
materials<br />
thermal desorption from solid phase sorbent (Tenax TA),<br />
direct solvent liquid extraction (n-hexane) and solid phase<br />
extraction (SPE) method. The IMS detector GID-3 operates<br />
on the basis of the different mobility of ions in gaseous phase<br />
in the homogeneous electric field.<br />
The investigated barrier material sample was fixed<br />
inside the alternative permeation cell (see scheme on Fig. 1.)<br />
and contaminated from the upper side with defined amount of<br />
liquid HD agent. The permeating agent vapors were sampled<br />
from the permeation cell space under the material sample<br />
by the IMS detector. The air-drying column was connected<br />
at the front end of the permeation cell inlet to protect IMS<br />
detector against moisture. IMS detector was connected to the<br />
PC where the measured data was continually acquired, saved<br />
and graphically evaluated (see chart on Fig. 3. and Fig. 4.)<br />
with using the software BarieraSW2006 especially designed<br />
for this purpose.<br />
The scheme of LI/GC and TD/GC testing system is<br />
shown on Fig. <strong>2.</strong> The same configuration of permeation cell<br />
including the investigated material sample placing and contamination<br />
procedure was used. The special sampling device<br />
equipped with a controlled air pump and flow meter was used<br />
for permeating agent sampling by the solid phase extraction<br />
ASSET-32 tubes, direct solvent liquid extraction (DSLE)<br />
by n-hexane (for GC, ≥ 99.0 %) and DAAMS Tenax thermal<br />
desorption tubes. Air flow of 100 mL/min was set up.<br />
Agilent GC equipped with FID detector was used for analysis<br />
of liquid sample.<br />
Results<br />
The results of sulphur mustard permeation through tested<br />
materials obtained by IMS detector and GC (thermal desorption,<br />
direct liquid extraction and solid phase extraction) are<br />
compared in the chart on Fig. 3. and Fig. 4. Observed concentration<br />
shift shown in the chart is probably caused by different<br />
sensitivity of used methods. SPE method is more sensitive<br />
than direct solvent liquid extraction and direct solvent<br />
liquid extraction method is more sensitive than IMS method.<br />
s294<br />
Fig. 3. he IMS and LI/GC techniques (direct solvent liquid<br />
extraction and solid phase extraction) results comparison<br />
Fig. 4. The IMS and TD/GC techniques (thermal desorption)<br />
results comparison<br />
Breakthrough time of HD was determined on the basis<br />
of graphical analysis of permeation curves called time-lag.<br />
The permeation curve was interlayed by line13–19. The point<br />
where the line is crossing the x-axis represents the HD breakthrough<br />
time of investigated material (see Table I).<br />
Table I<br />
The values of HD breakthrough time obtain time-lag method<br />
The used Breakthorough time of HD<br />
techniques minutes hours<br />
IMS 350 5 : 50<br />
TD-GC 310 5 : 10<br />
LI-GC (SPE) 270 4 : 30<br />
LI-GC (DSLE) 300 5 : 00<br />
Basically the breakthrough time is dependent also on the<br />
other factors then the used analytical method. Temperature<br />
is one of the most important factors, which strongly influences<br />
the permeation process. The following experiments, held<br />
under the same conditions, have been performed to quantify<br />
the temperature dependence. The course of permeation was<br />
monitoring by the IMS detector GID-3, which is preferable<br />
for long continual measurement. The measurement was proceeded<br />
in temperature range from 15 °C to 40 °C by 5 °C. The<br />
lower range limit was defined by freezing point of sulphur<br />
mustard, which is 14.5 °C. The upper limit was restricted by
Chem. Listy, 102, s265–s1311 (2008) Environmental Chemistry & Technology<br />
tolerable ness of protection means. The fatal overheating of<br />
human body can happen at the temperatures over 40 °C.<br />
The charts of all permeation curves are shown on Fig. 5.<br />
The permeation of HD agent through polymer membrane is<br />
faster with increasing temperature and permeation will be<br />
sharper course.<br />
Fig. 5. The comparison of permeation curves obtained at different<br />
temperatures<br />
The related values of breakthrough times evaluated with<br />
using time lag method are presented in Table II.<br />
Table II<br />
The values of HD breakthrough time obtained with using the<br />
time-lag method for measurement under various temperatures<br />
by IMS detector<br />
Temperature Breakthorough time of HD<br />
minutes hours<br />
15 °C 1485 22 : 20<br />
20 °C 600 12 : 00<br />
25 °C 440 7 : 20<br />
30 °C 285 4 : 45<br />
35 °C 150 2 : 30<br />
40 °C 90 1 : 30<br />
The dependence of HD breakthrough time on temperature<br />
is plotted in chart shown on Fig. 6. The points in the<br />
chart were interlaced by exponential curve and this curve was<br />
expressed by regression equation. The exponential equation<br />
can be used for breakthrough time on temperature depen-<br />
Fig. 6. The chart of hD breakthrough time dependence on the<br />
temperature<br />
s295<br />
dence quantification and the parameters could be used for<br />
different materials resistance comparison.<br />
Conclusions<br />
The main purpose of this measurement was to compare<br />
the analytical methods and/or detection techniques used for<br />
the breakthrough time’s evaluation. On the basis of obtained<br />
results comparison it is possible to submit that the value of<br />
HD breakthrough time is strongly dependent on sensitivity of<br />
used analytical method. The IMS detector enables to perform<br />
the continual measurement of permeation HD in real time.<br />
The result is permeation curve represented by increase of permeating<br />
vapors amount in time. The GC method providing<br />
an exact determination of kind and amount of permeating<br />
compound and products of interaction between tested polymer<br />
and permeating toxic agent, i.e. qualitative a quantitative<br />
analysis in contrast to IMS. However, the GC method does<br />
not enable to perform the continual measurement and is not<br />
so suitable for long term measurement. Otherwise, the IMS<br />
method indicates course of permeation vapor through polymer<br />
membrane but is not able to determine kind and amount<br />
of permeated compound.<br />
But simultaneous use of both detection methods used<br />
simultaneously enable to perform the more exact definition<br />
of tested polymer barrier material character.<br />
References<br />
1. Slabotinský J.: Dissertation, VÚ 070 Brno, 1981.<br />
<strong>2.</strong> Rozsíval V.: Dissertation, VAAZ Brno, 1961.<br />
3. Obšel, V., Dvořáková, J.: Průběžná zpráva, VTÚO Brno,<br />
2006.<br />
4. Obšel, V., Dvořáková, J.: Průběžná zpráva, VTÚO Brno,<br />
2007.<br />
5. ASTM F 739-99a: Standard Test Method for Resistance<br />
of Protective Clothing Materials to Permeation by<br />
Liquids or Gases Under Conditions of Continuous Contact<br />
(August 1999)<br />
6. ČSn En ISO 6529: Ochranné oděvy – Ochrana proti<br />
chemikáliím – Stanovení odolnosti materiálů ochranných<br />
oděvů proti permeaci kapalin a plynů (říjen 2002).<br />
7. Hill, H. H., Martin, Jr. and S. J.: Pure Appl. Chem. 74,<br />
2281 (2002).<br />
8. Lancaster, P. A.: Gas chromatography analysis of sulfur<br />
mustard in diethyl phthalate. Melbourne, Australia,<br />
1998.<br />
9. Jareman, F.: Master`s Thesis. , Lulea University of technology,<br />
1999<br />
10. Gary D. Sides Detection<br />
of chemical warfare agents, IUPAC Workshop,<br />
Croatia [on line]. 2007, 16.8.2007 [cit. 20.09.2007].<br />
Dostupný z: .
Chem. Listy, 102, s265–s1311 (2008) Environmental Chemistry & Technology<br />
11. Duncan, B., Urquhart, J., Roberts, S.: Review of Measurement<br />
and Modelling of Permeation and Diffusion in<br />
Polymers. nP Laboratory, UK, 2005.<br />
1<strong>2.</strong> Rozsíval, V.: Habilitační práce, Brno 1966.<br />
13. Ye, X., Lv, L., Zhao, X. S., Wang, K.: J. Membr. Sci.<br />
283, 425 (2006).<br />
14. Crank, J.: The Mathematics of Diffusion, Clarendon<br />
press, Oxford, 1956.<br />
15. Dhingra, S. S.: Mixed Gas Transport Study through<br />
Polymeric Membranes: A novel technique. Faculty of<br />
the Virginia Polytechnic Institute and State University,<br />
Blacksburg, Virginia, 1997.<br />
s296<br />
16. Laot, Ch.M.: Gas Transport Properties in Polycarbonate.<br />
Faculty of the Virginia Polytechnic Institute and<br />
State University Blacksburg, Virginia, 2001.<br />
17. Flaconneche, B., Martin, J., Klopffer, M. H.: Oil Gas<br />
Sci. Technol, 56, 261 (2001).<br />
18. Wang, P., Schneider n. S., Sung n.: J. Appl. Polym. Sci.<br />
71, 1525 (1999).<br />
19. Holzmuller, W., Alternburg, K.: Fyzika polymerů. Praha,<br />
SnTL, 1966.
Chem. Listy, 102, s265–s1311 (2008) Environmental Chemistry & Technology<br />
L04 COMPLEx ESSESSMENT OF<br />
ORGANOPhOSPhATES LOw DOSE<br />
ChRONIC ExPOSuRE ON ENDOThELIuM,<br />
MACROPhAGES, PLATELETS AND<br />
ESTERASES<br />
e. ERMOLAEVA, n. GOnCHAROV, A. RADILOV,<br />
L. GLASHKInA, I. MInDUKSHEVa , P. AVDOnInb ,<br />
I. DOBRYLKO and V. REMBOVSKIY<br />
Research Institute of Hygiene, Occupational Pathology and<br />
Human Ecology, Saint-Petersburg, Russia,<br />
aI. M.Sechenov Institute of Evolutionary Physiology and Biochemistry,<br />
Saint-Petersburg, Russia,<br />
bN. K. Koltzov Institute of Developmental Biology, Moscow,<br />
Russia,<br />
nvgoncharov@mail.ru<br />
Introduction<br />
Morphofunctional disturbances of circulation in rat<br />
embryos intoxicated by derivatives of organophosphates<br />
(OP), a role of endothelium directly affected by OP under<br />
acute intoxications 1,2 , and various data on the role of endothelium<br />
in development of peripheral neuropathies of various<br />
genesis 3,4,5 were the basis for consideration of endothelium<br />
as one of the main targets under chronic intoxication with OP.<br />
In this research work, an attempt has been undertaken to clarify<br />
an impact of circulatory disturbances, the cellular component<br />
of haemostasis, and neuropathy target esterase (nTE)<br />
activity upon reaction of rat organism under intoxication with<br />
low doses of OP.<br />
Materials and Methods<br />
In these experiments diisopropylfluorophosphate (DFP),<br />
which can induce the delayed polyneuropathy, and paraoxon<br />
s297<br />
which has no such effect, were applied with drinking water<br />
at doses 10 –2 mg kg –1 (1/100 LD 50 ) and 10 –4 mg kg –1 (1/10,000<br />
LD 50 ). The intoxication was conducted daily 5 times in a week<br />
for 3 months. Esterases of choline and non-choline substrate specificity<br />
6,7,8,9 were studied; for rat brain, the enzyme activity was<br />
calculated per mg of protein 10 . To investigate the OP effects upon<br />
nADPH-oxidase system, we used the functional state of peritoneal<br />
macrophages with fluorescent microscope and fluorescent<br />
probe dichlorfluorescein diacetate (DCF) 11 . Kinetic parameters<br />
of platelet aggregation were studied by low angle light scattering<br />
technique 12 . The functional activity of endothelium under OP<br />
intoxication was studied with rat aorta by method of endotheliumdependent<br />
relaxation 13,14 . The results obtained were processed by<br />
variation statistics and MS Exсel software.<br />
Results and Discussion<br />
Comparing the level of inhibition of esterases in blood<br />
plasma after 3 months’ intoxication with the OP, we have<br />
found that the residual activity of nTE was much lower than<br />
that of red blood cells’ acetylcholine esterase (AChE). Inhibition<br />
of nTE activity in rat brain 2 months after stopping<br />
intoxication with DFP gives an indirect evidence for development<br />
of neurotoxic effects. Activity of esterases after chronic<br />
intoxication demonstrates a switch of inhibition from one<br />
enzyme to another, embracing both choline specific and nonspecific<br />
esterases. It is noticeable that the most prolonged<br />
neurotoxic effect (20–30 % reduction of nTE activity after<br />
6 months’ period of the post-intoxication recovery) remained<br />
in the platelet-rich plasma (PRP).<br />
The next method demonstrating its efficacy for diagnostics<br />
of the low dose intoxication with OP was estimation<br />
of the level of generation of reactive oxygen species<br />
(ROS) during “respiratory burst” by professional phagocytes<br />
(macrophages). It is a widely known fact that macrophages<br />
Fig. 1. Generation of ROS by mice macrophages after 3 months’ chronic intoxication and 2 and 4 months after cessation of the intoxication<br />
with paraoxon and DFP at doses 10 –4 mg kg –1 (min) and 10 –2 mg kg –1 (max)
Chem. Listy, 102, s265–s1311 (2008) Environmental Chemistry & Technology<br />
are not only scavengers and alarm cells but they also have<br />
important functions to occupy key positions in every kind of<br />
immune response: production of antibodies, induction of cell<br />
immune reactions, development of immunologic memory<br />
and tolerability, thus correctly being named “dispatcher<br />
cells”. In our experiments, the functional activity of mouse<br />
macrophages was activated under intoxication with OP at<br />
10 –4 mg kg –1 (Fig. 1.). Activation of phagocytes affected by<br />
low doses of OP leads to production of ROS (hydrogen peroxide,<br />
superoxide anion, singlet oxygen and hydroxyl anions),<br />
which cause modification of tissue and serum proteins and<br />
lipids to further cause their obtaining of antigenic properties.<br />
Thus, activation of phagocytes is an autocatalytic process and<br />
can lead to formation of the vicious circle. On the other hand,<br />
absence of macrophages’ activation under exposure to large<br />
doses of OP indicates a suppression of antigen-presenting<br />
function of these cells; it is also known that chemical agents<br />
inhibiting this function in most cases cause suppression of<br />
immune response 16 .<br />
The animals’ immune status was further tested with low<br />
angle light scattering technique and studies of functional activity<br />
of blood platelets. Besides of a leading role in haemostasis,<br />
blood platelets play also an important role in immune<br />
reactions being a mediator between these two physiologic<br />
systems 17,18 . For the expense of binding with C1q receptor,<br />
the platelets can adhere to endothelium of capillaries, where<br />
local interaction of platelets with activating agents can take<br />
place 19,20 .<br />
Peroral chronic administration of DFP and paraoxon to<br />
laboratory animals for 3 months with the following examination<br />
at 2, 4 and 5 months after cessation of the intoxication<br />
demonstrated that in both cases a pronounced disturbance of<br />
the functional activity of platelets was observed, followed by<br />
a prolonged period of recovery of kinetic parameters of platelet<br />
aggregation (Fig. <strong>2.</strong>). In 3 months of chronic intoxication<br />
with DFP a marked increase of EC 50 was registered, similar<br />
to the case with Russian VX 21 . In contrast to DFP and RVX,<br />
paraoxon did not have a visible effect on sensitivity of platelets,<br />
but affected the maximal velocity of aggregation to the<br />
greater extent.<br />
Investigation of blood vessel endothelium revealed that<br />
s298<br />
Fig. 3. Relative excess over control (100 %) of the blood vessel<br />
contracting force in 3 months of intoxication with DFP and<br />
paraoxon at doses 10 –2 and 10 –4 mg kg –1 (carbachol was administered<br />
at the background of pre-constriction with norepinephrine)<br />
under chronic intoxication with OP an inhibition of endothelium-dependent<br />
relaxation occurs with both DFP and paraoxon,<br />
though the former was more potent at the same doses<br />
(Fig. 3.). Moreover, the level of pre-constriction with epinephrine<br />
under exposure to DFP was significantly different<br />
from that observed under exposure to paraoxon. So not only<br />
the level of relaxation following pre-constriction did change<br />
but also the background tonus of blood vessels and dynamics<br />
of the pre-constriction per se. In 2 months after cessation of<br />
the intoxication, inhibition of the endothelial function was<br />
nevertheless rather pronounced in both groups of rats that were<br />
exposed to DFP and paraoxon at 10 –2 mg kg –1 . In 5 months,<br />
there were significant changes only in rats exposed to DFP,<br />
being at the same level in both groups of intoxicated rats<br />
administered to DFP at doses 10 –4 and 10 –2 mg kg –1 .<br />
Conclusions<br />
Esterases of various geneses, localization and functional<br />
specialization should be molecular targets for OP.<br />
Fig. <strong>2.</strong> Relative changes of the medium effective concentration of activator (EC50) and maximal velocity of platelet aggregation<br />
(umax) after peroral administration of DFP (A) and paraoxon (b) at doses 1 × 10 –2 (max) and 1 × 10 –4 (min) mg kg –1 : after 3 months of<br />
intoxication, then at 2, 4 and 5 months of the “recovery period”; (# – Р < 0.1; * Р < 0.05)
Chem. Listy, 102, s265–s1311 (2008) Environmental Chemistry & Technology<br />
Changes in activity of esterases under prolonged exposure<br />
have a phase character with predominant inhibition of<br />
nTE as a delayed effect.<br />
Endothelium should be one of the main tissue targets in<br />
case of chronic low dose intoxication with OP.<br />
Blood platelets and phagocytes could be sensitive testing<br />
models to estimating effects of the low level exposure to OP.<br />
The pathogenesis of low dose chronic intoxication with<br />
OP is probably based upon the two complementary factors:<br />
development of immunoreactivity and tissue/circulatory<br />
hypoxia.<br />
REFEREnCES<br />
1. Прозоровский В. Б., Скопичев В. Г.:<br />
Экспериментальная и клиническая фармакология №<br />
3, 64 (2005с).<br />
<strong>2.</strong> Carvalho F. A., Graca L. M., Martins-Silva J., Saldanha<br />
C.:FEBS J. 272, 5584 (2005).<br />
3. Myers R. R., Powell H. C., Shapiro H. M., Costello M.<br />
L., and Lampert P. W.: Ann. neurol. 8, 392 (1980).<br />
4. Low P. A., Tuck R. R., Dyck P. J., Schmelzer J. D., Yao<br />
J. K.: Proc. natl. Acad. Sci. U S A 81, 6894 (1984).<br />
5. Ollson Y. Peripheral neuropathy P. 1984, 579.<br />
6. Ellman G. L., Courtney D. K., Andres V. Jr., Featherstone<br />
R. M.: Biochem. Pharmacol. 7, 88 (1961).<br />
7. Johnson M. K.: Biochem. J. 111, 487 (1969).<br />
8. Johnson M. K., Glynn P.: Toxicol. Lett. 82–83, 459<br />
(1995).<br />
s299<br />
9. Брик И. Л., Мандельштам Ю. Е, Немец В. И.: Химия<br />
в сельском хозяйстве. 15, 40 (1977).<br />
10. Досон Р., Элиот Д., Эддиот У., Джонс К. Справочник<br />
биохимика. – М.: Мир. 1991, 544.<br />
11. Гамалей И. А., Каулин А. Б., Кирпичникова К. М.:<br />
Цитология. 30, 1426 (1988).<br />
1<strong>2.</strong> Деркачев Э.Ф., Миндукшев И. В., Кривченко А. И.,<br />
Крашенинников А. А.: Патент RU 2108579 C1 6 G01<br />
n 33/49, Б.И. №10 (II). С.29 (1998).<br />
13. Mulvany M. J., Halpern W.: Circ. Res. 41, 19 (1977).<br />
14. Angus J. A., Broughton A., Mulvany M. J.: J. Physiol.<br />
(Lond.). 403, 495 (1988).<br />
15. Дранник Г. Н.: Курс лекций. 2007. http://immuno.<br />
health-ua.com/article/9.html<br />
16. Hamrah P., Dana M. R.: Chem. Immunol. Allergy. 92,<br />
70 (2007).<br />
17. Spycher M. O., nydegger U. E.: Infusionsther. Transfusionsmed.<br />
22, 36 (1995).<br />
18. Mindukshev I., Goncharov n., Shabanova E., Ermolaeva<br />
E., Mironova М.,Radilov А., Jenkins R., Krivchenko A.:<br />
Spectroscopy. 20, 57 (2006).<br />
19. Galdal K. S.: Haemostasis.14, 378 (1984).<br />
20. Козинец Г. И., Макарова В. А. Исследование системы<br />
крови в клинической практике. - М.1998, 480.<br />
21. Ермолаева Е. Е., Гончаров Н. В., Радилов А. С.,<br />
Глашкина Л. М., Кузнецов А. В., Миндукшев И. В.,<br />
Авдонин П. В., Добрылко И. А., Рембовский В. Р.:<br />
Токсикологический вестник. № <strong>2.</strong>, С. 3 (2008).
Chem. Listy, 102, s265–s1311 (2008) Environmental Chemistry & Technology<br />
L05 INFLuENCE OF CLIMATE CONDITIONS<br />
AND AIR CONTAMINATION ON VILLAGE<br />
INhAbITANTS hEALTh<br />
SLAVOMíRA KAŠIAROVá a and MELánIA<br />
FESZTEROVá b<br />
a Trenčín University of A. Dubček, Department of Public<br />
Management, Študentská 2, 911 50 Trenčín,<br />
b Constantine the Philosopher University, Faculty of Natural<br />
Sciences, Department of Chemistry, Tr. A. Hlinku 1, 949 74<br />
Nitra,<br />
kasiarovas@azet.sk<br />
Introduction<br />
The understanding of health as a main component of<br />
environment quality accrues from the Agenda 21 concerning<br />
the right of human beings to healthy and productive life 1 . Air,<br />
one of the components of environment, is polluted primarily<br />
by anthropogenic factors. Generally, the countryside is considered<br />
a healthy environment 2 . However, there are very few<br />
studies to prove this assumption since the air monitoring is<br />
a long-term and expensive method and therefore carried out<br />
only on a few monitoring points 3 .<br />
The aim of the study was to assess the state of climatic<br />
conditions and state of air quality in relation to the rate of<br />
diseases among the inhabitants of Královce-Krnišov village<br />
by a simple method, based on a comparison of potential conditions<br />
of contamination with real state of population health.<br />
The Southern Sitno micro region is important for tourism<br />
development and geographical conditions.<br />
Experiment and Methods<br />
Using the reconnaissance of the place was carried out<br />
terrain research. Information and sources of contaminants<br />
were observed together with the perception of problems<br />
related to air quality and environmental health. The obtained<br />
data were further processed by the statistical method of contingential<br />
tables, on the basis of which the individual mutual<br />
relations were evaluated, at the free scope degree of 1 and the<br />
level of importance 0.01 (χ quadrate). An assessment of the<br />
state and movement of air required the analysis of the relief<br />
as well as sunshine input as well as the regional state and<br />
movement of air for which GIS tools (geomedia) were used.<br />
Contamination was interpreted from the map of the secondary<br />
landscape structure and sources of contaminants. The<br />
relation between movement and quality of air and environmental<br />
health was worked out on the basis of the basic data<br />
parametric analysis with the subsequent table synthesis and<br />
mathematic statistics<br />
Results and Discussion<br />
On the territory of the Kráľovce–Krnišov village (the<br />
Štiavnické Mountains) cold, mild warm and warm mountain<br />
climate prevails. The average yearly temperature spans are<br />
from 5.5 °C to 8 °C. The average cloud amount is around<br />
62 %. The number of sunny days is around 48 a year and<br />
s300<br />
the number of cloudy days is around 125. The territory is<br />
characterized by regional northern, north-west air circulation<br />
with a low year and day amplitudes prevailing all the year<br />
round. There are frequent temperature inversions during the<br />
radiation weather with a depression circulation. There is also<br />
an intensive effect of a “temperature island” with a distinctive<br />
increase of day amplitudes supported by the effect of winds<br />
of low intensity. negative influences on environmental health<br />
are diseases caused by contamination from regional emissions<br />
resulting from the type of climate and skin diseases as a<br />
consequence of contamination of anthropogenic and natural<br />
factors – frequent and concentrated air circulation especially<br />
in winter time. Frequent skin diseases and flu are typical for<br />
inversion type of weather. Respiratory diseases and diseases<br />
related to increased stress conditions due to the amplitudes<br />
changes, such as blood pressure disorders, stress and cardiovascular<br />
diseases, were confirmed. The increase of the all<br />
above diseases was statistically confirmed.<br />
The territory of the Southern Sitno micro region is exposed<br />
to the influence of industry confirmed by the considerable<br />
damage of the environment by pollutants distributed in conditions<br />
of mesoclimate. The contamination of the regional<br />
type concerns mainly average annual nO2 and SO2 concentrations.<br />
The contamination in the settlement is therefore of<br />
integrated character from the following sources:<br />
• transport related emissions – the contamination intensity<br />
is lower in winter and spring season, no statistical<br />
importance with any disease was shown;<br />
• heating related emissions – at inversion type of weather<br />
there is an increased intensity of contamination especially<br />
during the winter season (most inhabitants use<br />
wood for heating, some of them waste and electricity),<br />
an influence on the occurrence of blood pressure disorders<br />
was confirmed;<br />
• radiation (high volume activity of radon from the geological<br />
background, radon is considered the carcinogenic<br />
element causing lung cancer and respiratory diseases);<br />
• emissions from rural zone (agriculture – a smell from<br />
the animal husbandry, excrements of animals, liquid<br />
manure).<br />
A demographic structure of Kráľovce – Krnišov village<br />
population represents a regressive type, lift the biggest age<br />
groups in the village between 20–40 and 40–60. Based on<br />
the analysis of microclimate, mesoclimate and macroclimate,<br />
contamination and illness rate considering the statistic importance,<br />
the population group and factors originating from the<br />
environment. The occurrence of health problems (Statistically<br />
important relations illustrated in Tables I, II, III, IV)<br />
could be specified as follow:<br />
•<br />
an increased occurrence of the blood pressure disorders<br />
in the local population: people using electricity for heating,<br />
people using electric appliances at home, women<br />
and children, age group over 60, inhabitants suffering<br />
from obesity, cardiovascular diseases, occupational<br />
diseases and people living mainly on the slopes exposed
Chem. Listy, 102, s265–s1311 (2008) Environmental Chemistry & Technology<br />
Table I<br />
The relation of the diseases occurrence to the sex and age of Kráľovce – Krnišov village population (χ quadrant)<br />
Age/Sex/Affections Man/age [years] Woman/age [years] Child/age [years]<br />
20–40 41–60 Over 60 20–40 41–60 Over 60 0–0.5 0.5–12 13–19<br />
Blood pressure disorders 0.76 0.08 0.76 6.17 d 0.11 10.05 c 0 0 0<br />
Stress 0.08 0.08 0.76 4.16 e 0.03 0.50 0.05 0.05 20 c<br />
Influenza 0.04 0.04 0.33 1.39 0.06 1.08 0.45 0.16 0.01<br />
Eczema 0.04 0.04 0.33 0.67 0.33 <strong>2.</strong>49 0.19 0.06 0.01<br />
Bronchitis 0 1.37 0.52 0.01 <strong>2.</strong>27 3.40 0.12 0.09 0.22<br />
Affection from work 0.08 0.08 0.76 1.22 3.26 0.69 0 0 0<br />
Cardiovascular disease 0.83 1.37 0.15 <strong>2.</strong>67 0.20 1.76 0 0 0<br />
Asthma 0.83 1.37 0.15 0 0 0 0 0 0<br />
Allergies 0 0 0 0 0 0 0.05 0.70 0.57<br />
c Relation is at statistically high level of significance (degrees of free1), χ quadrant = 6.63 <<br />
d Relation is at statistically medium level of significance (degrees of free1), χ quadrant = 5.02–6.63<br />
e Relation is at statistically low level of significance (degrees of free1), χ quadrant = 3.84–5.02<br />
Table II<br />
The relation of the diseases occurrence in Kráľovce – Krnišov village (χ quadrant)<br />
Affections<br />
Blood<br />
pressure<br />
disorders<br />
Stress<br />
Infl uenza<br />
s301<br />
eczema<br />
Bronchitis<br />
Affection<br />
from work<br />
Cardiovascular<br />
disease<br />
Blood pressure disorders – 0.09 1.81 1.66 1.33 8.84 d 19.44 d 0.28 0.28<br />
Stress 0.03 – 0.07 0.99 1.65 0.33 0.00 3.99 e 0.28<br />
Influenza 1.81 0.07 – 0.00 <strong>2.</strong>46 0.34 1.14 0.22 0.21<br />
Eczema 1.66 0.99 0.00 – 1.56 8.75 d <strong>2.</strong>67 0.18 0.18<br />
Bronchitis 1.33 1.64 <strong>2.</strong>46 1.57 – 1.09 0.47 8.36 d 8.36 d<br />
Affection from work 8.84 d 0.33 0.34 8.75 d 1.09 – 13.45 d 0.12 0.12<br />
Cardiovascular disease 19.44 d 0.00 1.14 <strong>2.</strong>68 0.47 13.45 d – 0.07 0.07<br />
Asthma 0.28 3.99 e 0.22 0.18 8.36 d 0.12 0.07 – 0.01<br />
Allergies 0.28 0.28 0.22 0.18 8.36 d 0.12 0.07 0.01 –<br />
Table III<br />
The relation of the diseases occurrence to type of dwelling of Kráľovce – Krnišov village pollution (χ quadrant)<br />
Physical,<br />
in<br />
chemical,<br />
biological<br />
hazards/<br />
affections Chemicals<br />
work<br />
Manures<br />
Dry toilet<br />
Moisture of<br />
house<br />
electrical<br />
applicances<br />
Blood pressure<br />
0.09 1.74 4.61e 0.30 10.78c 1<strong>2.</strong>86c 5.07d 4.08e disorders<br />
0.09 <strong>2.</strong>25<br />
Stress 4.06e 3.13 5.78d 4.80e 1.36 1.84 <strong>2.</strong>30 0 0.39 0.27<br />
Influenza 0.00 6.09d 4.80e 6.09d 1.14 3.68 0.03 7.06c 0.64 1.54<br />
Eczema 0.04 0.09 0.04 <strong>2.</strong>12 <strong>2.</strong>67 0.58 0.47 0.09 0.11 0.39<br />
Bronchitis 1.74 4.30e 1.05 <strong>2.</strong>32 0.65 0.24 0 0.89 0.73 0.90<br />
Affection from work 7.53c 4.30e 0.05 0.62 13.45c 11.11c 0.51 0.33 0.04 0.99<br />
Cardiovascular disease 0.06 0.37 0.09 0.01 1.49 5.90d 0.03 0.94 0.94 0.08<br />
Asthma 0.20 0.48 1.59 1.66 0.07 0.24 1.76 0.69 5.81d 1.19<br />
Allergies 0.19 0.48 0.51 0.62 0.07 0.24 0.58 0.69 0. 18 1.19<br />
electrical<br />
Asthma<br />
Allergies<br />
Heating Mateiral of house<br />
Waste<br />
Coal<br />
Stone<br />
Brick
Chem. Listy, 102, s265–s1311 (2008) Environmental Chemistry & Technology<br />
Table IV<br />
The relation of the diseases occurrence to the nutrition and physical work of Kráľovce – Krnišov village population<br />
(χ quadrant)<br />
•<br />
•<br />
•<br />
•<br />
Various/Affections Finish food Finish food Medicine (ache) Physicalwork Sucklening<br />
Smoke<br />
Blood pressure disorders 4.47 e 1.17 5.57 d 0.67 3.16<br />
Stress 0.00 16.63 c 0.16 <strong>2.</strong>28 0.99<br />
Influenza 1.08 0.90 0.00 0.34 6.60 d<br />
Eczema 0.00 0.74 4.54 e 0.73 0.32<br />
Bronchitis <strong>2.</strong>40 0.51 <strong>2.</strong>45 1.09 0.56<br />
Affection from work 0.96 0.51 <strong>2.</strong>45 0.03 0.63<br />
Cardiovascular disease 0.13 0.30 3.26 0.47 0.72<br />
Asthma <strong>2.</strong>74 0.06 0.62 0.12 0.62<br />
Allergies 0.37 0.06 1.66 0.12 1.66<br />
to the south and on the territory of the “thermal island“<br />
effect;<br />
an increased occurrence of frequent flu in the local population:<br />
people living on the slopes exposed, to the age<br />
group of children 0–5 months, store-bought meat and<br />
house produced eggs consumers;<br />
an increased occurrence of skin diseases in the local<br />
population: the age group of children 0–5 months, adults<br />
of the age group 20–40, people living on the places with<br />
frequent valley circulation, and people living on the territory<br />
with the top climate as a result of the regional air<br />
pollution; - an increased occurrence of respiratory diseases<br />
in thelocal population: people living on the slopes<br />
exposed to the north, on the places with valley climate<br />
with important changes of amplitudes and places exposed<br />
to the transport emissions, especially with regard to<br />
people suffering from allergies, asthma, frequent injuries,<br />
radon radiation from the geological background;<br />
an increased occurrence of cardiovascular diseases in the<br />
local population: people living on the slopes exposed to<br />
the south, on the territory of “the thermal island “effect,<br />
on the territory with the strong changes of amplitudes in<br />
the valley climate, people suffering from blood pressure<br />
disorders and occupational diseases;<br />
an increased occurrence of occupational diseases in the<br />
local population: people who are in contact with toxic<br />
stuff at their workplace and people suffering from blood<br />
pressure disorders, skin diseases and cardiovascular<br />
diseases.<br />
s302<br />
Conclusions<br />
To determine the relation between climatic conditions<br />
and environmental health of the inhabitants of the Královce<br />
- Krnišov model village in the Štiavnické Mountains, a new<br />
method based on confrontation of potential conditions of<br />
selected factors of an environment – climate and real state of<br />
the environmental health – was used. Statistical results have<br />
shown the relation, which had been theoretically assumed.<br />
After the additional implementation and verification,<br />
the model can be considered as a good, quick, cheap and<br />
informative method for the assessment of the environmental<br />
health in rural settlements.<br />
This work has been supported by grant VEGA<br />
1/3276/06<br />
REFEREnCES<br />
1. Hilbert H.: Action Plan for the environment and health<br />
of population of the Slovak Republic II. Ministry of<br />
Health Care SR Bratislava 2000.<br />
<strong>2.</strong> Kukkonen E., Sklret E., Sundell J., Valbjrn O.: Indoor<br />
Climate Problems -Investigation and Remedial Measures.nT<br />
Techn. Report 204, nordtest, Espoo, Finland<br />
1993.<br />
3. Samešová D., Ladomerský J.: Evaluation environmentalaspects.<br />
Mech. Acta 2-B,150 (2005).
Chem. Listy, 102, s265–s1311 (2008) Environmental Chemistry & Technology<br />
L06 INTEGRATION METALLOMICS,<br />
PROTEOMICS AND TRANSCRIPTOMICS<br />
IN <strong>ENVIRONMENTAL</strong> ISSuES<br />
JOSE LUIS GóMEZ-ARIZA, MACAREnA GOnZALEZ-<br />
FERnAnDEZ, TAMARA GARCIA-BARRERA, JUAn<br />
LOPEZ-BAREA and CARMEn PUEYO<br />
Universidad de Huelva, Departamento de Química y Ciencia<br />
de los Materiales; Facultad de Ciencias Experimentales;<br />
Campus de El Carmen; 21007-Huelva (Spain),<br />
ariza@uhu.es<br />
Introduction<br />
Metallomics is one of most recent -omics whose importance<br />
is associated to the presence of metals or any other<br />
heteroelement (e.g. elements different of C, H, n, or O) in<br />
biomolecules. These metal-linked molecules play important<br />
roles in the cells and by extension in the biological behaviour<br />
of the organisms.<br />
Some of these elements are essential for life, marked in<br />
green in the Fig. 1, other are non-essential or toxic, marked<br />
in red. This is the case of transition elements, such as Fe in<br />
Cytochrome P450, a superfamily of enzymes that regulate the<br />
metabolism of pollutants, drugs and steroids. As well as Fe in<br />
transferrin, that transport and deliver this element. Cobalt is<br />
the key-element of B12 vitamin and ni in urease (the enzyme<br />
for urea hydrolysis into carbon hydroxide and ammonia).<br />
Other transition elements such as Cu and Zn are responsible<br />
for the activity of the superoxide dismutase, which is involved<br />
in the elimination of superoxide radical.<br />
Fig. 1. Essential (green) and non-essential (red) elements<br />
Together with elements linked to these proteinous<br />
molecules other non-proteinous molecules of high molecular<br />
weigh, such as DnA is characterized by the presence of phosphorus,<br />
or boron in polysaccharides from vegetal cell walls.<br />
Therefore, the chemistry of a cell and by extension of<br />
living tissues and biological fluids can be characterized, not<br />
only by its typical genome and proteome, but also by the<br />
metallome, the distribution of metals and metalloids among<br />
the different biomolecules. The metallome describes, per<br />
analogy with genome and proteome, the entirety of metal and<br />
metalloid species within a cell or tissue type. 1–4 The scope of<br />
metallomics is very broad, focusing on developments of new<br />
analytical techniques and instruments, as well as innovative<br />
applications focused on environmental, food or health issues.<br />
s303<br />
I n s t r u m e n t a l A p p r o a c h e s i n M e t a l -<br />
l o m i c s<br />
Three-dimensional systems should be at least used<br />
in Metallomics: (i) a separation component by gel electrophoresis<br />
or HPLC; (ii) an very sensitive elemental monitoring<br />
system, for metal or non-metal quantification, mainly<br />
ICP-MS; and (iii) a component for the structural characterization<br />
of the molecules, generally based on mass spectrometry.<br />
Therefore, the metal or heteroelement act as tag of the<br />
experiment, heteroatom-tagged proteomics 5 .<br />
I n t e r e s t o f – o m i c s I n t e g r a t i o n<br />
The benefit that Metallomics produces due to the simplification<br />
introduced by the metal tag can be insufficient when<br />
an overall appraisal of complex real problems, such as those<br />
related to environmental, food or health issues is considered.<br />
If we consider a contamination problem, genetic responses<br />
to stress conditions are often regulated at transcriptional<br />
level that can be checked by using the microarray technology<br />
to generate genome-wide transcriptional profiles. The changes<br />
detected by microarrays can be confirmed by RT-PCR<br />
(reverse transcription–PCR). In addition, modifications in<br />
the proteome can also used as markers of pollution as consequence<br />
of protein expression alteration triggered by contamination.<br />
However, these changes in proteins profiles can<br />
not necessarily reflect alterations in gene expression at the<br />
transcript level, but changes from post –transductional modifications.<br />
Therefore, the three -omics are complementary and integration<br />
among them is advisable. However, the difficulties in<br />
integrating data from different -omics technologies in nonlaboratory<br />
strains should not be under-estimated, and the use<br />
of non-inbred strains/species induce a variety of confusing<br />
factors can complicate interpretation. To avoid these problems<br />
in environmental studies we propose the use in parallel<br />
of sequenced model species and proved bioindicators with<br />
gentic sequence homologous to the model. In the present<br />
study we have selected two mouse species: (i) a model organism<br />
used in many studies in the laboratory, whose genetic<br />
sequence can be easily obtaine from database, Mus musculus,<br />
and (ii) an aboriginal species checked as useful sentinel organism<br />
in monitoring programs, Mus spretus 6 .<br />
In the present work a combined application of transcriptomics,<br />
proteomics and metallomics approaches has been<br />
performed in Doñana natural Park, one of the most important<br />
European biological reserves, in which millions of migrating<br />
birds land each year in their way to/from Africa. The couple<br />
M. musculus/M. Spretus was used for this integration.<br />
Experimental<br />
S a m p l i n g A r e a s<br />
Mice were collected in February 2004 at six sites from<br />
Doñana surroundings and the Domingo Rubio Stream, both<br />
at Huelva province (Fig. <strong>2.</strong>). Animals were captured with live<br />
traps and taken alive to the nearest laboratory (Huelva University<br />
or Doñana Biological Reserve-CSIC). Their sex and
Chem. Listy, 102, s265–s1311 (2008) Environmental Chemistry & Technology<br />
weight were determined and those of 11–12 g were killed by<br />
cervical dislocation and dissected. Individual livers and kidneys<br />
were frozen in liquid nitrogen and stored at –80 °C.<br />
T r a n s c r i p t Q u a n t i f i c a t i o n s<br />
Primer design, RnA preparation, reverse transcription,<br />
and absolute quantification by real-time PCR. Briefly, PCR<br />
reactions were performed in quadruplicate. no primer dimers<br />
were detected. Primers showed optimal (~ 100%) PCR efficiencies<br />
in the range of 20 to 2 × 10 5 pg of total RnA input<br />
with high linearity (r > 0.99). An absolute calibration curve<br />
was constructed with an external standard in the range<br />
of 10 2 to 10 9 RnA molecules. The number of mRnA<br />
molecules was calculated from the linear regression of the<br />
calibration curve (y = –3.326x + 39.693; r = 0.998).<br />
Microarray-based transcript quantification was performed<br />
by using the “Whole Mouse Genome Oligo Microarray<br />
Kit” (Agilent), which includes 60-mer oligonucleotide<br />
probes representing all known genes and transcripts<br />
(~ 41,000) of the model M. musculus species. Approximately,<br />
20 μg of total RnA were converted to fluorescently<br />
labelled cDnA (with Cy3-dCTP or Cy5-dCTP) following the<br />
“Agilent Fluorescent Direct Label Kit” instructions. Hybridization<br />
was carried out in Agilent’s SureHyb Hybridization<br />
Chambers at 65 °C for 17 hours using the Agilent’s “Gene<br />
Expression Hybridization Kit”. The hybridized microarrays<br />
were then disassembled and washed at room temperature,<br />
as described in the Agilent Microarray Based Gene<br />
Expression Analysis protocol. To eliminate dye-bias, dye<br />
swap replicates were performed. Microarrays were scanned<br />
at 532 and 635 nm using a confocal scanner (Axon 4000B).<br />
The ratio of Cy5 to Cy3 was adjusted to 1 varying PMT gain<br />
as a global normalization of each array. The images were analysed<br />
using GenePix Pro v4.1 software (Axon) and data were<br />
subsequently input to Genespring v7.3 software (Agilent) for<br />
further analysis.<br />
2 - D E A n a l y s i s a n d P r o t e i n<br />
I d e n t i f i c a t i o n<br />
Around 50 mg of livers from four male mice/site were<br />
pooled and homogenized in 20 mM Tris-HCl, pH 7.6, with<br />
0.5 M sucrose, 0.15 M KCl, 20 mM DTT (Dithiothreitol),<br />
1 mM PMSF (phenylmethanesulfonyl fluoride), and protease<br />
inhibitors, at a ratio of 3 ml g –1 . Cell debris was cleared by<br />
centrifugation, and the supernatant treated with benzonase<br />
and ultracentrifuged. Protein extract (115 µg) was incubated<br />
30 min in 450 µl rehydration buffer (7M urea, 2% CHAPS,<br />
20 mM DTT, 0.5% Pharmalyte 3–10, bromophenol blue traces),<br />
spun and loaded on 24 cm (pH 4–7) Amersham Immobiline<br />
Dry-Strips ® . After 6 h passive and 6 h active (50 V) rehydration<br />
in a BioRad Protean IEF cell (20 °C, 50 mA strip –1 ),<br />
the voltage was raised until obtain ootimum separation. After<br />
freezing at –80 °C, the strips were soaked 20 min in equilibration<br />
mix (50 mM Tris-HCl, pH 8.8, 6M urea, 30% glycerol,<br />
2% SDS, bromophenol blue traces) with 65 mM DTT,<br />
drained and again soaked 20 min in this mix with 25 mM<br />
s304<br />
iodoacetamide. SDS-PAGE was done in 1<strong>2.</strong>5% gels using<br />
the BioRad Protean ® Plus Dodeca cell (20 °C) at <strong>2.</strong>5 W gel –1 ,<br />
10 min, and 10 W gel –1 until separation was finished. Gels<br />
were silver-stained following a standard protocol compatible<br />
with MS analysis. Analytical quality chemicals and Milli-Q<br />
water (Millipore ® ) were used throughout.<br />
Gel images of three replicates/sample were obtained<br />
with a BioRad GS-800 densitometer. Spot volumes were<br />
quantitated using the PDQuest software (v7.1, BioRad). Initially,<br />
only spots exhibiting in “Santa Olalla” lagoon (SOL)<br />
an over/underexpression ratio of at least threefold with<br />
respect to any other sampling site were considered. One-way<br />
analysis of variance followed by the Student–newman–Keuls<br />
post-test was then used for a definitive selection of the spots<br />
showing altered expression patterns between the different<br />
animal groups. Differentially expressed spots were manually<br />
excised, reduced (10 mM DTT), alkylated (55 mM iodoacetamide),<br />
digested overnight at 30 °C with trypsin (Promega)<br />
and the peptides extracted with ACn/TFA (Acetonitrile/<br />
Trifluoroacetic acid). Aliquots of 0.5 µl were analyzed by<br />
MALDI-TOF-PMF (Matrix Assisted Laser Desorption- Time<br />
of Flight-Peptide Mass Fingerprint) in a Voyager DE-PRO<br />
instrument (Applied Biosystems) in reflectron mode. PMF<br />
data were contrasted against mammalian sequences included<br />
at Swiss-Prot (EBI, Heidelberg, Germany) and nonredundant<br />
nCBI (Bethesda, MD, USA) databases using ProteinProspector<br />
(California University, San Francisco, CA, USA) and<br />
MASCOT (Matrix Science, London, UK) softwares.<br />
A n a l y s i s o f E x t r a c t s b y S E C<br />
C o u p l e d w i t h I C P - M S<br />
Extracts were twofold diluted with the mobile phase and<br />
centrifuged at (11,000 rpm) 15.5572 × 1g for 1 h at 4 °C, and<br />
latterly filtered through Iso-Disc poly(vinylidene difluoride)<br />
filters (25-mm diameter, 0.2-μm pore size) to avoid column<br />
overloading or clogging. Elemental fractionation profiles<br />
were obtained by size exclusion chromatography (SEC)<br />
coupled to ICP-MS as detector. Two columns were used in<br />
the experiment: Hiload 26/60 Superdex 30 Prep column for a<br />
separation range below 10 kDa (low molecular mass, LMM)<br />
and a Superdex 75 Prep column for a separation range of<br />
3–70 kDa (high molecular mass, HMM), both from Amersham<br />
Biosciences (Uppsala, Sweden). These columns were<br />
calibrated using standards of known molecular mass, such as<br />
bovine serum albumin (67 kDa), metallothionein I (7 kDa),<br />
gastrin rat I (2,126 Da) and Gly6 (360 Da) for LMW column,<br />
and bovine serum albumin (67 kDa), chymotrypsinogen A<br />
(25 kDa), ribonuclease A (13.7 kDa) and metallothionein I<br />
(7 kDa) for HMW column. The void retention time was estimated<br />
with bovine serum albumin (67 kDa) and blue dextran<br />
(2,000 kDa), for LMW and HMW, respectively.<br />
Results<br />
The three -omics approaches (transcriptomics, proteomics<br />
and metallomics) have been applied to Doñana<br />
natural Park and the surrounding areas. Doñana is an impor-
Chem. Listy, 102, s265–s1311 (2008) Environmental Chemistry & Technology<br />
Fig. <strong>2.</strong> Sampling area<br />
tant ecological area, which covers 543 km 2 with a great variety<br />
of ecosystems and shelters wildlife including thousands of<br />
European and African migratory birds, fallow deer, Spanish<br />
red deer, wild boar, European badger, Egyptian mongoose,<br />
and endangered species such as the Spanish Imperial Eagle<br />
and Iberian Lynx. This non-contaminated area was used as<br />
Fig. 3. Efficiency curves in genetic correlation between M.<br />
musculus and M. spretus for Gsta3 transcript. ● specific primers,<br />
○ non-specific primers. X-axis, log total mNRA (pg); Y-axis,<br />
threshold cycle (Ct)<br />
s305<br />
negative reference (SOL) in comparison to the neighbouring<br />
“Domingo Rubio” stream (DR1 to DR6) and the positive<br />
references (PS and ARZ). These areas are contaminated by<br />
mining, agricultural and industrial effluents (DR1 to DR6 and<br />
PS) and by pesticides and fertilizers (ARZ) (Fig. <strong>2.</strong>).<br />
The mouse Mus spretus is an aboriginal species that<br />
has been commonly used for environmental assessment<br />
of this area (x) by means of classical biomarkers, but new<br />
tools based on recent –omics, such as transcriptomimcs and<br />
proteomics constitute a promising alternative. However, the<br />
molecular biology methodologies present problems by the<br />
fact of poor inclusion of typical bioindicators in gene/protein<br />
sequences database. For this reason we use species close<br />
to model organisms that are well covered in public databases.<br />
This is the case of M. musculus, which is studied comparatelly<br />
with M. spretus. These comparisons are only possible<br />
if genetic homology between both species is proved.<br />
G e n e t i c H o m o l o g y B e t w e e n M .<br />
m u s c u l u s a n d M . s p r e t u s<br />
A crucial start-point in quantitative RT-PCR is primer<br />
design. For absolute transcript quantification it is necessarily<br />
to design primers that amplify the targets and the calibrator<br />
with optimal (100 %) PCR efficiencies. This fact requires<br />
a great genetic homology between target and calibrant<br />
species. Primers for RT-PCR quantification of M. spretus<br />
Cyp and Gst mRnAs were designed based on known gene<br />
sequences from M. musculus. Remarkably, these primers,<br />
when amplified in M. spretus, gave single products exhibiting<br />
in most cases 100% nucleotide sequence identity. Therefore,<br />
most designed primers were exactly complementary to the<br />
desired M. spretus templates and amplified them with 100%<br />
efficiency. In few cases, however, primers should be redesigned<br />
based on nucleotide sequences of PCR fragments from<br />
M. spretus. Fig. 3 ref. 8 .<br />
Therefore, genetic homology between model and bioindicator<br />
species was clearly proved.<br />
Fig. 4. Sampling area-associated differences in M. spretus hepatic<br />
mRNA levels. y-axis, nRNA molecules/pg total RNA. white<br />
bar, SOL non-polluted area; red bar, polluted area
Chem. Listy, 102, s265–s1311 (2008) Environmental Chemistry & Technology<br />
M u s S p r e t u s T r a n s c r i p t E x p r e s s i o n<br />
S i g n a t u r e s i n C o n t a m i n a e d A r e a s<br />
We have used the absolute measurement of mRnA<br />
levels from selected key genes (CYPs and GSTs) to biomonitoring<br />
the exposure and biological effects of pollutants on<br />
free-living nonmodel M. spretus. For this purpose the mRnA<br />
molecules of genes coding for different cytochrome P450 and<br />
glutathione transferases were quantified in mice dwelling at<br />
both the non-contaminated point SOL and contaminated area<br />
PS.<br />
As an example, Fig. 4. shows the concomitant up-regulation<br />
of some Cyp transcripts in M. spretus PS population, as<br />
compared to that at SOL in the Doñana Biological Reserve.<br />
The possibilities of transcription quantification to assess the<br />
level of contamination are clearly demonstrated. In addition,<br />
the absolute Cyp transcript expression signature is depending<br />
on the type of contaminant (Fig. 5.), which can use to identify<br />
the nature of contamination under consideration.<br />
Fig. 5. Transcripts expression signature related to the type of<br />
contaminants. y-axis, nRNA molecules/pg total RNA<br />
Fig. 6. Protein expression of liver cytosolic extract from Mus<br />
spretus<br />
P r o t e o m i c s S t u d y o f M u s s p r e t u s<br />
The homology between M. musculus and M. spretus,<br />
at DnA sequence level allows the proteomics evaluation of<br />
s306<br />
protein expression differences caused by contamination episodes<br />
in Mus spretus, but usinf the gnetinc sequence of Mus<br />
musculus in protein identificacion by MALDI-TOF-PMF. A<br />
comparative study at proteomic level of cytosolic fractions<br />
of liver from M. spretus sampled in Doñana and Domingo<br />
Rubio stream were performed analysing the extracts by 2-DE<br />
and searching the protein expression differences. Over 2500<br />
spots were resolved in the pH range 4–7 and 14–70 kDa M r .<br />
Image analysis of the gels yielded 36 spots with significantly<br />
altered expression. Of them, 16 proteins were identified by<br />
MALDI-TOF-PMF and heterologous search against Mus<br />
musculus databases. When this approach is applied to contaminated<br />
and non-contaminated points a clear diference in<br />
spots intensities corresponding to differentially expressed<br />
protreins was observed, which can be used for the environmental<br />
pollution assessment of proteomics.<br />
M e t a l l o m i c s A p p r o x i m a t i o n t o t h e<br />
M o u s e M u s m u s c u l u s<br />
In this study the presence of unknown metallobiomolecules<br />
in M. musculus was studied for the first time. Firstable,<br />
a general evaluation of the presence of total concentration of<br />
metal in different organs of the mouse (lung, liver, spleen,<br />
kidney, brain, testicle, heart and muscle) was performed.The<br />
experiments were carried out on inbred M. musculus specimens.<br />
An you can see the elements considered. Fe is the element<br />
most abundant in the different organs with an averaged<br />
concentration of 7,500 µg dm –3 in thecytosolic extracts. Other<br />
elements are Zn (about 2,300 µg dm –3 ), Cu (550 µg dm –3 ),<br />
ni (165 µg dm –3 ), Se (145 µg dm –3 ), and a toxic element such<br />
as Pb (26 µg dm –3 ). These elements are differentially distributed<br />
in the organs, for example, Cu and Zn are mainly present<br />
in the liver, but Pb in the muscle. An similar comments<br />
can be addressed to the other elements.<br />
Metal-biomolecules profiles was obtained with ICP-MS<br />
as metal tracer, using couplings with size exclusion chroma-<br />
Fig. 7. SEC-ICP-MS metal profiles in Mus musculus corresponding<br />
to Cu and Pb. hMM size exclusion column for 3,000 to<br />
70,000 Da; LMM, size exclusion column for 300 to 10,000 Da
Chem. Listy, 102, s265–s1311 (2008) Environmental Chemistry & Technology<br />
tography to characterize metalbiomolecules molecular mass<br />
profile, and subsequently in series, on the fractions isolated in<br />
the previous separation, reverse phase chromatography for a<br />
further purification of the extracts and biomolecule isolation.<br />
Two SEC columns were used to discriminate molecules with<br />
molecular mass range under 10,000 (360 to 10,000 Da) and<br />
between 3,000 and 70,000 Da. The results for Cu and Pb, this<br />
latter as example of toxic are shown as examples in Fig. 7.<br />
The results obtained for Cu and Pb can be summarized<br />
in the following items:<br />
• All extracts showed peaks in the range of 300 and<br />
2,000 Da whatever metal or organ considered.<br />
• A peak was observed in the void volume of the LMM<br />
column (Mr < 10 kDa) for all profiles, although they<br />
showed low intensities except for Cu that was studied<br />
in more detail.<br />
• A Cu-containing fraction (7–10 kDa) was found in the<br />
brain which was absent in all other M. musculus organs.<br />
Other elements, e.g. Pb, do not have peaks equivalent in<br />
that range of masses. Therefore, further studies involving<br />
subsequent purification by another chromatography<br />
technique and isolation of this Cu-bound biomolecule<br />
for MS identification is being considered.<br />
• The Cu and Pb fractions resolved in the HMM column<br />
were mainly associated with molecules with molecular<br />
masses from 25 to 67 kDa, which are present in all the<br />
organs for Cu and only in liver for Pb.<br />
• A chromatographic peak associated to Cu was detected<br />
in the molecular mass range 67 to 70 kDa for the lung<br />
extract, and in liver and kidneys for Pb.<br />
• A Cu-peak can be observed in liver extract at the void<br />
volume of the HMM column.<br />
In Fig. 8. is shown the chromatograms correponding to<br />
the cytosolic extracts. The main fraction is associated to liver<br />
and is eluted in the void volume of HMM column. Additional<br />
experiments with reverse phase chromatography of this<br />
isolated fraction and ICP-MS detection reveal that tow peaks<br />
can result from additional purification of this fraction.<br />
Fig. 8. Chromatographic profiles with HMM column (3,000 to<br />
70,000 Da)<br />
s307<br />
I n t e g r a t i o n o f M e t a l l o m i c s w i t h<br />
P r o t e o m i c s a n d T r a n s c r i p t o m i c s<br />
The complementary character of the different approaches<br />
presented in relation to Mus musculus/Mus spretus and<br />
the environmental assessment considered prevously claims<br />
for the integration of these three -omics.<br />
The availability of the complete sequence of an increasing<br />
number of genomes allows the developments in proteomics,<br />
which can be achieved by electrospray and MALDI-<br />
TOF mass spectrometry. However, many proteins can be<br />
sensitively detected by ICP-MS due to the presence of ICPionizable<br />
elements (heteroelements). Therefore the three -<br />
omics are complementary, and in this context the combination<br />
of validated metallomic data with the transcriptome and<br />
proteome knowledge of a cell is one of the largest challenges<br />
for future research in this topic.<br />
A crucial question is that better established -omics (transcriptomics<br />
and proteomics) support their studies on model<br />
organisms whose gene/protein sequence are well collected<br />
in databases. On the contrary, bioindicators currently used in<br />
environmental studies are non-model organisms absent from<br />
public databases. The design of primers that allows the confirmation<br />
of homology in gene expression at the transcript<br />
level between bioindicators used in environmental studies<br />
and sequenced model specimens is a very good tool to perform<br />
environmental metallomics and proteomics.<br />
This new triple-omics approach (MEPROTRAnS-triple-OMICS)<br />
is being applied to the M. musculus-M. spretus<br />
couple in Doñana natural Park for environmental assessment,<br />
following the steps listed below:<br />
•<br />
•<br />
•<br />
•<br />
•<br />
Extraction of RnA for transcriptomic and of proteins for<br />
proteomic and metallomic analyses.<br />
Quantification of changes at the transcriptome level by<br />
means of commercially available microarrays and further<br />
validation of selected microarray results by absolute<br />
quantification using real-time RT-PCR.<br />
Quantification of changes at the proteome level<br />
by 2-DE analysis and subsequent protein identification<br />
by MALDI-TOF-PMF.<br />
Integration of transcriptomic and proteomic results to<br />
distinguish transcriptional from post-transcriptional<br />
changes.<br />
Isolation of heteroatom-tagged molecules by size exclusion<br />
chromatography fractionation of tissue extracts<br />
guided by ICP-MS (First Dimension) and further purification<br />
by reverse phase and/or ion exchange chromatography<br />
with ICP-MS on the previous selected fractions<br />
(Second Dimension). This metallomic scheme will be<br />
assisted by 2-DE analysis to reveal the complexity of<br />
the successive sub-proteomes. The purification steps<br />
involving metallomics and proteomics will be repeated<br />
until the final isolation of target metal-biomolecules for<br />
identification by tandem mass spectrometry.
Chem. Listy, 102, s265–s1311 (2008) Environmental Chemistry & Technology<br />
•<br />
•<br />
Validation of metallomic results by Western hybridization<br />
and/or enzymatic assays, and by absolute quantification<br />
of transcripts coding the identified metalloproteins.<br />
Integrative multidisplinary decision on the optimal<br />
assay (high sensitivity, low cost and easy to perform)<br />
to be recommend for routine assessment of differentially<br />
expressed metalloproteins as novel biomarker in<br />
ecotoxicological studies.<br />
Conclusions<br />
The study of complex systems related with living organisms,<br />
such as the environment or health, in which many<br />
variables are involved, requires multidisciplinary tools for<br />
a comprehensive assessment of these issues.<br />
Several –omics, such as transcriptomics, proteomics and<br />
metallomics, offer a valuable alternative in environmental<br />
studies since they provide massive information about biomolecules<br />
in cells and organisms that help to overcome these<br />
problems. An overall evaluation of changes that contaminants<br />
induce in cells is only possible by integration of -omics:<br />
• Transcripts induced by pollutants (transcriptomics)<br />
encode proteins with altered expression profiles, which<br />
undergo post-traductional modifications (proteomics).<br />
• Many proteins related to enviromental issues are bound<br />
to metals (i.e. CYPs, SODs, GPXs, metallothioneins)<br />
that make advisable the use of metal-tagged techniques<br />
(metallomics) as preliminary step to simplify proteomic<br />
and transcriptomic approaches.<br />
Proteomics can guide metallomics by checking the presence<br />
of molecules in extracts obtained with the chromatography-ICPMS<br />
couplings:<br />
• This assists metal biomolecules isolation for mass<br />
spectrometry identification.<br />
• 2D analysis provide an image of the number of molecules<br />
in the extract and their molecular mass<br />
s308<br />
This triple -omic approach (MEPROTRAn-triple-<br />
OMICS) is a very useful and comprehensive alternative in<br />
the study of environmental issues and the diagnosis of contamination<br />
problems. In addition, MEPROTRAnS-triple-<br />
OMICS can assist in the validation of traditional biomarkers<br />
and a more simple cheap and fast assessment of environmental<br />
issues.<br />
This work has been supported by the Grant CTM2006-<br />
08960-C02-01( Ministerio de Educación y Ciencia-Spain<br />
and project FQM-348 from the Consejería de Innovación,<br />
Ciencia y Empresa (Junta de Andalucía).<br />
REFEREnCES<br />
1. Haraguchi H., Matsura H.: In: Enomoto S (rd) Bitrel,<br />
Wako (Saitama). Fujiyoshida (Yamanashi), Japan,<br />
2003.<br />
<strong>2.</strong> Szpunar J., Lobinski R., Prange A. Appl. Spectros. 57,<br />
102 (2003).<br />
3. Szpunar J.: Anal. Bioanal. Chem. 378, 54 (2004).<br />
4. Gómez-Ariza J. L., Garcia Barrera T., Lorenzo F., Bernal<br />
V., Villegas M. J., Oliveiras V.: Anal. Chim. Acta.<br />
524, 15 (2004).<br />
5. Sanz-Medel A.: Anal. Bioanal. 381, 1 (2005).<br />
6. Bonilla-Valverde D., Ruiz-Laguna J., Muñoz A., Ballesteros<br />
J., Lorenzo F., Gómez-Ariza J. L., López-Barea<br />
J.: Toxicology 197, 123 (2004).<br />
7. Ruiz-Laguna J., Garcia-Alfonso C., Peinado J., Moreno<br />
S., Leradi L., Cristaldi M., López-Barea J.: Biomarkers<br />
6, 146 (2001).<br />
8. Ruiz-Laguna J., Abril n., García-Barrera T., Gómez-<br />
Ariza J. L., López-Barea J., Pueyo C.: Environ. Sci.<br />
Technol. 40, 3646 (2006).
Chem. Listy, 102, s265–s1311 (2008) Environmental Chemistry & Technology<br />
L07 hEAVy METALS IN SOLID IMMISIONS IN<br />
ThE VICINITy OF IRON ORE MINING AND<br />
PROCESSING PLANT IN NIŽNÁ SLANÁ<br />
JOZEF HAnČUľáK, ERIKA FEDOROVá, OľGA<br />
ŠESTInOVá, TOMISLAV ŠPALDOn, Ján BREHUV and<br />
PAVeL SLAnČO<br />
Institute of Geotechnics of the Slovak Academy of Sciences<br />
Watsonova 45, 043 53 Košice, Slovak Republic,<br />
hanculak@saske.sk<br />
Introduction<br />
The content of hazardous substances in atmospheric<br />
deposition significantly contributes to the pollution of<br />
environment. A lot of studies deals with the research of<br />
atmospheric deposition, mostly using methods monitoring<br />
wet deposition, wet and dry deposition (bulk deposition),<br />
but also methods using fog and low cloud sampling 1 . The<br />
solid emissions from the technologies of ores and industrial<br />
minerals processing by their specific composition influence<br />
constitution of atmospheric deposition, especially in the areas<br />
of processing plants. The main emission source in the area<br />
of nižná Slaná is iron-ore mining and processing plant. The<br />
plant exploits the siderite ore. The run-off-mine ore is through<br />
several technological centres processed into the blast furnace<br />
pellets as a final product of the plant. The contribution deals<br />
with the evaluation of results obtained from monitoring of<br />
atmospheric deposition in the form of dust fallout (modified<br />
method bulk deposition). The research was carried out by the<br />
Institute of Geotechnics of the SAS in the area of the Siderite,<br />
Ltd. from 2001 to 2007, predominantly from viewpoint<br />
of heavy metals deposition (Fe, Mn, Zn, Pb, Cu, Cr, Cd, and<br />
As).<br />
Characteristics of the Plant<br />
The plant is situated in the Slaná river valley in the Slovak<br />
Republic. The valley has an orientation of north-south<br />
and northwest-southeast, respectively. The wind circs are<br />
influencing by an orography of given territory. Distribution<br />
of wind directions and the occurrence of calm in the near-by<br />
Rožňava town are shown in Table I.<br />
Exploited deposit is located in the Revúca upland Mts.,<br />
the Dobšiná foothill belt Mts. of the Slovak Ore Mts. Utility<br />
mineral is siderite. The average content of iron and manganese<br />
in ore is 33.5 % and <strong>2.</strong>8 %, respectively. Manganese<br />
is bonded isomorfically in the siderite lattice. There are also<br />
unfavourable elements (As, S, Pb, Zn) that occur as, sulphides,<br />
sulphates, sulphosalts and oxides. The most significant<br />
unacceptable impurity is arsenic that is present in the form of<br />
arsenopyrite. The average content of As in the run-off-mine<br />
ore is approximately of 0.01–0.1 %. Ore processing consists<br />
of crushing, magnetizing roasting, wet milling, magnetic<br />
separation and pelletizing. Primarily, thermal technologies,<br />
i.e. pelletizing and magnetizing roasting are responsible for<br />
the amount of dust outlet. Flue gases are exhausted to the<br />
environmental air through 120-meter high chimney after<br />
s309<br />
several stages of dedusting. Table II presents the average concentrations<br />
of the selected elements in the dust outlet from<br />
pelletizing plant and rotary furnaces. The emissions of solid<br />
pollutants from 1998 to 2007 are shown in the Table III.<br />
Material and Methods<br />
The samples of dust fallout were taken in the 30 days<br />
( ± 3 days) intervals from the seventeen sampling stations.<br />
The cylindrical plastic sedimentation containers (inside diameter<br />
– 1<strong>2.</strong>5 cm), put in two support stands in the height of<br />
<strong>2.</strong>5 to 3 m, were used for the sampling. The containers were<br />
filled with 250 ml of pure water with addition of isopropanol.<br />
After sampling, the content of containers was quantitatively<br />
located to evaporating dishes and evaporated. The organic<br />
mass was removed by annealing of dry matter at 450 °C. The<br />
chosen temperature prevented carbonate degradation and in<br />
such way enables to avoid the misinterpretation of dust fallout<br />
gravimetry results. The samples were gravimetrically evaluated<br />
before and after annealing, in the mass units recalculated<br />
for the area and the respective time period. Inorganic<br />
portion determined by annealing from twelve month period<br />
was cumulated to the one sample and after mineralization it<br />
was analysed using AAS (SpectrAA – 30 VARIAn). On the<br />
basis of these chemical analyses and mass yield of the dust<br />
fallout, the average annual depositions by observed heavy<br />
metals were calculated for each of the seventeen sampling<br />
points. The localization of sampling stations is illustrated in<br />
Fig. 1.<br />
Fig. 1. Sampling locations in the area of Nižná Slaná<br />
Results and Discussion<br />
The average year values of total deposition for whole<br />
monitored period determined for individual sampling points
Chem. Listy, 102, s265–s1311 (2008) Environmental Chemistry & Technology<br />
Table I<br />
Percentage of the wind directions and calm in the Rožňava town [%]<br />
n n-E E S-E S S-W W n-W Calm<br />
38 8 6 2 25 2 3 6 10<br />
Table II<br />
The content of the selected elements in the solid dust outlets from thermal technologies<br />
Technologies<br />
Fe Mn Zn Pb Cu Cr Cd As<br />
[%] [ppm]<br />
Pelletizing 30.4 3.48 94 3<strong>2.</strong>6 99 39 25 636<br />
Rotary furnaces 27.8 <strong>2.</strong>12 200 127 170 63 24 176<br />
Table III<br />
The emissions of solid pollutants from the plant (1998–2007) [t year –1 ]<br />
1998 1999 2000 2001 2002 2003 2004 2005 2006 2007<br />
156.4 116.3 116.9 86.7 3<strong>2.</strong>9 63.3 63.8 121.5 155.8 148.4<br />
Table IV<br />
The average deposition of selected heavy metals and total deposition in the area of nižná Slaná (2001–2007)<br />
Parameter<br />
Total dep. Fe Mn Zn Pb Cu Cr Cd As<br />
[mg m –2 year –1 ]<br />
Minimum 8,621.0 1,221.0 60.9 9.54 0.35 1.67 1.09 0.033 1.49<br />
Maximum 32,537.0 9,636.0 631.3 63.12 <strong>2.</strong>81 5.73 4.36 0.078 28.84<br />
Average (n = 17) 18,155.0 4,543.0 27<strong>2.</strong>7 23.34 0.93 3.38 <strong>2.</strong>58 0.050 11.07<br />
Median 17,173.0 4,423.0 265.0 17.68 0.68 3.27 <strong>2.</strong>59 0.048 8.77<br />
SD 6,996.0 2,288.0 160.6 16.59 0.65 1.05 1.05 0.012 7.50<br />
were in the interval 8.6–3<strong>2.</strong>5 g m –2 y –1 . In most of sampling<br />
points a significant increase of solid pollutant emissions in<br />
2005 till 2007 comparing with previous years was not detected<br />
(total dust fallout). On the other hand, the significant<br />
increases of Fe, Mn and As deposition values were recorded<br />
using dust fallout analysis in the most of sampling stations.<br />
The samples of dust fallout were also subjected to X-ray<br />
diffraction (XRD) analysis. Thus, minerals such as quartz,<br />
chlorite, siderite, ankerite were detected. These minerals<br />
come from raw ore handling but also as a result of aeolation<br />
from surrounding environment. On the other side hand there<br />
are minerals, namely hematite, maghemite, magnetite and<br />
wüstite coming from the thermal technologies of the plant 2 .<br />
Table IV presents average values of deposition of<br />
selected heavy metals and basic statistic parameters for the<br />
whole monitored period and all sampling points. Qualitative<br />
composition of dust fallout unlike of its quantity significantly<br />
contributed to the ecological load of the individual sampling<br />
points that was caused by plant activities. Between various<br />
sampling points high differences in the deposition were<br />
determined mainly for Fe, Mn and As. There were not so high<br />
differences in the deposition with others elements. The most<br />
s310<br />
ecological load was situated in the south of the plant, in the<br />
central part of the valley. The statistical dependence between<br />
emissions of solid pollutants and deposition of observed<br />
metals (annual median) in the individual years by correlation<br />
analysis was evaluated. Relatively high positive values<br />
of correlation coefficient were calculated for manganese, iron<br />
and arsenic, namely 0.794, 0.764 and 0.749, respectively.<br />
Correlation coefficients for other elements were relatively<br />
low. The development of selected metal deposition (median)<br />
and the emissions of solid pollutants for the whole monitoring<br />
period is showed in Fig. <strong>2.</strong><br />
In the Slovak Republic there are not determined allowable<br />
limits for heavy metals deposition from dust fallout.<br />
That is the reason why relative comparison of heavy metal<br />
depositions for different localities is used for assessment of<br />
immission load.<br />
In the nižná Slaná locality, Fe deposition achieves high<br />
values because of solid pollutants emissions consist mainly<br />
of iron minerals. Fe depositions monitored in the individual<br />
stations were in the range from 1.221 to 9.636 mg m –2 y –1 .<br />
In Košice town with metallurgy industry, the values varied<br />
from 232 to 7.568 mg m –2 y –1 (ref. 3 ). In the Czech Republic
Chem. Listy, 102, s265–s1311 (2008) Environmental Chemistry & Technology<br />
Fig. <strong>2.</strong> Development of selected metal deposition (median) and<br />
the emissions of solid pollutants (2001–2007)<br />
in 2005 (measured for subsystems of basic and contaminated<br />
areas), ten times lower Fe deposition was determined in<br />
comparison with area of nižná Slaná (69–1,002 mg m –2 y –1 )<br />
(ref. 4 ).<br />
The highest contents of manganese in dust fallout were<br />
detected in the area of nižná Slaná and Jelšava with maximum<br />
deposition values of Mn 631.3 and 406.4 mg m –2 y –1 ,<br />
respectively 3 . Average values exceeded 200 mg m –2 y –1 .<br />
In past, the most manganese loaded territory was the locality<br />
Dolný Kubín that is located nearby iron-alloy factories<br />
Istebné, where the maximum deposition Mn value from dust<br />
fallout was 668 mg m –2 y –1 (ref. 5 ). In other parts of Slovakia,<br />
average deposition of Mn from dust fallout were 3.6 and<br />
34.4 mg m –2 y –1 in the Slovak Paradise and Košice, respectively<br />
3 . In the case of nižná Slaná and Jelšava, the main manganese<br />
sources were iron-ore mining factories, magnesite<br />
factories and raw materials (siderite, magnesite) treated in<br />
these factories. In the Czech Republic in the monitored territories<br />
the average deposition of Mn was 13.6 mg m –2 y –1 and<br />
the maximum deposition was 68.3 mg m –2 per year 4 .<br />
The deposition values of Zn in the nižná Slaná area<br />
were in the interval 9.5–63.1 mg m –2 y –1 with the average<br />
value of 23.3 mg m –2 y –1 . In general, these values are not very<br />
high. In the Czech Republic, the average atmospheric depositions<br />
of Zn were 50.6 and 54.3 mg m –2 y –1 and the maximum<br />
was 206 mg m –2 y –1 (ref. 4 ). In the agricultural area Austria<br />
and England, the measured values of zinc deposition were<br />
s311<br />
in range from 21.4 to 48.9 mg m –2 y –1 respectively 2<strong>2.</strong>1 to<br />
35.6 mg m –2 y –1 (refs. 6,7 ).<br />
The deposition of Pb was relatively low (0.11–<br />
<strong>2.</strong>44 mg m –2 y –1 ) in the locality of nižná Slaná. The maximum<br />
content of Pb (21.89 mg m –2 y –1 ) from dust fallout was<br />
measured in Krompachy, while the main source of solid<br />
pollutions was cooper smeltery 3 . In past, in Slovakia, there<br />
was determined the maximum content of Pb in dust fallout<br />
(380 mg m –2 y –1 ) in the locality of Prievidza, that was caused<br />
by steam brown coal combustion 5 . The deposition of Pb was<br />
5.4 to 13.9 mg m –2 y –1 in England and Wales 6 . In Austria, the<br />
measured values were 1.90–5.44 mg m –2 y –1 (ref. 7 ).<br />
The deposition of Cu achieved low values in nižná<br />
Slaná (1.74-5.68 mg m –2 y –1 ). High copper deposition<br />
(128.26 mg m –2 y –1 ) was measured in Krompachy 3 . The<br />
values in Austria and England were in range from 6.24 up to<br />
14.70 respectively 2<strong>2.</strong>1 to 35.6 mg m –2 y –1 (refs. 6,7 ) .<br />
The average depositions of chromium in nižná Slaná<br />
were in the interval from 1.19 to 4.77 mg m –2 y –1 . The average<br />
depositions of chromium from dust fallout in the Slovak Paradise<br />
and Jelšava were 0.64 and 10.52 mg m –2 y –1 , respectively.<br />
The maximum measured value was detected in Košice<br />
(14.62 mg m –2 y –1 )(ref. 3 ). In the Czech Republic, atmospheric<br />
deposition monitoring revealed values in the range from 0.21<br />
to <strong>2.</strong>81 mg m –2 y –1 and in Austria in the interval from 0.72 to<br />
1.95 mg m –2 y –1 (refs. 4,7 ). In England and Wales, the Cr values<br />
were in range from 0.75 to 2 mg m –2 y –1 (ref. 6 ).<br />
The deposition values of cadmium in the nižná Slaná<br />
were in the range from 0.033 to 0.084 mg m –2 y –1 . This is relatively<br />
low value. In Košice and Jelšava, the measured average<br />
values were 0.678 and 0.742 mg m –2 y –1 , respectively 3 . In the<br />
Czech Republic, the atmospheric deposition monitoring detected<br />
values in the range from 0.025 to 1.230 mg m –2 y –1<br />
and n Austria in the interval 0.146–0.325 mg m –2 y –1 (refs. 4,7 ).<br />
The deposition of Cd was 0.19 to 0.61 mg m –2 y –1 in England<br />
and Wales 6 .<br />
Relatively high values of arsenic deposition were registered<br />
in the locality of nižná Slaná. The average values in<br />
the monitored areas were in the interval of 1.28–29.28 mg m –<br />
2 y –1 . The source of arsenic is arsenopyrite that is present<br />
in siderite batch. The maximum arsenic value was detected<br />
from sampling station no.5 that is close to the factory. This<br />
value is two fold times higher that the maximum value from<br />
Krompachy, where the measured value was 14.588 mg m –<br />
2 y –1 (ref. 3 ). In the relative pure area of Slovak Paradise, the<br />
recorded values of arsenic deposition were from 0.044 to<br />
0.155 mg m –2 y –1 (ref. 3 ). The atmospheric deposition monitoring<br />
in the Czech Republic registered values from 0.21<br />
to <strong>2.</strong>81 mg m –2 y –1 (ref. 4 ). In past, in the Slovak Republic,<br />
maximum content of As in dust fallout was 35 mg m –2 y –1 in<br />
the locality of Prievidza (effect of steam brown coal combustion<br />
with high concentration of As) 5 . The average values<br />
for atmospheric deposition in the Czech Republic were<br />
0.50–0.67 mg m –2 y –1 and maximum arsenic value was<br />
<strong>2.</strong>11 mg m –2 y –1 in 2005(ref. 4 ). In England and Wales, the As<br />
values were in range from 0.31 to 1 mg m –2 y –1 (ref. 6 ).
Chem. Listy, 102, s265–s1311 (2008) Environmental Chemistry & Technology<br />
Conclusions<br />
The detailed analysis of dust fallout from the locality of<br />
Siderite, Ltd. factory revealed the extent of ecological load.<br />
In comparison with others localities, this area is the most<br />
influenced with heavy metals (iron, manganese and arsenic).<br />
This fact reflects the composition of siderite and applied technological<br />
treatments of siderite ore in the factory. Although<br />
relatively small territory was monitored, the significant differences<br />
are detected. There are many different factors, for<br />
example: meteorological, orographic, emissive, binding and<br />
particle sedimentation mechanisms with linkage to impurities<br />
and also others factors. Although the method of measuring<br />
of dust fallout is laborious with some mistakes, the relative<br />
evaluation of individual localities imission load provides<br />
applicable results.<br />
This work has been supported by Slovak grant agency VEGA<br />
project No. 2/0131/08.<br />
s312<br />
REFEREnCES<br />
1. Fišák J., Tesař M., řezáčová D., Eliáš V., Weignerová<br />
V., Fottová, D.: Atmos. Res., 64, 75 (2002).<br />
<strong>2.</strong> Baluchová B., Fejdi P., Bobro M.: Mineralia Slovaca,<br />
36, 357 (2004).<br />
3. Hančuľák J., Bobro M., Brehuv J., Slančo P.: Acta Montanistica<br />
Slovaca, 10, 246 (2005).<br />
4. Prášková L., Kubík, L., Malý, S.: Annual report 2005.<br />
Central institute for supervising and testing in agriculture.<br />
Brno 2006.<br />
5. Ursíniová M., Vaňová R., Paľušová O.: Acta Hygienica<br />
et Epidemiologica et Microbiologica. Praha, 21, 1<br />
(1992).<br />
6. nicholson F. A., Smith S. R, Alloway B. J., Carlton-<br />
Smith C., Chambers B. J.: Sci. Total Environ. 311, 205<br />
(2003).<br />
7. Spiegel H., Böhm K.E., Roth K. Sager M.: Proceedings<br />
7th Intern. Conf. on the Biogeochem. of Trace Elements;<br />
Uppsala ’03, 15 -19 June 2003 (Gobran G., Lepp n.,<br />
ed.), p.19, Uppsala 2003.
Chem. Listy, 102, s265–s1311 (2008) Environmental Chemistry & Technology<br />
L08 COMPARISON OF ENERGy DISPERSIVE<br />
x-RAy FLuORESCENCE SPECTROMETRy,<br />
INDuCTIVELy COuPLED PLASMA OPTICAL<br />
EMISSION SPECTROMETRy AND LASER<br />
AbLATION wITh PLASMA SPECTROMETRy<br />
IN ThE ELEMENTAL ANALySIS OF SOILS<br />
IVOnA HUBOVá a , MARKéTA HOLá a , VLASTIMIL<br />
KUBáň b , ILSE STEFFAn c and VIKTOR KAnICKý a<br />
a Laboratory of Atomic Spectrochemistry, Department of Chemistry,<br />
Faculty of Science, Masaryk University, Brno 611 37,<br />
Czech Republic,<br />
b Department of Chemistry and Biochemistry, Faculty of<br />
Agronomy, Mendel University of Agriculture and Forestry,<br />
Brno 613 00, Czech Republic,<br />
c Department of Analytical Chemistry and Food Chemistry,<br />
Faculty of Chemistry, University of Vienna, Vienna 1090,<br />
Austria,<br />
41396@mail.muni.cz<br />
Introduction<br />
Agricultural soils represent complex multiphase multicomponent<br />
material which requires adequate methods of<br />
chemical analysis. Content of elements represents important<br />
parametre which relates to nutrition of plants on one side and<br />
a contamination with toxic elements on the other side. For<br />
intake of elements by plants only selected elemental forms<br />
(species) are bioavailable. Speciation or fractionation based<br />
on selective leaching of particular species followed by atomic<br />
absorption spectrometry or inductively coupled plasma<br />
optical/mass spectrometry (ICP-OES, ICP-MS) analyses of<br />
resulting solutions are employed for this purpose. nevertheless,<br />
total elemental contents, which comprise also elemental<br />
forms that are insoluble in leaching media or by the action of<br />
plants, might be interesting for overall characterisation of a<br />
particular soil. In this case, total sample decomposition procedures<br />
based on the action of a mixture of mineral acids or<br />
a sample fusion with a suitable melt are applied to dissolve<br />
resistant minerals and desintegrate possibly present silicate<br />
lattice.<br />
However, some methods for direct analysis of solids<br />
are more advantageous because of elimination of possible<br />
analytes losses and minimization of risk of contamination.<br />
For this purpose, X-ray fluorescence (XRF) spectrometry 1 is<br />
frequently and routinely used. Laser-assised plasma spectrometry<br />
techniques, such as laser induced breakdown spectroscopy<br />
2 , and ICP-OES or ICP-MS in connection with laser<br />
ablation (LA) seem to be promising tool for soil analysis. 3–7<br />
The aim of this work consists in establishing new<br />
methods of soil elemental analysis using LA-ICP-OES/MS.<br />
Artificially intentionally contaminated archive soil samples<br />
were employed. Toxic metals Cr, ni, Cu, Zn and Pb were<br />
considered in the method developement. For the method<br />
validation, these soil samples were subjected to ICP-OES<br />
analysis of solutions obtained by total decomposition using<br />
mineral acids. Seleted soil standard reference materials were<br />
s313<br />
also analyzed. Independent results acquired by XRF analysis<br />
of soil sample pellets were used for confirmation of accuracy<br />
of solution analysis by ICP-OES.<br />
Besides the total elemental content determination,<br />
selected soils were characterized by means of the five-step<br />
extraction procedure to asses elemental fractions bound to<br />
particular soil phases. This information might be important<br />
for explanation of possible matrix effects associated with<br />
processes of LA.<br />
A selection and preparation of a suitable binder represents<br />
the indispensable step in the development of ablation<br />
– based methods. In our work we investigated a silica solgel<br />
matter preparation and its mixing with soil samples. The<br />
binder was then successfully applied in LA-ICP-OES/MS<br />
methods. The accuracy of the developed methods was confirmed<br />
by analysis of certified reference materials of soils<br />
(GBW07405 – 07).<br />
Experimental<br />
S o i l S a m p l e s<br />
Experimentally contaminated agricultural soils representing<br />
various soil types belong to archived materials of the<br />
Central Institute for Supervising and Testing in Agriculture<br />
(UKZUZ), Brno, Czech Republic.<br />
Studied trace elements Cr, ni, Cu, Zn, Pb occur in the<br />
concentration ranges as shown in Table I.<br />
The soil samples were ground in a ball mill and dried<br />
to constant weight. The particle size of ground samples was<br />
measured by laser diffractometry and the particle diameter<br />
did not exceed 30 µm.<br />
Table I<br />
Concentration range of tested soils and RSD values for<br />
Pn-ICP-OES<br />
Element C range [mg kg –1 ] RSD [%]<br />
Cr 21–590 3.7–1.7<br />
ni 3.5–262 14–0.9<br />
Cu 11–242 <strong>2.</strong>5–3.2<br />
Zn 51–1355 <strong>2.</strong>7–0.5<br />
Pb 22–1015 <strong>2.</strong>7–1.6<br />
The solution analysis by ICP with pneumatic nebulization,<br />
(Pn-ICP-OES) was carried out after the sample decomposition<br />
with a mixture of HF and HClO 4 (ref. 5 ) The soil-wax<br />
pellets for XRF analysis were prepared as a mixture of 4 g<br />
of a soil powder and 0.9 g of wax. The mixture was homogenized<br />
in a ball mill and then pressed by a hydraulic press<br />
to a pellet with a diameter of 32 mm. Sequential extraction<br />
was performed using five reagents with a different strength<br />
(Table II) 8,9 . The sol-gel method, allowing homogenous dispersion<br />
of internal standard (Sc) and analytes in calibration<br />
pellets, was applied for analysis of tested soils by LA-ICP-<br />
MS 10 .
Chem. Listy, 102, s265–s1311 (2008) Environmental Chemistry & Technology<br />
Table II<br />
Sequential extraction procedure<br />
Step Metal phase Reagent<br />
1 Exchangeable 1 M naOAc (pH = 8.2)<br />
2 Carbonate 1 M naOAc (pH = 5)<br />
3 Mn-Fe oxides 0.04 M nH 2 OH . HCl<br />
in 25 % HOAc<br />
4 Organic 0.02 M HnO 3 , 30% H 2 O 2 (pH = 2),<br />
3.2 M nH 4 OAc in 20% HnO 3<br />
5 Residual conc. HF, HClO 4 , HCl<br />
S o l - G e l T e c h n i q u e<br />
Sol-gel is an amorphous solid prepared via sol-gel processing,<br />
in which a colloidal suspension (sol) is first formed<br />
by mixing a silicon (e.g. tetraethoxysilane-TEOS) alkoxide<br />
precursor, water, a co-solvent and an acid or base catalyst.<br />
Alkoxyl groups are removed by acid- or base-catalysed hydrolysis<br />
reactions (Eq. (1)), and networks of O – Si – O linkages<br />
(gel) are formed in subsequent condensation reactions, which<br />
can produce either water or alcohol as shown in equations<br />
(2) and (3), involving hydroxyl groups 11 . Internal standard is<br />
integrated with the sample during gelation process.<br />
Hydrolysis:<br />
Si(OR) 4 + H 2 O → Si(OR) 3 OH + ROH (1)<br />
Condensation:<br />
X 3 SiOH + HOSiX’ 3 → X 3 Si – O – SiX’ 3 + H 2 O (2)<br />
X 3 SiOR + HOSiX’ 3 → X 3 Si – O – SiX’ 3 + ROH (3)<br />
An archive soil sample with the lowest content of Cr, ni,<br />
Cu, Zn and Pb spiked with solutions of elements of interest<br />
was used for the preparation of calibration samples. Twentytwo<br />
soil samples and three certified reference material of soils<br />
(GBW07405 – 07) were analyzed by developed LA-ICP-MS<br />
method and the obtained contents were compared with results<br />
of independent methods (XRF, ICP-OES).<br />
The real soil samples were treated by the following<br />
procedure: 1.2 g of soil was weighed into a 50 ml beaker<br />
and 3 ml of TEOS, 6 ml of ethanol, 1.5 ml of water, 20 µl<br />
of the Sc standard solution (100 mg ml –1 ) and two drops of<br />
0.01 mol dm –3 HnO 3 were added. The beakers were put into<br />
a thermostated water bath maintained at ~ 75 °C under ultrasonic<br />
stirring for ~ 1.5 h to reach the complete gelation. After<br />
20 min., 5 ml of water was added. The gelled materials were<br />
dried overnight in an oven at 110 °C. The sol-gel samples<br />
were manually ground and pressed into pellets with 12 mm<br />
in diameter and 1 mm thickness 10 .<br />
I n s t r u m e n t a t i o n<br />
A Jobin Yvon 170 Ultrace with laterally viewed ICP<br />
was used for solution analysis. The ICP system combines a<br />
s314<br />
monochromator and a polychromator. The monochromator<br />
was set on the Pb II 220.353 nm line and other four studied<br />
analytes were measured with the polychromator of a Paschen<br />
Runge montage using analytical lines Cr II 267.720 nm,<br />
ni II 231.608 nm, Cu II 324.759 nm and Zn I 213.860 nm.<br />
The XRF analysis was performed on an energy-dispersive<br />
XRF spectrometer (SPECTRO XEPOS) by polarized<br />
radiation, equipped with a Pd X-ray tube and a Si-detector.<br />
The real unknown samples were analyzed by the TUR-<br />
BOQUAnT method, which is able to analyze the elements<br />
na-U.<br />
The LA-ICP-MS was performed with a laser ablation<br />
system UP 213 (new Wave, USA) and an ICP-MS spectrometer<br />
Agilent 7500 CE (Agilent, Japan). A commercial Qswitched<br />
nd:YAG laser, operated at the wavelength of 213<br />
nm with the 5 th harmonic frequency, was used for ablation.<br />
The ablation device is equipped with programmable XYZstages<br />
that allowed sample movements during the ablation<br />
process. The samples were placed into the SuperCell (new<br />
Wave, USA) and were ablated by the laser beam, which was<br />
focused onto the sample surface through a quartz window.<br />
The ablated material was transported by flowing He to the<br />
ICP.<br />
Results<br />
The total contents of trace elements were determined<br />
using ICP-OES after total decomposition. XRF spectrometry<br />
was chosen for result comparison. Relative standard deviation<br />
of the total decomposition method and concentration range<br />
of tested soils can be found in Table I. Higher RSD value<br />
might be due to sample inhomogeneity and uncertainty of<br />
the measurement at low element concentration. Satisfactory<br />
agreement was found for ICP-OES solution analysis and<br />
XRF spectrometry. Correlation coefficient r values exceeded<br />
0.994. Comparison of Pn-ICP-OES and XRF determination<br />
of zinc as an easily leachable element is presented in Fig. 1.<br />
A five-stage sequential extraction procedure was used<br />
for the determination of the speciation of extractable heavy<br />
Fig. 1. Comparison of results obtained by xRF analysis and<br />
PN-ICP-OES of soil extracts for Zn I 213.860 nm
Chem. Listy, 102, s265–s1311 (2008) Environmental Chemistry & Technology<br />
Table III<br />
Comparison of efficiency of extraction by Pn-ICP-OES to<br />
XRF analysis<br />
Element Efficiency [%]<br />
Cr 63<br />
ni 82<br />
Cu 80<br />
Zn 102<br />
Pb 96<br />
metals by Pn-ICP-OES. The results as a sum of the five<br />
extraction steps were compared with those obtained after<br />
total decomposition and by XRF spectrometry. Efficiency<br />
of soil extracts to pressed pellets together with correlation<br />
coefficients are presented in Table III. The best efficienty of<br />
extraction can be observed for lead and zinc. Efficiency of<br />
extraction depends on the binding to minerals with different<br />
solubility. Low efficiency of chromium can be explained by<br />
binding to poorly soluble chromspinels and chromite 12,13 .<br />
The soil samples were analysed to evaluate the possibility<br />
of quantitative elemental analysis by laser ablation. The<br />
results for LA-ICP-MS were compared with the results of<br />
XRF as a method representing another type of direct analysis<br />
and with the results of solution analysis by ICP-OES as an<br />
ordinary method. In the case of Cr, slightly lower concentration<br />
values were yielded for the total decomposition using<br />
Pn-ICP-OES than for both direct analysis methods, which<br />
can be caused by the incomplete decomposition of Cr in acids<br />
(Fig. <strong>2.</strong>).<br />
Fig. <strong>2.</strong> Comparison of LA-ICP-MS and PN-ICP-OES after total<br />
decomposition results for Cr as a barely leachable element<br />
The calibration was performed using spiked sample pellets.<br />
The soil with a low content of elements of interest was<br />
spiked with seven concentration levels to obtain a calibrated<br />
range from 24 to 965 mg kg –1 . The calibration curves were<br />
fitted by a computer program WinStat. All calibration plots<br />
were linear over the whole concentration range. Intercepts of<br />
the regression lines were tested by t-test and were statistically<br />
insignificant (t a < t 0.05;n-2 ) for all studied elements. Correla-<br />
s315<br />
Table IV<br />
Comparison of CRM GBW07407 soil analysis results by<br />
LA-ICP-MS and certified values; the uncertainty intervals<br />
are calculated on a 95 % confidence level<br />
Method [mg kg–1 ] LA-ICP-MS Certified value<br />
Cr 432 ± 28 410 ± 23<br />
ni 269 ± 27 276 ± 15<br />
Cu 84 ± 8 97 ± 6<br />
Zn 139 ± 15 142 ± 11<br />
Pb 15 ± 3 14 ± 3<br />
tion coefficient r values were in the range of 0.997–0.999.<br />
Calibration line for copper with scandium as internal standard<br />
is presented in Fig. 3.<br />
Repeatability of ablation was described as RSD % which<br />
was calculated from three measurements of ablation signal on<br />
the different locations of each pellet. The RSD values did not<br />
exceed 8%.<br />
The accuracy of the method was confirmed by analysis<br />
of three CRM soils. Results of CRM GBW 7407 by LA-ICP-<br />
MS and certified values are given in Table IV.<br />
Fig. 3. Calibration graph for Cu with internal standardization<br />
by Sc<br />
Conclusions<br />
Monitoring of the heavy metals in agricultural soils is gaining<br />
the importance because these elements can be accumulated<br />
by plants and thus enter the food chain. To obtain total<br />
elemental content of Cr, ni, Cu, Zn, Pb the decomposition<br />
with HF and HClO 4 by ICP-OES was used. The sequential<br />
extraction procedure providing more information than total<br />
concentration determination was used to study bioavailability<br />
of metals. Methods of total decomposition are very lengthy<br />
and sometimes even not fully efficient therefore direct<br />
methods are more convenient in such a case. XRF analysis<br />
of soil pellets prepared with a wax binder and LA-ICP-MS<br />
of perfectly homogenized pellets using sol-gel method represented<br />
the direct methods.<br />
The results of direct methods were compared with those<br />
obtained by Pn-ICP-OES. A satisfactory agreement was
Chem. Listy, 102, s265–s1311 (2008) Environmental Chemistry & Technology<br />
found for all three methods applied to the studied elements,<br />
except for chromium as was mentioned.<br />
I. H. and M. H. gratefully acknowledge the Ministry of<br />
Education, Youth and Sports of the Czech Republic for support<br />
of the research project MSM0021622412, V.K.gratefully<br />
acknowledges the Ministry of Education, Youth and Sports<br />
of the Czech Republic for support of the research project<br />
MSM0021622410. The authors acknowledge Dr. Jiří Zbíral<br />
from the Central Institute for Supervising and Testing in Agriculture<br />
for providing the soil samples and Dr. Petr Kolečkář<br />
from SPECTRO CS for consultations and assistence at measurements<br />
with XRF spectrometer.<br />
REFEREnCES<br />
1. dos Anjos M. J., Lopes R. T., de Jesus E. F. O., Assis J.<br />
T., Cesareo R., Barradas C. A. A.: Spectrochim. Acta B<br />
55, 1189 (2000).<br />
<strong>2.</strong> Capitelli F., Colao F., Provenzano M. R., Fantoni R.,<br />
Brunetti G., Senesi n.: Ž. Geoderma 106, 45 (2002).<br />
3. Kanicky V., Mermet J. M.: Fresenius’ J. Anal. Chem.<br />
363, 294 (1999).<br />
s316<br />
4. Musil P., Otruba V., Kanicky V., Mermet J. M.: Spectrochim.<br />
Acta B 55, 1747 (2000).<br />
5. Mikoláš J., Musil P., Stuchliková V., novotný K., Otruba<br />
V., Kanický V.: Anal. Bioanal. Chem. 374, 244 (2002).<br />
6. Lee Y. L., Chang Ch. Ch., Jiang S. J.: Spectrochim. Acta<br />
B 58, 523 (2003).<br />
7. Baker S. A., Bi M., Aucelio R. Q., Smith B. W., Winefordner<br />
J. D.: J. Anal. At. Spectrom. 14, 19 (1999).<br />
8. Hlavay J., Prohaska T., Weisz M., Wenzel W. W., Stingeder<br />
G. J.: Pure Appl. Chem. 76, 415 (2004).<br />
9. Mester Z., Cremisini C., Ghiara E., Morabito R.: AnalyticaChimica<br />
Acta 359, 133 (1998).<br />
10. Hubová I.: J. Anal. At. Spectrom. 22, 1 (2007).<br />
11. Wright J. D., Sommerdijk A. J. M.: Sol-Gel Materials<br />
Chemistry and applications, 2001.<br />
1<strong>2.</strong> Medved J., Sterško V., Kubová J., Polakovičová J.: Fresenius´<br />
J. Anal. Chem. 360, 219 (1998).<br />
13. Doležal J., Povondra P., Šulcek Z.: Rozklady základních<br />
anorganických surovin, SnTL Praha, 1966.
Chem. Listy, 102, s265–s1311 (2008) Environmental Chemistry & Technology<br />
L09 TISSuE-SPECIFIC DISTRIbuTION AND<br />
ACCuMuLATION OF ORGANOChLORINE<br />
POLLuTANTS IN SELECTED RAPTOR<br />
SPECIES FROM ThE CZECh REPubLIC<br />
RADIM LánA a , MILADA VáVROVá a,b , VLADIMíR<br />
VEČEřEK b and STAnISLAV KRáČMAR c<br />
a ICTEP, Faculty of Chemistry, Brno University of Technology,<br />
Purkyňova 118, 612 00 Brno, Czech Republic,<br />
b University of Veterinary and Pharmaceutical Science Brno,<br />
Palackého 1–3, 612 42 Brno, Czech Republic,<br />
c Mendel University of Agriculture and Forestry in Brno,<br />
Zemědělská 1, 613 00 Brno, Czech Republic,<br />
lana@fch.vutbr.cz<br />
Introduction<br />
Organochlorine compounds such as polychlorinated<br />
biphenyls (PCBs) or organochlorine pesticides (OCPs) are<br />
known as persistent organic pollutants (POPs). Despite the<br />
ban on production or restrictions on use many years ago the<br />
POPs still continue to be found in various samples from the<br />
environment and accumulate through the food chains. For<br />
their top position within the food chain and the sensitivity<br />
to environmental changes birds of prey are very suitable bioaccumulation<br />
markers. The amount of pollutants accumulating<br />
in the raptors’ tissues is related not only to their diet and<br />
corresponding trophic position, but also to the differences in<br />
accumulation among habitats and ecosystems (aquatic vs.<br />
terrestrial) 1 . Moreover, sensitivity also varies greatly between<br />
compound and species 2 .<br />
However, it is difficult to use birds for the assessment<br />
of pollutant transfers within the food web, except for those<br />
species partly associated with the aquatic habitats where the<br />
transfer can be documented in some measure. For instance<br />
the cormorant or heron are fish feeders and top predators in<br />
aquatic ecosystems, have relatively high levels of POPs in the<br />
adipose tissue, and hence are suitable bioindication species 3 .<br />
Because practical and ethical reasons, low numbers and<br />
often legal protection inhibit the sacrifice of free-living animals,<br />
methods for non-destructive biomonitoring have been<br />
developed. Whereas many studies have previously focused<br />
on the use of eggs or hair, feathers, on the other hand, have an<br />
advantage that they can be collected irrespective of season,<br />
age or sex 4 . Another simple approach consists in the use of<br />
specimens found dead.<br />
In the Czech Republic, the levels of PCBs in unhatched<br />
eggs from raptors were monitored. no intra- or interspecies<br />
differences were found and the findings corresponded to<br />
those from Germany, Canda or the USA, where the CB 153<br />
was the most abundant congener 5 .<br />
This study deals with the levels of organochlorine pollutants<br />
in various tissues of raptor species from the Czech<br />
Republic and compares the results with those from foreign<br />
surveys.<br />
s317<br />
Experimental<br />
The sampling area as well as the raptor and fish species<br />
and their detailed description have already been published 6 .<br />
Selected tissue samples of investigated specimens were<br />
homogenized and dessicated by activated anhydrous sodium<br />
sulphate. Two different extraction techniques were employed<br />
for the isolation of lipids from the tissues. The samples of<br />
muscles, kidneys and liver were extracted by petrolether<br />
(SupraSolv, Merck) by means of accelerated solvent extraction<br />
(140 °C, 12 MPa, 3 × 5 min static extraction + n 2 purge).<br />
The samples of brain, skin, feathers and intestinal content<br />
were extracted by petrolether:acetone (1 : 1, v/v) for 6 h in<br />
a Soxtec apparatus. The removal of lipids from raw extracts<br />
was carried out on an adsorption column packed with Florisil<br />
(5 g; 60/100 mesh, Sigma-Aldrich, activated at 600 °C for<br />
6 h). The samples were then eluted with 90 ml of n-hexane:<br />
diethylethere (94 : 6, v/v), evaporated to dryness using a<br />
rotary evaporator, and dissolved in 1 ml of n-hexane.<br />
The quanification of target analytes was carried out<br />
by HP 6890n high resolution gas chromatograph with two<br />
micro-electron capture detectors (63 ni m-ECD) and two<br />
capillary columns (HT-8 and DB-17ms) operated in parallel<br />
(H 2 as the carrier gas). nine-point calibration curves in a<br />
linear range from 0.5 to 1,000 ng ml –1 were used and the limit<br />
of quantification (LOQ) for all analytes was calculated as<br />
<strong>2.</strong>5 ng g –1 of lipids (i.e. about 0.13 ng g –1 d.w. for 4% lipid<br />
content in a tissue).<br />
Results<br />
The levels of organochlorine pollutants found in the<br />
muscle tissue of cormorants from the Záhlinice area (2007)<br />
Fig. 1. Organochlorine pollutants in muscle tissue of common<br />
cormorant from the Záhlinice area (n = 8). Horizontal lines represent<br />
median, rectangles delimit the 1 st and 3 rd quartiles, and<br />
error bars represent the min/max values. Outlying values are<br />
marked as “+” (2007).
Chem. Listy, 102, s265–s1311 (2008) Environmental Chemistry & Technology<br />
are presented in Fig. 1. PCB congeners 138, 153 and 180,<br />
and the p,p’-DDE were the most abundant compounds. As<br />
can be read in this graph, there are significant differences in<br />
the levels of organochlorines in samples of different specimens.<br />
Due to its higher content of lipids, compared with the<br />
other tissues, skin was by far “the most contaminated” tissue<br />
(approx. five times higher levels of PCBs and OCPs).<br />
Extreme values exceeded 5,000 ng g –1 w.w. for the sum of<br />
7 PCB congeners, and DDT and its metabolites reached even<br />
higher levels. Interspecies differences in the concentrations<br />
of POPs are shown in Fig. <strong>2.</strong><br />
Fig. <strong>2.</strong> PCBs in muscle tissue of species from the Záhlinice<br />
area. horizontal lines represent median, rectangles delimit the<br />
1 st and 3 rd quartiles, and error bars represent min/max values.<br />
Outlying values are marked as “+” (2003).<br />
s318<br />
Comparison of fish and raptors’ tissues from the Záhlinice<br />
area showed an increase in the concentrations of POPs<br />
towards higher levels of the food chain and the process of<br />
accumulation of POPs was clearly illustrated.<br />
Conclusions<br />
Investigated raptor species including cormorant, grey<br />
heron and buzzard lived up to their reputation of being the<br />
most contaminated members of food chains. Cormorants and<br />
grey heron top the aquatic food chain and hence the levels of<br />
organochlorines found in their tissues were significantly higher<br />
than those in their fish prey. The results can be well compared<br />
with other findings not only within the Czech Republic<br />
a prove fish and birds of prey to be suitable bioaccumulation<br />
markers.<br />
Financial support from the Ministry of Education,<br />
Youth and Physical Training of the Czech Republic under the<br />
research project MSM 6215712402 is greatly appreciated.<br />
REFEREnCES<br />
1. Borgå K., Fisk A.T., Hoekstra P.F., Muir D.C.G.:<br />
Environ. Toxicol. Chem. 23, 2367 (2004).<br />
<strong>2.</strong> Hoffman D.J., Melancon M.J., Klein P.n., Eisemann<br />
J.D., Spann J.W.: Environ. Toxicol. Chem. 17, 747<br />
(1998).<br />
3. Ryckman D.P., Weseloh D.V., Hamp P. et al: Environ.<br />
Monitor. Assess. 53, 169 (1998).<br />
4. Dauwe T., Jaspers V., Covaci A., Schepens P., Eens.:<br />
Environ. Toxicol. Chem. 24, 442 (2005).<br />
5. Kubištová I.: Dissertation. University of Veterinary and<br />
Pharmaceutical Sciences Brno, Brno, Czech Republic,<br />
200<strong>2.</strong><br />
6. Houserova P., Kubáň V., Kráčmar S., Sitko J.: Environ<br />
Pollution 145, 185 (2007).
Chem. Listy, 102, s265–s1311 (2008) Environmental Chemistry & Technology<br />
L11 POTENTIAL APPLICAbILITy OF A<br />
hIGh PERFORMANCE ChELATION ION<br />
ChROMATOGRAPhIC METhOD TO ThE<br />
DETERMINATION OF ALuMINIuM IN<br />
ANTARCTIC SuRFACE SEAwATER<br />
JULIETTE TRIA, PAUL R. HADDAD and PAVeL<br />
nESTEREnKO<br />
Australia Centre for Research on Separation Science<br />
(ACROSS), School of Chemistry, University of Tasmania,<br />
Private Bag 75, Hobart, Tasmania, Australia, 7001,<br />
jtria@utas.edu.au<br />
Introduction<br />
In oceanography, aluminium is used as a tracer to fingerprint<br />
the location and magnitude of atmospheric dust deposition.<br />
Aluminium is particularly suitable as a tracer because<br />
of its short residence time in surface seawater, its relatively<br />
simple seawater chemistry and the fact that primary input to<br />
the open ocean is by atmospheric deposition. The information<br />
supplied by surface aluminium concentrations is vitally<br />
important to understanding the role that aeolian deposition<br />
plays in supplying trace elements to the surface ocean and<br />
subsequent effects on biological processes. The information<br />
is especially important for furthering knowledge of the biogeochemistry<br />
of iron. Iron is of particular interest because<br />
it is an essential element for the growth and metabolism of<br />
all marine organisms despite only being available in extremely<br />
low concentrations (0.1–0.5 nM) 1 . Iron has been shown<br />
to limit phytoplankton growth, which in turn may have<br />
implications on global climate through drawdown of gases<br />
used in photosynthesis, such as carbon dioxide. An accurate<br />
and robust method for determining aluminium is thus<br />
vital for continuing studies into atmospheric deposition and<br />
subsequently climate control.<br />
Flow injection analysis (FIA), has typically been used<br />
for the quantification of aluminium in seawater, due to its<br />
portability for shipboard use, suitable limit of detection and<br />
relative ease of use. However, this technique still requires<br />
preconcentration of as much as 10 ml of seawater in order to<br />
achieve the required sensitivity 2 . Other common techniques<br />
for the determination of trace concentrations of aluminium,<br />
such as ICP-MS, are unsuitable for use at sea due to the size<br />
of the instrumentation as well as the amount of sample pretreatment<br />
required.<br />
Chromatographic techniques have become increasingly<br />
popular for the quantification of aluminium in recent years.<br />
Ion chromatography has successfully been used for the separation<br />
of aluminium in a selection of matrices including natural<br />
waters 3–6 and biological samples 7 . The technique is relatively<br />
simple and can be coupled with a variety of detection<br />
methods such as UV-VIS and mass spectrometry, allowing<br />
for both high selectivity and sensitivity.<br />
Chelation ion chromatography (CIC) offers an alternative<br />
to traditional ion-exchange IC, particularly for samples<br />
of high ionic strength. CIC functions by retaining metal ions<br />
s319<br />
according to the stability of the corresponding complexes and<br />
allows for the separation and preconcentration of aluminium<br />
in complex samples. In addition, CIC also offers the advantages<br />
of using only one type of material for both preconcentration/matrix<br />
elimination and separation and also the ability<br />
to acquire a simplified chromatogram identifying only kinetically-labile<br />
and chemically inert species 8,9 . Ion-exchange<br />
interactions are likely to occur simultaneously; however, high<br />
ionic strength eluents are typically used to ensure chelation is<br />
the dominant mechanism.<br />
The iminodiacetic acid functional group has been shown<br />
to be a highly promising ligand for the separation of metal<br />
ions by CIC 10 . Our previous work has shown the applicability<br />
of iminodiacetic acid functionalised silica (IDAS) to<br />
the determination of aluminium in paper mill process water 11 .<br />
This work detailed the optimised separation conditions of an<br />
IDAS packed column including eluent composition, flowrate<br />
and column temperature. Good separation in a complex<br />
matrix was achieved, with high column efficiency.<br />
The most commonly used method for the detection of<br />
aluminium at low concentrations is the highly sensitive fluorescent<br />
detection of its lumogallion complex. This approach<br />
has been applied successfully to the determination of aluminium<br />
in a wide range of samples, including those with a high<br />
salt content, e.g. saline water and body fluids. nishikawa<br />
and co-workers were the first to describe application of the<br />
technique to seawater and the batch method has since been<br />
incorporated into FIA systems 12 . The limit of detection for<br />
the technique has been improved through the addition of surfactants<br />
and through optimisation of conditions such as pH<br />
and temperature.<br />
This paper is a continuation of our work with IDAS but<br />
for the specific purpose of the direct determination of aluminium<br />
in seawater. The determination of Al in seawater poses<br />
a myriad of potential problems including sample matrix interferences<br />
and extremely low concentrations. We have developed<br />
a HPCIC method coupled with fluorescent detection of<br />
the aluminium-lumogallion complex. The system has been<br />
successfully applied to seawater samples obtained in the Ross<br />
Sea, Antarctica.<br />
Experimental<br />
A p p a r a t u s<br />
A Metrohm 844 UV/VIS Compact IC was used for all<br />
analyses. The system delivered the eluent at 0.3 ml min –1 and<br />
was set up with a post-column reactor, consisting of a 2 m<br />
PTFE reaction coil (1/16” × 0.02”). This reactor was immersed<br />
in a water bath for heating above room temperature. Peristaltic<br />
pump tubing delivered the PCR reagent at a constant<br />
flow-rate of 0.36 ml min –1 . A 20 µl sample loop was used<br />
unless specified.<br />
A column heater set to 71 °C housed a 200 × 4 mm i.d.<br />
column packed with 5 µm IDAS (JPP Chromatography Ltd,<br />
UK). Detection was carried out using a Varian Prostar 363<br />
fluorescence detector fitted with a xenon lamp. The excitation<br />
and emission wavelengths were set to 500 and 550 nm
Chem. Listy, 102, s265–s1311 (2008) Environmental Chemistry & Technology<br />
respectively. The detector and Compact IC were connected<br />
through a Metrohm 830 IC Interface.<br />
R e a g e n t s<br />
All reagents were of an analytical grade. A naCl-HnO 3<br />
eluent (unless otherwise indicated) was made from stock<br />
2M and 1M solutions respectively. All solutions were prepared<br />
from a Milli-Q Element purification system, (Millipore,<br />
north Ryde, nSW, Australia). A stock 1M MES<br />
(Sigma, Castle Hill, nSW, Australia) buffer was made and<br />
pH adjusted to 6.05 (unless otherwise stated) with concentrated<br />
naOH. A stock 2M nH 4 OAc buffer was prepared from<br />
trace metal grade concentrated acetic acid (GFS Chemicals,<br />
Powell, Ohio, USA) and ammonia solution (isopiestic distilled<br />
concentrated nH 4 OH) and pH adjusted to 6.8. A stock<br />
3mM lumogallion (Pfaltz and Bauer, Waterbury, CT, USA)<br />
solution was prepared and refrigerated in dark conditions for<br />
up to 2 months. Working lumogallion buffers were prepared<br />
daily as were aluminium standards.<br />
S a m p l e s<br />
Surface seawater was collected aboard the Research<br />
Vessel nathaniel B Palmer (USA) by means of a towed fish.<br />
Samples were collected at a depth of approximately 7 m<br />
using trace metal clean procedures. The seawater was filtered<br />
(0.25 µm) and acidified to pH 2 using trace metal clean HCl.<br />
Results<br />
S e p a r a t i o n C o n d i t i o n s<br />
Optimum operating conditions for the separation of aluminium<br />
in complex matrices using IDAS have previously<br />
been detailed elsewhere 11 . The only modification to these<br />
conditions was the use of naCl rather than KCl in the eluent.<br />
The reason for this was the availability of high grade chemical<br />
reagent in order to ensure low background fluorescence.<br />
In summary these conditions were a 0.25M naCl–40mM<br />
HnO 3 eluent delivered at 0.3 ml min –1 with separation on a<br />
200 × 4 mm i.d. column packed with 5 µm IDAS at 71 °C.<br />
B a c k g r o u n d F l u o r e s c e n c e<br />
A significant dip in fluorescence away from the baseline<br />
before the elution of aluminium was observed in preliminary<br />
experiments. This dip was up to one fifth the size of the peak<br />
of a 0.1 ppm aluminium standard. It was decided that the<br />
probable cause was high background fluorescence due to the<br />
reagents used to prepare the eluent, in particular the chloride<br />
salt. Initially, KCl was used for the preparation of the eluent<br />
and despite choosing an analytical grade KCl, the level of<br />
aluminium contamination was obviously high. A solution to<br />
this was the addition of a trap column positioned before the<br />
separation column. The column was packed with Eichrom<br />
Diphonix ® resin (particle size 100–200 mesh). This resin has<br />
diphosphonic and sulfonic acid groups bonded to a polystyrene/divinylbenzene<br />
matrix. It is capable of extraction of a<br />
range of metals from both neutral and highly acidic solutions.<br />
The column, measuring 250 × 4 mm i.d., effectively removed<br />
s320<br />
the majority of the aluminium from the eluent, reducing the<br />
dip by a factor of 25. In addition, trace metal grade sodium<br />
chloride and nitric acid were used in the eluent for subsequent<br />
experiments.<br />
O p t i m i s a t i o n o f L u m o g a l l i o n<br />
C h e m i s t r y<br />
buffer and ph<br />
Work by Howard and co-workers 13 previously reported<br />
the optimum pH of the aluminium-lumogallion reaction to<br />
be between 4 and 5.5. Resing and Measures later found the<br />
maximum response to be in a much narrower range between<br />
pH 5 and 5.5(ref. 12 ). Based on this fact, MES was chosen<br />
as the buffer for initial experiments given its pK a of 6.27 at<br />
25 °C and subsequent useful buffering range 14 . Although initial<br />
chromatograms of a 1 ppm aluminium standard, using a<br />
40mM MES solution at pH 6.2, were promising in terms of<br />
sensitivity and efficiency, the pH of the effluent was found<br />
to be only <strong>2.</strong>9. Increasing the MES concentration to 120mM<br />
served to improve this situation, but also resulted in an increase<br />
in baseline noise and reduction in both sensitivity and efficiency.<br />
Consequently, it was decided to continue investigations<br />
using ammonium acetate, a buffer extensively used for<br />
the aluminium-lumogallion reaction.<br />
Firstly, the effect of varying the concentration of the<br />
ammonium acetate buffer on sensitivity was observed. This<br />
was carried out by diluting a stock 3M buffer (pH 6.7) to<br />
0.25. 0.5 and 1 M. The results indicated that a concentration<br />
of 0.25 M gave the best result in terms of peak area and also<br />
for achieving an effluent pH closest to optimum for the lumogallion<br />
reaction. It was shown that peak area of a 0.1 ppm<br />
aluminium standard increased almost 1 times through the use<br />
of 0.25M compared with 1M ammonium acetate and over<br />
8 fold compared with 40mM MES.<br />
Seawater samples intended for quantification of aluminium<br />
require acidification to between pH 1.8–<strong>2.</strong> Consequently,<br />
the buffer utilised in the lumogallion reaction<br />
needs to be able to maintain an optimum pH even on mixing<br />
with the acidified sample. The 0.25M ammonium acetate buffer<br />
was shown to have insufficient buffering capacity when<br />
mixed with an acidified sample. not only did the retention<br />
time decrease but a loss in sensitivity also resulted. Given<br />
that a decrease in sensitivity was also previously observed<br />
with an increase in buffer concentration for ammonium acetate,<br />
the only alternative was to increase the pH of the buffer.<br />
This was attempted but it appeared that even increasing the<br />
buffer pH to 8 resulted in little improvement. This meant that<br />
short of sacrificing sensitivity for buffering capacity, ammonium<br />
acetate was not the best choice for the analysis of acidified<br />
seawater.<br />
The choice of buffers capable of maintaining a pH of<br />
approximately 5.5 is fairly limited. This led to the decision<br />
to reinvestigate MES. For comparative proposes, a 0.25M<br />
solution of MES (pH adjusted to 6.05 with naOH) was firstly<br />
trialed. The result was an equivalent sensitivity to ammonium<br />
acetate but with the added advantage of no loss in sensitivity
Chem. Listy, 102, s265–s1311 (2008) Environmental Chemistry & Technology<br />
between acidified and non-acidified samples. Similarly, changes<br />
in retention times were negligible. The remaining issue<br />
with the use of MES was the increase in baseline noise and<br />
subsequent increase in detection limits. This problem was<br />
overcome by pre-cleaning the buffer using a column packed<br />
with Eichrom Diphonix ® resin. The resulting baseline noise<br />
reduced approximately three times and the corresponding<br />
background fluorescence was almost seven times less.<br />
It was thus determined that a pre-cleaned buffer of<br />
0.25M MES adjusted to a pH of 6.05 with naOH, was the<br />
optimum choice for the determination of aluminium in acidified<br />
seawater samples.<br />
Temperature<br />
The response of the reaction between aluminium and<br />
lumogallion has been investigated in both batch techniques<br />
and flow systems. In the batch method, an optimal temperature<br />
of 80 °C is generally accepted 13,15 , whereas FIA methods<br />
tend to use 50 °C. The latter is based on investigations carried<br />
out by Resing and Measures which concluded that most of<br />
the temperature-based reaction rate gain had been achieved<br />
by this temperature 12 . Independent investigation into the effect<br />
of temperature on the rate of reaction was undertaken by<br />
us due to the fact a different buffer was used. It was found<br />
that the highest response, in terms of peak area, was obtained<br />
at temperatures between 65 and 75 °C (Fig. 1.). Based on this<br />
response, 70 °C was chosen as the temperature at which to<br />
operate the post column reactor for all subsequent anlyses.<br />
Fig. 1. Dependence of fluorescence response on temperature<br />
Lumogallion and Reaction Coil<br />
The extent of chemical reaction needs not be complete<br />
for an analytical technique to be valid. However, it is desirable<br />
to obtain as high a reaction yield as possible in order<br />
to ensure the technique has good precision. For the reaction<br />
between aluminium and lumogallion, the concentration of<br />
post-column reagent may be changed, along with temperature<br />
and reaction time, in order to control the extent of reaction.<br />
Three concentrations of lumogallion (0.03, 0.04 and<br />
s321<br />
0.05 mM) were tested in order to exhaust possible improvements<br />
to the system via this approach. The concentrations<br />
chosen were based on those used in flow systems. It was<br />
found that at concentrations higher than 0.03 mM, no significant<br />
improvements were achived. Additionally, the effect of<br />
increasing the length of the post column reaction coil from<br />
2m to 4m was also studied. The result, however, was a slight<br />
reduction in fluorescence. A MES buffer containing 0.03 mM<br />
lumogallion together with a 2m reaction coil were thus used<br />
in all subsequent analyses.<br />
Surfactant<br />
Howard and co-workers reported an increase in the fluorescence<br />
intensity of the aluminium-lumogallion complex<br />
of as much as 5-fold through the addition of a non-ionic<br />
surfactant 13 . Further investigation has been carried out by<br />
Resing and Measures 12 , which showed that Brij-35 enhanced<br />
fluorescence to a greater extent than other surfactants, such as<br />
Triton X-100 and cetylammonium bromide (CTAB). In order<br />
to ensure the lowest limit of detection was achieved for this<br />
system, an investigation into the effect of surfactants was also<br />
carried out. The results differed substantially from those discussed<br />
earlier. It was found that although the addition of Brij-<br />
35 enhanced fluorescence marginally, a simultaneous increase<br />
in baseline noise negated any improvement achieved.<br />
Interestingly, when CTAB was tested, the aluminium peak<br />
disappeared altogether. This was considered to be an effect<br />
of the surfactant adhering to the tubing walls and effectively<br />
stripping the aluminium from the reagent stream. The system<br />
required flushing with methanol in order to resume normal<br />
operation. Consequently, further investigation into the<br />
possible use of surfactants was abandoned, with the decision<br />
to explore other approaches to lowering the detection limit<br />
being deemed more favourable.<br />
S a m p l e V o l u m e<br />
A more attractive approach for achieving a low LOD<br />
was increasing the sample loop volume. All previous experiments<br />
had been carried out using a volume of 20 µl. The<br />
response of the system to higher volumes was investigated<br />
and the results are depicted in Fig. <strong>2.</strong> It can be seen that for<br />
volumes between 20 and 500 µl, the system follows a linear<br />
response, as expected. It was also noteworthy that no reduction<br />
in column efficiency was experienced at higher volumes.<br />
The highest efficiency was achieved for a 100 µl sample<br />
loop, which was unexpected considering that band broadening<br />
is generally associated with increased sample size and<br />
is often responsible for an observed reduction in performance<br />
of the chromatographic column as injection volume is increased.<br />
Another unexpected result of increasing the sample<br />
volume was an increase in retention time. Generally, a decrease<br />
in retention time would be expected due to competition<br />
from other analytes for chelation sites, especially in such a<br />
complex matrix as seawater. This was shown not to be the<br />
case for IDAS and may be explained in terms of the forma-
Chem. Listy, 102, s265–s1311 (2008) Environmental Chemistry & Technology<br />
tion of negatively charged aluminium complexes in seawater<br />
(e.g. fluoro complexes) and the high ionic strength of the eluent.<br />
The effect of ionic strength has been reported to affect<br />
the retention of ions in chelation IC 8,16 . In an environment<br />
of sufficiently high ionic strength the repulsion between<br />
negatively charged aluminium species and the iminodiacetic<br />
acid functional groups may be reduced. This can result<br />
in a subsequent increase in retention time as observed in our<br />
studies. This response is actually considered favourable as it<br />
allows for additional stabilisation of the baseline between the<br />
minor dip in fluorescence and elution of the aluminium.<br />
Fig. <strong>2.</strong> Effect of increasing sample volume on column performance<br />
and fluorescence response<br />
S e a w a t e r S a m p l e s<br />
At this stage, the optimised HPCIC system coupled with<br />
fluorescence detection had been shown to be applicable to the<br />
determination of aluminium in acidified standards prepared<br />
in Milli-Q water. Previous work by us has shown that IDAS<br />
can be successfully applied to the analysis of samples with a<br />
complex matrix but it had not yet been used for the detection<br />
of aluminium in seawater. Seawater is difficult to analyse not<br />
only in terms of the high salt content, but also due to the<br />
number of other potentially interfering ions, such as iron and<br />
magnesium. However, preliminary chromatograms showed<br />
no co-elution problems and there was only one additional<br />
peak (at ~ 8 min) other than aluminium. Based on previous<br />
findings this peak is likely to be due to iron and/or a mixture<br />
other analytes e.g. sodium and calcium.<br />
Calibration of the system using a 500 µl sample loop<br />
was carried out by means of standard addition to an Antarctic<br />
seawater sample containing low levels of aluminium. The<br />
limit of detection was determined from the standard deviation<br />
of clean seawater and determining the signal equivalent to<br />
three times this value (i.e. 3σ). A LOD of 0.39 nM was achieved<br />
using a 500 µl sample loop. Good linearity of the system<br />
was observed between 1.8 and 36 nM.<br />
Chromatograms of Antarctic seawater for different injection<br />
volumes are given in Fig. 3.<br />
s322<br />
Fig. 3. Chromatogram of Antarctic seawater for different injection<br />
volumes<br />
Conclusions<br />
The optimised HPCIC system with fluorescence detection<br />
of the aluminium-lumogallion complex shows<br />
promise for the quantification of aluminium in Antarctic<br />
seawater. The IDAS chromatographic column does not suffer<br />
from issues such as co-elution of species with aluminium and<br />
produces peaks of good efficiency in a reasonable timescale.<br />
The response of the system to standard addition is linear and<br />
is applicable over a concentration range valid to seawater<br />
analysis. Additionally, the LOD achievable with the system<br />
means it should be capable of handling the low concentrations<br />
of aluminium expected in Antarctic seawater.<br />
At this stage, the system has not been successfully<br />
applied to the quantification of aluminium in a seawater<br />
sample. The method currently suffers from an enhanced<br />
fluorescent response most likely due to matix interferences<br />
of seawater. It is difficult to determine the extent of this<br />
enhancement since there is not a certified seawater reference<br />
material for aluminium; but it is believed that, at present, the<br />
system produces a response approximately three times higher<br />
than the true value. Studies are underway to eliminate<br />
this problem and are currently focusing on the removal or<br />
adequate separation of aluminium from the remainder of the<br />
seawater matrix.<br />
REFEREnCES<br />
1. Johnson K. S., Gordon R. M., Coale K. H.: Mar. Chem.<br />
57, 137 (1997).<br />
<strong>2.</strong> Brown M. T., Bruland K. W.: Limnol. Oceanogr.:<br />
Methods. 6, 87 (2008).<br />
3. Drabek O., Mladkova L., Boruvka L., Szakova J.,<br />
nikodem A., nemecek K.: J. Inorg. Biochem. 99, 1788<br />
(2005).<br />
4. Mitrovic B., Milacic R., Pihlar B., Simoncic P.: Analusis.<br />
26, 381 (1998).<br />
5. Fairman B., Sanz-Medel A., Jones P., Evans E. H.: Analyst.<br />
123, 699 (1998).
Chem. Listy, 102, s265–s1311 (2008) Environmental Chemistry & Technology<br />
6. Kozuh n., Milacic R., Gorenc B., Abollino O., Sarzanini<br />
C.: Int. J. Enviro. Anal. Chem. 67, 27 (1997).<br />
7. Lian H. Z., Kang Y. F., Bi S. P., Yasin A., Shao D. L.,<br />
Chen Y. J., Dai L. M., Tian L. C.: Anal. Bioanal. Chem.<br />
376, 542 (2003).<br />
8. Jones P., nesterenko P. n.: J. Chrom. A. 789, 413<br />
(1997).<br />
9. nesterenko P. n., Jones P.: J. Sep. Sci. 30, 1773 (2007).<br />
10. nesterenko P. n., Shpigun O. A.: Russ. J. Coord. Chem.<br />
28, 726 (2002).<br />
11. Tria J., Butler E. C. V., Haddad P. R., Bowie A. R.: Anal.<br />
Chim. Acta. 588, 153 (2007).<br />
s323<br />
1<strong>2.</strong> Resing J. A., Measures C.I.: Anal. Chem. 66, 4105<br />
(1994).<br />
13. Howard A. G., Coxhead A. J., Potter I. A., Watt A. P.:<br />
Analyst. 111, 1379 (1986).<br />
14. Martell A. E., Smith R. M.: nIST Critically selected<br />
stability constants of metal complexes database. Version<br />
8.0. Texas A & M University, Texas 1998.<br />
15. Hydes D. J., Liss P. S.: Analyst. 101, 922 (1976).<br />
16. Saldadze K. M., Kopylova-Valova V. D.: Kompleksoobrazyushie<br />
Ionity (Complexing Ion Exchangers). Khimiya,<br />
Moscow 1980.
Chem. Listy, 102, s265–s1311 (2008) Environmental Chemistry & Technology<br />
L12 DIRECT ANALySIS IN REAL TIME – TIME-<br />
OF-FLIGhT MASS SPECTROMETRy:<br />
ANALySIS OF PESTICIDE RESIDuES AND<br />
<strong>ENVIRONMENTAL</strong> CONTAMINANTS<br />
LUKአVáCLAVíK, JAKUB SCHůREK, TOMáŠ<br />
ČAJKA and JAnA HAJŠLOVá<br />
Department of Food Chemistry and Analysis, Institute of<br />
Chemical Technology Prague, Technicka 5,166 28 Prague 6<br />
– Dejvice, Czech Republic,<br />
lukas.vaclavik@vscht.cz<br />
Introduction<br />
Ambient desorption ionization mass spectrometry (MS)<br />
is a rapidly growing area representing an attractive alternative<br />
to conventional analytic approaches. Recently introduced<br />
ionization techniques, such as direct analysis in real<br />
time (DART) 1 , desorption electrospray ionization (DESI) 2 or<br />
atmospheric pressure solids analysis probe (ASAP) 3 , allow<br />
direct examination of various types of samples in the open<br />
atmosphere and at ground potential. Little or no sample treatment<br />
prior to analysis is required. Additionally, time-consuming<br />
separation of sample components, which is usually<br />
employed by chromatographic methods, can be omitted with<br />
ambient MS. 4<br />
The ionization process with DART is based on interactions<br />
of metastable atoms of gas with atmosphere (H 2 O, O 2 )<br />
and sample components. The gas (usually helium) flows through<br />
a tube divided into several compartments. In a discharge<br />
chamber, ions, electrons and metastables are formed. In the<br />
next step, charged species are removed from the gas stream<br />
and heated gas promotes the desorption process. Ionization<br />
of the sample occurs in the area between the ion source and a<br />
mass spectrometer inlet (sampling gap). DART provides relatively<br />
simple mass spectra characterized mainly by [M + H] +<br />
and [M] + in positive-ion mode or [M – H] – and [M] – in negative-ion<br />
mode. 1 It is worth to notice, that DART technique<br />
has common features with atmospheric pressure chemical<br />
ionization (APCI) as the formation of metastables take place<br />
in an electrical discharge. 1,4<br />
DART ion source can be hyphenated to any type of mass<br />
spectrometer. However, when coupled to a high-resolution<br />
time-of-flight mass spectrometer (TOFMS), accurate mass<br />
measurement is enabled, allowing the confirmation of target<br />
analyte identity and calculations of elemental compositions<br />
of “unknowns”. For correct identification of “unknowns”, it<br />
is essential to gain knowledge about the examined matrix to<br />
allow discrimination of potential compounds suggested by<br />
the software.<br />
Until now, very few papers dealing with applications of<br />
DART have been published. 5-9 In following examples, the<br />
potential of DART–TOFMS technique for qualitative and<br />
quantitative analysis of (i) pesticide residues, in particular<br />
case, strobilurins in wheat grains, (ii) thiabendazole on cutflower<br />
leaves, and (iii) rapid screening of brominated flame<br />
s324<br />
retardants (BFRs) in in-door dust extract, will be demonstrated.<br />
Experimental<br />
C h e m i c a l s<br />
Pesticide standards (≥ 99 %) were obtained from Dr.<br />
Ehrenstorfer (Germany), decabromodiphenyl ether (BDE-<br />
209) standard (≥ 98 %) was provided by Cambridge Isotope<br />
Laboratories (USA). Solvents used for sample extractions<br />
and preparations of standard solutions were HPLC-grade.<br />
Poly(ethylene glycol) 600 was from Sigma-Aldrich (Germany),<br />
anhydrous na 2 SO 4 was supplied by Merck (Germany).<br />
S a m p l e P r e p a r a t i o n<br />
(i) An amount of 1<strong>2.</strong>5 g of milled wheat grains was<br />
spiked with an internal standard (prochloraz) at a concentration<br />
of 250 ng g –1 and extracted by shaking with 50 ml of<br />
ethyl acetate and 10 g of anhydrous na 2 SO 4 . The suspension<br />
was filtered and the volume was reduced by evaporation to<br />
25 ml. Similarly, wheat grain extracts spiked with strobilurins<br />
(azoxystrobin, kresoxim methyl, pyraclostrobin, trifloxystrobin,<br />
dimoxystrobin and picoxystrobin) in the range from 12<br />
to 1200 ng g –1 were prepared. Wheat grains with incurred<br />
residues of azoxystrobin, kresoxim methyl and pyraclostrobin<br />
(reference material) were processed as described above.<br />
(ii) Flowers (roses) were purchased from local florists<br />
shop. The leaf was separated from the rest of flower and its<br />
surface was directly analyzed.<br />
(iii) In-door dust containing BFRs (mainly BDE-209)<br />
was extracted using ASE 300 pressurized liquid extraction<br />
system (Dionex, USA): a hexane–acetone (1 : 1, v/v) mixture<br />
was used for extraction. The residues of extract were dissolved<br />
in isooctane.<br />
D A R T – T O F M S A n a l y s i s<br />
For DART–TOFMS analyses, the system consisting of<br />
a DART ion source (IonSense, USA), a JEOL AccuTOF LP<br />
high-resolution mass spectrometer [JEOL (Europe) SAS,<br />
France], and an AutoDART HTC PAL autosampler (Leap<br />
Technologies, USA) was used. Helium gas was flowed at<br />
<strong>2.</strong>9 dm 3 min –1 , discharge needle voltage was ± 3000 V, while<br />
perforated and grid electrode voltages were set to ± 150 V<br />
and ± 250 V, for positive and negative-ion mode, respectively.<br />
Other system parameter settings were changed depending<br />
on examined analytes, as summarized in Table I. To<br />
monitor bromine fragment ions originated from BDE-209,<br />
the cone voltage of the mass spectrometer was adjusted as<br />
described in results section.<br />
Automated introduction of liquid samples was carried<br />
out with the use of Dip-it tips (IonSense, USA). Solid samples<br />
(flower leaves) were introduced manually by placing<br />
them in front of DART source. Poly(ethylene glycol) 600<br />
solution (200 μg ml –1 ) was introduced at the end of each<br />
sample analysis to perform internal mass calibration (mass<br />
drift compensation). The mass resolution of the instrument
Chem. Listy, 102, s265–s1311 (2008) Environmental Chemistry & Technology<br />
Table I<br />
DART–TOFMS parameter settings<br />
Analytes Polarity<br />
Beam Ion guide<br />
temp. [°C] voltage [V]<br />
Strobilurins Positive 300 1000<br />
Thiabendazole Positive 150 800<br />
BDE-209 negative 300 600<br />
Bromine ions negative 350 400<br />
during the measurements was typically 6,000 full width at<br />
half maximum (fwhm).<br />
Results<br />
A n a l y s i s o f S t r o b i l u r i n s<br />
The strobilurins and prochloraz (internal standard) were<br />
detected as [M + H] + ions (see Fig. 1.). A high mass resolving<br />
power of TOFMS instrument enabled the identity confirmation<br />
of target analytes on the basis of elemental composition<br />
calculations; the differences between measured (accurate) and<br />
calculated (exact) masses ranged from –<strong>2.</strong>27 to 5.10 ppm.<br />
Fig. <strong>2.</strong> shows the total ion current (TIC) record of six<br />
injections of wheat grain extract spiked with strobilurins<br />
(240 ng g –1 ) and prochloraz (250 ng g –1 ). Unfortunately, the<br />
Fig. 1. Dart positive mass spectrum of wheat grain extract<br />
spiked with strobilurins (240 ng g –1 ) and prochloraz (250 ng g –1 );<br />
(1) Kresoxim methyl, (2) Dimoxystrobin, (3) Picoxystrobin, (4)<br />
Prochloraz, (5) Pyraclostrobin, (6) Azoxystrobin, (7) Trifloxystrobin<br />
Fig. 2 TIC chromatogram of six repeated wheat grain extract<br />
introductions [(1)–(6)] followed by PEG 600 solution (7)<br />
s325<br />
Fig. 3. Examples of calibration curves of matrix-matched strobilurin<br />
standards<br />
absolute response of the detector, even when employing<br />
autosampler, was poorly repeatable because of the dependence<br />
of position of the sampling tip and the sampling gap.<br />
Therefore, an internal standard had to be used for quantification<br />
of strobilurin residues. Calibration plots obtained by<br />
analyses of matrix-matched standards (see Fig. 3.) were constructed<br />
by plotting the ratio of analyte/internal standard ion<br />
intensity vs. concentration of particular analyte. Acceptable<br />
linearity was obtained for tested concentration range, regression<br />
coefficients of calibration curves were higher than 0.99.<br />
In the next step, basic performance characteristics of the<br />
method were estimated using spiked samples. The repeatability<br />
was in the range from 8 to 15 % (n = 6, 60 ng g –1 ), LOQs<br />
(limits of quantification) ranged from 12 to 30 ng g –1 . Considering<br />
the European regulation requirements, this method<br />
can be useful for rapid control of strobilurin residues in wheat<br />
grains 10 . For comparative purposes, wheat grain sample containing<br />
incurred residues of strobilurins was analyzed using<br />
Table II<br />
DART–TOFMS and LC–MS/MS methods: Analysis of incurred<br />
residues in wheat grains<br />
Analyte Concentration[ng g–1 ]<br />
DART–TOFMS LC–MS/MS<br />
Azoxystrobin 445 429<br />
Kresoxim methyl 45 52<br />
Pyraclostrobin 202 190
Chem. Listy, 102, s265–s1311 (2008) Environmental Chemistry & Technology<br />
in-house validated method employing liquid chromatography–tandem<br />
mass spectrometry (LC–MS/MS). A good agreement<br />
of the results generated by two alternative approaches is<br />
documented in Table II.<br />
D i r e c t D e t e c t i o n o f T h i a b e n d a z o l e<br />
i n P l a n t L e a f<br />
In this experiment, the possibility to monitor pesticide<br />
residues directly from the surface of the flower leaf was examined.<br />
For this purpose, the temperature of gas beam was<br />
decreased to 150 °C. Fig. 4.(A) shows positive mass spectrum<br />
of the leaf surface obtained by DART–TOFMS. In zoomed<br />
mass spectrum (Fig. 4.(B)), ion m/z 20<strong>2.</strong>04410 corresponding<br />
to protonated thiabendazole molecule [C 10 H 8 n 3 S] + (theoretical<br />
mass m/z 20<strong>2.</strong>04389) was observed. no other pesticide<br />
compounds were detected in examined sample.<br />
Fig. 4. DART positive mass spectrum of flower leaf; (A) m/z<br />
50–600, (b) m/z 200–206. The ion m/z 20<strong>2.</strong>04410 corresponds to<br />
thiabendazole<br />
S c r e e n i n g o f B F R s i n I n - D o o r D u s t<br />
The most common methods used in analysis of BFRs<br />
employ gas chromatography coupled to mass spectrometry<br />
(GC–MS) operated in negative chemical ionization mode<br />
(nCI) 11 . The ions [ 79 Br] – and [ 81 Br] – are typically the base<br />
peaks in nCI mass spectra of these compounds and due to<br />
their selectivity they are frequently used for quantification<br />
purposes 12 . Supposing some similarity of BFRs fragmentation<br />
under nCI conditions in GC–MS and negative APCI,<br />
Fig. 5. DART negative mass spectrum of bDE-209 standard<br />
solution (50 μg ml –1 ); (A) beam temp.: 300 °C, cone volt.: –20 V,<br />
(b) beam temp.: 350 °C, cone volt.: –140 V<br />
s326<br />
DART–TOFMS was proposed as a suitable approach for<br />
rapid screening of BFRs.<br />
In the first phase of this experiment, the ionization of<br />
BDE-209 by DART was investigated. As documented in<br />
Fig. 5.(A), phenolate anions resulting from the cleavage of<br />
the ether bridge and anions resulting from bromine abstraction<br />
were observed after introduction of BDE-209 standard<br />
solution. To induce fragmentation, the cone voltage was<br />
decreased from -20 V to -140 V. Under these conditions,<br />
intensive [ 79 Br] – and [ 81 Br] – ions were the only ions in recorded<br />
mass spectrum (Fig. 5.(B)).<br />
Fig. 6. DART negative mass spectrum of in-door dust extract;<br />
(A) cone volt.: –140 V, (b) cone volt.: –200 V, (C) cone volt.:–<br />
240 V<br />
While it was not possible to detect BFRs in dust extract<br />
due to high chemical noise, both bromine ions were distinctly<br />
recognized when fragmentation was induced (Fig. 6.(A)). To<br />
remove interfering ion with a mass close to [ 79 Br] – , an attempt<br />
to induce its fragmentation was undertaken. As shown in<br />
Fig. 6.(B) and Fig. 6.(C) this was achieved by further decrease<br />
of cone voltage value.<br />
Conclusions<br />
DART–TOFMS technique can be used for determination<br />
of strobilurin fungicides in milled wheat grain extracts<br />
obtained by simple extraction procedure without time-consuming<br />
chromatographic separation. This method withstands<br />
the regulation demands of the European Union for the control<br />
of pesticide residues; moreover, simplified workflow enables<br />
examination of many samples within a short time period.
Chem. Listy, 102, s265–s1311 (2008) Environmental Chemistry & Technology<br />
Qualitative analysis of solid samples without any sample<br />
preparation is a challenging application of this novel<br />
technique. DART–TOFMS was shown to be a useful tool<br />
enabling rapid examination of plant surface and detection of<br />
pesticide used for flower treatment.<br />
Preliminary results indicate the potential to introduce<br />
new concepts into rapid screening of BFRs by employing<br />
DART–TOFMS. In addition, the information provided by<br />
both negative and positive mass spectra should be exploited<br />
with the aim to detect the presence of other contaminants.<br />
Of course, more follow-up research is needed, with a special<br />
focus on quantification of target compounds and identification<br />
of unknowns.<br />
This study was undertaken within the project MSM<br />
6046137305 supported by the Ministry of Education, Youth<br />
and Sport of the Czech Republic. The authors wish to thank to<br />
JEOL (Europe) SAS for a loan of the JEOL AccuTOF DART<br />
system for testing purpose.<br />
REFEREnCES<br />
1. Cody R. B., Laramee J. A., Durst H. D.: Anal. Chem 77,<br />
2297 (2005).<br />
<strong>2.</strong> Takats Z, Wiseman J. M., Gologan B., Cooks R. G.:<br />
Science 306, 471 (2004).<br />
s327<br />
3. McEwen C. n., McKay R. G., Larsen B., S.: Anal.<br />
Chem. 77, 7826 (2005).<br />
4. Venter A., nefliu M., Cooks R. G.: Trends Anal. Chem.<br />
in press (2008).<br />
5. Williams J. P., Patel V. J., Holland R., Scrivens J. H.:<br />
Rapid Commun. Mass Spectrom. 20, 1447 (2006).<br />
6. Petucci C., Diffendal J., Kaufman D., Mekonnen B.,<br />
Terefenko G., Musselman B.: Anal. Chem. 79, 5064<br />
(2007).<br />
7. Haefliger O. P., Jeckelmann n.: Rapid Commun. Mass<br />
Spectrom. 21, 1361 (2007).<br />
8. Morlock G., Ueda Y.: J. Chromatogr. A 1143, 243<br />
(2007).<br />
9. Cajka T., Vaclavik L., Riddellova K., Hajslova J.: LC<br />
GC Eur. 21, 250 (2008).<br />
10. EC (European Communities), Council directive 97/57/<br />
EC establishing Annex VI to directive 91/414/EC concerning<br />
the placing of plant protection products on the<br />
market Off. J. Eur.Commun. L265 (1997).<br />
11. Xie Z., Ebinghaus R.: Anal. Chim. Acta 610, 156<br />
(2008).<br />
1<strong>2.</strong> Cajka T., Hajslova J., Kazda R., Poustka J.: J. Sep. Sci.<br />
28, 601 (2005).
Chem. Listy, 102, s265–s1311 (2008) Environmental Chemistry & Technology<br />
L13 APPLICATION OF NEEDLES AS<br />
bIOINDICATORS FOR ThE EVALuATION<br />
OF PERSISTENT ORGANIC POLLuTANTS<br />
<strong>ENVIRONMENTAL</strong> CONTAMINATION LEVEL<br />
M. VáVROVá a,b , R. LánA a , M. HROCH a , J.<br />
ČáSLAVSKý a , I. HLAVáČKOVá a and B. TREMLOVá b<br />
a Brno University of Technology, Faculty of Chemistry; Purkyňova<br />
118, 612 00 Brno, Czech Republic<br />
b University of Veterinary and Pharmaceutical Sciences Brno,<br />
Faculty of Veterinary Hygiene and Ecology,<br />
vavrova@fch.vutbr.cz<br />
Introduction<br />
Bioindicators are living organisms in which concentrations<br />
of organic pollutants considerably exceed those found<br />
in air, water, sediments, or soil. Bioindicators, which are<br />
frequently used in monitoring studies and screenings, should<br />
allow selective and specific determination of contaminants<br />
not only in all compartments of the environment, but also<br />
in all links of food chains of species living in the area under<br />
study. Contaminants detectable by the use of bioindicators<br />
include also PCB indicator congeners 28, 52, 101, 118, 138,<br />
153, 180 which rank with priority pollutants monitored in the<br />
Czech Republic 1 . Plant bioindicators are used in environmental<br />
studies of agrarian ecosystems in our country where they<br />
can yield information for both conventional monitoring and<br />
biomonitoring. The most frequently used plant species are<br />
alfalfa, cereals, and oil plants 2 . The source of contamination<br />
is of great importance. Monitoring of PCBs can often identify<br />
long-distance transport as one of the contamination sources.<br />
Airborne volatile PCBs can originate from various sources<br />
including agricultural production 3 . Thus, PCBs penetrate into<br />
plant tissues and influence the contamination level. Papers<br />
dealing with the contamination of crops by xenobiotics are<br />
rather scarce. Most of the respective investigations were carried<br />
out in fodder plants and were oriented rather on effects of<br />
feeding of contaminated crops to farm animals 1 .<br />
Of all above-mentioned plant bioindicators, coniferous<br />
plants except for larch have the greatest informative value<br />
when the leaf analysis method is used. needles do not fall<br />
off every year as compared to deciduous trees, and one may<br />
monitor a degree of burden using different methods such<br />
as the discoloration of assimilatory organs, sudden changes<br />
in coloration, excessive leaf-fall, crown thinning, partial or<br />
complete dieback of trees, and particularly the above-mentioned<br />
methods of leaf analysis.<br />
Knowledge of the level of contamination of this link of<br />
the food chain is therefore necessary for studies of xenobiotic<br />
transfer 1,4 . Comprehensive studies of plant contamination<br />
were completed in Moravian areas affected by disastrous floods<br />
in 1997 and 1998. Effects of floods on the contamination<br />
of soil and vegetation by persistent organic substances are<br />
summarized in the „Report on the 1998 Monitoring Results<br />
- Hazardous Substances within Food Chains and Influencing<br />
s328<br />
Imputes published by the Ministry of Agriculture of the<br />
Czech Republic in 1998 2 .<br />
Synthetic xenobiotics are included in persistent organic<br />
pollutants (POPs) group; they represented a significant risk to<br />
the environment owing to their physico-chemical and toxicological<br />
properties.<br />
PBDEs are aromatic substances whose structures resemble<br />
that of PCBs (see Fig. 1.).<br />
Fig. 1. PbDEs and PCbs<br />
The numbering of individual PBDE congeners, whose<br />
total sum is 209, complies with the IUPAC nomenclature<br />
used in the numbering of PCBs.<br />
P h y s i c o c h e m i c a l P r o p e r t i e s o f<br />
P B D E s<br />
Tri- (major congener 28), tetra- (47), penta- (99, 100),<br />
hexa- (153, 154), hepta- (183) and deka-(209) are the most<br />
commonly used PBDE groups which also occur most<br />
frequently in the environment.<br />
PBDEs are lipophilic and persistent substances that<br />
show low solubility in water. Because of their high resistance<br />
against acids, bases, heat, light, and redox reactions, they<br />
pose a significant risk to the environment. When they enter<br />
the environment, they remain there for a prolonged period<br />
of time due to their physical-chemical properties. The octanol/water<br />
partition coefficient (log K ow ) is another important<br />
characteristic of these compounds. The values of their log K ow<br />
vary in a range of 5.98 (28)–9.97 (209), which indicates that<br />
these substances are highly hydrophobic.<br />
Upon excessive heating and burning, PBDEs will<br />
decompose to very toxic substances such as polybrominated<br />
dibenzo-p-dioxins (PBDD) and dibenzofuranes (PBDF).<br />
The melting point of PBDEs varies from 64 °C (BDE 28) to<br />
30<strong>2.</strong>5 °C (BDE 209) whereas many congeners are liquids at<br />
standard conditions.<br />
PBDEs are used as fire retardants. In this application the<br />
ideal situation is when a retardant decomposes at a temperature<br />
by about 50 °C lower than that of a polymer – PBDEs<br />
meet this requirement with a number of polymers.<br />
P r o d u c t i o n<br />
The industrial synthesis of PBDEs usually proceeds through<br />
catalytic reaction between a diphenyl ether and bromine,<br />
yielding a mixture of different isomers. Alternatively,<br />
PBDE may also be prepared from phenolate and bromobenzene<br />
or by allowing diphenyliodonium salt to react with bromophenolate.
Chem. Listy, 102, s265–s1311 (2008) Environmental Chemistry & Technology<br />
novel synthetic procedures have been recently developed.<br />
One of the most significant developed procedures uses<br />
2,5-dibromo-4-fluoronitrobenzene as a precursor to produce<br />
congeners 153 and 154 or employs a modified Sinaki reaction<br />
to prepare congener 81.<br />
I n d u s t r i a l U s e o f P B D E s<br />
DekabDE<br />
This compound is extensively used in “high-impact”<br />
polystyrenes, thermoplastic polyester resins, acrylonitrilebutadiene-styrene<br />
rubber, nylon, PVC, and elastomers. BDE<br />
209 is also widely used in isolation materials for electric<br />
cables. There is a large number of commercial products based<br />
on BDE 209 such as widely used Bromkal 81, DE 83, FR-<br />
1210, Chemflam 011, Hexcel PF1.<br />
OktabDE<br />
OktaBDE congeners are mainly used in computer components<br />
and the components of office instruments. Furthermore,<br />
they are also known to be used in various thermoplastics,<br />
adhesives and coating compositions. Bromkal 79-8 DE,<br />
FR 143, Tardex 80, etc. are commercial names of widely used<br />
mixtures.<br />
HexabDE<br />
HexaBDE together with pentaBDE congeners are contained<br />
in commercial mixtures (for example BR 33 A).<br />
PentabDE<br />
Commercial mixtures are used as additives in epoxyresins,<br />
phenol resins, and textiles. This particularly applies to<br />
DE 71, FR 1205/1210, Bromkal 70, Bromkal 61. The Bromkal<br />
70-5 DE mixture (34 % tetraBDE, 60 % pentaBDE and<br />
6 % hexaBDE) was widely used in the past.<br />
TetrabDE<br />
TetraBDE congeners have identical applications as pen-<br />
Table I<br />
Polychlorinated biphenyls in needles<br />
s329<br />
taBDE. The average levels of congeners in the commercially<br />
used mixture are as follows: 41 % of tetraBDE congeners,<br />
45 % pentaBDE congeners, 6 % hexaBDE congeners, and<br />
about 8 % of PBDE of unknown structure. Some groups of<br />
BDEs are not produced individually but occur as impurities in<br />
commercial mixtures (for example nonaBDE or heptaBDE).<br />
The least brominated classes of congeners such as triBDE,<br />
diBDE, and monoBDE, are neither produced commercially,<br />
nor used otherwise.<br />
General use of bDEs<br />
More than one half of PBDEs is used in the production<br />
of electric and electronic devices and components, with<br />
DekaBDE, OktaBDE and PentaBDE being used most widely,<br />
as mentioned above. The highest levels of PBDEs occur<br />
in domestic appliances. The reason is that the devices of this<br />
kind (TV sets, vacuum cleaners) contain the highest portion<br />
of plastics, as compared to other above-mentioned classes of<br />
devices, with fire retardants being usually bound to such plastic<br />
materials.<br />
Experimental<br />
Samples were taken in several locations. Organochlorine<br />
pesticides (DDT and its metabolites, γ-HCH and HCB),<br />
polychlorobiphenyls (PCB) and polybromodiphenylethers<br />
(PBDE) were selected for analysis. The isolation of tracked<br />
analytes from plant matrices was performed by the means<br />
of extraction processes, namely via sonication and Soxhlet<br />
extraction, extract purification was realized by column<br />
chromatography. The final determination was performed by<br />
gas chromatography with μECD detection and the confirmation<br />
analyses by gas chromatography and mass spectrometric<br />
detection.The procedure is summarized in following<br />
Scheme 1.<br />
Concentration [ng g –1 ]<br />
CB 28 CB 52 CB 101 CB 118 CB 138 CB 153 CB 180<br />
Pine 0.25 0.10 0.07 0.06 0.06 0.07 –<br />
Fir 0.33 0.12 0.09 0.10 0.07 0.12 0.05<br />
Blue Spruce 0.30 0.09 0.07 0.08 0.10 0.09 0.04<br />
Table II<br />
Organochlorinated pesticides in needles<br />
Concentration [ng g –1 ]<br />
4,4’-DDT 4,4’-DDE 4,4’-DDD 2,4’-DDT 2,4’-DDE 2,4’-DDD γ-HCH HCB<br />
Pine 0.08 0.17 < LOQ < LOQ nD nD 0.15 0.15<br />
Fir 0.21 0.24 0.07 0.14 < LOQ nD 0.12 0.09<br />
Blue Spruce 0.11 0.11 0.04 0.11 nD nD 0.13 < LOQ
Chem. Listy, 102, s265–s1311 (2008) Environmental Chemistry & Technology<br />
Table III<br />
Polybrominated diphenyl ethers in needles<br />
Concentration [ng g –1 ]<br />
BDE 3 BDE 15 BDE 28 BDE 47 BDE 99 BDE 100 BDE 118 BDE 153 BDE 154 BDE 183<br />
Pine 0.80 0.40 4.50 1.50 nD < LOQ 1.20 1.00 1.60 1.70<br />
Fir 1.30 nD <strong>2.</strong>20 < LOQ 0.70 nD nD < LOQ nD nD<br />
Blue Spruce 0.50 nD 1.80 1.40 <strong>2.</strong>50 1.20 0.80 0.80 <strong>2.</strong>10 < LOQ<br />
Collecting needles<br />
(10 g each sample)<br />
↓<br />
Grounding/extraction<br />
3 × 20 min. with n-hexane-acetone (3 : 2)<br />
↓<br />
Clean-up on Florisil column<br />
elution with n-hexane-acetone (94 : 6)<br />
↓<br />
GC/μECD analysis of extracts<br />
Scheme 1<br />
Results<br />
The study submitted deals with problems of the utilization<br />
of spruce, pine and fir needles for the evaluation of<br />
ecosystems’ primary organic pollutants (POPs) load.<br />
Tables I, II and III show the obtained results – concentrations<br />
of polychlorinated biphenyls, organochlorinated<br />
pesticides and polybrominated diphenyl ethers in needles,<br />
respectively.<br />
On the basis of acquired results, it could be stated that<br />
level of needles contamination is not negligible. Within the<br />
group of PCBs the highest concentrations were found at PCB<br />
28 with highest volatility. Pesticide 4,4’-DDT and 4,4’- DDE,<br />
γ-HCH and HCB were dominant from study groups of organochlorinated<br />
compounds. It was surprise that PBDE levels<br />
were considerably higher than those of other POPs, especially<br />
BDE 28.<br />
s330<br />
Conclusions<br />
needles of pine, fir and blue spruce were used as bioindicators<br />
of the atmospheric contamination by persistent<br />
organic pollutants. These needles are covered by waxy layer,<br />
which effectively concentrates the vapour phase pollutants<br />
from surrounding atmosphere. The results proved the suitability<br />
of the conifera needles for the estimation of atmospheric<br />
contamination by persistent organic pollutants.<br />
This work has been supported by Ministry of Education,<br />
Youth and Sports under MSM 6215712402 is greatly appreciated).<br />
REFEREnCES<br />
1. Zima S., Vávrová M.: Project Monitoring of Food<br />
Chains (transfer study “Feeding – snímal”). Veterinary<br />
and Pharmaceutical University Brno, 65 p. (1994) (in<br />
Czech).<br />
<strong>2.</strong> Ministry of Agriculture of the Czech Republic. Report<br />
on the 1998 monitoring results – hazardous substances<br />
within food chains and influencing inputs, Praha 1999,<br />
47 pp. (1999).<br />
3. Oehme M., Haugen J. E., Schlabach M.: Environmental<br />
Science and Technology, 30, 2294 (1996).<br />
4. Samuillah Z.: Global environment monitoring system.<br />
Biological monitoring of environmental contaminants.<br />
University of London, Technical report (1990).
Chem. Listy, 102, s265–s1311 (2008) Environmental Chemistry & Technology<br />
<strong>2.</strong><strong>2.</strong> Posters<br />
P01 uLTRATRACE DETERMINATION OF<br />
SILVER IN PRECONCENTRATED wATER<br />
SAMPLES by ELECTROThERMAL ATOMIC<br />
AbSORPTION SPECTROMETRy<br />
SEYED HAMID AHMADIa , JAVAD DIDEHVAR ASLa ,<br />
MOHAMMAD HASAn AMInIa and ROYA BAHADORIb aChemistry & Chemical Engineering Research Center of Iran<br />
P.O. Box 14335-186, Tehran, Iran,<br />
bResearch Center for Conservation of Cultural Relics,<br />
Tehran, Iran,<br />
ahmadi@ccerci.ac.ir<br />
Introduction<br />
Silver is one of the industrially important elements. It is<br />
used for the preparation of corrosion-resistance alloys and its<br />
compounds are extensively used in the processing of foods,<br />
drugs and beverages and in filters and other equipments to<br />
purify water. It also has an important role in electrical and<br />
electronic application, photographic film production and the<br />
manufacturing of fungicides 1,2 . These widespread applications<br />
have resulted in increased silver content of environmental<br />
water samples. In turns, owing to the toxicity of silver to<br />
many aquatic organisms even at low concentrations, the serious<br />
environmental problems may occur. Therefore, simple<br />
and highly sensitive methods are needed to monitor the Ag<br />
levels in water samples at ever decreasing concentrations.<br />
Several atomic spectrometric techniques such as flame<br />
and electrothermal atomic absorption spectrometry (FAAS<br />
and ETAAS) 3,4 , inductively coupled plasma atomic emission<br />
spectrometry (ICP-AES) 5 and inductively coupled plasma<br />
mass spectrometry (ICP-MS) 6 have been proposed for the<br />
determination of silver in different environmental samples.<br />
In order to improve the detection limit, various preconcentration<br />
procedures have also been used in combination with the<br />
above-mentioned techniques. These include solvent extraction<br />
7 , solid phase extraction 8 , precipitation 9 , adsorption on<br />
tungsten wire 10 and cloud point extraction 11 . However, most<br />
of these procedures are laborious, time-consuming and may<br />
cause sample contamination.<br />
Recently, Assadi and co-workers introduced a novel<br />
microextraction method called dispersive liquid–liquid microextraction<br />
(DLLME) as a highly sensitive, efficient and<br />
powerful method for the pre-concentration and determination<br />
of traces of organic and inorganic compounds in water<br />
samples 12,13 . In the present work, the DLLME was combined<br />
with ETAAS for determination of silver for the first time. In<br />
this method, an appropriate mixture of extraction solvent and<br />
disperser solvent is injected rapidly into an aqueous sample<br />
containing silver ions and sodium diethyldithiocarbamate<br />
(DDTC) by a syringe. Then, the resulting cloudy solution<br />
is centrifuged and the fine droplets sedimented in a fewμl<br />
volume at the bottom of the conical test tube are finally<br />
introduced into the ETAAS for the determination of its silver<br />
s331<br />
content. The applicability of this approach was validated for<br />
the determination of silver in water samples. The proposed<br />
method was also applied to the determination of silver in<br />
several water samples with satisfactory results.<br />
Experimental<br />
R e a g e n t s a n d S o l u t i o n s<br />
Reagent grade carbon disulfide, carbon tetrachloride and<br />
chloroform, as extraction solvents, and acetone, acetonitrile,<br />
methanol and ethanol as disperser solvents from Merck chemical<br />
company. Doubly distilled deionized water was used<br />
throughout. Analytical grade nitrate salts of silver and other<br />
cations (all from Merck) were of the highest purity available<br />
and used without any further purification except for vacuum<br />
drying. The stock solution of silver (1,000 mg dm −3 for atomic<br />
spectroscopy standard) was prepaed by dissolving 0.1575 g<br />
of silver nitrate (Merck) in deionized water containing 1 ml<br />
concentrated nitric acid (Merck) in a 100 mlvolumetric flask<br />
and diluting to mark with deionized water and stored in the<br />
dark. Working standard solutions were prepared by serial<br />
dilutions of the stock solution with ultrapure water prior to<br />
analysis. The chelating agent, 0.001M sodium diethyldithiocarbamate<br />
(DDTC) solution was prepared daily by dissolving<br />
the appropriate amount of DDTC (analytical grade, Merck)<br />
in methanol (suprasolv, Merck).<br />
Tap, underground and river water samples used for<br />
development of the method were collected in PTFE containers<br />
from the Tehran and added appreciated amount of HnO 3<br />
to adjust pH 3 and stored in dark at 4 °C and analyzed within<br />
48 h of collection without previous treatment or filtration.<br />
I n s t r u m e n t a t i o n<br />
The experiments were performed using a Perkin Elmer<br />
atomic absorption spectrometer (AA 1100B), equipped with a<br />
graphite furnace atomizer HGA-700. Deuterium background<br />
correction was employed to correct non-specific absorbances.<br />
All measurements were performed using the peak height.<br />
An Intensitron silver hollow cathode lamp and a pyrolytic<br />
coated graphite tube (Perkin Elmer) were used. The sample<br />
injection volume was 10 μl in all experiments. The instrumental<br />
parameters and temperature program for the graphite<br />
atomizer are listed in Table I. Argon gas with 99.95% purity<br />
was purchased from Roham Gas Co. (Tehran, Iran) was used<br />
as protected and purge gas. A Kendro 1020D centrifuge (Germany)<br />
was used for centrifugation. All 15-ml screw cap falcon<br />
test tubes with conical bottom (extraction vessel) were<br />
maintained into 0.1 mol dm −3 HnO 3 for cleaning of any inorganic<br />
compounds and washed with doubly deionized water<br />
and then with acetone for proper sedimentation of fine droplets<br />
of the extraction solvent in the centrifuging step.<br />
G e n e r a l P r o c e d u r e<br />
A 10.0 ml of aqueous solution contaning 0.2 ppm Ag and<br />
0.01mM DDTC was placed in a 15 ml screw cap falcon test<br />
tube with conic bottom. 0.8 ml methanol, as disperser solvent,<br />
containing 60 μl carbon tetrachloride, as extraction sol-
Chem. Listy, 102, s265–s1311 (2008) Environmental Chemistry & Technology<br />
vent, was injected rapidly into the sample solution by using a<br />
proper Hamilton syringe and the mixture was gently shaken.<br />
A cloudy solution (water/methanol/carbon tetrachloride) was<br />
formed in the test tube, Ag-DDTC complex is extracted into<br />
the fine droplets of carbon tetrachloride. The mixture was<br />
then centrifuged for 3 min at 3,500 rpm. After this process,<br />
the dispersed fine droplets of carbon tetrachloride were sedimented<br />
at the bottom of test tube (25 ± 1 μl). Finally, 10 μl<br />
of 0.05% Pd(nO 3 ) 2 , as chemical modifier, followed by 10 μl<br />
of the sedimented phase were consecutively pipetted into<br />
the same auto-sampler device and the content was injected<br />
into the graphite tube and the silver content is determined by<br />
electrothermal atomic absorption spectrometry<br />
Results<br />
S t u d y o f t h e E T A A S C o n d i t i o n s<br />
In order to reduce interferences and increase the accuracy,<br />
the use of a chemical modifier or a modifier mixture has<br />
become indispensable in ETAAS measurements. In the present<br />
work, we used Pd(nO 3 ) 2 as a chemical modifier. When<br />
the palladium modifier was not added, the analytical signal<br />
was gradually decreased until 50 % of the initial signal. The<br />
influence of the palladium modifier on the background level<br />
was also important. Based on the experimental results, addition<br />
of 0.05% (w/v) Pd(nO 3 ) 2 solution allowed increasing<br />
the analytical signal with considerable background reduction,<br />
without increasing the pyrolysis temperature. Because for<br />
portions larger than 10 μl the signals were not further improved,<br />
the palladium modifier injection volume was chosen as<br />
10 μl.<br />
The selection of an appropriate pyrolysis temperature is<br />
very important for removing as much the matrix as possible<br />
and preventing the pyrolysis loss of the analytes prior to atomization.<br />
The influence of pyrolysis temperature was studied<br />
on the absorbance, in the range of 300–1,100 °C. The maximum<br />
absorbance was achieved in the range of 300–450 °C<br />
in the presence of chemical modifier. However, when the<br />
pyrolysis temperature was over 500 °C, the signal of analyte<br />
decreased rapidly with the increase of the pyrolysis temperature.<br />
Therefore, 450 °C was selected as the optimized pyrolysis<br />
temperature for the determination of silver.<br />
In the selected pyrolysis temperature of 450 °C, the effect<br />
of pyrolysis time on the absorbance of Ag was investigated.<br />
The results showed that the absorbance was increased when<br />
the pyrolysis time was changing from 10 to 40 s and no<br />
appreciable improvements were observed for longer times.<br />
As a result, a pyrolysis time of 40 s was chosen.<br />
Using a pyrolysis temperature of 450 °C and pyrolysis<br />
time of 40 s, the effect of the atomization temperature, in<br />
the range of 1,000–1,500 °C, on analytical signal of Ag was<br />
also studied, The maximum signal . in the presence of chemical<br />
modifier was obtained at about 1,200 °C and remained<br />
unchanged with the further increasing of temperature up to<br />
1,500 °C. So, the atomization temperature of 1,300 °C was<br />
selected for the further experiments. The experimental results<br />
show that atomization time has little effect on the atomic sig-<br />
s332<br />
nal of Ag. Therefore, an atomization time of 3 s was selected.<br />
The unusual low pyrolysis and atomization temperatures<br />
used in this work is probably due to the fact that the components<br />
used in the dllme procedure are reducing the thermal<br />
stability of Ag.<br />
Table I<br />
The graphite furnace temperature program for silver determination<br />
Step<br />
Temperature Ramp Hold Argon<br />
flow rate<br />
[°C] time [s] time [s]<br />
[ml min−1 ]<br />
Drying 100 1 20 250<br />
Pyrolysis 400 5 30 250<br />
Atomization 1,400 0 3 0<br />
Cleaning 1,800 0 2 1,000<br />
E f f e c t o f T y p e a n d V o l u m e o f t h e<br />
E x t r a c t i o n S o l v e n t<br />
Careful attention should be paid to the selection of the<br />
extraction solvent. It should have higher density rather than<br />
water, extraction capability of the interested compounds and<br />
low solubility in water. Chloroform, carbon tetrachloride and<br />
carbon disulfide were compared in the extraction of silver. A<br />
series of sample solution were studied by using 500 μl methanol<br />
containing different volumes of the extraction solvent to<br />
achieve 25 μl volume of the sedimented phase. The solubility<br />
of the extraction solvents in water is different. Therefore to<br />
recover 25 μl volume of the sedimented phase at the bottom<br />
of the test tube, it is necessary to add an excess to account<br />
for this solubility. Thereby, 75, 50 and 60 μl of chloroform,<br />
carbon disulfide and carbon tetrachloride were used, respectively.<br />
In this experiment chloroform, carbon disulfide and carbon<br />
tetrachloride as extraction solvents obtained enrichment<br />
factors of 12<strong>2.</strong>9 ± 9.4, 119.1 ± 10.5 and 127.7 ± 6.7, respectively.<br />
According to these results, variations of the enrichment<br />
factors using different extraction solvents are not statistically<br />
significantly different. Carbon tetrachloride forms a well<br />
stable cloudy solution, its sedimented phase can easily be<br />
removed by sampler to be introduced into the graphite furnace<br />
and has less consumption volume, while chloroform forms an<br />
unstable cloudy solution and carbon disulfide is difficult to be<br />
removed by sampler. Therefore, carbon tetrachloride was the<br />
best to be used.<br />
To examine the effect of the extraction solvent volume,<br />
solutions containing different volumes of carbon tetrachloride<br />
were subjected to the same DLLME procedures. The experimental<br />
conditions were fixed and include the use of 500 μl<br />
methanol different volumes of carbon tetrachloride (40, 50,<br />
60, 70 and 80 μl). By increasing the volume of carbon tetrachloride<br />
from 40 to 80 μl, the volume of the sedimented phase<br />
increases from 20 to 50 μl. Enrichment factor decreases with<br />
increasing the volume of carbon tetrachloride, because of the<br />
volume of the sedimented phase increases. Subsequently, at
Chem. Listy, 102, s265–s1311 (2008) Environmental Chemistry & Technology<br />
low volume of the extraction solvent high enrichment factor<br />
was obtained. Thereby, the gain in sensitivity was achieved<br />
by using 60 μl of carbon tetrachloride.<br />
E f f e c t o f T y p e a n d V o l u m e o f t h e<br />
D i s p e r s e r S o l v e n t<br />
The main criterion for selection of the disperser solvent<br />
is its miscibility in the extraction solvent and aqueous sample.<br />
For this purpose, different solvents such as acetone, acetonitrile,<br />
methanol and ethanol were tested. A series of sample<br />
solutions were studied by using 800 μl of each disperser<br />
solvent containing 60 μl of carbon tetrachloride (extraction<br />
solvent). The enrichment factors obtained for acetonitrile,<br />
acetone, methanol and ethanol were 108.7 ± 9.1, 125.2 ± 8.8,<br />
120.4 ± 5.3 and 115.6 ± 7.5, respectively. The results show<br />
no statistical significant differences between disperser solvents;<br />
however, the solubility of DDTC in methanol makes<br />
it a better choice.<br />
The effect of the volume of methanol on the extraction<br />
recovery was also studied. Since, variation of the volume<br />
of methanol makes change in the volume of sedimented<br />
phase at constant volume of carbon tetrachloride (extraction<br />
solvent). Thereby, to avoid this matter and in order to<br />
achieve a constant volume of sedimented phase (25 μl) the<br />
volume of methanol and carbon tetrachloride were changed,<br />
simultaneously. The experimental conditions were fixed and<br />
include the use of different volumes of methanol 0.50, 0.8,<br />
1.00 and 1.50 ml containing 45, 60, 75 and 100 μl of carbon<br />
tetrachloride, respectively. Under these conditions, the<br />
volume of the sedimented phase was constant (25 ± 1 μl). It<br />
is clear that by increasing the volume of methanol, the solubility<br />
of complex in water increases. Therefore, the extraction<br />
recovery decreases. Thus, 800 μl of methanol was selected as<br />
optimum volume in order to achieve better and more stable<br />
cloudy solution.<br />
E f f e c t o f p H<br />
The separation of metal ions by dispersive liquid–liquid<br />
microextraction involves prior formation of a complex with<br />
sufficient hydrophobicity to be extracted into the small<br />
volume of the sedimented phase, thus, obtaining the desired<br />
preconcentration. pH plays a unique role on metal–chelate<br />
formation and subsequent extraction. The effect of pH on the<br />
complex formation and extraction of silver from water samples<br />
was studied in the range of 1–6 by using concentrated<br />
H 2 SO 4 solution( note that DDTC is a weak base). The results<br />
illustrated in Fig. 1. reveal that the absorbance is nearly constant<br />
in the pH range of 3.5–4.0. Therfore the pH 4 seems<br />
a proper choice. Moreover, to make pH 4 adjustment, the<br />
use of buffer (which are sources of contamination) is not<br />
necessary and sulfuric acid can simply be used to make the<br />
pH adjustment.<br />
E f f e c t o f D D T C C o n c e n t r a t i o n<br />
The effect of the DDTC concentration on the absorbace<br />
was studied in the range of 0.001-1mM of DDTC. The<br />
s333<br />
Fig. 1. Effect of ph on silver extraction<br />
absorbace was increased by increasing the DDTC concentration,<br />
which is well expected. It seems that slight reduction<br />
of extraction in high concentration of DDTC is due to the<br />
extraction of DDTC itself, which can easily saturate the<br />
small volume of extraction solvent. Also, at high concentration<br />
of DDTC (1mM) the background absorbance was increased.<br />
Therefore, the concentrationt of 0.01 mM DDTC was<br />
selected as the best choice to prevent any interference.<br />
E f f e c t o f S a l t<br />
For investigating the influence of ionic strength on performance<br />
of DLLME, various experiments were performed<br />
by adding different amount of nanO 3 (0–8 % (w/v)). Other<br />
experimental conditions were kept constant. By increasing<br />
the nanO 3 from 0 to 8 %, the volume of sedimented phase<br />
increases slightly from 25 to 27 μl. The results showed that<br />
salt addition has no significant effect on the enrichment factor.<br />
It is maybe because of two opposite effects of salt addition<br />
in DLLME of silver. One of them is increasing the volume<br />
Table II<br />
Effect of foreign ions on the pre-concentration and determination<br />
of silver (20 ng ml −1 )<br />
Ion Ion/Au ratio Extraction recovery [%]<br />
Li + 10,000 103.5 ± 3.7<br />
K + 10,000 103.8 ± 4.8<br />
Mg 2+ 10,000 94.3 ± 1.9<br />
Ca 2+ 10,000 10<strong>2.</strong>3 ± 7.3<br />
Mn 2+ 1,000 96.3 ± 4.7<br />
ni 2+ 1,000 89.7 ± 8.7<br />
Hg 2+ 1,000 104.5 ± 3.8<br />
Cu 2+ 1,000 93 ± 1.2<br />
Co 2+ 1,000 101.2 ± 4.0<br />
Cd 2+ 1,000 93.6 ± 3.8<br />
Pb 2+ 1,000 95.9 ± 1.3<br />
Bi 3+ 1,000 94.6 ± 3.7<br />
Cr 3+ 1,000 94.8 ± 5.0<br />
nO 3 − 1,000 105.8 ± 4.6<br />
SO 4 2− 1,000 101.0 ± 6.2<br />
Cl – 10,000 103.3 ± 4.6
Chem. Listy, 102, s265–s1311 (2008) Environmental Chemistry & Technology<br />
of sedimented phase that decreases the enrichment factor and<br />
another is salting-out effect that increases the enrichment<br />
factor. Therefore, the enrichment factor is nearly constant by<br />
increasing the amount of sodium nitrate. Therefore the experiments<br />
were performed in absence of the salt.<br />
E f f e c t o f C o e x i s t i n g I o n s<br />
The effects of common coexisting ions in natural water<br />
samples on the recovery of silver were studied. In these experiments,<br />
10.0 ml of solutions contains 20 ng ml −1 of silver and<br />
various amounts of interfering ions were treated according to<br />
the recommended procedure. A given spices was considered<br />
to interfere if it resulted in a ± 5 % variation of the AAS signal.<br />
The results obtained are given in Table II.<br />
F i g u r e s o f M e r i t<br />
Table. III summarizes the analytical characteristics of<br />
the optimized method, including linear range, limit of detection,<br />
reproducibility, and enhancement factor. The calibration<br />
graph was linear in the range of 6–120 ng ml −1 of<br />
silver. The limit of detection, defined as C L = 3 S B /m (where<br />
C L , S B and m are the limit of detection, standard deviation of<br />
the blank and slope of the calibration graph, respectively),<br />
was 1.2 ng ml −1 . The relative standard deviation (R.S.D.)<br />
for ten replicate measurements of 20 ng dm −3 Ag was 3.6 %.<br />
The enhancement factor was obtained from the slope ratio<br />
of calibration graph after and before extraction, which was<br />
about 66.<br />
Table III<br />
Analytical characteristics of DLLME-ETAAS for determination<br />
of Ag<br />
Element condition DLLME–ETAAS ETAAS<br />
Linear range [ng ml −1 ] 6–120 500–20,000<br />
Correlation coefficient (r) 0.995 0.997<br />
Slope <strong>2.</strong>65 0.04<br />
Enhancement factor a 66 –<br />
RSD [%], (n = 8) b 3.6 3.5<br />
LOD [ng ml −1 ] c 1.2 80<br />
a Calculated as the ratio of slope of pre-concentrated samples<br />
to that obtained without pre-concentration.<br />
b At a silver concentration of 20 ng ml −1 .<br />
c Determined as three times of the standard deviation of the<br />
blank signal, and slop of calibration curve after pre-concentration<br />
A n a l y s i s o f n a t u r a l W a t e r s<br />
The proposed DLLME–ETAAS methodology was<br />
applied to the determination of silver in several water samples.<br />
Tap, underground and river water were collected from<br />
the Tehran and were analyzed by DLLME combined with<br />
ETAAS for determination of silver. The concentration of<br />
silver in the tap, underground and river water samples were<br />
determined to be 17.2 ± 0.6 ng ml −1 , 24.7 ± 0.6 ng ml −1 and<br />
30.10 ± 0.4 ng ml −1 respectively (Table IV). The water sam-<br />
s334<br />
ples were spiked with silver standards to assess matrix effects.<br />
The relative recoveries of silver from these waters at<br />
spiking level of 10 and 20 ng ml −1 were 102, 98, and 100 %,<br />
respectively (Table IV). These results demonstrated that the<br />
tap, underground and river water samples matrices, in our<br />
present context, had little effect on DLLME of silver.<br />
Table IV<br />
Determination of Ag in real samples<br />
Sample<br />
Added Found<br />
[ng ml −1 ] [ng ml −1 ] a<br />
Recovery [%]<br />
– 17.2 ± 0.6 –<br />
Tap waterb 10 27.3 ± 0.4 101<br />
20 37.5 ± 0.6 103<br />
Underground<br />
water<br />
– 24.7 ± 0.5 –<br />
c 10 34.6 ± 0. 6 99<br />
River water d<br />
20 44.4 ± 0.5 97<br />
– 30.1 ± 0.4 –<br />
10 40.0 ± 0.5 99<br />
20 50.2 ± 0.8 101<br />
a Mean of three experiments ± standard deviation.<br />
b From drinking water system of Tehran, Iran.<br />
c Obtained from Vardavard, Iran.<br />
d From Karaj river, Iran.<br />
Conclusions<br />
In this paper we introduced a DLLME–ETAAS method<br />
for the analysis of ultra trace amounts of Ag in real samples<br />
such as tap water, river water and underground water. The<br />
important features of DLLME method are low cost, use of<br />
minimized toxic organic solvents, simplicity of operation,<br />
rapidity, high enrichment factor and high sensitivity and selectivity.<br />
High preconcentration factor was obtained easily through<br />
this method and a detection limit at ng ml −1 level was<br />
achieved with only 10.00 ml of sample. In this method sample<br />
preparation time as well as consumption of toxic organic<br />
solvents was minimized without affecting the sensitivity of<br />
the method..This method is characterized with simplicity,<br />
rapidity, reliability, safety and low cost, and is suitable for<br />
the determination of ultra-trace silver in environmental water<br />
samples.<br />
REFEREnCES<br />
1. Grayson M. : Kirk–Othmer Encyclopedia of Chemical<br />
Technology ,.(3 rd ed.), vol. 21, Wiley, new York 1980.<br />
<strong>2.</strong> Smith I.C., Carson B. L.:, Trace Metals in the Environment<br />
, vol. 2, Ann Arbor Science Publisher‘s Inc., Ann<br />
Arbor 1977.<br />
3. Šràmkovà J., Kotrlý S., Jakoubková P.: Anal. Chim.<br />
Acta 408, 183 (2000).<br />
4. Baron M. G., Herrin R. T., Armstrong D. E.: Analyst 25,<br />
123 (2000).<br />
5. Singh R. P., Pambid E. R.: Analyst 115, 301 (1990).<br />
6. ndung’u K., Ranville M. A., Franks R. P., Flegal A. R.:<br />
Mar. Chem. 98, 109 (2006).
Chem. Listy, 102, s265–s1311 (2008) Environmental Chemistry & Technology<br />
7. Koh T., Sugimoto T.: Anal. Chim. Acta 333, 167<br />
(1996).<br />
8. Dadfarnia S., Haji Shabani A. M, Gohari M.: Talanta 64,<br />
682 (2004).<br />
9. Sant’Ana O. D., Wagener A. L. R., Santelli R. E., Cassella<br />
R. J., Gallego M., Valcarcel M.: Talanta 56, 673<br />
(2002).<br />
10. Rahman M. A., Kaneco S., Amin M. n., Suzuki T., Ohta<br />
K.: Talanta 62, 1047 (2004).<br />
s335<br />
11. Stalikas C. D.: Trends Anal. Chem. 21, 343 (2002).<br />
1<strong>2.</strong> Rezaee M., Assadi Y., Milani Hosseini M. R., Aghaee<br />
E., Ahmadi F., Berijani S.: J. Chromatogr. A 1116, 1<br />
(2006).<br />
13. Zeini Jahromi E., Bidari A., Assadi Y., Milani Hosseini<br />
M. R., Jamali M. R.: Anal. Chim. Acta 585, 305 (2007).
Chem. Listy, 102, s265–s1311 (2008) Environmental Chemistry & Technology<br />
P02 REMOVAL OF 2-MERCAPTObENZOThIAZOLE<br />
FROM SyNThETIC<br />
wASTEwATER<br />
BEáTA ALMáSIOVá, Ján DERCO, AnGELIKA<br />
KASSAI and eVA HáSOVá<br />
Slovak University of Technology, Faculty of Chemical and<br />
Food Technology, Institute of Chemical and Environmental<br />
Engineering, Radlinského 9, 812 37 Bratislava 1, Slovak<br />
Republic,<br />
beata.almasiova@stuba.sk<br />
Introduction<br />
2-Mercaptobenzothiazole (MBT) is the most important<br />
member of the benzothiazole group of heterocyclic aromatic<br />
compounds. It is a pale yellow, crystalline substance with an<br />
unpleasant odor and a bitter taste . This xenobiotic compound<br />
is used mainly in the manufacture of rubber additive chemicals<br />
but also has other uses, notably as a corrosion inhibitor,<br />
antifreeze for automobiles. It is known as a toxic and poorly<br />
biodegradable pollutant. It is able to pass conventional treatment<br />
systems, widespread with surface and underground<br />
waters and enters into organisms 1 . Data concerning biodegradation<br />
of MBT are inconclusive. Some authors 2 have suggested<br />
it is recalcitrant to biodegradation.<br />
Genotoxicity investigations in bacterial and mammalian<br />
test systems provide some evidence indicating that MBT has<br />
the potential to induce mutations and chromosomal aberrations.<br />
Toxicity studies in rats and mice chronically exposed<br />
to MBT identified increases in various tumors 3 . Epidemiological<br />
investigations indicate that workers occupationally<br />
exposed to MBT have an increased risk of death from bladder<br />
cancer. MBT interfered with the nitrification processes and<br />
exhibited biocidal effects. MBT inhibits the degradation of<br />
easily degradable organics 4 .<br />
This work was aimed at study biodegradation of MBT<br />
and effect of this compound on activated sludge. Degradation<br />
of MBT by ozone was also studied.<br />
Experimental<br />
B i o d e g r a d a b i l i t y o f M B T<br />
Adaptation of activated sludge to MBT was carried out<br />
in semicontinuos bioreactor. We were adapted MBT with<br />
maximal concentration 25 and 50 mg dm –3 on the activated<br />
sludge. Time of adaptation was 3 weeks. During the adaptation<br />
Table I<br />
Specific sorptive capacity of activated sludge<br />
c MBT MTB decrease MTB decrease<br />
at solution by adsorption by adsorption<br />
[mg dm –3 ] [mg dm –3 ] [mg g –1 ]<br />
10 4.2 42<br />
20 5.9 59<br />
60 6.8 68<br />
s336<br />
we measured inhibition effect of MBT on the activated sludge<br />
by respirometric measurements.<br />
Adsorption tests were performed both with adapted and<br />
nonadapted activated sludge to MBT. Adsorption of MBT on<br />
activated sludge was studied at various concentration values<br />
of MBT. We were measured the specific sorptive capacity of<br />
sludge at low (10, 20 and 60 mg dm –3 ) and high concentration<br />
of MBT (100, 200 and 500 mg dm –3 ).<br />
O z o n a t i o n o f M B T<br />
The feasibility of utilisation of ozone for degradation<br />
of MBT was investigated in laboratory scale equipment. The<br />
experiments were performed in bubble ozonation column.<br />
The ozonation equipment consists of two glass columns,<br />
0.04 m diameter and 1.70 m height. The first column was<br />
filled with synthetic water with MBT, and the other one was<br />
filled with solution of potassium iodide to destroy residual<br />
ozone in the outlet of the first ozonation column. The system<br />
was operated in batch mode. Synthetic wastewater containing<br />
MBT was added into ozonation reactor at the beginning of<br />
trials. Continuous flow of oxygen 30 dm 3 h –1 was applied for<br />
generation of ozone. The Lifetech ozone generator with the<br />
maximum ozone production 5 g h -1 and Lifetech ozone UV<br />
detector were used. Ozonation trials were carried out at 70 %<br />
of the power maximum of ozone generator. Initial concentration<br />
of MBT in synthetic water was 50 mg dm –3 .<br />
Results<br />
MBT is not consumed by non adapted activated sludge.<br />
Decrease of respiration rate of non adapted activated sludge<br />
was observed with the increase of 2-MBTconcentration.<br />
Rapid decrease of respiration activity was observed for activated<br />
sludge after adaptation. The endogenous respirometric<br />
rate decreased by 6 % at concentration 25 mg dm –3 MBT in<br />
comparison with reference model. The endogenous respirometric<br />
rate decreased by 39 % at concentration 50 mg.dm –3<br />
MBT in comparison with reference model.<br />
The decrease of dissolved MBT concentration was<br />
observed at the low concentration levels. The value of COD<br />
and TOC increased after 10 days, which is caused by increase<br />
of concentration of MBT in solution.<br />
Table I shows the results of adsorption test carried out at<br />
lower concentration values of MBT. negligible adsorption of<br />
MBT on activated sludge was observed at MBT concentration<br />
higher than 100 mg dm –3 .<br />
According to results shown in the Fig. 1. the highest COD<br />
removal was observed during the first 20 minutes of ozonation.<br />
The initial COD value conversion achieved about 98 %<br />
after 50 minutes. The efficiency of TOC removal was 54 %<br />
after 50 minutes of ozonation. Almost total removal (96 %)<br />
of 2-MBT from the sample was achieved after 5 minutes of<br />
ozonation. Simultaneously the presence of benzothiazole was<br />
identified as ozonation intermediate. The presence of benzothiazole<br />
(BT) was identified in the sample after 50 minutes<br />
of ozonation. Fien et al. 5 show, that MBT and its breakdown<br />
products had a high affinity towards ozone as indicated by the
Chem. Listy, 102, s265–s1311 (2008) Environmental Chemistry & Technology<br />
rates for partial oxidation and mineralization. Benzothiazole<br />
was identified as the first ozonation product, reaching up to<br />
60 mol% of the original MBT concentration, followed by low<br />
concentration of 2(3-H) benzothiazolone.<br />
The results of absorption of ozone in the fresh water<br />
and in the synthetic wastewater containing MBT are given in<br />
Fig. <strong>2.</strong> The saturation concentration of ozone 23.1 mg dm –3<br />
was achieved in fresh water after 35 minutes. Specific ozone<br />
consumption values were 0.78 g g –1 for COD and 1.88 g g –1<br />
for TOC.<br />
Fig. 1. COD, TOC and MbT as a function of ozonation time at<br />
oxygen flow rate 30 dm 3 h –1 and W = 70 %<br />
Conclusions<br />
Respirometric tests confirmed that this compound is not<br />
biodegradable. Activated sludge showed adsorption affinity<br />
to MBT at concentration values up to 60 mg dm –3 . Significant<br />
decrease of MBT content was observed after five minutes<br />
of ozonation. Correspondent efficiency values for COD<br />
and TOC removal were 55 and 16 %. COD removal rate<br />
5.2 mg dm –3 min –1 was observed at 70 % of maximum ozone<br />
s337<br />
Fig. <strong>2.</strong> utilization of ozone in demineralised water and in synthetic<br />
wastewater contentaining MbT<br />
generator power. The presence of benzothiazole was identified<br />
as ozonation intermediate. It can be concluded that MBT<br />
is readily transformed by ozonation.<br />
This work has been supported by the Slovak Grant<br />
Agency for chemical and chemical-technological science<br />
(Grant No 1/0866/08).<br />
REFEREnCES<br />
1. De Wever H., Verachtert H.: Water Research 31, 2673<br />
(1997).<br />
<strong>2.</strong> Chudoba J., Tuček F., Zeis K:. Acta Hydrochim. Hydrobiolo.<br />
5, 495 (1977).<br />
3. Whittaker M. H., Gebhart A. M., Miller T. C., Hammer<br />
F.: Toxicol And Health. 2004, 49.<br />
4. Reemtsma T., Fiehn O., Kalnowski G. and Jekel M.:<br />
Environ. Scien. Technol. 29, 478 (1995).<br />
5. Fiehn O., Wegener G., Jochimsen J. and Jekel M.: Water<br />
Research 32, 1075 (1998).
Chem. Listy, 102, s265–s1311 (2008) Environmental Chemistry & Technology<br />
P03 hEALTh RISK ASSESSMENT by INDOOR AIR<br />
QuALITy MONITORING<br />
EKATERInA AnDREEVA, IVAn MAŠEK and MILADA<br />
VáVROVá<br />
Brno University of Technology, ICTEP, Czech Republic, Purkyňova<br />
118, 612 00 Brno, Czech Republic,<br />
xcandreeva@fch.vutbr.cz<br />
Introduction<br />
The risk is an inseparable part of working activity. That<br />
is why a general duty of employer is to ensure health and<br />
safety at work for all employees. They are protected by the<br />
main framework Directive 98/391/EEC, which basic principle<br />
is risk prevention, which requires risk assessment by the<br />
responsible employer.<br />
Dangerous substances can be found in many workplaces.<br />
A recent European survey shows that 16 % of workers<br />
reported handling hazardous products and 22 % being<br />
exposed to toxic vapours1 . As far as work accidents concern<br />
according to OSHA facts1 :<br />
• Every 3 and a half minutes somebody in the European<br />
Union dies from work-related causes<br />
• Every year 142,400 people in the EU die from occupational<br />
diseases and 8,900 from work-related accidents<br />
• Up to third of these 150,000 fatalities each year can be<br />
attributed to hazardous substances at work in the EU<br />
(including 21,000 to asbestos)<br />
Exposure to dangerous substance occurs at any industry<br />
workplace, on farms, in vehicles, especially at chemical<br />
plants and at smaller areas, such as high school, universities,<br />
in laboratories and also at home or in office.<br />
Dangerous substances affect human’s health by different<br />
ways. Some can cause cancer, affect the reproductive<br />
function or cause mutagenic effects. Other agents may cause<br />
brain damage, be harmful to the nervous system, respiratory<br />
airways or skin.<br />
Quality of workplace environment includes not only<br />
safety conditions at work, achieved by continual risk assessment<br />
and elimination of these risks, but also means a clean<br />
and healthy environment. The working environment is formed<br />
by different microclimatic conditions, such as level of noise,<br />
lighting, quality of indoor air, surrounding temperature, level<br />
of humidity etc. Each of these factors has a great influence on<br />
worker’s health and productivity of his work.<br />
Since many people spend a large part of their lives in<br />
closed areas – in an office, at school, in transport – clean air<br />
becomes essential for good health and this is especially true<br />
when speaking about indoor air.<br />
Posing the Problem<br />
As it was mentioned above among different workplaces,<br />
school’s environment can be found. nowadays school area<br />
consists of not only usual class-rooms, but also covers wide<br />
s338<br />
range of specialized working facilities, for example chemical<br />
laboratories.<br />
In this article we will focus on chemical hazards in the<br />
laboratories. People who work or study in a chemical laboratory<br />
are exposed to many kinds of hazards, e.g. chemical<br />
substances, mechanical hazards, biological agents, physical<br />
factors, psychological conditions and so on.<br />
Special feature of such work environment is that level<br />
of chemical threats rises steeply, since the quantity and<br />
range of chemicals are higher than in any other place of<br />
usual life. Many agents are highly flammable and explosive,<br />
their careless handling and storage may result in fire ignition<br />
and explosions. Toxic gases, fumes and liquids may be<br />
produced and cause poisoning or infection of personnel and<br />
students. Some chemical agents have carcinogenic or mutagenic<br />
properties.<br />
Indoor air quality is also one of the important factors<br />
in the working space and shouldn’t be underestimated.<br />
The influence of air quality which we breathe can be extended<br />
on two main problems: long-term health affection and<br />
work-related accidents. The first problem is connected with<br />
long-term exposure of workers and students to low concentrations<br />
of different substances in the air (the most followed<br />
are carbon and nitrogen oxides, radon and Volatile Organic<br />
Compounds – VOCs). Usually it can be solved by periodical<br />
measuring of concentration, assessing the possible risks<br />
of this exposure and taking correcting measures, for example<br />
improving ventilation, changing working regime, and using<br />
proper personal protective equipment.<br />
The second problem concerns working-related accidents.<br />
On the one hand any laboratory worker or student can be<br />
exposed to toxic gases and fumes, which may unexpectedly<br />
escape from their container or come out from the by-side effect<br />
of reaction. These substances in the air can cause diffe-<br />
rent effects:<br />
•<br />
•<br />
•<br />
Acute poisoning or injury of the organism<br />
Cause allergies<br />
Irritate eyes or breathing system<br />
Usually there are few people in laboratory at the same<br />
time. If one of them will lose self-control under certain conditions,<br />
such as bad vision, suffocation, pain, his behavior<br />
becomes dangerous for others and can lead to emerging other<br />
hazards for surrounding people.<br />
Objects of Research<br />
According to EC Directive 1999/13/EC (Solvent Emissions<br />
Directive), Volatile Organic Compounds (VOCs) are functionally<br />
defined as organic compounds having at 293.15 K<br />
(i.e., 20 °C) a vapor pressure of 0.01 kPa or more, or having a<br />
corresponding volatility under particular conditions of use.<br />
In a majority solvents need to be managed carefully<br />
due to their volatility and general flammability, in particular<br />
during loading and unloading, storage and when using large<br />
quantities.
Chem. Listy, 102, s265–s1311 (2008) Environmental Chemistry & Technology<br />
Commonly, producers enclose Safety Data Sheets to<br />
their products with necessary using, handling and storage<br />
recommendations:<br />
• Safe exposure limits and techniques for managing<br />
flammability<br />
• Information on the main hazards, how to protect against<br />
them and the steps to take in an emergency<br />
• Occupational exposure limits (OELs)<br />
• Handling, storage, transport, spills and disposal advice<br />
• Regulatory information such as classification and labeling<br />
• Toxicity and environmental information<br />
In chemical laboratory among other used chemicals<br />
one of the most famous are organic solvents, which usually<br />
referred to as group of Volatile Organic Compounds (VOCs).<br />
VOCs are compounds given off by a number of other indoor<br />
sources. Concentrations of most volatile organic compounds<br />
is higher in indoor than outdoor air. They commonly can be<br />
found in household, institutional, and industrial cleaning and<br />
maintenance products, and in building and finishing materials.<br />
Other sources of VOCs include the burning of fuels<br />
such as gas, wood and kerosene, as well as tobacco products.<br />
VOCs can also come from personal care products (perfume<br />
and hair spray), cleaning agents, dry cleaning fluid, paints,<br />
lacquers, varnishes, hobby supplies, and from copying and<br />
printing machines 2 .<br />
In enclosed spaces, VOCs can cause eye, nose, and<br />
throat irritation, dizziness, headache, memory and visual<br />
impairment. Higher concentrations may cause irritation of<br />
the lungs, as well as damage to the liver, kidney, or central<br />
nervous system. Some VOCs are suspected to cause cancer<br />
in humans and have been shown to cause cancer in animals.<br />
The health effects caused by VOCs depend on the level and<br />
length of exposure.<br />
The real concentrations of VOCs are usually orders of<br />
magnitude below the occupational threshold limit values<br />
(TLVs). However, some VOCs may be present above their<br />
human odor thresholds (OTs). Beside odor annoyance, VOCs<br />
at sub-TLV level may cause non-specific health effects such<br />
as eye and upper respiratory airway irritation, headache and<br />
increased weariness 3 .<br />
The main route of exposure to solvents is via inhalation.<br />
Occupational exposure limits (OELs) set the airborne<br />
concentration of a substance that workers can be exposed to,<br />
day after day without any adverse health effects. OELs are<br />
normally set for an 8 hour day –1 and a 40 hour week –1 and are<br />
continuously reviewed by national and EU authorities. OELs<br />
for the majority of hydrocarbon and oxygenated solvents are<br />
set between 10 and 1,000 parts per million depending on the<br />
volatility and toxicity of an individual substance 4 .<br />
According to what was stated above as objects of research<br />
were chosen some organic solvents which are frequently used<br />
in chemical laboratories of the Faculty of Chemistry, Brno<br />
University of Technology. Acquired data will be used for the<br />
following health risk assessment in chosen workplaces.<br />
s339<br />
Managing the Problem<br />
A four-step approach to risk assessment exists4 .<br />
• Make an inventory of the substances used in the processes<br />
in the workplace and those generated by the process<br />
such as welding fumes or wood dust.<br />
• Collect information about these substances, i.e. the harm<br />
they can do and how this can happen. Safety data sheets<br />
(SDS), which must be provided by the supplier of a chemical,<br />
are an important source of information.<br />
• Assess exposure to the identified dangerous substances,<br />
looking at the type, intensity, length, frequency and occurrence<br />
of exposure to workers, including combined<br />
effects of dangerous substances used together and the<br />
related risk.<br />
• Rank the severity of the established risks.<br />
As we can see from this list of steps, assess exposure is<br />
one of the important parts. Exactly, this direction was chosen<br />
to exposure prevent and control of the dangerous substances<br />
in chemical laboratories.<br />
The purpose of this study is to measure the concentration<br />
of VOCs, which are used in chosen chemical laboratories<br />
and to assess possible occupational health risks. The aim is<br />
to protect people who are supervising the practice work and<br />
working in the harmful environment for a long time (occasionally<br />
more than 8 hours). This research work is supposed to<br />
be conducted for a long-term period.<br />
The measurements will be taken in different working<br />
areas (for example laboratory of organic chemistry, storage<br />
area). For conducting the analysis a passive air sampling by<br />
Radiello cartridges with charcoal is chosen with followed<br />
CS 2 desorption and GC with FID or GC-MS analysis.<br />
Method used to sample collection and analysis, passive<br />
sampling (by means of new trade product Radiello ® ), is considered<br />
to be a simple and rather cost-effective. Unlike active<br />
sampling, passive samplers require no expensive pumps and<br />
are simple to use (no calibration is needed). Other advantages<br />
are:<br />
•<br />
•<br />
•<br />
•<br />
Compact, portable<br />
Offer indication of average pollution levels over time<br />
periods of 8 hour to weeks/months<br />
Relatively low-cost in compare with other methods<br />
Applicable for personal monitoring and indoor air analysis<br />
Conclusions<br />
Important point of view for assessing acceptable working<br />
place is its safety requirements and conditions which<br />
will surround the employees, what means working environment,<br />
which consists of physical, chemical and other factors.<br />
These factors can unfavorable affect worker’s health by their<br />
poor quality or quantity, as well as duration of this affection.<br />
Everybody wants to work in the safety and high-quality<br />
working environment. This statement enclosed in the<br />
European legislation and imposes some obligations on<br />
employers:
Chem. Listy, 102, s265–s1311 (2008) Environmental Chemistry & Technology<br />
•<br />
•<br />
•<br />
Assess the possible risks<br />
Take measures to eliminate or reduce the risks<br />
Effectiveness control of the preventive measures and<br />
their review<br />
A healthy work environment means the monitoring and<br />
maintenance of hygienic limits in the workplace, such as<br />
temperature, humidity of air, proper chemical composition,<br />
intensity of working process etc.<br />
University area with its laboratories is a special working<br />
environment. Students and other workers, who is working<br />
or studying in such laboratories, are exposed to many kinds<br />
of hazards. But the main difference is that laboratory work<br />
involves a greater variety of possible chemical hazards. There<br />
are many agents, which have flammable, explosive, toxic and<br />
other characteristics.<br />
Besides obvious risks, which can emerge during laboratory<br />
work, there are also non-evident ones, for example, air<br />
quality.<br />
Among different chemical agents, there is a group of the<br />
most used, such as organic solvents. Some of them could be<br />
very harmful for human’s health, but usually for assessing<br />
their affection it’simportant take into account their features,<br />
time of exposure and concentration during exposure.<br />
For this purpose the methodology of indoor air analysis<br />
is going to be developed, which is supposed to help in assessing<br />
possible occupational health risks, posed by quality of<br />
indoor air in chemical laboratories. The indoor air analysis is<br />
conducting by passive sampling with following GC with FID<br />
or GC-MS analysis on long-term conditions.<br />
s340<br />
REFEREnCES<br />
1. Statistics – OSHA – European Agency for Safety and<br />
Health at Work [online]. c1998–2008 , 06.06.2008 [cit.<br />
2008-06-07]. Available from : .<br />
<strong>2.</strong> Indoor Air Quality – Volatile Organic Compounds<br />
(VOC\’s) - BC HealthFile #65d [online]. c2006 , 07-<br />
2006 [cit. 2008-06-07]. Available from WWW: .<br />
3. Reiser, R., et al. Indoor air pollution by volatile organic<br />
compounds (voc) emitted from flooring material in a<br />
technical university in Switzerland. Proceedings: indoor<br />
air [online]. 2002 [cit. 2008-06-07], pp. 1004-1009.<br />
Available from www: .<br />
4. ESIG : Health & Safety – European Solvents Industry<br />
Group ESIG: Solvents industry in Europe [online]. 08-<br />
05-2008 , 08-05-2008 [cit. 2008-06-07]. Availabnnle<br />
from: .<br />
5. Factsheet – 33 – An introduction to dangerous substances<br />
in the workplace : Facts. Facts [online]. no. 33, (2003)<br />
[cit. 2008-06-07]. Available from WWW: .<br />
6. Radiello – The radial simmetry diffusive sampler [online].<br />
Fondazione Salvatore Maugeri IRCCS , 2006 , March 22th<br />
2007 [cit. 2007-06-07]. Available from WWW: .
Chem. Listy, 102, s265–s1311 (2008) Environmental Chemistry & Technology<br />
P04 NITROGEN IN bREEDING LAyING hENS AND<br />
ENVIRONMENT PROTECTION<br />
MáRIA AnGELOVIČOVá, MAREK AnGELOVIČ and<br />
MIROSLAVA KAČánIOVá<br />
Faculty of Biotechnology and Food Sciences, Slovak University<br />
of Agriculture, Tr. A.Hlinku 2, Nitra, 949 76 Slovakia,<br />
maria.angelovicova@uniag.sk<br />
Introduction<br />
At EU–15 level the gross nitrogen balance in 2000<br />
was calculated to be 55 kg ha –1 , which is 16 % lower than<br />
the balance estimate in 1990, which was 66 kg ha –1 . In 2000<br />
the gross nitrogen balance ranged from 37 kg ha –1 (Italy)<br />
to 226 kg ha –1 (the netherlands). All national gross nitrogen<br />
balances show a decline in estimates of the gross nitrogen<br />
balance (kg ha –1 ) between 1990 and 2000, apart from<br />
Ireland (22% increase) and Spain (47% increase). The following<br />
Member States showed organic fertilizer application<br />
rates greater than the threshold of 170 kg ha –1 specified by<br />
the nitrates Directive in 2000: the netherlands (206 kg ha –1 )<br />
and Belgium (204 kg ha –1 ). The general decline in nitrogen<br />
balance surpluses is due to a small decrease in nitrogen input<br />
rates (–1.0 %) and a significant increase in nitrogen output<br />
rates (10 %). The gross nutrient balance for nitrogen provides<br />
an indication of potential water pollution and identifies<br />
those agricultural areas and systems with very high nitrogen<br />
loadings. As the indicator integrates the most important agricultural<br />
parameters with regard to potential nitrogen surplus<br />
it is currently the best available approximation of agricultural<br />
pressures on water quality. High nutrient balances exert pressures<br />
on the environment in terms of an increased risk of leaching<br />
of nitrates to groundwater. The application of mineral<br />
and organic fertilizers can also lead to emissions to the atmosphere<br />
in the form of nitrous dioxide and ammonia, respectively.<br />
Gross nitrogen balances are above 100 kg per ha in the<br />
netherlands, Belgium, Luxembourg and Germany. They are<br />
particularly low in most Mediterranean countries given the<br />
overall lower livestock production in this part of Europe.<br />
It is currently not possible to provide gross nitrogen balance<br />
estimates for the new EU Member States and the accession<br />
as the relevant statistical data are under elaboration. national<br />
balances, however, can mask important regional differences<br />
in the gross nutrient balance that determine actual nitrogen<br />
leaching risk at regional or local level. Individual Member<br />
States can thus have acceptable gross nitrogen balances at<br />
national level but still experience significant nitrogen leaching<br />
in certain regions, for example in areas with high livestock<br />
concentrations. There are a number of regions where pig<br />
livestock units have increased by more than 25 % between<br />
1990 and 2000 (for example, north-western Denmark, northwestern<br />
France, north-eastern Spain and northern Belgium).<br />
These are likely to be regional ‘hotspots’ for high gross nitrogen<br />
balances that can lead to environmental pressures. Member<br />
States with high nitrogen balances are making efforts<br />
to reduce these pressures on the environment. These build<br />
s341<br />
on a range of different policy instruments, requiring considerable<br />
political effort to succeed given the significant social<br />
and economic consequences of reducing livestock production<br />
in many affected areas 3,4 .<br />
Experimental<br />
We realized experiments with laying hens Shaver<br />
Starcross 288, which ingested feed mixture with different<br />
protein content. In six experiments laying hens fed feed<br />
mixture with protein contents 173.10 g per kilogram and in<br />
four experiments were used feed mixture with protein contents<br />
146.12 or 146.68 g per kilogram. It is soya cereal type<br />
assigned for laying hens. The laying hens ingested fodder ad<br />
libitum.<br />
Within experiments were researched:<br />
protein contents in feed mixture in one kilogram (chemical<br />
analysis – Kjeldahl method and calculation),<br />
excreted nitrogen [g kg –1 •<br />
•<br />
] in dropping per bird and day<br />
(chemical analysis – Kjeldahl method and calculation).<br />
Results<br />
Higher protein contents 173.10 g per kilogram of feed<br />
mixture resulted in excreted dropping at laying hens higher<br />
nitrogen contents in compare with protein contents 146.40 g<br />
per kilogram feed mixture. After ingestion of feed mixture<br />
with protein content 173.10 g per kilogram was nitrogen<br />
content in dropping from 1.88 g per bird and day. The laying<br />
hens, which fed feed mixture with protein contents 146.40 g<br />
per kilogram, excreted the nitrogen in dropping 1.38 g per<br />
bird and day. From these results follows that near decrease<br />
protein contents in feed mixture from 173.10 to 146.40 g<br />
per kilogram is possibility of nitrogen decrease in excreted<br />
dropping at laying hens about 26.60 % per bird and day. This<br />
different of decrease of excreted nitrogen in dropping at layers<br />
is statistically significant (P < 0.001). Correlation coefficient<br />
between content of crude protein in feed mixture and content<br />
of nitrogen in dropping at layers has high level r = 0.99.<br />
Low-protein diet system for layers with addition of<br />
amino acids is beside biologically-cattle-breeding, economical<br />
and ecological too.<br />
Progressive decrease of proteins content to 146.0 g per<br />
1 kg feeding mixture set up the order of limiting amino acids<br />
for layers: methionine, lysine, tryptophane and threonine 5 .<br />
On bases of results model trials on layers were concluded<br />
that feeding, fat-enriched mixture supplied DL-methionine,<br />
choline chloride and vitamin B 2 by need of the effective<br />
Table I<br />
Excreted nitrogen [g kg –1 ] in dropping at laying hens, which<br />
ingestion of feed mixture with different protein contents<br />
Trial Index SD v % t-test<br />
1 st CP [g kg –1 ] 173.10 0.91 0.52 55.68 +++<br />
2 nd CP [g kg –1 ] 146.40 0.32 <strong>2.</strong>68<br />
1 st n [bird day –1 ] 1.88 0.005 0.22 18.52 +++<br />
2 nd n[bird day –1 ] 1.38 0.02 1.57
Chem. Listy, 102, s265–s1311 (2008) Environmental Chemistry & Technology<br />
substance possible reach adequate the laying, egg weight and<br />
their quality on the economical using of the feedstuff and<br />
lower environment load 1 . In order experiment autors confirmed<br />
results of decrease of excreted nitrogen in dropping<br />
at laying hens 2 .<br />
Conclusions<br />
The research results about nitrogen in breeding of laying<br />
hens in relationship to environment protection confirmed the<br />
possibility its decrease. One of the possibilities is decrease of<br />
protein contents in feed mixture. The decrease of crude protein<br />
content in feed mixture from 173.10 into 146.40 g per kilogram<br />
(about 15.43 %) is possibility of decrease of excreted<br />
nitrogen in dropping at laying hens about 26.60 %, which<br />
is statistically significant (P < 0.001). Correlation dependency<br />
between content of nitrogen in dropping at laying hens and<br />
content of crude protein is high, r = 0.99.<br />
s342<br />
This work was supported by Scientific Grant Agency<br />
under the contract No. VEGA 1/4420/07.<br />
REFEREnCES<br />
1. Angelovičová M.: Živočíšna výroba 42, 263 (1997).<br />
<strong>2.</strong> Angelovičová M., Angelovič M.: Proceedings of scientific<br />
conference Food Safety and Control, p. 153. nitra,<br />
2008.<br />
3. Van Grinsveen H., van Eerdt M., Willems J., Ulleneers<br />
E.: Paper presented at OECD workshop on evaluating<br />
agri-environmental policies, Paris, December 2004.<br />
4. Mikkelsen S., Iversen T.M., Kjaer S., Feenstra P.: Paper<br />
presented at OECD workshop on evaluating agrienvironmental<br />
policies, Paris, December 2004.<br />
5. Kočí Š.: Poultry 33, 117 (1991).
Chem. Listy, 102, s265–s1311 (2008) Environmental Chemistry & Technology<br />
P05 TESTING OF VARIOuS SORbENTS FOR<br />
COPPER REMOVAL FROM ACID MINE<br />
DRAINAGE<br />
MAGDALEnA BáLInTOVá and nATáLIA<br />
KOVALIKOVá<br />
Civil Engineering Faculty, Technical University of Košice,<br />
Vysokoškolská 4, 042 00 Košice,<br />
magdalena.balintova@tuke.sk<br />
Introduction<br />
The elimination of the consequences of mining activities<br />
belongs to the most serious environmental problems nowadays.<br />
Acid mine drainage (AMD) with high metal concentrations<br />
and usually with low value of the pH (about 2–4)<br />
is mainly a result of chemical oxidation of sulphides and<br />
other chemical processes in overflowed mines, mining waste<br />
dumps and tailings. This water may transfer various heavy<br />
metals in a dissolved form, such as Fe, Cu, Al.<br />
The abandoned Smolník mine is regarded as an environmental<br />
loading in the Central Europe region, where AMD is<br />
generated and discharged from abandoned mine and contaminates<br />
the Smolník Creek catchment. This acid mine drainage<br />
(AMD) with pH 3–4 contents high metal concentrations<br />
that vary in dependence on rainfall intensity (e.g. Fe<br />
500–400 mg dm –3 ; Cu 3–1 mg dm –3 ; Zn 13–8 mg dm –3 and<br />
Al 110–70 mg dm –3 ) (ref. 1 ).<br />
There are various physical-chemical methods of treatment<br />
such polluted water e.g. neutralisation, ion exchange,<br />
precipitation, sorption, membrane processes, filtration. The<br />
choice of the suitable methods is based not only on concentration<br />
of heavy metals in surface water but also on economical<br />
factors.<br />
Sorption belongs to effective and economically<br />
acceptable methods for heavy metals removal. Deorkar and<br />
Tavlarides 1 developed an adsorption process of inorganic<br />
chemically active adsorbents (ICAAs) to selectively recover<br />
Fe 3+ , Cu 2+ , Zn 2+ , Cd 2+ and Pb 2+ from AMD solutions without<br />
neutralization. More than 75 % of copper was removed from<br />
solutions by active carbon and biosorbents prepared from<br />
mosses, the highest sorption capacity had active carbon. On<br />
the other hand, pH values in the presence of active carbon<br />
increased almost to 9, thus copper was precipitated from the<br />
solution 3 .<br />
The paper deals with utilization of four types of sorbents<br />
(zeolite, active carbon and an atypical sorbents usually<br />
used for oil pollutants removal from surface water: turf brush<br />
PEATSORB – a hydrophobic material and universal crushed<br />
sorbent ECO-DRY) for cooper removal from AMD Smolník<br />
and presents influence of them on Cu decreasing under various<br />
conditions. The change of pH has been monitored, too.<br />
Experimental<br />
For study of Cu ions removal from acid mine drainage<br />
by adsorption, zeolites (granularity 0.5–1 mm, <strong>2.</strong>5–5 mm,<br />
4–8 mm) (Zeocem, a.s., Bystré, Slovakia), active carbon<br />
s343<br />
(granularity ≤ 0.1 mm), turf brush PEATSORB and universal<br />
crushed sorbent ECO-DRY (REO AMOS Slovakia) were<br />
used.<br />
Because the experiments were carried out using untreated<br />
AMD (shaft Pech, locality Smolník, Slovakia), which is<br />
very unstable, new sampling of AMD for every experiment<br />
was realised. Copper removal efficiency by sorptive materials<br />
was tested at laboratory temperature under static conditions.<br />
5 g zeolites, 1 g active coal, 5 g turf brush PEATSORB and<br />
5 g universal crushed sorbent ECO-DRY, were overflowed<br />
with 100 ml of raw AMD for 24 h, then the mixtures were<br />
filtrated.<br />
The dependence of Cu concentration decreasing on time<br />
(1; 3; 5; 10 min) was investigated under dynamic conditions<br />
using turf brush PEATSORB. In filtrate was determined pH<br />
(METTLER TOLEDO) and Cu by Bicinchoninate method<br />
(Colorimeter DR 890, HACH LAnGE). Test of Cu precipitation<br />
in AMD was carried out by raw AMD samples of 100 ml,<br />
each were titrated to pH end points ranging from 4 to 8 using<br />
naOH (0.5 mol dm –3 ). During titration, the AMD solution<br />
was continuously stirred and the pH was monitored. When<br />
the preset pH end point was reached, the titrated solution was<br />
filtered to remove precipitated metals. The filtrate was used<br />
for characterizaton of copper solubility as a function of pH.<br />
Results and Discussion<br />
The untreated AMD (pH 3.72, Cu <strong>2.</strong>22 mg dm –3 ) was<br />
taken for adsorption efficiency determination of various sorbents.<br />
In Table I efficiencies of used sorbents on Cu removal<br />
from AMD are presented. In case of zeolite (<strong>2.</strong>5–5.0 mm),<br />
there was irregularity obserwed because the best adsorption<br />
effect was expected in the finest one. This fact can be explained<br />
as the structure faillure of the finest zeolite by acidity of<br />
environment. Turf brush PEATSORB was the most efficient<br />
(54.5 %) from tested sorbents.<br />
Table I<br />
Efficiency of various sorbents on Cu removal<br />
adsorbent pH Cu [mg dm –3 ] efficiency [%]<br />
zeolite (0.5–1.0 mm) 3.5 1.94 1<strong>2.</strong>6<br />
zeolite (<strong>2.</strong>5–5.0 mm) 3.7 1.79 19.4<br />
zeolite (<strong>2.</strong>5–5.0 mm) 3.6 1.93 13.1<br />
active coal 4.3 1.98 10.8<br />
ECO DRY 3.7 <strong>2.</strong>17 <strong>2.</strong>2<br />
PEATSORB 3.1 1.01 54.5<br />
All used sorbents resulted in slightly pH decrease (exepting<br />
active coal) that was positive fact because as it is seen in<br />
Fig. 1. pH above 4 is connected with precipitation of copper<br />
(for AMD pH 3.92, Cu 1.38 mg dm –3 ).<br />
As Fig. <strong>2.</strong> shows 55.8 % of copper were removed after<br />
3 minutes and the longer time of stirring wasn’t efficient. The<br />
pH decreasing can be explained as ion exange process by<br />
humic acid in turf brush 4 .
Chem. Listy, 102, s265–s1311 (2008) Environmental Chemistry & Technology<br />
Fig. 1. Influence of pH on Cu precipitation from AMD<br />
Fig. <strong>2.</strong> Dependence of Cu removal from AMD versus adsorption<br />
time<br />
Conclusions<br />
This study shows possibility of the natural adsorbents<br />
utilisation for Cu removal from acid mine drainage. Turf<br />
brush PEATSORB was the most efficient for copper removal<br />
– decreasing of Cu concentration in AMD was about 54.5 %<br />
under static conditions and 55.8 % in stirred sample during<br />
s344<br />
Fig. 3. Dependence of ph change during Cu removal from<br />
AMD by PEATSORb<br />
3 minutes. Based on experimental results we can state that<br />
chosen adsorbents haven’t influenced pH increasing above 4<br />
excepting active coal hence the Cu removal can be the result<br />
of adsorption proces.<br />
This work has been supported by the Slovak Research<br />
and Development Agency under the contract No. APVV-51-<br />
027705<br />
REFEREnCES<br />
1. Lintnerová, O., et al: Geologica Carpathica. 57, 311<br />
(2006).<br />
<strong>2.</strong> Deorkar, n. V., Tavlarides, L .L.: Environ.Prog. 17, 120<br />
(1998).<br />
3. Kadukova, J., et al: Acta Metallurgica Slovaca. 12, 174<br />
(2006).<br />
4. Panday, A. K., et al: Ecotoxicology and Environmental<br />
Safety. 47, 195 (2000).
Chem. Listy, 102, s265–s1311 (2008) Environmental Chemistry & Technology<br />
P06 INFLuENCE OF ThE COMPOSITE SORbENT<br />
ON ThE CONTENT OF SELECTED ELEMENTS<br />
IN ThE SEDIMENT LOAD OF ThE wATER<br />
RESERVOIR AND SLuDGE bED<br />
Ján BREHUV, OľGA ŠESTInOVá, TOMISLAV<br />
ŠPALDOn, PAVEL SLAnČO, JOZEF HAnČUľáK and<br />
ERIKA FEDOROVá<br />
Institute of Geotechnics of Slovak Academy of Sciences, Watsonova<br />
45, 045 53 Košice,<br />
brehuv@saske.sk<br />
Introduction<br />
Sediment load of the streams and water reservoirs<br />
(hereinafter as WR) are a result of erosive and sedimentation<br />
processes of the respective basins. The term “sediment load”<br />
is used in hydrology according to the norm actually in force 1 .<br />
Geology and geochemistry 2 use the terms “river and bottom<br />
sediments”. The mining waste deposited in mine sludge beds 3<br />
constitute a residue of mining and treatment processes. Pollution<br />
of WR with sediment load causes problems in the decreasing<br />
of water content in the WR 4 aggravating the protection<br />
of the surrounding territory against floods, etc. That is why<br />
the sediment load (bottom sediments) need to be removed<br />
from the WR 5 . Due to great amounts of sediments it needs to<br />
be decided not only on how to extract the sediments, but also<br />
on how to store or dispose of them.<br />
Sludge beds are objects where waste created at mining<br />
extraction of raw materials and mainly created as a result of<br />
the following treatment technologies is deposited or sedimented.<br />
They are designed and built so that they do not constitute<br />
a danger for the surrounding environment. Despite the<br />
facts mentioned above the unwilling seepage of waters from<br />
the sludge beds to the ground water occurs. The waters from<br />
the sludge bed draining containing various elements flow<br />
into the surface streams. Depending on their level of contamination<br />
by various elements, mainly heavy metals (HM)<br />
the water in the surface streams and then their sediments are<br />
contaminated 6,7 .<br />
The sediment load of streams and reservoirs may be<br />
classified as hydromorphic, subhydric soils 8 . However, there<br />
is a difference resting in the method of their contamination<br />
by various elements. They are situated in a different aquatic<br />
environment and catch contaminants from several sources.<br />
They are contaminated by a wider spectrum of elements than<br />
soils what makes their use 9 or treatment more complicated.<br />
That is fully true also about the sediment load and the mining<br />
waster in the basins of the Hornád River (Fig. 1.) treatment<br />
of which is using a composite sorbent is the subject of this<br />
paper (poster).<br />
The literature proves that only the treatment of drinking<br />
waters 10 , industrial waters 10,11 and soils using natural zeolites<br />
was successful. There are published results of an experimental<br />
testing of other natural materials, but they relate to soil treatment<br />
12,13 only. However, it seems that there is a need to find<br />
a specific technological procedure with a specific sorbent 14<br />
s345<br />
Fig. 1. Situation map of the hornad river basin<br />
for the treatment of soil, sediment or mining waste deposited<br />
on the dumping sites (dumps) or sludge beds (Fig. <strong>2.</strong>) for<br />
a longer period of time.<br />
Fig. <strong>2.</strong> Situation map of the dumps localities in hornad river<br />
basin<br />
Experimental works<br />
The most suitable solution of the problem of HM contaminated<br />
sediments should be their extraction after previous<br />
solution of reduction of the content or stabilization of<br />
dangerous HM contained in the sediment load (bottom sediments).<br />
That is why the first laboratory experiments were<br />
carried out at the beginning of 2007 monitoring the impact<br />
of the inorganic composite sorbent to reduce the content or<br />
stabilization of the elements in the sediment load of the water<br />
reservoir “Ružín I”. According to the producer of this sorbent<br />
it is made from natural raw materials. It is mixture of atomically<br />
clays, smectite basalt tuffs, alginate, dolomite, gypsum,<br />
zeolite, coal and others. Proportion of individual components<br />
is trade secret. Qualitative mineralogical analysis of this<br />
sorbent was made by X-ray diffraction analysis. It contain<br />
amorphous phase, calcite ( > 15 %) as dominant minerals<br />
and quartz, sericite, chlorit-caolinite, dolomite (3–15 %)
Chem. Listy, 102, s265–s1311 (2008) Environmental Chemistry & Technology<br />
as accompanying minerals. The impact of the mentioned sorbent<br />
on the reduction of the Hn content in the sediment load<br />
was observed in laboratory conditions in compliance with the<br />
producer’s recommendation in form of a 120 and 333 days<br />
experiment<br />
The procedure of the 120-day experiment was as follows.<br />
First, 9.5 g of the sediment were weighted and 0.5 g<br />
of the sorbent added corresponding to 5 per cent by weight.<br />
The samples were put in 250 ml PVC bottles for 120 days and<br />
poured with 10 ml of the destilled water. After expiration of<br />
120 days to each of the samples a 100 ml of 2M HnO 3 were<br />
added as a leaching agent. Then, the samples were shaken for<br />
6 hours and sedimented for 1 hour.<br />
A similar procedure was carried out in connection with<br />
the 333 days experiment. First 9.5 g of the sediment were<br />
weighted and 0.5 g of the mentioned sorbent added corresponding<br />
to 5 per cent by weight in accordance with producer´s<br />
recommendation. The samples were put in 250 ml PVC bottles<br />
for 333 days and poured with 10 ml of the destilled water.<br />
After expiration of 333 days to each of the samples a 100 ml<br />
of 2M HnO 3 were added as a leaching agent. Then, the samples<br />
were shaken for 6 hours and sedimented for 1 hour.<br />
In both cases the contents of selected elements Cu, Cr,<br />
ni, Pb and Zn were ascertained using AAS methods. For<br />
determination of the content of Cu and Zn flame atomic<br />
absorption spectrometry and for Cr, ni and Pb graphite tube<br />
atomizer were used.<br />
Results and Discussion<br />
The results of the experiment when the composite sorbent<br />
affected the samples of sediment load from water reservoir<br />
for 120 and 333 days are contained in Table I.<br />
The results of the experiment when the composite sorbent<br />
affected the samples of mining waste from sludge bed<br />
for 120 and 333 days are contained in Table II.<br />
The content of elements of ni, Cr and Pb in the samples<br />
marked like 1C–4C as well as in the samples containing the<br />
composite sorbent (CS) is under the lowest limit TV, norm for<br />
environment 15 and that is why the results are not in Table I<br />
and are not commented. The remaining samples marked like<br />
120 d CS have shown the decrease of Cu from 4.53 to 8.20 %<br />
and from 11.55 to 38 % for Zn after 120 days. After 333 days<br />
the decrease of the content of Cu was ascertained from 5.55<br />
to 15.83 % and Zn showed the content decrease from 11.26<br />
to 37.1 %.<br />
The cont ent of ni and Cr in procured control samples<br />
(C) as well as in samples containing the composite sorbent<br />
(CS) was under the lowest limit TV, of the norm for environment15<br />
and that is why the results are not commented.<br />
The remaining samples marked as CS have shown the<br />
decrease of Cu from 7.25 to 11.65 %, Pb from 7.10 to 13.81 %<br />
and Zn from 15.36 to 19.68 % after 120 days. After 333 days<br />
the decrease of the content of Cu was ascertained from 11.23<br />
to 14.76 %, Pb from 5.87 to 11.57 % and the content of Zn<br />
decreased from 7.67 to 9.81 %.<br />
s346<br />
Table I<br />
Influence of composite sorbent on content of heavy metals of<br />
sediment load from the water reservoir<br />
Sample<br />
Cu<br />
[mg kg<br />
Zn<br />
–1 ]<br />
1 C 151 76.4<br />
120 d CS 140.5 (7 %) 47.35 (38 %)<br />
333 d CS 127.1 (15.83 %) 48.05 (37.1 %)<br />
max. % of decrease 15.83 38<br />
2 C 168 386.8<br />
120 d CS 157 (6.55 %) 306.6 (20.57 %)<br />
333 d CS 14<strong>2.</strong>9 (14.94 %) 311.7 (19.25 %)<br />
max. % of decrease 14.94 20.57<br />
3 C 48.8 54.9<br />
120 d CS 44.8 (8.20 %) 36.3 (33.88 %)<br />
333 d CS 44.0 (9.84 %) 38.8 (29.33 %)<br />
max. % of decrease 9.84 33.88<br />
4 C 342 310.8<br />
120 d CS 326.5 (4.53 %) 274.9 (11.55 %)<br />
333 d CS 323 (5.55 %) 275.8 (11.26 %)<br />
max. % of decrease 5.55 11.55<br />
1C–4C control sample of sediment load without composite<br />
sorbent;<br />
120 d CS a 333 d CS – samples of sediment load with composite<br />
sorbent after 120 and 333 days<br />
Table II<br />
Influence of the composite sorbent on the content of heavy<br />
metals in the waste from the mining sludge bed<br />
Sample<br />
Cu Pb<br />
[mg kg<br />
Zn<br />
–1 ]<br />
Dam C 103 1,296 1,382<br />
120 d CS<br />
91<br />
(11.65 %)<br />
1,117<br />
(13.81 %)<br />
1,110<br />
(19.68 %)<br />
333 d CS<br />
87.8<br />
(14.76 %)<br />
1,146<br />
(11.57 %)<br />
1,276<br />
(7.67 %)<br />
max. % of dec. 14.76 13.81 19.68<br />
Lagoon C 552 2,351 2,364<br />
120 d CS<br />
512 2,184 2,001<br />
(7.25 %) (7.10 %) (15.36 %)<br />
333 d CS<br />
490<br />
(11.23 %)<br />
2,213<br />
(5.87 %)<br />
2,132<br />
(9.81 %)<br />
max. % of dec. 11.23 7.10 15.36<br />
C – control sample from the mining sludge bed without composite<br />
sorbent<br />
120 d CS a 333 d CS – samples with composite sorbent<br />
Application of the composite sorbent also decreased the<br />
contents of Cu, Pb and Zn in both samples but the percentage<br />
of the content of HM is insignificant. Due to very significant<br />
exces of the content of Cu, Pb and Zn compared to the highest<br />
limit – IV, of the norm for environment 15 . Recycling of<br />
the waste deposited in the sludge bed should be considered
Chem. Listy, 102, s265–s1311 (2008) Environmental Chemistry & Technology<br />
as more favorable aiming at gaining Cu, Pb and Zn. It has<br />
been the very first experiment and so our opinion may not be<br />
considered as a decisive one.<br />
Conclusions<br />
• When verifying the content of the composite sorbent on<br />
the content of heavy metals in the WR sediment load and<br />
wastes in the sludge bed, the decrease of the content of<br />
Cu, Pb and Zn has been ascertained. The decrease is not<br />
significant. nO other sorbents were used for the experiment<br />
and so composite sorbent cannot be recommended<br />
for the HM decreases.<br />
• A long-term verification is needed for the recommendation<br />
of the application of used sorbent to decrease the<br />
content of HM in sediment load as well as the mining<br />
waste. The results need to be considered as preliminary<br />
and they require further verification in the conditions “in<br />
situ” for the minimum of 2 years.<br />
• Further experiments should focus on the comparison of<br />
the used sorbent with sorbents that are accessible and<br />
experimentally tested, such as zeolites, bentonites, kaolinites<br />
and based on experimental results the most suitable<br />
sorbents should be proposed for the sediment load,<br />
wastes from sludge beds or soil.<br />
• Today, the verification of the respective sorbent is underway<br />
in various foreign institutes. It would be useful to<br />
study the results, if they are published. Later after further<br />
experimental verification it using in our condition<br />
can be recommended.<br />
This paper was made under support of the grant agency<br />
VEGA within the project 2/7045/27 and the Agency for Support<br />
of Research and Development based on Contract No.<br />
APVV-51-027705.<br />
REFEREnCES<br />
1. ČSn 73 65 11: Nomenclature in Hydrology (1.7.1977)<br />
<strong>2.</strong> Šutriepka M.: Geochemical Research of Contamination<br />
of Bottom Sediments of Water Reservoirs of Ružín<br />
and Veľké Kozmalovce. Doctoral Thesis. Faculty of<br />
natural Sciences, Department of Geochemistry of the<br />
Comenius University in Bratislava 2007, 168 s.<br />
3. Peter P. and all: Designing and building up of the sludge<br />
beds. ALFA Bratislava, 312 p.<br />
4. Bobro M. , Brehuv J., Hančuľák J., Merva M.: Development<br />
of Erosive and Sedimentation Processes in<br />
the Water Reservoir Ružín. Final Report. ČÚ B-3 pre<br />
ESPRIT Banská Štiavnica. ÚGt SAV Košice, October<br />
1996.<br />
s347<br />
5. Brehuv J., Bobro M., Hančuľák J.: Distribution of Several<br />
Risk Elements in the Sediments of the Water Reservoir<br />
Ružín I. Acta Montanistica Slovaca. Year 2 3/1997,<br />
TU Košice, p. 295-297. ISSn 1335-1788.<br />
6. Brehuv J.: Contamination of Sediments of the Water<br />
Reservoir Ružín I by heavy metals in Relation to Slime<br />
Pits. Acta Montanistica Slovaca. Košice, Vol.5, 3/2000,<br />
p. 306-309. ISSn 1335-1788. 1.<br />
7. Šutriepka M.: Contamination of Bottom Sediments of<br />
Selected Water Reservoirs by Potentially Toxic Elements:<br />
Workshop: “Creation and Assessment of Dangerous<br />
Mining Pollution“ Modra-Harmónia, 15. – 17. 5.<br />
2006. KÚ, Prír. fak. Bratislava.<br />
8. Hraško J: Soil Analyses. Slovenské vydavateľstvo<br />
pôdohospodárskej literatúry, Bratislava, 196<strong>2.</strong><br />
9. Bobro M., Brehuv J., Hančuľák J., Slančo P., Špaldon<br />
T., Šestinová O., Lucová K.: FinalReport – Quality<br />
and Quantity Research Related to Sediments and Erosive<br />
Processes in the Basin of Hornád and Hnilec to the<br />
Water Reservoir Profile of Ružín I. in 2002 –2005 - for<br />
Slovenský vodohospodársky podnik š.p. Banská Štiavnica,<br />
Odštepný závod Košice. ÚGt SAV Košice, október<br />
2006. 56 s.<br />
10. Horváthová E.: Ion Exchange on Natural Zeolites in<br />
the Technologies of Water Treatment and Cleaning.<br />
Research Institute of Water Economy, Bratislava, 1990,<br />
69.s.<br />
11. Jablonovská K., Štyriaková I.: Absorption of Zinc and<br />
Lead to Clay Minerals. Acta Montanistica Slovaca, 11,<br />
Mimoriadné číslo 2, 304 (2006).<br />
1<strong>2.</strong> Szabová T., Bugel M., Leščinská M.: Possibility of the<br />
Use of Zeolites in the Protection of Environmental Components.<br />
Acta Montanistica Slovaca. Ročník 4, 1/1999,<br />
p. 61-65.<br />
13. Reháková M., Čuvanová S., Gavaľová Z., Rimár J.:<br />
Chem. Lett. 97, 260 (2003).<br />
1<strong>2.</strong> Decision of the Ministry of Environment of the Slovak<br />
Republic on the Highest Tolerated Values of Harmful<br />
Substances in the Soil and on Identification of Organisation<br />
Eligible to Assess Real Values of those Substances<br />
No. 531/1994-540. (1994)<br />
14. Kafka Z., Punčochářová J.: Chem. Lett. 96, 800 (2002).<br />
15. Metodological Instruction of the Ministry of Environment<br />
of the Slovak Republic no. 549/1998-2 for Assessment<br />
of Risks from Pollution of Sediments of Streams<br />
and Water Reservoirs. (1998)
Chem. Listy, 102, s265–s1311 (2008) Environmental Chemistry & Technology<br />
P08 ENGLISh FRO ChEMISTS CAN bE PhuN<br />
GABRIELA CLEMEnSOVá<br />
Faculty of Chemistry, Brno University of Technology, Purkyňova<br />
118, 612 00 Brno, Czech Republic,<br />
clemensova@fch.vutbr.cz<br />
“To teach or not to teach any special English tailored to<br />
serve a particular profession which in our case means English<br />
for chemists? ...Isn’t deep, substantial knowledge of general<br />
English everything one needs to be able to communicate?”<br />
Such questions are often ask by many a technically oriented<br />
colleague I meet at my workplace. To answer them,<br />
I always remember Elaine Horowitz, PhD from the School<br />
of Education of UT at Austin (TX). She openes her doctoral<br />
classes on Foreign Language Acquisition with the following<br />
definition of language competence:<br />
“Foreign language competence can be defined as the<br />
ability of authentic self presentation in that language. In other<br />
words, you can be called competent in L2 if the level of your<br />
education is reflected in the way you use this language. That<br />
means if a native speaker finds out who you are from the way<br />
you communicate.”<br />
Accepting this approach to competency we can say with<br />
confidence that English for specific purposes has its irreplaceable<br />
position in a postsecondary curriculum.<br />
ESP may not always focus on the language of one specific<br />
discipline or occupation, but it is supposed to introduces<br />
students to common features of academic discourse in the<br />
sciences or humanities, frequently called English for Academic<br />
Purposes (EAP),<br />
I would like to communicate some ideas and experience<br />
of teaching ESP classes at the Faculty of Chemistry of BUT.<br />
Our mission of teaching English for future chemists is more<br />
or less challenged by these phenomena:<br />
(i) Absence of appropriate teaching materials on the<br />
market. We have not found any material in bookstores which<br />
would fit our specific needs and could be used as an English<br />
textbook for the chemistry students. (This said with no intention<br />
to blame any bookstore, of course!)<br />
(ii) The different language experience of the students<br />
who come to our school. Their language proficiency often<br />
ranges from the true novice level to the advanced. The beginners<br />
and lower intermediate students have the possibility to<br />
attend two semesters of general English classes before they<br />
register for ESP. However, the different level of their language<br />
knowledge in the ESP classes cannot be fully eliminated<br />
as you could hardly expect them to make the leap from<br />
the beginner level to the upper intermediate or even advanced<br />
one in one year.<br />
(iii) The absolute majority of our students strongly<br />
oppose and almost detest memory based learning as they are<br />
used almost entirely to rely on their ability of logical reasoning.<br />
(“We would not have been here at BUT if we had<br />
been able to memorize. If we had been able to memorize, we<br />
would sure have studied law or humanities!)<br />
s348<br />
(iv) Students, especially in the previous years, had often<br />
a feeling that English was not their major specialization.<br />
That they did not come here to study English but chemistry.<br />
Despite the gradual change in this approach, there are always<br />
some who enter to the English classroom saying: “We are<br />
so tired from the previous instructions ...,” The laboratory<br />
classes we have just had were so tedious...”, We are just after<br />
organic chemistry/physics, math, … classes and tests, absolutely<br />
drained both intellectually and physically, please, do not<br />
want us to talk…” etc, etc.<br />
(v) Last but not least challenge is that the technically<br />
oriented students are not such good “natural speakers” even<br />
in their mother language as the students of the humanities.<br />
(“My goodness gracious, I do not know what to say even in<br />
Czech. And now you want me to communicate it in English<br />
on top of it…!”)<br />
What have we done to cope with the above mentioned<br />
challenges?<br />
Ad (i) The first step to overcome the gap in the teaching<br />
materials on the market was the creation and implementation<br />
of the teaching material of our own. At the earlier stages of<br />
our professional lives at our school we always prepared handouts<br />
and distributed them at the beginnings of the lessons.<br />
The dramatic change in our work occurred when the internet<br />
was installed into most of our classrooms. The availability of<br />
this medium made a great stimulus for us to create an internet<br />
based textbook which we called English for Chemists www.<br />
fch.vutbr.cz/ang<strong>2.</strong> When creating this material we had the<br />
following objectives in minds:<br />
The structure of our faculty – it is reflected in the selection<br />
of the topics as the subject matter of the individual lessons<br />
corresponds with the specialization of our institutes...<br />
Proportional balancing of the lesson content so that all<br />
four major skills could be developed equally. The use of 4<br />
different icons (indicating writing, talking, listening and<br />
reading) to label the individual exercises gives us a quick<br />
orientation.<br />
We tried hard to bring sound into the reading activities. –<br />
Why do we emphasize sound so much? Everybody will agree<br />
that priority number 1 in foreign language instructions is to<br />
reach fluency. Fluency can be defined as the ability to understand<br />
and speak instantly, e.g. without translating. Fluency<br />
enables us to talk easily with native speakers. They easily<br />
understand us and we easily understand them The only way<br />
how to reach it goes through listening. That means we shall<br />
not get fluency in English just by reading English articles<br />
or learning grammar rules. To become fluent, students must<br />
have a lot of understandable, repetitive listening. It means,<br />
they will not learn English only with their eyes, but they<br />
must learn English with their ears. It is important to know<br />
that powerful listening must be repetitive and understandable<br />
(A. J. Hoge). We managed to answer this demand by the following<br />
ways:<br />
•<br />
the reading sections of the textbook have been vocalized<br />
by a native lecturer
Chem. Listy, 102, s265–s1311 (2008) Environmental Chemistry & Technology<br />
•<br />
•<br />
each vocabulary section is competed with a hyperlink<br />
going to Merriam-Webster on-line dictionary which is<br />
soundtracked<br />
each lesson is completed with a substantial number of<br />
hyperlinks going to various sound tracked specific articles,<br />
animations, video recordings, demonstrations etc.<br />
that can be utilized for this purpose.<br />
Exposing students to the culturally authentic sources as<br />
much as possible. (e.g. videotapes, radio and TV broadcasts,<br />
films, songs etc.) – this material has long been advocated<br />
by foreign language educators as stimulating pedagogical<br />
aids. One of the best sources of the authentic materials for<br />
classroom instructions is the Internet. Target language sites<br />
accessed through the Internet offer both teachers and students<br />
a wealth of authentic materials. The advantage of such<br />
materials is that they are current and readily available. Their<br />
topicality can be easily maintained by the regular visits of<br />
these web sites. That is why we completed the individual lessons<br />
with hyperlinks going to various specific video sections,<br />
songs, soundtracked animations, classroom instructions etc.<br />
However, it is important to remember, that the documents<br />
found on the Web, like all authentic materials, have<br />
been created by and for native speakers of the language.<br />
That means they are not written with the language learning<br />
in mind. For this purpose we assessed these documents from<br />
the perspective of their general understandability first. Then<br />
we have completed these materials with the tasks that suit<br />
even the less proficient students.<br />
Ad (ii) The different language experience of our students<br />
We tried to meet the needs of the less proficient students<br />
by creating each textbook lesson in two versions. Firstly it<br />
is a printable version which the student will print and bring<br />
with him/ her to the class. Its format leaves plenty of space<br />
for writing down student’s own answers. Secondly, each unit<br />
has also the version completed with the clues to all exercises.<br />
This serves mainly to the less advanced ones to go through<br />
the explain subject matter at home again and check their<br />
answers or possibly to look up the correct answers.<br />
Besides, each lesson is ended with a short self test enabling<br />
the students to evaluate their comprehension.<br />
Ad (iii) Unwillingness to learn vocabulary and idioms<br />
by memorizing<br />
Experts say that most of people must hear a new word<br />
30 times to remember it forever. To know a word and instantly<br />
understand it, you probably need to hear it 50–100 times. The<br />
students must know that it is not enough to listen to a new<br />
word just once or twice. As the time allocation of our classes<br />
do not allow to practice repetitive listening to much at school,<br />
the students are strongly recommended to go to all the listening<br />
material again at their leisure, e.g. at home, and repeat<br />
all the listening activities as many times as possible.<br />
Ad (iv) How to engage the students who are tired from<br />
the previous “more important” classes? The answer is: make<br />
the English for chemists fun.<br />
s349<br />
Here the Internet makes a great aid again. We can use<br />
various science/chemistry oriented humor, interactive quizzes,<br />
crossword puzzles and various songs created by native<br />
students and teachers with the aim to bring fun and entertainment<br />
into their chemistry classes. Songs make excellent<br />
memory boosters. AS most people have strong musical<br />
memory, we take can advantage of this fact to make memorization<br />
and learning easier. Putting words to music instantly<br />
makes those words more memorable.<br />
Besides memorizing song verses our learners can profit<br />
from retelling the jokes, playing memory boosting quizzes<br />
(e.g. flash cards), solving crosswords etc.<br />
This can be effectively completed with the popular game<br />
based on the repetition of the words. Everybody who has ever<br />
visited a language school will sure the remember the game<br />
called: In our local super market we can buy/I will pack into<br />
my suitcase … Its variations on the premises of our school<br />
sound: In our chemistry laboratory we have … (the names<br />
of various laboratory equipment follow) .../Breathing carbon<br />
monoxide will cause… (Symptoms of CO poisoning)/Iodine<br />
deficiency causes… etc, etc.<br />
Ad (v) Shyness to speak<br />
During a semester students must prepare their own mini-<br />
presentations to meet one of the necessary conditions of getting<br />
a credit. Prior this activity they are provided with all the<br />
necessary phrases and expressions so that they learn how<br />
to address the audience, introduce themselves, express the<br />
purpose of the paper/presentation, signpost the presentation,<br />
move on in the course of it, describe the pictures, verbalize<br />
graphical data, ask checking-up questions, invite questions,<br />
finish the presentation… Though the students are encouraged<br />
to use the topics which have been explained in the classes,<br />
they widely use the Internet again as a rich source of additional<br />
information.<br />
We managed to incorporate two funny chemistry oriented<br />
dramas into a lesson. The plays come from the Internet<br />
and where created by the native authors without the language<br />
learning objective. However, our students find them<br />
very entertaining and participate enthusiastically in dramatic<br />
readings.<br />
This activity also fits a multilevel class as the students<br />
are given the freedom in adapting the sentences. So the less<br />
advanced can make their entries less complicated and simpler,<br />
while the more advanced ones enjoy the full versions of<br />
their roles. Dramatization engages students emotionally and<br />
socially, as well as intellectually. The students thoroughly<br />
enjoy it, and it leaves strong, memorable impressions which<br />
can later help recall and improve learning. Thus at the end of<br />
the activity they are able to repeat various catch phrases by<br />
heart (e.g. thanks to the plays “Becoming an alcohol – a sad<br />
story of good oxygen becoming bad”, or “Electrophilic Addition”<br />
they will long remember structures as: “My mom has<br />
always warned me against organic acids”, “It is against the<br />
rule. What rule? Markovnikov’s rule!” Aren’t my electrons<br />
good enough for you? “Along comes electron hogging
Chem. Listy, 102, s265–s1311 (2008) Environmental Chemistry & Technology<br />
chlorine” “Keep your precious electrons for yourself, you …<br />
!” etc).<br />
The students are encouraged to role play the authentic<br />
professional dialogues videotaped for instructional purposes<br />
as well as those which are found on the ESL web pages.<br />
After all, we can say that English for chemists is pHun!<br />
s350
Chem. Listy, 102, s265–s1311 (2008) Environmental Chemistry & Technology<br />
P09 VOLATILE DEGRADATION PRODuCTS OF<br />
POLyuREThANE FOAMS<br />
DAnIELA MáCOVá, TEREZA TOBIáŠOVá and JOSEF<br />
ČáSLAVSKý<br />
Institute of Chemistry and Technology of Environmental Protection,<br />
Faculty of Chemistry, Brno University of Technology,<br />
Purkyňova 118, 612 00 Brno, Czech Republic,<br />
xcmacova@fch.vutbr.cz<br />
Introduction<br />
Polyurethanes are the world’s sixth most abundant synthetic<br />
polymer. The most of their production represent flexible<br />
polyurethane foams. At the end of their life-cycle they are<br />
often deposited on waste dumps, where they degrade under<br />
the influence of various environmental factors; photodegradation<br />
and hydrolysis are the main routes. After that, their<br />
degradation products can be distributed in the environment.<br />
In common, synthetic polymers are not prone to environmental<br />
degradation. Therefore, they could stay there for a long<br />
time. Their degradability can be improved by addition of the<br />
biodegradable filler.<br />
The generation of volatile products has been reported<br />
from the photo- and thermal degradation of many polymers.<br />
1–4 Complex mixtures of degradation products of this<br />
type were for example identified in starch-based polymers 5 .<br />
Till now, there is no information about volatile compounds<br />
generated during photodegradation of synthetic polyurethane<br />
with biodegradable filler. Several studies have been developed<br />
on the UV degradation of aromatic polyurethane. Such<br />
photo-degradation has already exhibited formation of free<br />
radicals, recombination, scission of bonds, crosslinking and<br />
oxidation reactions 6,7 .<br />
This paper is focused on the identification of volatile<br />
photodegradation product of polyurethanes modified<br />
by biodegradable filler using Solid Phase Microextraction<br />
(SPME) and Gas Chromatography linked to Mass Spectrometry.<br />
The SPME method was selected in the experiment for<br />
its fastness, simplicity and environmental friendness.<br />
Experimental<br />
M a t e r i a l a n d S a m p l i n g<br />
Polyurethane foam modified with biodegradable filler<br />
like carboxymethyl cellulose, acetylated potato starch, cellulose<br />
acetate, 2-hydroxyethyl cellulose and wheat protein<br />
were prepared at the Institute of Material Chemistry at Faculty<br />
of Chemistry, Brno University of Technology.<br />
For sampling of volatile compounds the system consisting<br />
of quartz tube with Teflon cover and two SPME holders,<br />
the first with polyacrylic fibre (PA) 85 µm and the second with<br />
polydimethylsiloxane fibre (PDMS) 100 µm (both Supelco,<br />
USA) and UV lamp (high-pressure mercury discharge tube,<br />
λ = 254 nm), was set-up. The system is shown on Fig. 1.<br />
s351<br />
Fig. 1. System for sampling of VOCs formed by photodegradation<br />
of polymer<br />
G C - M S a n a l y s i s<br />
Separation and identification of volatile compouds from<br />
UV-induced polyurethane foam photodegradation was realized<br />
using Agilent 6890n gas chromatograph coupled with<br />
Agilent 5973 mass selective detector (Agilent Technologies,<br />
Germany). HP-5MS column 30.0 m × 0.25 mm × 0.25 μm<br />
was used for the separations. The injector and transfer line<br />
temperature was 270 °C. The GC oven temperature program<br />
for PDMS fibre was: 4 min at 40 °C, then increased<br />
at 15 °C min –1 to 100 °C, then 8 °C min –1 to 270 °C, then<br />
15 °C min –1 to 280 °C. For the compounds desorbed from<br />
PA fibre the column temperature program was slightly modified:<br />
4 min at 40 °C, increased at 10 °C min –1 to 230 °C, then<br />
15 °C min –1 to 280 °C. Injection/desorption of analytes from<br />
SPME fibres was realized in splitless mode. Helium was used<br />
as the carrier gas at a constant flow of 1 ml min –1 . Ion source<br />
temperature was 230 °C, electron ionization at 70 eV was<br />
used. Quadrupole analyzer of the MSD was operated in scan<br />
mode within a range 30–550 amu, solvent delay was 4 min.<br />
Identification of separated compounds was based on nIST 05<br />
spectral library search.<br />
Results<br />
Seven types of polyurethane foams with different fillers<br />
and reference foam without filler were irradiated by UV lamp<br />
during this study. Volatile compounds were sorbed on PA and<br />
PDMS fibers and desorbed, separated and detected by GC-<br />
MS technique.<br />
All identified compound are listed under chromatograms<br />
(Figs. <strong>2.</strong> and 3.). Many various compounds have been<br />
identified.<br />
Group of branched and non-branched aliphatic hydrocarbons<br />
containded: pentadecane, hexadecane, heptadecane,<br />
2,6,10,14-tetramethylpentadecane, 2,6,10,15,19,23-hexamethyl-2,6,10,14,18,22-tetracosahexaene<br />
(Squalene). These<br />
compounds are probably formed by homolysis of bonds in<br />
soft part of polyurethane.<br />
Group of ketone and fatty acid esters contained: 6,10dimethyl-5,9-undecadiene-2-one,<br />
methylester of dodecanoic<br />
acid and isopropylester of tetradecanoic acid.<br />
By photo-oxidation of alkenes hydroperoxides were<br />
formed – 1,3-dioxane and 2-methyl 1,3-dioxane.
Chem. Listy, 102, s265–s1311 (2008) Environmental Chemistry & Technology<br />
Fig. <strong>2.</strong> Volatile degradaction products of polyurethane foam<br />
sorbed on PDMS fibre<br />
1: 2-methyl-1,3-dioxane, 2: 2,4-diisocyanatotoluene, 3: 6,10dimethyl-5,9-undecadiene-2-one,<br />
4: 2,5-diterc-butyl-1,4-benzochinone,<br />
5: pentadecane, 6: hexadecane, 7: 2,6-bis(1,1-dimethyethyl)-4-(1-oxopropyl)phenol,<br />
8: 1-methylester dodecanoic<br />
acid, 9: 4-decyl-morphline, 10: heptadecane, 11: 2,6,10,14-tetramethylpentadecane,<br />
12: isopropylester tetradecanoic acid,<br />
13: 4-undecyl-morpholine, 14: N,N-dimethyl-1-hexadecanamine,<br />
15: 4-tetradecyl-morpholine, 16: squalene, 17: 4-hexadecyl-morpholine<br />
Also nitrogen derivates were detected, namely line of<br />
alkyl-substitued morpholines and n,n-dimethyl-1-hexadecanamine.<br />
By the photolysis of hard segment of polyurethane foam<br />
2,5-diterc-butyl-1,4-benzochinone, 2,6-bis(1,1-dimethyethyl)-4-(1-oxopropyl)phenol<br />
and 2,4-diisocyanatotoluene<br />
(2,4-TDI) were formed.<br />
2,4-TDI is very volatile and toxic. The compound is<br />
used as main reagent at synthesis of polyurethane. 2,4-TDI<br />
was detected in case of all polymers modified by celulose<br />
derivate fillers. It is difficult to say whether that compound is<br />
photodegradation product of polyurethane foam or unreacted<br />
raw material residue. It will be studied in the next research.<br />
All the compounds were detected in most polyurethane<br />
samples. There was observed qualitative change only.<br />
Quantitative differences were found in the case of minority<br />
distribution compounds. Their identification using library<br />
search in nIST 05 was unsuccessful in most cases. Probably<br />
small concentrations of analyte and resulting low-intensity<br />
mass spectra could be the reason, or – due to specific character<br />
of volatile compound made by irradiation of polyurethane<br />
foam – their mass spectra are not included in this library.<br />
PA fibre shows higher selectivity in comparison with<br />
PDMS fibre which in opposite gives more complex information<br />
about volatile compounds formed during photodegradation<br />
of polyurethane.<br />
s352<br />
Fig. 3. Volatile degradaction products of polyurethane foam<br />
sorbed on PA fibre<br />
1: 2-(2-ethoxyethoxy)-ethanol, 2: 2-ethyl-hexanoic acid, 3: 1,3dioxane,<br />
4: 2-methyl-1,3-dioxolane, 5: 2-methyl-1,3-diisocyanatobenzene,<br />
6: 2,6-bis(1,1-dimethyethyl)-4-(1-oxopropyl)phenol,<br />
7: 4-decyl-morpholine, 8:4-undecyl-morpholine, 9: N,N-dimethyl-1-hexadecanamine,<br />
10: 4-tetradecyl-morpholine, 11: 4-hexadecyl-morpholine<br />
Conclusions<br />
In this study the SPME method was applied for the<br />
identification of volatile compounds formed by irradiation<br />
of polyurethane foams modified by biodegradable fillers. A<br />
wide range of compounds was detected and most of them<br />
were succesfully identified by library search. The identification<br />
of the remaining compounds will be a subject of the next<br />
research.<br />
The finantial support from the project no.MSM<br />
0021630501 from Ministry of Education, Youth and Sport of<br />
the CR is greatly acknowledged.<br />
REFEREnCES<br />
1. Philippart J. L., Posada F., Gardette J. L.: Polym. Degr.<br />
Stab. 285, 49 (1995).<br />
<strong>2.</strong> Albertsson A. Ch., Karlsson S.: Polym. Degr. Stab. 245,<br />
41 (1993).<br />
3. Khabbaz F., Albertsson A. Ch., Karlsson S.: Polym.<br />
Degr. Stab. 329, 61 (1998).<br />
4. Carlsson D. J., Krzymien M., Worsfold D. J., Day M.: J.<br />
Vinyl. Add. Techn. 3, 2 (1997).<br />
5. Hakkarainen M., Albertsson A. Ch., Karlsson S.: J. chromatogr.<br />
A. 741, 251 (1996).<br />
6. Dannoux A., Esnouf S., Begue J., Amekraz A., Moulin<br />
C.: nucl. Instr. Meth. Phys. Res. B. 236, 488 (2005).<br />
7. Irusta L., Fernandez-Berridi M.J.: Polymer 40, 4821<br />
(1999).
Chem. Listy, 102, s265–s1311 (2008) Environmental Chemistry & Technology<br />
P10 DyNAMIC SIMuLATION OF bIOLOGICAL<br />
NITROGEN REMOVAL PROCESSES<br />
LEnKA ČERnOCHOVá a , Ján DERCO a and MAnFRED<br />
SCHüTZE b<br />
a Faculty of Chemical and Food Technology, Institute of Chemical<br />
and Environmental Engineering, Slovak University of<br />
Technology, Radlinského 9, 812 37 Bratislava, Slovakia,<br />
b ifak – Institut für Automation und Kommunikation e.V. Magdeburg,<br />
Werner-Heisenberg-Str. 1, 39106 Magdeburg, Germany,<br />
lenka.cernochova@stuba.sk<br />
Introduction<br />
With rising requirements for protection water resources<br />
and thereby for quality of effluent wastewater too, more<br />
complex technologies for wastewater treatment are applied<br />
as well. These technologies are characterised by more processes<br />
with different reaction rates and requirements in term<br />
of reaction conditions, interactions and generally by more<br />
complex structure of treatment lines. The complexity of these<br />
systems is also related to mutual interaction between wastewater<br />
treatment plant (WWTP) and others parts of the urban<br />
wastewater system, e.g. sewer system and receiving water<br />
(Derco and Schütze, 2004). Consequently, designing of processes<br />
and technologies and their efficient operation are also<br />
significantly complex.<br />
Mathematical models and simulations programs belong<br />
to prospective and currently more often utilised tools. They<br />
offer a simple way how to analyse changes in technologies<br />
at WWTP by optimisation or intensification already existed<br />
plants or it can help by designing new WWTPs as well.<br />
The results of application of the Activated Sludge Model<br />
no. 1 (ASM1) (Henze et al., 1987) using dynamic simulations<br />
for verification of steady state design with regard to dynamic<br />
behaviour of the WWTP and for prediction dynamic effluent<br />
concentration values are presented.<br />
Dynamic Simulation of wwTP<br />
ASM1 was used for modelling of the biological stage<br />
at real WWTP in nové Zámky (Fig. 1.). Two series of measurements<br />
included diurnal variations of wastewater flow<br />
and composition in input and output at the biological stage<br />
were carried out. The first set of measurement was perfomed<br />
in May 2002, when the nitrification process was operated.<br />
Because of expected more stringent requirements in effluents,<br />
this activated sludge plant was upgraded in 2003 applying a<br />
pre-denitrification system. The second measurements were<br />
realised after the reconstruction (in March 2007). The results<br />
of measurements were transformed into organic and nitrogen<br />
pollution fractions according to structure of the ASM1.<br />
For comparison of the experimental and the calculated<br />
resultant concentration values in the WWTP effluent were<br />
chosen criteria according the Regulation of the Slovak government<br />
(2005). The model ASM1 and the default parameter<br />
values included in the SIMBA program have been used for<br />
s353<br />
performing dynamic simulations. The calculated concentration<br />
values for individual pollutants in daily composite samples<br />
were calculated based on pollutant mass balancess.<br />
Fig. 1. Schemes of wwTP setups; Above: wwTP before reconstruction<br />
(2002); below: wwTP after reconstruction (2007)<br />
Results<br />
M o d e l S u i t a b i l i t y<br />
First step of simulations was to verify suitability of<br />
ASM1 to describe WWTP. From the results (Fig. 2) it can be<br />
concluded that the dynamic simulations describe the experimental<br />
effluent values quite well.<br />
V e r i f i c a t i o n o f S t e a d y S t a t e<br />
D i s i g n b y D y n a m i c S i m u l a t i o n<br />
The purpose was to verify the results of conventional<br />
steady-state design of the WWTP biological stage (Derco et<br />
al, 2004) for future upgrading with regard to expected load in<br />
2036. The data for this scenario were obtained from the operator<br />
of the WWTP – Západoslovenská vodárenská spoločnosť,<br />
a.s. Resulting values (7 mg dm –3 ammonium nitrogen<br />
and 9.3 mg dm –3 total nitrogen) of dynamic simulations are<br />
lower than today’s effluent standards (10 mg dm –3 ammonium<br />
nitrogen and 15 mg dm –3 total nitrogen). It can be summarised<br />
that the steady state design for the WWTP upgrading<br />
Fig. <strong>2.</strong> Effluent concentrations of ammonium nitrogen at<br />
wwTP after reconstruction ( * experimental and – calculated values)
Chem. Listy, 102, s265–s1311 (2008) Environmental Chemistry & Technology<br />
with perspective for 2036 follows also the dynamic effluent<br />
standard values. It can be expected that upgraded WWTP will<br />
meet current legislation also with regard to dynamics of the<br />
processes.<br />
The first task was to investigate what could happen if the<br />
reconstruction in 2003 had not been carried out. The effluent<br />
concentration values are shown in Table I. The load in 2007<br />
and consequently the effluent concentration values are lower<br />
than in 2002 due to industrial activities reduction. This result<br />
could lead to the conclusion that there had been no need for<br />
the reconstruction of the WWTP in 2003. However, because<br />
of the more stringent requirements (Regulation of the Slovak<br />
government, 2005) which permits 10.0 mg dm –3 for ammonium<br />
nitrogen for effluent of WWTP with corresponding load,<br />
it was necessary to carry out the reconstruction. Therefore, it<br />
should be stressed that the WWTP without this reconstruction<br />
would not be able to meet current effluent standards.<br />
The second task was to study what would happen if the<br />
pollution load of actual biological stage of the WWTP increased<br />
to values expected in 2036. The results of dynamic simulations<br />
show that even if the load will increase, the WWTP<br />
will be able to meet current effluent requirements.<br />
Table I<br />
Results of simulations<br />
WWTP 2002 1 st task WWTP 2007 2 nd task<br />
plant layout 2002 2007<br />
load situation 2002 2007 2007 2036<br />
n-nH 4<br />
[mg dm –3 ]<br />
n-nO 3<br />
[mg dm –3 ]<br />
25.06 20.89 0.81 4.05<br />
0 0 7.47 3.91<br />
Conclusions<br />
Two time-variable influent and effluent data sets of wastewater<br />
flow and composition were measured for different<br />
technological arrangements of the WWTP and were applied<br />
for dynamic simulations.<br />
It can be concluded from the work that the mathematical<br />
model ASM1 is suitable for the description of the process<br />
s354<br />
dynamics of the WWTP biological stage. Good fit between<br />
experimental and calculated effluent concentration values<br />
resulted from performed dynamic simulations.<br />
The results of dynamic simulation confirmed the necessity<br />
of the WWTP reconstruction carried out in 2003 in order<br />
to comply with actual legislation requirements.<br />
Compliance with actual effluent limits follows for previous<br />
steady state design and upgrading of the WWTP when<br />
investigating dynamics of the process.<br />
According to results of dynamic simulations it can be<br />
expected that the existing WWTP will comply with actual<br />
discharge standards also for pollution load as expected in<br />
2036.<br />
This work has been supported by the Slovak Grant<br />
Agency for chemical and chemical-technological science<br />
(Grant No. 1/0866/08). The authors would also like to<br />
thank Ľubomír Krcho and Monika Polláková for the help by<br />
acquirement influent, effluent and operational data from the<br />
WWTP.<br />
REFEREnCES<br />
1. Chem. Pap. 56, 117 (2002).<br />
<strong>2.</strong> Derco J., Kovács A., Gulyásová A., Dercová K., Horňák<br />
M.: Reserch report No. 4272, Bratislava, Slovakia,<br />
2002<br />
3. Derco J., Drtil M., Bodík I., Hutňan M.: Technológia<br />
vody a ochrana vodných zdrojov I. Časť. ÚVTIP nitra,<br />
Bratislava 2004.<br />
4. Derco J., Schütze M.: Odpadové vody 2004. Október<br />
20–22, Tatranské Zruby 2004, p. 111<br />
5. Henze M., Grady Jr. C. P. L., Gujer W., Marais G. R.,<br />
Matsuo T.: Activated Sludge Model No. 1, Scientific and<br />
Technical Report no. 1., IAWPRC, London 1987.<br />
6. ifak. SIMBA 5 – Manual. Institut für Automation und<br />
Kommunikation e. V., Magdeburg 2005.<br />
7. Regulation of the Government of the Slovak Republic<br />
n° 296/2005 on Quality Objectives of Surface Waters<br />
and on Limit Values for Pollution Indicators of Waste<br />
Waters and Special Waters.
Chem. Listy, 102, s265–s1311 (2008) Environmental Chemistry & Technology<br />
P11 APPLICATION OF A 6-MERCAPTOPuRINE<br />
FuNCTIONALIZED SORbENT FOR<br />
DIFFuSIVE GRADIENTS IN ThIN FILMS<br />
TEChNIQuE<br />
PAVeL DIVIŠ, ROMAn SZKAnDERA and PETER<br />
MATÚŠ<br />
Brno University of Technology, Faculty of Chemistry, ICTEP<br />
Purkyňova 118, BRNO, 612 00 Czech Republic,<br />
divis@fch.vutbr.cz<br />
Introduction<br />
The diffusive gradients in thin films technique (DGT) 1<br />
is used more than 10 years for determination of kinetically<br />
labile metal species in natural waters, soils and sediments 2 .<br />
However this technique is at the present time validated for<br />
measurement of more than 50 metals, only few attention was<br />
applied to measurement of mercury.<br />
As we reported in our previous studies 3,4 , combination<br />
of agarose diffusive gel together with the sorption gel containing<br />
resin with thiol functional groups is the best choice for<br />
measuring of mercury by DGT. nevertheless, at the present<br />
time there is almost no resin of this type for direct use in<br />
DGT on the market. For DGT, strictly defined size of resin<br />
about 100 μm is used. As the resins available on the market<br />
have particle size about 1 mm, there is need to crush their<br />
particles and separate the required fraction by sieving. This<br />
activity can seriously contaminate the resin or it can change<br />
its properties.<br />
In presented study we try to prepare needful resin by our<br />
self in laboratory. The Iontosorb AV resin (Iontosorb, Czech<br />
Republic) with particle size 50–100 μm was used in advance.<br />
This resin contains free amino group which can be easily diazotated<br />
(Fig. 1.). Resulted diazonium salt can be subsequently<br />
used for raction with specific reagent containing thiol groups.<br />
In this work we used 6-mercaptopurine as this reagent. new<br />
modified Iontosorb AV was characterised in laboratory and<br />
then it was used to prepare sorption gels for DGT technique.<br />
The performance of DGT with modified Iontosorb AV was<br />
then tested in model mercury solution.<br />
Fig. 1. Chemical formula of Iontosorb AV<br />
Experimental<br />
M o d i f i c a t i o n o f I o n t o s o r b A V<br />
R e s i n<br />
Iontosorb AV was modified using diazotation and copulation<br />
reactions 5,6 . The amount of 5 g Iontosorb AV was<br />
washed with hydrochloric acid and then with ultrapure water<br />
to neutral pH. After washing, diazotation was performed at<br />
0–5 °C using 1M solutions of hydrochloric acid and sodium<br />
nitrite. Diazotation was stopped after adding of 40 ml of rea-<br />
s355<br />
gents. Yellow product was filtered out and washed several<br />
time with ultrapure water. Diazonium salt was then placed to<br />
the continuously mixed and cooled reactor containing 3.5 g of<br />
6-mercaptopurine dissolved in 10% (v/w) sodium carbonate.<br />
After 24 h new red-brown product was filtered out, washed<br />
several time with ultrapure water and dryed in exicator.<br />
A n a l y t i c a l C o n t r o l o f n e w<br />
F u n c t i o n a l i s e d R e s i n<br />
Qualitative test was done using an infrared spectroscopy<br />
(Impact 400, nicolet, USA). Infrared spectrum of new functionalized<br />
resin was compared with blank infrared spectrum<br />
of Iontosorb AV.<br />
Fig. <strong>2.</strong> Infrared spectrum of Iontosorb AV (1) and new functionalized<br />
resin (2)<br />
Quantitative test of thiol groups was done by iodometric<br />
titration at pH ~ 9. To 50 mg of modified Iontosorb AV, 25 ml<br />
of 0.001M potassium iodine was added, and after 5 min of<br />
shaking and 30 min of standing in the dark, resulted solution<br />
was titrated by 0.001M ammonium thiosulphate.<br />
T e s t i n g o f n e w F u n c t i o n a l i s e d<br />
R e s i n f o r U s e i n D G T T e c h n i q u e<br />
Sorption gels for DGT technique were prepared by<br />
incorporation of modified Iontosorb AV into the agarose gel.<br />
The amount of 0.2 g of modified Iontosorb AV was added to<br />
a hot agarose solution (4% (v/w)) and the hot solution was<br />
casted between two glass plates separated by 0.4 mm plastic<br />
spacers. The disks 2 cm in diameter were cuted out from the<br />
gels after cooling down and washig of the gel sheets.<br />
Diffusive gels were prepared by similar way, the only<br />
one difference was that clear hot agarose solution (3% (v/w))<br />
and 0.8 mm plastic spacers were used.<br />
The agarose sorption and diffusive gels were used to<br />
assembly the DGT unit. Four DGT units were exposed in<br />
a 5 dm 3 beaker containing well mixed 10 μg dm –3 mercury<br />
solution for 3 h to perform basic DGT test. Simultaneously<br />
to the exposition of DGT units, mercury concentration in the<br />
solution was measured by atomic absorption spectrometry<br />
(AMA 254, Altec, CZ).
Chem. Listy, 102, s265–s1311 (2008) Environmental Chemistry & Technology<br />
Results<br />
Sucessful incorporation of 6-mercaptopurine to Iontosorb<br />
AV was proved by chage in resin colour from white to<br />
red-brown. Infrared spectroscopy has shown a new peak in<br />
Iontosorb AV spectra with wave nuber 2,362 cm –1 (Fig. <strong>2.</strong>).<br />
This is a characteristic peak for thiol groups. The amount<br />
of thiol groups was determined by iodometric titration to be<br />
0.5 mmol g –1 . This should be enough to prevent the saturation<br />
of functional groups when DGT sampling units are deployed<br />
in natural waters. new resin was successfully incorporated<br />
into the agarose gel. The agarose gel as a support for resin<br />
was chosed because of problems associated with commonly<br />
used polyacrylamide gel. In polyacrylamide gel, the new<br />
resin aggregated and it was difficult to prepare homogenous<br />
gel. In agarose gel there was no problem with aggregation of<br />
resin particles. After optimalization of sorption gel preparation<br />
procedure, basic DGT test was performed. Results from<br />
this experiment are shown in Table I. It can be seen that the<br />
difference between real mercury concentration measured by<br />
AAS and mercury concentration calculated from accumulated<br />
mass of mercury in resin gels extracted from DGT sampling<br />
units is less than 10 %. This result matches the requirements<br />
of DGT Research Ltd. for right function of DGT.<br />
Conclusions<br />
This study proved that the 6-mercaptopurine functionalised<br />
Iontosorb AV is useable for measuring of mercury in<br />
natural waters by DGT and it provided useful informations<br />
for further experiments in which better characterization of<br />
new sorbent will be carried out and more extensive investigation<br />
of its use in DGT will be done. For example, experiments<br />
s356<br />
Table I<br />
Results from basic DGT performance test<br />
DGT concentration Real concentration Difference<br />
[μg dm –3 ] [μg dm –3 ] [%]<br />
7.5 8.0 ± 0.4 6<br />
8.2 8.0 ± 0.4 3<br />
8.7 8.0 ± 0.4 8<br />
8.2 8.0 ± 0.4 3<br />
in solutions containing natural ligands and experiments in<br />
real sytems will be realized during the next years and a comparison<br />
with other sorbents usable in DGT will be done.<br />
Acknowledgement: This work has been supported by<br />
grants no. MEB 080813 and SK-CZ-0044-07. Mr. Oldřich<br />
Tokar is acknowledged for providing free Iontosorb AV sample.<br />
REFEREnCES<br />
1. Zhang H., Davison W.: Anal. Chem. 67, 3391 (1995).<br />
<strong>2.</strong> Diviš P., Dočekalová H., Smetková V. : Chem. Listy. 99,<br />
640 (2005).<br />
3. Dočekalová H., Diviš P.: Talanta 65, 1174 (2005).<br />
4. Diviš P., Leermarkers M., Dočekalová H., Gao Y.: Anal.<br />
Bioanal Chem. 382, 1715 (2005).<br />
5. Davies R. V., Kennedy J., Lane E. S., Willans J. L.: J.<br />
Appl. Chem. 8, 68 (1958).<br />
6. Mondal B. C., Das D., Das A. K.: Anal. Chim. Acta 450,<br />
223 (2001).
Chem. Listy, 102, s265–s1311 (2008) Environmental Chemistry & Technology<br />
P12 ThE DETERMINATION OF<br />
METhyLMERCuRy IN wATER ECOSySTEMS<br />
LEnKA TUHOVČáKOVá, HELEnA DOLEŽALOVá<br />
WEISSMAnnOVá, JOSEF ČáSLAVSKý and MILADA<br />
VáVROVá<br />
Brno University of Technology, Faculty of Chemistry, Purkyňova<br />
118, Brno, Czech Republic,<br />
dolezalova@fch.vutbr.cz<br />
Introduction<br />
Alkyl mercury compounds belong to a group of organometallic<br />
compounds with a high bioaccumulation potential.<br />
They are formed from inorganic forms in a methylation<br />
process and exhibit 100 times higher toxicity than inorganic<br />
forms 1 . Methyl mercury is a neurotoxin which attacks the<br />
central nervous system (CnS). The most frequent pathway<br />
by which methyl mercury enters the body is through the gastrointestinal<br />
tract which may absorb up to 95 % of methyl<br />
mercury received by a man via fish meat. It may also penetrate<br />
through the skin. It is well soluble in fat which explains<br />
its transport through blood-brain barrier and diffusion into<br />
cell membranes. It also passes the foetal placenta; the risk<br />
of damage to the foetus occurs at a mercury concentration in<br />
hair as low as 15–20 mg kg –1 . The tolerated dose of mercury<br />
in man is 33 μg per 70 kg of body weight 2,3,4 . Methyl mercury<br />
was responsible for a large number of intoxications in the past.<br />
For example, fish living in water polluted with waste from a<br />
chemical company producing chlorine caused intoxication by<br />
methyl mercury in Japan while mercury intoxications in Iraq<br />
were caused by the grain treated with methyl-mercury-containing<br />
fungicides that was originally intended as seed 5 . Methyl<br />
mercury is the most common organic form occurring in biological<br />
systems. It is soluble in water and is relatively stable.<br />
It passes biological membranes easily and has a long halftime<br />
of decomposition up to 70 days 4 . Methyl mercury has<br />
the highest partition coefficient K ow , which explains its high<br />
affinity towards fat. Methylation is one of the mercury’s most<br />
important environmental reactions. Methylation takes place<br />
in the sediment as well as in sea water and fresh water. The<br />
fastest rate of methylation was observed on the sediment’s<br />
surface that was in contact with water 6,7 .<br />
Experimental<br />
The optimization of the method was carried out using<br />
the Certified Reference Material CRM 464; tuna fish containing<br />
a total amount of THg = 5.24 μg g –1 and methyl mercury<br />
MeHg = 5.5 μg g –1 . The sample weighed 0.1 g. A total<br />
of 5 samples were extracted and each sample was subjected<br />
to three parallel measurements. Extraction was performed<br />
according to the published method 8 . Gas chromatography<br />
was used as the final analytical method. The results of parallel<br />
measurements were evaluated as mean values and their standard<br />
deviation was calculated.<br />
s357<br />
Table I<br />
The conditions of the GC/μECD analysis<br />
Parametrers of GC/μECD<br />
Column DB-608, 30 m × 0.530 mm × 0.5 μm<br />
Injection splitless<br />
Injector temperature 250 °C<br />
Carrier gas He,3 ml min –1 , constant flow<br />
Detector temperature 250 °C<br />
Make-up gas n2, 20 ml min –1<br />
Results<br />
The Certified Reference Material was used particularly<br />
for the determination of metrological parameters of the<br />
method. The mean recovery of extraction was found to be<br />
64.9 ± <strong>2.</strong>0 %. The lower recovery rate as compared to the<br />
literature(ref. 8 ) could be caused by the certified reference<br />
material used which just passed the expiry date. As a result,<br />
the content of methyl mercury might differ from that provided<br />
in the certificate. Fig. 1. shows the chromatogram of<br />
the analysis of MeHg isolated from the certified reference<br />
material.<br />
Fig. 1. Chromatogram for the certified reference material<br />
Table II contains the results of recovery from individual<br />
parallel measurements of methyl mercury levels in the CRM<br />
(Marked as 1–5).<br />
To determine the accuracy of methyl mercury determination<br />
using GC/μECD, 5 parallel measurements of the<br />
certified reference material were carried out. The results are<br />
provided in Table III.<br />
Table II<br />
Recoveries for 5 parallel samples of certified reference materials.<br />
Declared value of MeHg – 5,500 [ng g –1 ]<br />
CRM Mean c MeHg Recovery<br />
peak area [ng ml –1 ] [ng g –1 ] exper. [%]<br />
1 6,163.81 40.05 3,559.60 64.72 ± 0.51<br />
2 7,030.21 45.67 3,653.96 66.44 ± 3.80<br />
3 6,938.18 45.08 3,606.12 65.57 ± 1.71<br />
4 6,884.60 44.73 3,578.27 65.06 ± 0.61<br />
5 6,625.99 43.05 3,443.86 6<strong>2.</strong>62 ± 3.59
Chem. Listy, 102, s265–s1311 (2008) Environmental Chemistry & Technology<br />
Table III<br />
The accuracy of methyl mercury determination using<br />
GC/μECD<br />
Mean level [ng g –1 ] RSD [%]<br />
MeHg 3,568.36 1.79<br />
Conclusions<br />
The method of determining the level of methyl mercury<br />
in fish muscles using GC/μECD was modified. The optimization<br />
of the method was performed using the Certified Reference<br />
Material. On the basis of recovery and accuracy, it was<br />
concluded that the test procedure without sample pre-treatment<br />
can be applied with this method of analysis.<br />
This work has been supported by by the grant No.<br />
6215712402 given by MSMT.<br />
s358<br />
REFEREnCES<br />
1. Remy S., Prudent P., Probst J. L.: Appl. Geochem. 21,<br />
1855 (2006).<br />
<strong>2.</strong> Faro L. R .F., et al.: neuropharmacology 42, 612<br />
(2002).<br />
3. Goméz-Ariza J. L., Lorenzo F., Garcia–Barrera T.: Chemosphere<br />
61, 1401 (2005).<br />
4. Faro L. R. F., et al.: Ecotox. Environ. Safe. 55, 173<br />
(2003).<br />
5. Maršálek P., Svobodová Z.: Czech J. Food Sci. 24, 138<br />
(2006).<br />
6. Carro A. M., Mejuto M. C.: J. Chromatogr. A 882, 283<br />
(2000).<br />
7. Mishra S., et al.: Anal. Chim. Acta 551, 192 (2005).<br />
8. Castillo A., Roig-navarro A. F., Pozo O. J.: Anal. Chim.<br />
Acta 577, 18 (2006).
Chem. Listy, 102, s265–s1311 (2008) Environmental Chemistry & Technology<br />
P13 ECOTOxICOLOGICAL TESTING AND TEST<br />
METhODS OF ChEMICALS<br />
HELEnA DOLEŽALOVá WEISSMAnnOVá, HELEnA<br />
ZLáMALOVá GARGOŠOVá and MILADA VáVROVá<br />
Brno University of Technology, Faculty of Chemistry, Purkyňova<br />
118, Brno, Czech Republic<br />
dolezalova@fch.vutbr.cz<br />
Introduction<br />
Ecotoxicity involves the identification of chemical<br />
hazards to the environment. The Globally Harmonized System<br />
of Classification and Labeling of Chemicals (GHS)<br />
describes testing for hazards to the aquatic environment in<br />
Part 3, Chapter 3.10 (UnECE, 2004a). Annex 8, Guidance<br />
on Hazards to the Aquatic Environment (UnECE, 2004).<br />
Ecotoxicity tests can be classified into two following categories:<br />
standard and alternative tests.<br />
The ecological testing according to US EPA and<br />
UnECE includes many tests; however, several methods of<br />
ecotoxicological testing are used in the Czech Republic. For<br />
the typical standard and alternative aquatic ecotoxicological<br />
tests crustacea (Daphnia magna, Thamnocephalus platyurus,<br />
and Artemia salina), aquatic plant (Lemna minor), algae<br />
(Desmodesmus subspicatus, Scenedesmus subcapitatus, Selenastrum<br />
capricornutum) are used. In accordance with OECD,<br />
UnECE and Czech legislation the standard tests include<br />
these organisms in following tests – Daphnia magna (OECD<br />
Test no. 202: Daphnia sp. Acute Immobilizations Test, En<br />
ISO 6341:1996), Desmodesmus subspicatus (OECD – Test<br />
no. 201: Alga, Growth Inhibition Test, ISO 8692:2004). The<br />
aquatic organism Lemna minor (OECD Test no. 221: Lemna<br />
sp. Growth Inhibition Test, ISO 20079:2005) is application<br />
in OECD and ISO standard methods for the testing of chemicals.<br />
Experimental<br />
The general principle of ecotoxicological tests is the<br />
determination of effective concentration (EC50), eventually<br />
lethal concentration (LC50) or inhibition concentration<br />
(IC50). The limit test corresponds to one dose level of<br />
100 g dm –3 . A stepwise procedure involves four steps: the<br />
limit test, confirmatory test, basic test and definitive test.<br />
These types of studies produce end points such as LC50,<br />
EC50 and nOEC. EC50, LC50 and IC50 are the effective<br />
concentrations (i.e., the concentration of material in water<br />
that is estimated to produce a specifically quantified effect<br />
to 50 % of the test organisms). The EC50 and its 95 % confidence<br />
interval are usually derived by statistical analysis of<br />
a quantal, “all or nothing”, response (such as death, fertilisation,<br />
germination, or development) in several test concentrations,<br />
after a fixed period of exposure. End point means the<br />
variables (i.e., time, reaction of the organisms) that indicate<br />
the termination of a test, and also means the measurement(s)<br />
or value(s) derived, that characterise the results of the test<br />
(EC50). LOEC (lowest observed effect concentration) is the<br />
s359<br />
lowest concentration tested causing a statistically measurable<br />
effect to the test system. nOEC (no observed effect concentration)<br />
is the highest concentration tested causing no statistically<br />
measurable effect to the test system. The parameters<br />
LOEC and nOEC may be statistically determined.<br />
The aim of statistical analysis of ecotoxicological data is<br />
to obtain a quantitative concentration-response relationship<br />
by regression analysis. For this purpose many models could<br />
be used such as: linear interpolation, polynomial regression,<br />
log–logistic regression, probit model, Weibull model, Dunnett<br />
test, William test, Jokheere-Terpstra test.<br />
E c o t o x i c o l o g i c a l T e s t s f o r<br />
D e t e r m i n a t i o n o f E c o t o x i c i t y o f<br />
S t a n d a r d K 2 C r O 4<br />
The standard chemical K 2 CrO 4 was used for the determination<br />
of ecotoxicity, for th estimation of sensitivity of<br />
testing organisms Dapnia magna Strauss, (Daphtoxkit F<br />
magna – standard test) Thamnocephalus platyurus (Thamnotoxkit<br />
F – alternative test) and Lemna minor (standard<br />
test OECD) and for validation and comparison of obtained<br />
results with the declared values. Table I performs the basic<br />
parameters of tests in coordinance with the directive.<br />
Table I<br />
The parameters of tests<br />
Parameters Daphtoxkit Thamnotoxkit Lemna<br />
F F minor<br />
c [mg dm −3 ] 0.32–3.20 0.032–0.320 10–160<br />
T [°C] 22 ± 2 20 ± 2 24 ± 2<br />
I [lx] 6,000 4,000 –<br />
Results<br />
On the base of analysis of obtained ecotoxicological<br />
results for studied tests the values of EC50, LC50 and IC50<br />
were determined for standard chemical K 2 CrO 4 . The experimental<br />
data with the basic statistic characteristics are summarized<br />
in Table II. The EU-Directive 93/67/EEC classifies<br />
substances according to their ecotoxicological value (EC50).<br />
On the base of obtained data from ecotoxicological tests<br />
(crustacea tests Daphtoxkit F and Thamnotoxkit F) the<br />
study chemical belongs to very toxic for aquatic organisms.<br />
The studied chemical K 2 CrO 4 is also toxic to aquatic organisms<br />
for macrophyta Lemna minor.<br />
The Thamnocephalus platyurus was found<br />
as the test organism of highest sensitivity with<br />
LC50 = 0.092 ± 0.002 mg dm –3 . The effective concentration<br />
(EC50/24 h) from Daphtoxkit F for exposure 24<br />
hours was 0.99 ± 0.022 mg dm –3 and the effective concentration<br />
(EC50/48 h) was confirmed 0.79 ± 0.031 mg dm –3<br />
The inhibition concentration for Lemna minor (IC50/168 h)<br />
was calculated from average specific growth rate and confirmed<br />
via percent reduction in yield, IC50/168 h was equal<br />
to 20.52 ± 0.399 mg dm –3 . For validation and confirmation of<br />
experimental data the probit model was used for determina-
Chem. Listy, 102, s265–s1311 (2008) Environmental Chemistry & Technology<br />
tion of ecotoxicological parameters. Calculated values from<br />
probit model and experimental values were in very good correlation<br />
with declared value of tests.<br />
Table II<br />
The ecotoxicity of K 2 CrO 4 (n = 9; concentration in mg dm –3 )<br />
Daphtoxkit F Thamnotoxkit Lemma<br />
EC50/ EC50/ F minor<br />
24 h 48 h LC50/24 h IC50/168 h<br />
Declared<br />
values<br />
1.03 0.75 0.10 –<br />
Experim.<br />
value<br />
0.99 0.79 0.092 20.52<br />
Probit<br />
model<br />
0.96 0.69 0.093 –<br />
Median 0.99 0.75 0.093 20.00<br />
s 0.0286 0.0411 0.0035 0.5200<br />
Conclusions<br />
The ecotoxicity of the tested chemical was confirmed by<br />
the application of ecotoxicological tests. In the majority of<br />
cases, on the base of the obtained results of the study tests with<br />
chemical, the tests perform very suitable way for the study of<br />
ecotoxicity and can be used for evaluation of ecotoxicity of<br />
other chemicals and wastes. This study confirmed declared<br />
value and all data were statistical evaluated in detail, and the<br />
sensitivity of testing organism was also confirmed.<br />
This work has been supported by Project No. MSM<br />
002163050 form the Ministry of Education, Youth and Sports<br />
of the Czech Republic, and from the COST ACTION 636 Project<br />
No. OC 183.<br />
s360<br />
REFEREnCES<br />
1. UnECE:Globally Harmonized System of Classification<br />
and Labeling of Chemicals. ST/SG/AC.10/C.3/40/<br />
Add.221 December 2001.<br />
<strong>2.</strong> van Straalen n. M.: Environ. Toxicol. Pharmacol. 11,<br />
167 (2002).<br />
3. Isnard P., Flammarion P., Roman G. et all: Chemosphere<br />
45, 659 (2001).<br />
4. OECD Environmental health and Safety Publications:<br />
Series on testing and Assesssmnet no.10, EnV/MC/<br />
CHEM (98)18.<br />
5. OECD Environmental health and Safety Publications:<br />
OECD Guidelines for Testing Chemicals no 201 (2006,<br />
2004, 1992)<br />
6. ISO 8692:2004: Water quality – Freshwater algal<br />
growth inhibition test with unicellular green algae<br />
7. ISO 6341:1996: Water quality – Determination of the<br />
inhibition of the mobility of Daphnia magna Straus<br />
(Cladocera, Crustacea) – Acute toxicity test<br />
8. ISO 20079:2005: Water quality – Determination of the<br />
toxic effect of water constituents and waste water on<br />
duckweed (Lemna minor) – Duckweed growth inhibition<br />
test<br />
9. Commission of the European Communities, 1996. Technical<br />
guidance document in support of commission<br />
directive 93/67/EEC on risk assessment for new notified<br />
substances and commission regulation (EC) No 1488/94<br />
on risk assessment for existing substances. Part II;<br />
Environmental Risk Assessment. Office for official publications<br />
of the European Communities, Luxembourg.
Chem. Listy, 102, s265–s1311 (2008) Environmental Chemistry & Technology<br />
P14 INDOOR AEROSOL ExAMINING<br />
ADRIAnA EŠTOKOVá, nADEŽDA ŠTEVULOVá and<br />
LEnKA KUBInCOVá<br />
Technical University of Košice, Civil Engineering Faculty,<br />
Institute of Building and Environmental Engineering, Vysokoškolská<br />
4, 042 00 Košice, Slovak Republic,<br />
Adriana.Estokova@tuke.sk<br />
Introduction<br />
Aerosol particles are generally considered to be one of<br />
the principal indoor risk factors. Operation, number and behavior<br />
of occupancy i.e. type, emission intensity and amount of<br />
indoor contamination sources (building materials, combustion<br />
processes, smoking, cleaning) 1,2 determine temporal and<br />
spatial variations of indoor aerosol distribution. The particulate<br />
matter (PM) cause the negative health effect, when they<br />
are inhaled and deposited in the respiratory tract 3 .<br />
This paper is primarily concerned with suspended PM 10<br />
concentrations and indoor settled PM monitoring with regard<br />
to the chemical composition and shape of PM 10 particles.<br />
Experimental<br />
M e t h o d s<br />
Suspended particulate matter investigation was focused<br />
on thoracic fraction PM 10 monitoring in various types<br />
of residential and non-residential buildings. Measurement<br />
includes integral particles sampling onto a collection material<br />
(membrane filter Synpor 0,8 µm pore size, 35 mm in diameter)<br />
by sampling equipment VPS 2000 (Envitech, Trenčín) at<br />
air flow of 960 dm 3 h –1 during sampling period of approximately<br />
24 hours. The sampling was carried out in the middle<br />
of the room at the height of 1,500 mm from the floor. The<br />
windows and the door were closed during the monitoring<br />
period. The particulate mass concentrations were determined<br />
by gravimetric method from the increase of filter weight.<br />
Because of minimisation of humidity interference, the filters<br />
were dried at 105 °C for 8 h before and after sampling and<br />
than were equilibrated at a constant temperature and humidity<br />
(e.g. 20 °C and 50 % RH) for 24 h before and after sampling.<br />
The monitoring of indoor settled PM was performed<br />
in selected flat building. Sampling was carried out by passive<br />
methods based on PM settling into Petri dishes during<br />
28 days. The particle surface concentrations were determined<br />
by gravimetric method.<br />
The PM 10 samples were characterized by scanning<br />
electron microscopy/energy-dispersive X-ray analysis (SEM/<br />
EDX) and atomic absorption spectroscopy (AAS) as the main<br />
techniques. Particle morphology was determined by SEM on<br />
the equipment Tesla BS 340. The elemental EDX analysis<br />
were carried out on the micro-analytical system LInK ISIS<br />
300 (Oxford Instruments) operating in secondary mode at a<br />
potential 25 kV and at extension 600–30,000. The chemical<br />
analysis of the selected metals samples content was realised<br />
by SpectrAA-30 (Varian).<br />
s361<br />
Results<br />
The results of indoor PM 10 monitoring in different types<br />
of residential and non-residential buildings are illustrated as<br />
average mass concentrations in the Fig. 1.<br />
Fig. 1. The average mass concentrations of PM10 in residential<br />
(A) and non-residential (b) buildings: A1 – single family residences,<br />
A2 – flat-residences, B1 – school buildings; B2 – offices;<br />
b3 – commercial buildings; b4 – buildings for culture and ntertainment,<br />
b5 – hospitals and sanitary facilities<br />
The highest mass PM 10 concentration was observed in<br />
non-residential public buildings. The PM 10 hygienic limit for<br />
indoor air in Slovak republic – 50 µg m –3 was exceeded in all<br />
monitored types of residential and non-residential buildings<br />
excepting B2 (offices) and B5 (hospitals). The concentrations<br />
of settled PM were measured at various heights and were ranged<br />
from 21.0 μg cm –2 to 86.6 µg cm –2 . The trend of gradual<br />
decreasing of particulate matter occurrence with the raise of<br />
height was observed (Fig. <strong>2.</strong>).<br />
Fig. <strong>2.</strong> Average mass surface concentration of settled PM in dependence<br />
on the height<br />
The mass concentrations of metals in PM 10 samples<br />
investigated by AAS are summarised in Table I.<br />
The obtained mass concentrations of metals in indoor<br />
particle samples correspond with those of in typical urban<br />
aerosol 5 . The individual particles in irregular shape of the<br />
various particle size as well as particles aggregates were<br />
observed on the SEM micrographs (Fig. 3.).
Chem. Listy, 102, s265–s1311 (2008) Environmental Chemistry & Technology<br />
Table I<br />
The mass concentrations of metals<br />
element Average Minimum Maximum<br />
[μg m –3 ] [μg m –3 ] [μg m –3 ]<br />
Cu 0.704 0.03 3.38<br />
Pb 0.094 0.007 0.666<br />
Cd 0.094 0.002 0.625<br />
ni 0.050 0.007 0.29<br />
Cr 0.058 0.007 0.35<br />
Zn 0.408 0.08 <strong>2.</strong>01<br />
As 0.007 0.0001 0.019<br />
Fe 1.818 0.36 9.23<br />
Sb 0.115 0.0001 1.47<br />
Fig. 3. SEM micrograph of particles<br />
The majority of PM 10 particles are non-spherical in<br />
shape with strong division of the surface. The occurrence of<br />
the spherical particles as well as of fibrous particles was not<br />
obvious 4 .<br />
The energy-dispersive X-ray system interfaced to the<br />
SEM provides preliminary information on the elemental<br />
composition of the samples. Fig. 4. represents EDX spectrum<br />
of the selected solid aerosol sample. The principal inorga-<br />
s362<br />
Fig. 4. EDx spectrum of suspended PM 10<br />
nic elements constituting the particles in order of decreasing<br />
peak intensity were Ca ≈ Si > O > Al > C > Mg > Fe > Cl ><br />
na ≈ K.<br />
Conclusions<br />
High indoor PM 10 concentrations exceeding the hygienic<br />
limit (excepting offices and hospitals and sanitary facilities)<br />
were found out in this study. The trend of gradual decreasing<br />
of settled particulate matter concentration with height rising<br />
was observed. The determined metal mass concentrations in<br />
PM 10 correspond with the typical metal concentration range<br />
of the urban aerosol. SEM investigation refers the presence<br />
of majority particles non-spherical in shape, in primary as<br />
well as secondary form (aggregates).<br />
This work has been supported by Grant Agency of Slovak<br />
Republic (project No. 1/3342/06).<br />
REFEREnCES<br />
1. Eštoková, A. et al.: Proceding of the 4th International<br />
Conference: Praticulate matter, p. 124. Slovakia,<br />
Košice: TU, 2003.<br />
<strong>2.</strong> Owen, M. et al: J. Atmos. Environ 26, 2149 (1992)<br />
3. Gwynn, R.CH. et al: J.Environmental Health perspectives<br />
108, 125 (2000).<br />
4. Eštoková, A., Števulová, n.: J. Chemické listy 96, 8<br />
(2002).<br />
5. Hovorka J.:Aktuálni otázky znečistení ovzduší. UK,<br />
Praha 2004.
Chem. Listy, 102, s265–s1311 (2008) Environmental Chemistry & Technology<br />
P15 ATMOSPhERICAL DEPOSITION AND<br />
IMMISSION SITuATION IN THE NIŽNÁ<br />
SLANÁ AREA<br />
ERIKA FEDOROVá, JOZEF HAnČUľáK, OľGA<br />
ŠESTInOVá, Ján BREHUV and TOMISLAV ŠPALDOn<br />
Institute of Geotechnice of the Slovak Academy of Sciences,<br />
Watsonova 45, 043 53 Košice,<br />
fedorova@saske.sk<br />
Introduction<br />
Owing the positive results of geological survey, the<br />
nižná Slaná region has become during last 35 years the most<br />
important basis of Fe-ore. Potential of industrial siderite is<br />
63 mil. t 1,2 .<br />
The biggest of the polution sources is the chimney which<br />
is 120 m high. The dust fallout was monitored by means of<br />
17 sampling points located maximally up to 8 km from main<br />
source of pollution. The pollutants have municipal as well as<br />
industrial origin 5 . The range of plant emission by chemical<br />
data processing and by their comparision with dust deposition<br />
was investigated. In the present time the communal and<br />
the natural sphere causes the air pollution 3,7 .<br />
Experimental<br />
Samples of the dust deposition were taken in monthly<br />
intervals from seventeen sampling places in the intervals of<br />
30 ± 3 days. To take the samples of the dust deposition plastic<br />
sedimentation containers having a cylinder shape with the<br />
internal diameter of 1<strong>2.</strong>5 cm were used and located on two<br />
holders in the height of <strong>2.</strong>5 to 3 m 1,4,7 . The containers were<br />
filled with 250 ml of distilled water with additives of substances<br />
preventing creation of algae in the summer period and<br />
antifreeze additives in the winter period. After sampling the<br />
content of the containers was quantitatively transferred to the<br />
evaporating dishes and evaporated. To remove the organic<br />
mass the evaporation residue was annealed at the temperature<br />
of 450 ºC. The temperature was selected not to cause degradation<br />
of present carbonates and so possible distortion of<br />
gravimetry of the dust deposition. The gravimetry was made<br />
separately for each of the containers 6 . The result for each<br />
month and individual sampling places is calculated in units of<br />
g m –2 (30 days) –1 and it is the average of alues from two exposed<br />
containers. The inorganic part from twelve months set by<br />
annealing was cumulated into one sample and after mineralization<br />
analysed for individual monitored elements using the<br />
AAS method and the SpectrAA – 30 VARIAn unit 4,7 .<br />
Results<br />
Localisation of the sampling places of deposition is<br />
shown in Table I.<br />
The results are the values acquired from deposition<br />
samples after drying and annealing. The specific values of<br />
dust fallout are shown on Table II. As it is evident from these<br />
results, the highest values of the dust fallout were recorded<br />
in summer months and the vegetation period and that is<br />
s363<br />
Table I<br />
Localisation and the samples quantity in the year of 2007<br />
number of<br />
The samples<br />
Locality<br />
locality quantity<br />
1 Vlachovo – swimming pool 12<br />
2 Gočovo – playground 11<br />
3 n. Slaná – colony 12<br />
4 Above plant 12<br />
5 Before plant 12<br />
6 n. Slaná – agrarian cooperative 12<br />
7 n. Slaná – playground 12<br />
8 Direction to Kobeliarovo 12<br />
9 Crossroad – Štítnik 11<br />
10 Henckovce – before village 12<br />
11 Henckovce – upper part 12<br />
12 Henckovce – cemetary 12<br />
13 Henckovce – near railway 12<br />
14 Henckovce – lower part 12<br />
15 Between H. a G. Polomou 11<br />
16 Gemerská Poloma 12<br />
17 Betliar 12<br />
reflected in the percentage representation of the annealed<br />
organic part.<br />
According to Table II and Fig. 1. the highest average<br />
values were recorded on sampling places no. 7 and 5 in 2007<br />
being directly influenced by the dust deposition from the spot<br />
source of the plant and localized in the central part of the<br />
valley (4.40 an <strong>2.</strong>77 g m –2 (30 days) –1 accordingly). Just to<br />
compare, the average value from the sampling place no. 8<br />
that is localized relatively close to the plant, but on the west<br />
side of the valley (west side of nižná Slaná in the direction<br />
to Kobeliarovo) achieves only 0.57 g m –2 (30 days) –1 . Some<br />
of the increased values mainly from the summer period need<br />
to be ascribed also to the extremely dry weather in 2007 and<br />
blowing out of the inorganic particles from the uncovered<br />
horizonts of the farmland.<br />
Fig. 1. Specific values of dust deposition in g m –2 (30 days) –1
Chem. Listy, 102, s265–s1311 (2008) Environmental Chemistry & Technology<br />
Table II<br />
Specific values of dust deposition in g m –2 (30 days) –1<br />
no. Locality<br />
After dying After annealing<br />
min. max. aver- . aver-<br />
min. max<br />
age age<br />
1<br />
Vlachovo –<br />
swimming<br />
pool<br />
1.08 4.72 <strong>2.</strong>90 0.73 3.00 1.87<br />
2<br />
Gočovo –<br />
playground<br />
1.07 1<strong>2.</strong>13 6.60 0.70 <strong>2.</strong>82 1.76<br />
3<br />
n. Slaná –<br />
colony<br />
1.28 5.76 3.52 0.72 3.43 <strong>2.</strong>07<br />
4 Above plant 1.32 8.29 4.80 0.98 <strong>2.</strong>71 1.84<br />
5 Before plant<br />
n. Slaná –<br />
<strong>2.</strong>10 5.24 3.67 1.10 4.52 <strong>2.</strong>81<br />
6 agranian<br />
cooperative<br />
<strong>2.</strong>65 8.80 5.72 0.93 4.41 <strong>2.</strong>67<br />
7<br />
n. Slaná –<br />
playground<br />
3.01 13.22 8.12 <strong>2.</strong>29 10.23 6.26<br />
8<br />
Direction<br />
to Kobeliarovo<br />
0.34 3.97 <strong>2.</strong>16 0.18 0.98 0.58<br />
9 Crossroad – 1.69 9.82 5.76 1.38 3.92 <strong>2.</strong>65<br />
Štítnik<br />
10 Henckovce – 0.79 9.11 4.95 0.42 4.08 <strong>2.</strong>25<br />
before village<br />
11 Henckovce – 0.94 8.65 4.79 0.55 3.10 1.83<br />
upper part<br />
12 Henckovce – 0.96 5.08 3.02 0.61 1.49 1.05<br />
cemetary<br />
13<br />
Henckovce –<br />
1.21 8.62<br />
near railway<br />
4.92 0.94 3.12 <strong>2.</strong>03<br />
14<br />
Henckovce –<br />
<strong>2.</strong>07 1<strong>2.</strong>71 7.39 1.68 4.79 3.24<br />
lower part<br />
15<br />
Between H.<br />
1.67 6.07<br />
and G. Polomou<br />
3.87 1.09 3.23 <strong>2.</strong>16<br />
16<br />
Gemerská<br />
Poloma<br />
1.37 7.83 4.60 0.96 5.16 3.06<br />
17 Betliar 0.55 6.37 3.46 0.13 1.42 0.77<br />
Conclusion<br />
Monitoring of the dust deposition in 2007 year has<br />
shown a relative increase of dustiness in the monitored area<br />
influenced by the activity of the Siderit plant. The increased<br />
s364<br />
Fig. <strong>2.</strong> Variation row of statistical classes in g m –2 (30 days) –1 -<br />
inorganic part<br />
impact can be observed in the area of the farm where the<br />
smoke plume touches the terrain immediately. 4 Specific sources<br />
of gaseous and solid substances exhaled to the move with<br />
air flows in the heights of 100 – 250 m. The research in this<br />
area will enable to highlight the positive activity of the plant<br />
management in relation to the public in the interest of improvement<br />
of environment quality in the given area.<br />
This work has been supported by the Slovak Research<br />
and Development Agency, No 20-027705 and by the Slovak<br />
Grant Agency for Science VEGA (grant No- 2/0131/08).<br />
REFEREnCES<br />
1. Kyntera F., nevyjel E., Leško O.: The pollutants measurements<br />
in the Nižná Slaná area, Košice 1984.<br />
<strong>2.</strong> Grecula P. et al: Mineralia Slovaca, 829, 1 (1995).<br />
3. Mihók J.: Mining – processing establishment. SIDERIT<br />
nižná Slaná, p. 125, (1997).<br />
4. Fedorová E.: Dissertation. Slovac Academy of Sciences<br />
at Košice, Košice, Slovakia, 2003.<br />
5. Baluchová B., Fejdi P., Bobro M.: Mineralia Slovaca 36,<br />
357 (2004).<br />
6. Ursíniová M., Vaňová R., Paľušová O.: Acta Hygienica<br />
et Epidemiologica et Microbiologica 21, 1 (1992).<br />
7. Hančuľák J., Bobro M., Brehuv J., Slančo P.: Acta Montanistica<br />
Slovaca 10, 246 (2005).
Chem. Listy, 102, s265–s1311 (2008) Environmental Chemistry & Technology<br />
P16 ThE NATuRAL AND ANThROPOLOGICAL<br />
CONTAMINATION SOuRCES OF ThE<br />
HALČIANSKY WATER RESERVOIR<br />
SLAVOMíRA KAŠIAROVá a and MELánIA<br />
FESZTEROVá b<br />
a Trenčín University of A. Dubček, Department of public<br />
management, Študentská 2, 911 50 Trenčín, Slovakia<br />
b Constantine the Philosopher University, Faculty of Natural<br />
Sciences, Department of Chemistry, Tr. A. Hlinku 1, 949 74<br />
Nitra, Slovakia<br />
kasiarovas@azet.sk<br />
Introduction<br />
Many technical sights, as an integral part of a landscape<br />
structure, are at the same time its dominant features as they<br />
are directly related to its history. In the Banská Štiavnica<br />
region they are mostly related to mining traditions. Importance<br />
of water reservoirs, also called “tajchy”, in the region<br />
stems their recreational utilisation. The cleanliness of water<br />
is therefore a key issue 1 .<br />
This study has focused on the identification of possible<br />
natural and anthropogenic sources 2 of pollution in the model<br />
territory of the Halčiansky water reservoir and consequently<br />
on its contamination. Water reservoirs built to provide the<br />
water energy for driving mining machinery are a part of a<br />
mining history. As such they are a typical landscape-ecological<br />
component of the Banská Štiavnica landscape. Because of<br />
their significance they are listed on The State List of Cultural<br />
Monuments as sights of technical development and on The<br />
World Catalogue of Water Reservoirs.<br />
Experiment and Methods<br />
In the model territory of the Halčiansky Water Reservoir,<br />
conditions of potential movement of water and related contaminants<br />
were analysed in relation to natural and anthropogenic<br />
sources of contaminants with the use of GIS (Geomedia<br />
Professional) tools. The aim of the analysis was to determine<br />
the vector of the transport and representative sampling points.<br />
Based on the system analysis of the above conditions, the<br />
selection of sampling points was proposed with the sampling<br />
points for the transport system set as transparent. Samples of<br />
water taken at the representative points (period 2006–2007)<br />
were analysed in situ by spectrophotometer (Hach DR 2000,<br />
Horiba) and related to an assumed model of contamination.<br />
The results of physical-chemical analysis were further compared<br />
with the expected transit and interpretation of the contamination<br />
in the territory.<br />
Results and Discussion<br />
The following characteristics have been derived from<br />
the results and water quality monitoring:<br />
(i) Water reaction, conductivity, turbidity, temperature,<br />
salinity, nitrates (1.3–<strong>2.</strong>2 mg dm –3 ) and amount of chlorides<br />
(1.6–9.3 mg dm –3 ) and sulphates (18–33 mg dm –3 ) complied<br />
s365<br />
with the norm no. 490/2002 Z. z. during all seasons, and no<br />
measured value exceeded the norm.<br />
(ii) An increase of ammonia, nitrites, phosphates concentrations<br />
and of chemical consumption of oxygen exceeding<br />
the limit value set by the norm no. 491/2002 Z. z. was<br />
recorded during all four seasons.<br />
Free ammonia – concentration values of nH3 were in a<br />
range of 0.07–1.07 mg dm –3 them exceeding the limits<br />
of the norm ( < 0.3 mg dm –3 ). In the vicinity of the sampling<br />
points 2 and 3 there were grazing grounds foraged<br />
by cattle and sheep and an agricultural land fertilized by<br />
ammoniac, sulphate ammonia or liquid manure, increasing<br />
concentration of ammonium salts in water. Cattle<br />
excrements and fertilizers are entering water reservoir<br />
by the run-off flowing down the surrounding slopes.<br />
The directions of run-off conditions also confirm this.<br />
Another source of pollution at the sampling points 5 and<br />
6 was stabled cattle and cesspools from the residential or<br />
recreational areas.<br />
The most distinctive representation of pollution in the<br />
form of nitrites 0.004–0.226 mg dm –3 was detected in<br />
spring when the concentration of those contaminants<br />
exceeded the value set up by the norm almost eleven<br />
times. Mutual comparison of sampling points indicated<br />
the highest concentration of nitrites at the sampling<br />
sites 3, 4, 5 and 6. nitrites are products of biochemical<br />
oxidation of ammonia and to lesser extent products of<br />
the reduction of nitrates. Their sources are household<br />
sewage and wastewater.<br />
There were also excessive concentrations of phosphates<br />
0.6–<strong>2.</strong>1 mg dm –3 , which exceeded limits set up by the<br />
norm five times, with maximum concentrations registered<br />
in autumn at the sampling site <strong>2.</strong> Main sources of<br />
phosphates are household sewage and wastewater together<br />
with dead bodies of plants and animals.<br />
Chemical consumption of oxygen 10–2,800 mg dm –3<br />
•<br />
•<br />
•<br />
•<br />
had the highest value in winter, at the sampling site 1<br />
(the dam), exceeding the limit value set up by the norm<br />
eighty times. Organic water pollution can be both of<br />
natural (leaches from the organically rich soil, forest,<br />
peat bog, etc.) and artificial origin (pesticides, fertilisers).<br />
The above results have shown that the selection of sampling<br />
points based on the system analyses and GIS outcomes<br />
confirmed assumptions of physical-chemical analysis of<br />
water in natural and residential zones. The exceptions were<br />
nitrates and chlorides concentrations, in case of which the higher<br />
values were expected especially in the agricultural areas<br />
or residential zones.<br />
Conclusions<br />
Results of potential conditions of contaminants in the<br />
territory of the vector movement of water and gravitation<br />
confronted with results of physical-chemical analyses show<br />
the relevance of the model. This will enable an effective
Chem. Listy, 102, s265–s1311 (2008) Environmental Chemistry & Technology<br />
and rational selection of sampling places in the future,<br />
ensuring the representativeness of sampling in the professional<br />
analysis of water contamination.<br />
This work has been supported by grant VEGA<br />
1/3276/06.<br />
s366<br />
REFEREnCES<br />
1. Samešová D., Melichová Z., Šikulová Z.: Séria environ.<br />
ekol. 1, 104 (2002).<br />
<strong>2.</strong> Samešová D., Ladomerský J.: Ekologia, 2006 (in<br />
press).
Chem. Listy, 102, s265–s1311 (2008) Environmental Chemistry & Technology<br />
P17 bIOMODIFIED FORMS OF NATuRAL<br />
ZEOLITE AND ThEIR <strong>ENVIRONMENTAL</strong><br />
APPLICATION<br />
MáRIA REHáKOVáa , ľUBICA FORTUnOVáa , SILVIA<br />
ČUVAnOVáb , LUCIA GABEROVác and MáRIA<br />
KUŠnIEROVáb aFaculty of Science, P.J.Šafárik University, Moyzesova 11,<br />
041 54 Košice, Slovac Republic,<br />
bInstitute of Geotechnics, Slovak Academy of Sciences, Watsonova<br />
45, 043 53 Košice, Slovac Republic,<br />
cUniversité de Provence, Centre de Saint-Jérôme, Marseille,<br />
France,<br />
maria.rehakova@upjs.sk<br />
Introduction<br />
The increasing levels of heavy metals in the environment<br />
represent a serious threat to human health, living resources,<br />
and ecological systems. Mobile and soluble heavy metal species<br />
are not biodegradable and tend to accumulate in living<br />
organisms, causing various deseases and disorders. Amongst<br />
various treatment methods, ion exchange and sorption seem<br />
to be the most attractive in case those nontoxic, low cost zeolites<br />
are used.<br />
natural zeolite of clinoptilolite type (CT) from East<br />
Slovakian deposit in nižný Hrabovec has been studied with<br />
respect to its feasibility of application in environmental area<br />
in combination with biotechnological methods.<br />
This recent investigation presents a continuation of our<br />
previous study 1,2 of the decrease of content of heavy metal<br />
and other toxic compounds (polychlorinated biphenyls-PCB)<br />
in plants growing on heavily contaminated soils in industrial<br />
areas. natural zeolite as well as zeolitic fertilizers was used in<br />
this study. The results of study of growing certain agricultural<br />
plants in contaminated soils with varying dosages of natural<br />
zeolite (CT), zeolitic fertilizer and standard nPK fertilizer<br />
confirmed the favorable influence of both zeolite and the zeolite<br />
based fertilizer. Analysis of plant material showed that<br />
the lowest content of heavy metals (Zn, Cu, Pb, Cd and Cr)<br />
as well as of PCB was found in plants grown in contaminated<br />
soils with the application of CT. The content of heavy metals<br />
and PCB was lower almost of a half in comparison with<br />
plants grown on untreated contaminated soils 2 . Plants grown<br />
in contaminated soils with the addition of zeolitic fertilizer<br />
showed a somewhat higher content. natural clinoptilolite by<br />
ion exchange of heavy metals and sorption of toxic substances<br />
into its cavities and channels blocked their reception into<br />
the plants.<br />
The aim of the recent study is the enlarging of clinoptilolite<br />
sorption surface by the effect of microorganisms and<br />
obtaining more efficient results of its application in the process<br />
of reducing the residual content of heavy metals and<br />
other toxic compounds in industrial contaminated soils.<br />
According to the literature 3–5 , certain species of microorganisms<br />
have been found to absorb surprisingly large<br />
quantities of heavy metals. The removal of heavy metals<br />
s367<br />
from municipal and industrial wastes by biological treatment<br />
systems has continued to be of interest. Bacterial surfaces<br />
have great affinity to sorb and precipitate metals resulting<br />
in metal concentration on the surface. All microbes, which<br />
expose negatively charged groups on their cell surface, have<br />
the capacity to bind metal ions. Complexolysis is a process<br />
corresponding to microbial formation of complexing and<br />
chelating agents that solubilize metal ions. The microorganisms<br />
are able to transform toxic compounds to less toxic.<br />
Biosorption of copper (II) ions by Thiobacillus ferrooxidans<br />
were studied and is shown to be an effective bacterial bioaccumulation<br />
process 3 . Acidithiobacillus and Thiobacillus cultures<br />
are used for biological reduction of chromium (VI)-containing<br />
wastes 4 . The attention is paid also to the utilization of<br />
combination of microorganisms and microporous materials<br />
(active carbon, zeolite) to achieve better sorption properties<br />
for adsorption of toxic compounds 5 .<br />
Our recent study is aimed to biomodification of the<br />
surface of natural zeolite of the clinoptilolite type using the<br />
microorganisms Thiobacillus ferrooxidans. Studied are also<br />
model forms of zeolites containing copper ions, and the influence<br />
of microorganisms on the biosorption of these ions as<br />
well as other changes connected with metabolic activity of<br />
the microorganisms present. The main motivation of this<br />
study is the remediation of soils contaminated with high concentrations<br />
of the residual of heavy metals and other toxic<br />
compounds.<br />
Experimental<br />
In order to study modified forms of natural zeolite, the<br />
natural zeolite of clinoptilolite type (CT) was used from<br />
the Eastern Slovakia deposit in nižný Hrabovec. Two various<br />
granulometric classes were taken for the experiments:<br />
fine-grained one of the particle size up to 200 μm, denoted<br />
as CT1, and coarse-grained of the particle size 0.4–0.6 mm,<br />
denoted as CT<strong>2.</strong> Both granulometric classes of clinoptilolite<br />
was thermally activated at 100–110 o C for 1 hour. So prepared<br />
zeolitic samples were used for the synthesis of copper<br />
forms as well as for cultivation by microoganisms.<br />
All chemical agents used at the synthesis of modified<br />
copper forms of the natural clinoptilolite, at the analyses<br />
and preparation of nutrition medium were analytical grade<br />
(Merck and Fluka).<br />
P r e p a r a t i o n o f C o p p e r F o r m s o f<br />
n a t u r a l Z e o l i t e<br />
Copper forms of natural clinoptilolite were prepared by<br />
the reaction of fine- and coarse thermally activated fraction<br />
of natural clinoptilolite by a reaction with CuSO 4 solution of<br />
two concentrations: 0.1 and 1.0 mol dm –3 . By this way, both<br />
copper forms, fine-grained denoted as CuCT1 and coarse-grained<br />
one, denoted as CuCT2, were obtained in consequence<br />
of an ionic-exchange mechanism. These heterogeneous mixtures<br />
were after 2 hours of stirring decanted several times and<br />
centrifuged in order to get rid of sulphate ions and then dried<br />
for 1 hour at 100 °C.
Chem. Listy, 102, s265–s1311 (2008) Environmental Chemistry & Technology<br />
D e t e r m i n a t i o n o f C o p p e r C o n t e n t<br />
i n C u C T S a m p l e s<br />
The copper content in the copper forms of CuCT1 and<br />
CuCT2 was determined indirectly by determination of copper<br />
content in the solution unadsorbed by the zeolitic structure,<br />
both by AAS spectroscopy at Varian Spectr AA-30, Australia<br />
and by SPECOL 11, Carl Zeiss, Jena.<br />
The amount of Cu (II) in the zeolitic samples was determined<br />
by the energy dispersive spectroscopy (EDS) analysis<br />
using a TESLA BS 340 scanning electron microscope<br />
(TESLA ELMI a.s. with a LInK ISIS 300 microanalyser).<br />
C o n t a m i n a t i o n o f t h e Z e o l i t i c<br />
M a t e r i a l b y M i c r o o r g a n i s m s<br />
The zeolitic samples the CT1 and CT2 fractions and the<br />
copper forms were contamined in a parallel process of cultivation<br />
of microorganisms Thiobacillus ferrooxidans (TF) for<br />
different time 3,4,5 and 12 months. Before the contamination,<br />
all zeolitic samples were irradiated by a germicide lamp<br />
for sterilization. The microorganisms used were sufficiently<br />
multiplicated in a nutrition medium 9K according to Silverman<br />
and Lundgren 6 . In order to compare the surface areas<br />
and the pore volumes, a control abiotic sample (denoted as<br />
CTF) was used after application only of nutrition medium,<br />
without microorganisms.<br />
A n a l y s i s o f t h e S u r f a c e A r e a s a n d<br />
t h e P o r e V o l u m e s<br />
The analysis of surface areas and the pore volumes of the<br />
zeolitic samples prior to the contamination and after contamination<br />
by microorganisms were realized by GEMInI 2360<br />
(Micrometrics USA). The specific surface area was determined<br />
by low-temperature adsorption of nitrogen. Before measurements<br />
the samples were heated for 2 hours at 105 °C.<br />
Results and Discussion<br />
Biomodified zeolitic samples were prepared by using<br />
microorganisms in order to achieve larger sorption surface at<br />
natural zeolite of the clinoptilolite type and thus obtain more<br />
efficient results at its application in reducing the content of<br />
heavy metal residuals and other toxic materials in industrially<br />
contamined soils. Two grain- size fractions of natural clinoptilolite<br />
were studied: fine-grained (CT1) and coarse-grained<br />
(CT2). Both fractions were cultivated by microorganisms<br />
Thiobacillus ferrooxidans (TF) after thermal activation. This<br />
type of microorganism was chosen from the collection of soil<br />
microorganisms due to its accessibility as well as to the fact<br />
that some laboratory methods were available developed at the<br />
Institute of Geotechnics of the Slovak Academy of Sciences<br />
in Košice. Experimental experiences were obtained with<br />
using this type of microorganisms in the extraction of heavy<br />
metals from aluminosilicate structure. Thiobacillus ferrooxidans<br />
are applied in mineral biotechnologies for the extraction<br />
of Cu, Fe and other metals 7 and they are also present in low<br />
concentrations in the soil.<br />
s368<br />
In our first studies of the biomodified forms 8 of the natural<br />
zeolite of clinoptilolite type (CT) the microorganisms<br />
Actinomycetes were used too. However, we had observed<br />
only negligibly small changes caused by these microorganisms<br />
in the studied time interval so that we did not continue<br />
in that study.<br />
The zeolitic samples were cultivated at dynamic conditions<br />
for different time intervals: 1,3,4,5 months and 1 year.<br />
The analyses of the surface area size and pore volumes were<br />
realized also after short time intervals during the activity of<br />
the microorganisms and nutrition medium: after 3 hours and<br />
one day. The surface area and pore volumes decreased in<br />
these short time intervals.<br />
In our previous studies 2 the content of heavy metals<br />
and PCB in the plants (spring barley-Hordeum vulgare) that<br />
were grown in contaminated soils decreased (e.g. content of<br />
Cu = 16 mg kg –1 , Zn = 5<strong>2.</strong>4 mg kg –1 , PCB = 2524 µg kg –1 )<br />
compared with the plants grown in contaminated soils<br />
without an added zeolite (content of Cu = 33.1 mg kg –1<br />
Zn = 107 mg kg –1 , PCB = 4765 µg kg –1 ). For this reason we<br />
have prepared also some model forms of the natural CT with<br />
a copper cations content, which forms could be analogically<br />
obtained in natural conditions too, if the clinoptilolite sorbs<br />
the copper cations that are in the industrially contaminated<br />
soils.<br />
Via the contamination of the copper forms of the clinoptilolite<br />
by the mentioned microorganisms we pursued the<br />
changes of the surface, the volume of the pores and the bioleaching<br />
of copper from the zeolitic material as well.<br />
The results of the study of the surfare areas changes of<br />
the clinoptilolite, its fine-grained CT1 and coarse-grained<br />
CT2 and its some copper forms CuCT1 and CuCT2 are in<br />
the Table I and Figs. 1. and <strong>2.</strong> The results of the pore volumes<br />
were in a good agreement with the results of the surface<br />
Table I<br />
Summary of the size of the surfaces (Sa) of the fine-grain<br />
fraction CT1, coarse-grain fraction CT2 and some copper<br />
forms before and after the contamination by microorganisms<br />
Thiobacillus ferrooxidans (TF), and the reference sample<br />
(CTF) containing only the nutrition medium without the<br />
microorganisms<br />
Samples contaminated Sa Control<br />
Sample with microorganisms TF [m 2 g –1 ] sample CTF<br />
Sa [m 2 g –1 ]<br />
CT1 starting sample without TF 24.2117 24.2117<br />
after 3 months with TF 29.635 30.6734<br />
CT2 starting sample without TF 25.4622 25.4622<br />
after 3 months with TF 30.3999 28.6739<br />
CuCT1 starting sample without TF 25.1931 25.1931<br />
(0.1M) after 3 months with TF 33.0535 3<strong>2.</strong>6870<br />
after 1 year with TF 38.2758 37.4310<br />
CuCT2 starting sample without TF 25.6817 25.6817<br />
(0.1M) after 3 months with TF 33.154 33.6086<br />
after 1 year with TF 4<strong>2.</strong>7652 39.6286
Chem. Listy, 102, s265–s1311 (2008) Environmental Chemistry & Technology<br />
areas. The surface areas are relatively low because they were<br />
measured only for comparison of the changes. These samples<br />
were heated only at temperature 105 o C for two hours. In our<br />
next study the surface area will be measured also after heating<br />
at the higher temperatures up to 400 °C.<br />
Fig. 1. Diagram of surface area changes Sa [m 2 g –1 ] of zeolitic<br />
sample CT2, vs. its control (CTF): 1) starting sample, 2) three<br />
months after the contamination by the Thiobacillus ferrooxidans<br />
Fig. <strong>2.</strong> Diagram of surface area changes Sa [m 2 g –1 ] of zeolitic<br />
sample CuCT2, vs. its control (CTF): 1) starting sample, 2) one<br />
year after the contamination by the Thiobacillus ferrooxidans<br />
After the comparison of the samples before the contamination<br />
by the microorganisms TF and the reference samples<br />
CTF it was found out that even the nutrition medium itself,<br />
pH = 1.57, contributes to the enlargement of the surface area.<br />
The changes of the surface size and the pore volumes were<br />
related also with the grain size. At the fine-grain fraction<br />
CT-1 the enlargement of the surface of the reference sample<br />
(CTF) was higher compared to the sample contaminated<br />
by microorganisms. But at the coarse-grained fraction CT-2<br />
which was contaminated by microorganisms the enlargement<br />
of the surface area was higher compared with the reference<br />
sample. However, more study is still necessary to confirm it<br />
and to find out if a change of the grain-size has not occured<br />
because such a change can cause an enlargement of the surface<br />
size.<br />
At the copper forms CuCT the activity of the microorganisms<br />
caused enlargement of the surface area and the pore<br />
s369<br />
volumes at both the fine-grain and the coarse-grain fraction,<br />
compared to the reference samples.<br />
The copper forms were studied also with respect to a<br />
copper bioleaching. According to the analyses of the copper<br />
content in the samples contaminated by microorganisms for<br />
one year their activity decreased the copper content about<br />
60–75 % (e.g. Cu = <strong>2.</strong>17 % in CuCT1 (0.1M) without TF;<br />
Cu = 0.58 % in CuCT1 (0.1M) with TF after 1 year). The<br />
bioleaching decreased the copper content in the copper forms<br />
of the zeolitic samples (CuCT) depending on its starting concentration<br />
and on other conditions of the bioleaching process.<br />
Thiobacillus ferrooxidans utilises copper ions for its metabolic<br />
processes. T. ferrooxidans contains in the periplasmic<br />
space the small blue copper proteins – rusticyanin, which are<br />
the principal component in the iron respiratory electron transport<br />
chain 9 .<br />
The study of the surface area changes and of the bioleaching<br />
of copper continues with the aim to obtain more<br />
detailed results after more time intervals and under various<br />
conditions.<br />
Conclusions<br />
The results of the analyses of the surface area size and<br />
the pores volume of the clinoptilolite and its copper forms<br />
both before and after the contamination by microorganisms<br />
Thiobacillus ferrooxidans confirmed the changes caused by<br />
the presence of the microorganisms. The results of the copper<br />
bioleaching too indicated that via the influence of the nutrition<br />
media and metabolic activity of the microorganims there<br />
occured changes of the zeolite surface and decrease of the<br />
copper content in the samples. At the present we continue in<br />
the study with the aim to obtain more experimental results<br />
about the activity of the microorganisms acting for various<br />
time intervals and at various conditions.<br />
The combination of application of the zeolites and bioremediate<br />
technologies, which use the metabolic activity<br />
of the microorganisms looks to be a perspective ecological<br />
alternation of the contaminants degradation.<br />
This work has been supported by Scientific Grant<br />
Agency of the Slovak Republic (grants No. 1/0107/08 and<br />
2/7163/27).<br />
REFEREnCES<br />
1. Reháková M., Čuvanová S., Gavaľová Z., Rimár J.:<br />
Chem. listy 5, 260 (2003).<br />
<strong>2.</strong> Reháková M., Čuvanová S., Dzivák M., Rimár J.,<br />
Gavaľová Z.: Curr. Opin. Solid State Mater. Sci. 8, 397<br />
(2004).<br />
3. Masud Hussain S., Anantharaman n.: J. Univ. Chem.<br />
Technol. Metall 40, 227 (2005).<br />
4. Allegretto P., Furlong J., Donati E.: J. Biotechnol. 122,<br />
55 (2006).<br />
5. Lameiras S., Quintelas C., Tavares T.: Bioresour. Technol.<br />
99, 801 (2008).
Chem. Listy, 102, s265–s1311 (2008) Environmental Chemistry & Technology<br />
6. Silverman M. P., Lundgren D. G.: J. Bacteriol. 78,326<br />
(1959).<br />
7. Kušnierová, M., Fečko, P. Minerálne biotechnológie I.,<br />
VŠB–TU, Ostrava 2001, p. 143.<br />
s370<br />
8. Reháková M., Kušnierová M., Gaberová L., Fortunová<br />
ľ., Čuvanová S.: Chem. listy 100, 717 (2006).<br />
9. Kanbi D. L., Antonyuk S., Hough M. A., Hall J. F., Dodd<br />
F. E., Hasnain S. S.: J. Mol. Biol. 320, 263 (2002).
Chem. Listy, 102, s265–s1311 (2008) Environmental Chemistry & Technology<br />
P18 DISTRIbuTION PATTERNS OF ORGANIC<br />
POLLuTANTS IN bRNO LAKE wITh<br />
RESPECT TO ITS DEPOSITIONAL hISTORy<br />
eVA FRAnCůa , JAn SCHWARZBAUERb , MATHIAS<br />
RICKInGc , RADIM LánAa , PAVEL MüLLERa , JURAJ<br />
FRAnCůa and SLAVOMIR nEHYBAd aCzech Geological Survey, Leitnerova 22, 658 69 Brno, Czech<br />
Republic,<br />
bInstitute of Geology and Geochemistry of Petroleum and<br />
Coal, Aachen University of Technology (RWTH), Lochnerstr.<br />
4–20, 52056 Aachen, Germany,<br />
c Working Group Hydrogeology and Applied Geochemistry,<br />
Free University Berlin, Malteserstr. 74–100 – Raum B117,<br />
12249 Berlin, Germany,<br />
dDepartment of Geology and Mineralogy, Masaryk University,<br />
Kotlarska 2, 611 37 Brno,<br />
eva.francu@geology.cz<br />
Introduction<br />
The contamination of the environment with persistent<br />
organic pollutants (POPs) has been of great concern since the<br />
1960s. Polychlorinated biphenyls (PCBs) or organochlorine<br />
pesticides (OCPs) are found mainly in water, sediments and<br />
aquatic biota throughout the world 1,2 . Owing to an intensive<br />
agricultural and industrial production in past few decades, in<br />
particular, river and lake sediments in the Czech Republic are<br />
loaded with POPs and their levels are only partly decreasing 3 .<br />
Brno Lake is situated on the Svratka River upstream from the<br />
city of Brno and belongs to the most important water reservoirs<br />
in the SE Czech Republic. Undisturbed sediment deposits<br />
in lacustrine systems can act as environmental archive after<br />
radiodating 4,5 . Since there are only a few studies dealing<br />
with the levels of organochlorine contaminants in dated sediment<br />
cores 6–9 , this pilot study is focused on the occurrence<br />
of risk elements and organic pollutants in vertical profiles of<br />
the sediment layers of the Brno Lake in order to restore the<br />
pollution history of these trace organic pollutants.<br />
Experimental<br />
The first sampling campaign in Brno Lake covered nine<br />
1m-deep cores with 52 sediment samples. A 3 m-long core<br />
was drilled during the period of time when the reservoir was<br />
empty in the early 2008. The detailed sampling includes<br />
120 samples in total; detailed sedimentological investigation<br />
and geochemistry were applied to the whole 3 m profile.<br />
All samples were analyzed using screening methods<br />
such as magnetic susceptibility (Kf) measured on KLY-2,3<br />
and 3S kappabridges, elemental analysis of total organic and<br />
inorganic carbon (TOC, TIC, respectively), high performance<br />
liquid chromatography (HPLC) of 16 EPA priority polycyclic<br />
aromatic hydrocarbons (PAH), and gas chromatography<br />
with flame ionization detector (GC-FID) to measure the total<br />
extractable hydrocarbons (TEH). Seven indicative PCB congeners<br />
and organochlorine pesticides were determinated by<br />
means of gas chromatograph HP 6890 equipped with µECD<br />
s371<br />
63 ni, cool-on-column injector and capillary column HP-5ms<br />
(60 m × 0.25 mm i.d.). From the screening results 20 samples<br />
were selected for gas chromatography coupled with mass<br />
spectrometry (GC/MS) in full scan mode to characterize the<br />
distribution of the alkylated aromatic and parent hydrocarbons<br />
and in selected ion monitoring mode (SIM) for the saturated<br />
fraction (SAT).<br />
Results<br />
The sedimentological visual examination together with<br />
elemental analysis of the total organic and inorganic carbon<br />
(TOC and TIC) and of the magnetic susceptibility (Kf) indicate<br />
a stratigraphic archive with roughly 5 cycles each about<br />
60 cm thick marked by increased magnetic susceptibility,<br />
increased sand content and lowered organic carbon (Fig. 1.).<br />
These coarser grained intervals formed probably during major<br />
flooding events and migration of the lake bottom channel.<br />
Fig. 1. Total organic carbon and magnetic susceptibility in the<br />
deep well core profile from the Brno Lake (2008)<br />
The early phase of the depositional history has sedimentary<br />
structures suggesting more fluviatile environment<br />
and sandy lithology. The later phases are characteristic by<br />
increasing portion of fine-grained sediments. Laminated<br />
sediments with organic carbon of up to 7.18 % mark the highstand<br />
phases with stratified water column, which persisted<br />
over long periods of the existence of the lake. A Th-U(Ra)-K<br />
gamma-spectrometric survey shows that a probable source<br />
of these elements is in the weathered granitic material of the<br />
Brno Massif while the contribution from the U-mines is negligible.
Chem. Listy, 102, s265–s1311 (2008) Environmental Chemistry & Technology<br />
The dating using 137 Cs indicates the position of the 1986<br />
and 1961-2 events. The organic carbon, total sulphur, PAHs<br />
and PCBs provide a tentative pattern related to depositional<br />
history and flow rate. The geochemical profiles show a<br />
general upward increase in eutrophication and organic matter<br />
accumulation associated with increased cyanobacterial<br />
blooms. The sum of nine PAHs often exceeds the 10 mg kg –1<br />
EPA limit value and their pyrogenic character suggests an origin<br />
in low-quality fuel and furnaces used in the villages and<br />
recreational facilities in the watershed.<br />
Fig. <strong>2.</strong> Vertical changes in organochlorine pollutants levels in<br />
one-meter-deep well core profiles from the Brno Lake (2001)<br />
The higher-chlorinated PCB congeners 138, 153 and<br />
180, and p,p-DDE (a highly stable aerobic metabolite of the<br />
notorious insecticide p,p-DDT) are the most abundant organochlorine<br />
compounds detected in the sediments. PCBs show<br />
upward increase from a depth of 0.6 (0.8–0.5) m (Fig. <strong>2.</strong>),<br />
which marks the beginning of the use of PCBs and DDT. A<br />
s372<br />
stagnation in the PCB and DDT concentration is observed in<br />
the upper part of the profile (0.25–0.00 m) deposited during<br />
the last decade. The differences in POP concentrations found<br />
in individual cores and layers are closely associated with<br />
variable sedimentation rates and occurrences of bottom currents<br />
affecting the organic matter deposition.<br />
Conclusions<br />
The pollution archive related to the depositional history<br />
of the Brno Lake suggest at least 5 cycles, each about 60 cm<br />
thick, defined by the maxima in magnetic susceptibility and<br />
minima in total organic carbon which are associated with<br />
major floods or migration of bottom currents. The amount<br />
of POPs is low in more sandy early sediments, increases<br />
at a specific depth and age throughout the basin and finally<br />
stagnates during the last decade of mud deposition indicating<br />
decreased input of POPs into the environment.<br />
This work has been supported by The Ministry of the<br />
Environment of the Czech Republic,Project SP/1b7/156/07.<br />
REFEREnCES<br />
1. Sapozhnikova Y., Bawardi O., Schlenk D.: Chemosphere<br />
55, 797 (2004).<br />
<strong>2.</strong> Luder B., Kirchner G., Lucke A., Zolitschka B.: J. Paleolimnol.<br />
35, 897 (2006).<br />
3. Müller, P., Hanák, J., Boháček, Z., Toul, J., Müllerová,<br />
H., Kovářová, M.: Final Report of the project<br />
VaV/630/4/02, MS, Czech Geological Survey, Praha.<br />
Brno. MŽP Praha (2005a in Czech).<br />
4. Bollhöfer A., MAngini A., Lenhard L., Wessels M., Giovanoli<br />
F., Schwarz B.: Environ Geol 24, 267 (1994).<br />
5. Heim S., Schwarzbauer J., Kronimus A., Littke R., Woda<br />
C., Mangini A.: Org. Geochem. 35, 1409 (2004).<br />
6. Heim S., Ricking M., Schwarzbauer J., Littke R.: Chemosphere<br />
61, 1427 (2005).<br />
7. Catallo W.J., Schlenker M., ambrell R.P., Shane B.S.:<br />
Environ Sci Technol 29, 1436 (1995).<br />
8. Wei S. et al: Mar. Pollut. Bull. (in press, 2008).<br />
9. Heim, S., Schwarzbauer, J., Kronimus, A., Littke,<br />
R., Hembrock.-Heger, A.: Envir.. Chem. Lett. 1, 169<br />
(2003).
Chem. Listy, 102, s265–s1311 (2008) Environmental Chemistry & Technology<br />
P19 NEw RESIN GEL FOR DIFFuSIVE<br />
GRADIENTS IN ThIN FILM (DGT)<br />
TEChNIQuE<br />
MICHAELA GREGUŠOVá a,b , BOHUMIL DOČEKAL b<br />
and HAnA DOČEKALOVá b<br />
a Institute of Analytical Chemistry of the ASCR, v. v. i.<br />
Veveří 97, 60200, Brno, Czech Republic,<br />
b Faculty of Chemistry, Brno University of Technology<br />
Purkyňova 118, 61200 Brno, Czech Republic,<br />
xcgregusova@fch.vutbr.cz<br />
Introduction<br />
The diffusive gradients in thin film technique (DGT)<br />
represents a relatively new approach to in situ determination<br />
of labile metal species in aquatic systems. The DGT device<br />
accumulates labile species in situ from the solution, and thus<br />
problems associated with conventional collection and filtration<br />
procedures can be eliminated. After diffusing through<br />
a layer of polyacrylamide gel of known thickness (Fig. 1.),<br />
metal species are trapped by an immobilized binding agent<br />
(usually Chelex 100) incorporated in a resin gel layer 1 . Concentration<br />
gradient established in the diffusive layer is a basis<br />
for quantitative measurement of metal concentrations in the<br />
solution. The mass of accumulated metals in the resin gel is<br />
usually determined by AAS or ICP-MS after elution of resin<br />
gel with acid.<br />
This paper reports on the performance of a new resin<br />
gel based on alternative binding agent with 5-sulphophenylazo-8-hydroxychinoline<br />
groups, specific sorbent Spheron-<br />
Oxin ® (ref. 2 ).<br />
Experimental<br />
Diffusive and resin gels were based on polyacrylamide<br />
hydrogel, prepared according to the conventional procedures<br />
(DGT Research Ltd., Lancaster, UK) 1 . Chelex 100 was substituted<br />
by Spheron-Oxin ® in the resin gel. DGT probe was<br />
loaded with resin gel, diffusive gel and filter on the cylindric<br />
body and sealed with a plastic top with an exposition window<br />
of 2 cm in diameter (Fig. 1.). DGT probes were deployed in<br />
the test solutions at 24 ± 1 °C.<br />
Elution efficiency of Cd, Cu, ni, Pb and U was obtained<br />
from subsequent elution experiments with 1 ml 1 mol dm –3<br />
nitric acid. The sorption capacity of discs was estimated<br />
Fig. 1. Scheme of the DGT unit<br />
s373<br />
from accumulated mass of a metal in resin discs immersed<br />
in solutions of 25–790 mg dm –3 Cu. The effect of solution<br />
acidity was investigated within the range of pH 3–8. The<br />
effect of ionic strength and potentional interferents of alkali<br />
earth elemets to heavy metals was tested with model solution<br />
of sodium (<strong>2.</strong>5 × 10 –5 –0.6 mol dm –3 ) and magnesium<br />
(0–0.05 mol dm –3 ) nitrate. The effect of competitive ligands<br />
on DGT metal uptake was investigated in solutions containing<br />
iminodiacetic acid (0–1 × 10 –4 mol dm –3 ) and humic<br />
substance Fluka (product no. 53680) (0–316 mg dm –3 ).<br />
For estimation of specific sorption capabilty to uranium,<br />
sorbents Chelex 100, Spheron-Oxin ® and Spheron-Salicyl ®<br />
were exposed to 5 mg dm –3 U solutions (pH ~ 6,7) of various<br />
carbonate concentration (0–100 mg dm –3 ).<br />
Results<br />
Quantitative analysis by DGT requires reproducible elution<br />
of metal ions from the resin. The elution efficiency for<br />
the Spheron-Oxin ® resin gel, calculated as the ratio of the<br />
amount eluted from the gel and the amount taken up by the<br />
gel, was 0.98, 0.66, 0.86, 0.93 and 0.90 for Cd, Cu, ni, Pb<br />
and U, respectively.<br />
Since DGT can be used as a long-term monitoring tool,<br />
it is important to assess the sorption capacity of the resin gel.<br />
Maximum sorption capacity of 3 μmol disk –1 Cu was determined<br />
from the isotherm. Because the linear part of the sorption<br />
isotherm relates to aproximatelly 10 % of the capacity,<br />
discs can be deployed in natural waters for a long time period<br />
of several months.<br />
Uptake experiments in the pH range of 3–8 showed that<br />
resin gel with Spheron-Oxin ® can be used in DGT technique<br />
within the pH range of 6–8, typical for most of the natural<br />
waters.<br />
The effect of ionic strength was investigated with solution<br />
of cadmium (40 μg dm –3 ). Concentration of Cd measured<br />
by DGT was independent of ionic strengths up to<br />
0.6 mol dm –3 nanO 3 .<br />
Fig. <strong>2.</strong> Influence of IDA concentration c IDA on the normalized<br />
values of the apparent diffusion coefficients (D APP /D TAb ) for Ni<br />
(pH ~ 7). ●Chelex 100, ▲Spheron Oxin®
Chem. Listy, 102, s265–s1311 (2008) Environmental Chemistry & Technology<br />
In real water systems, several other ions are present,<br />
which can compete with metals measured by DGT. The Ca<br />
and Mg are dominant cations in hard waters. Although the<br />
stability constant for magnesium is lower than for Cd, Cu,<br />
ni and Pb, magnesium can affect DGT measured metals concentrations.<br />
Uptake of Cd, Cu, ni and Pb was not influenced<br />
by magnesium nitrate in the whole concentration range up tu<br />
0.05 mol dm –3 . new discs can be also used in high salinity<br />
waters.<br />
Fig. 3. Ifluence of HA concentration c hA on the normalized values<br />
of the apparent diffusion coefficients (D APP /D TAb ) for Spheron-Oxin<br />
® resin gel (pH ~ 7). ▲Cd, ●Cu, □Ni, ■Pb<br />
In natural waters, variety of ligands occurs that can affect<br />
concentration measured by DGT technique. Iminodiacetic<br />
acid (IDA) was used as a model strong ligand influencing<br />
the uptake of metals. The results of deployment of DGT<br />
units, packed with Spheron-Oxin ® and Chelex 100 resin gels,<br />
in ni solutions containing IDA in the concentration range of<br />
0–0.1 mol dm –3 are shown in Fig. <strong>2.</strong><br />
Diffusion coefficients (D) can be calculated when taking<br />
into account diffusion area (3.14 cm 2 ) and thickness of the<br />
diffusive layer. Those diffusion coefficients can be considered<br />
as apparent diffusion coefficients (D APP ) of the metal under<br />
specific conditions. Their values represent the metal fluxes<br />
per unit deployment time, unit diffusion area, unit metal concentration<br />
in the external solution and unit thickness of the<br />
diffusive gel layer. The difference between both curves relates<br />
to stability constants of both funcional groups. This difference<br />
can be employed in speciation measurements.<br />
Humic acids (HA) are the most widespread natural complexing<br />
ligands. Influence of the concentration of the humic<br />
substance on the D APP is shown in Fig. 3., in which elementspecific<br />
effect of HA can be observed. Similar results were<br />
also obtained in Refs. 3,4 , in which Chelex 100 and Spheron-<br />
Thiol ® resin gels were used. Due to competitive reactions,<br />
s374<br />
Fig. 4. Influence of carbonate concentration on distribution coefficient<br />
of uranium for ■ Spheron-Oxin ® , ▲ Spheron-Salicyl ® ,<br />
and ● Chelex 100 sorbents (pH ~ 6.7)<br />
the complex formation with HA decreases the concentration<br />
of metal species in external solution that can be measured by<br />
DGT.<br />
Uranium, analogously to other heavy metals, forms various<br />
complexes in natural waters with a variety of ligands.<br />
Depending on pH of the solution, uranyl ions are bound in<br />
stable hydroxocomplexes and, especially carbonate complexes<br />
due to dissolved atmospheric CO 2 . Influence of equilibrium<br />
carbonate concentration on distribution coefficient (D g)<br />
of uranium is shown in Fig. 4. It is evident that the resin gel<br />
based on Spheron-Oxin ® appears to be a new useful resin gel<br />
for speciation analysis of uranium in natural waters.<br />
Conclusions<br />
The new resin gel based on Spheron-Oxin® with anchored<br />
5-sulphophenyl-azo-8-hydroxychinoline functional<br />
groups exhibits very strong afinity to Cd, Cu, ni, Pb and U.<br />
In addition to conventional Chelex 100 based gels it can be<br />
applied in DGT technique and provide more information on<br />
heavy metals speciation, especially of uranium in aquatic<br />
systems.<br />
Acknowledgement: This work was performed and supported<br />
within the Institutional research plan AV0Z40310501.<br />
REFEREnCES<br />
1. Dawison W., Zhang H.: nature 367, 546 (1994).<br />
<strong>2.</strong> Slovák Z.: Bulletin of n.p.Lachema Brno, 1979, 30 p.<br />
3. Dočekal B., řezáčová-Smetková V., Dočekalová H.:<br />
Chem. Pap. 59, 298 (2005).<br />
4. Trávníčková J.: Diploma Thesis. Brno University of<br />
Technology, Brno, Czech Republic, 2008.
Chem. Listy, 102, s265–s1311 (2008) Environmental Chemistry & Technology<br />
P21 ChALLENGES IN ThE ANALySIS OF<br />
hExAbROMOCyCLODODECANE IN ThE<br />
<strong>ENVIRONMENTAL</strong> SAMPLES<br />
PETRA HRáDKOVá, JAn POUSTKA, JAnA<br />
PULKRABOVá, MICHAELA náPRAVníKOVá and<br />
JAnA HAJŠLOVá<br />
Department of Food Chemistry and Analysis, ICT Prague,<br />
Technická 3,166 28 Prague 6, Czech Republic,<br />
petra.hradkova@vscht.cz<br />
Introduction<br />
Brominated flame retardants (BFRs) are compounds<br />
widely used in commercial products to reduce and prevent<br />
the extent of fire. Hexabromocyclododecane (HBCD) is the<br />
third most produced BFR worldwide and the second most<br />
used BFR in Europe. HBCD is mainly applied as an additive<br />
flame retardant for the expanded and extruded polystyrene<br />
which are used as insulation materials in buildings and in the<br />
upholstery textile.<br />
As the HBCD is not chemically bound to the material<br />
to which is added, it could leak into the environment through<br />
emission during a production or use of various materials,<br />
from final products or following disposal. Similarly to other<br />
BFRs, HBCD is a persistent, bioaccumulative and toxic chemical.<br />
There are theoretically 16 HBCD diastereoisomers,<br />
however, the technical mixture consists mainly from three<br />
diastereomeric pairs of enantiomers (α-, β- and γ-HBCD), the<br />
latter one is the most abundant (75–85 %).<br />
Both GC-MS and LC-MS are commonly used techniques<br />
for the quantitative determination of HBCD. Total-<br />
HBCD (sum of α-, β- and γ-HBCD) may be measured by GC-<br />
MS, but it does not allow the quantification of the individual<br />
isomers, because the HBCD diastereoisomers can rearrange<br />
above oven temperature of 160 ºC and also resolution of GC<br />
separation is not sufficient. The individual HBCD diastereoisomers<br />
can be determined using LC-MS/MS. On the other<br />
hand, the response in this system may be influenced by matrix<br />
ion suppression especially in the electrospray ionisation<br />
MS 1,2,3,4 .<br />
In this study, the both types of analytical systems were<br />
tested to assess the ways of HBCD determination in the<br />
environmental samples.<br />
Experimental<br />
The choice of environmental samples was based on: (i)<br />
a representativeness of both biotic and abiotic components<br />
and (ii) origin from Czech environment. The final extracts<br />
of tested samples including target analytes were analysed by<br />
two different chromatographic systems:<br />
• GC-MS (using negative chemical ionization mode (nCI)<br />
with quadrupole analyzer)<br />
• LC-MS/MS (using negative electron spray ionization<br />
(ESI–) with tandem quadrupole analyzer).<br />
s375<br />
S a m p l e T r e a t m e n t<br />
The fish muscles of species chub (Leuciscus cephalus)<br />
and bream (Abramis brama) represented biotic environmental<br />
samples. The chub and bream frequently occur in Czech<br />
rivers, are very suitable as a bioindicator of the aquatic<br />
environment contamination and were caught in the Vltava<br />
River. Also sediment and sewage sludge represented other<br />
analysed samples. The sewage sludge was collected in a<br />
sewage treatment plant (STP) and the river sediment was collected<br />
downstream from this STP, both in Hradec Králové.<br />
The individual standards of α-, β- and γ-HBCD diastereoisomers<br />
were obtained from Cambridge Isotope Laboratories<br />
(CIL, UK).<br />
The samples (sediment and sludge after drying) were<br />
desiccated with anhydrous sodium sulphate and then extracted<br />
in a Soxhlet apparatus using a solvent mixture n-hexane:<br />
dichloromethane (1 : 1, v/v) for fish and DCM in case of sediment/sludge.<br />
The crude extracts were rotary-evaporated to<br />
dryness. Lipid content of fish samples was determined gravimetrically.<br />
In next analytical step, the samples were re-dissolved<br />
in 10 ml of ethylacetate: cyclohexane (1 : 1, v/v). The<br />
fat and other co-extracted compounds were removed by a gel<br />
permeation chromatography (GPC). Finally, a target fraction<br />
was rotary-evaporated and concentrated in isooctane and in<br />
acetonitrile for GC and LC analysis, respectively. GC extract<br />
was in addition treated with concentrated sulphuric acid prior<br />
the analysis.<br />
I n s t r u m e n t a l D e t e r m i n a t i o n<br />
The target analytes were separated using either gas or<br />
liquid chromatography. An Agilent 6890n gas chromatography<br />
(GC) coupled to an Agilent 5975 Inert XL mass spectrometer<br />
(MS) was operated in nCI mode (both Agilent, USA).<br />
The system was equipped with a 15 m × 0.25 mm × 0.1 µm<br />
DB XLB capillary column (J&W Scientific, USA). The temperature<br />
of the column was programmed from 80 °C (2 min)<br />
to 325 °C at a rate of 50 °C min –1 and held for 5 min. Helium<br />
was used as a carrier gas at ramping flow from 1.5 ml min –1<br />
(7.2 min) to 3 ml min –1 at a rate of 50 ml min –1 (ref. 2 ). The ion<br />
source, quadrupole and interface temperature were 150 °C,<br />
150 °C and 300 °C, respectively. Bromine isotopic ions<br />
[Br] – at m/z 79, 81 and molecular ions [Br 2 ] at m/z 158 and<br />
160 were monitored for confirmation HBCD in selected ion<br />
monitoring (SIM) mode.<br />
A high performance liquid chromatograph carried out<br />
with a Waters Alliance 2695 HPLC instrument (USA) together<br />
with a Quattro Premier XE tandem-quadrupole mass<br />
spectrometer (Waters, USA) was operated in negative electrospray<br />
ionization (ESI–). The LC separation of the compounds<br />
was performed on a nUCLEODEX beta-PM chiral column<br />
(200 × 4 mm id, 5 µm, Macherey-nagel), kept at 40 °C, using<br />
an (A) methanol, (B) acetonitrile and (C) deionized water<br />
gradient. The gradient was programmed as follow: 30 % (A),<br />
30 % (B) and 40 % (C), 0–3 min linear change to 30 % (A),<br />
60 % (B) and 10 % (C), 3–20 min kept this composition.
Chem. Listy, 102, s265–s1311 (2008) Environmental Chemistry & Technology<br />
Specific mass transitions (m/z 640 → 79, 81) were used for a<br />
MS/MS determination.<br />
Results and Discussion<br />
The levels of HBCD in selected environmental samples<br />
were monitored using both types of previously described analytical<br />
systems. As mention above, HBCD consists of three<br />
diastereoisomers – α-, β-, and γ-HBCD. Fig. 1. documented<br />
the result of a GC-MS application, this technique does not<br />
enable the isomers separation, all isomers are eluted in one<br />
broaden peak. For this reason, α-isomer is used as a calibrant.<br />
Furthermore, individual diastereomers have different<br />
response factors which can cause that the less accurate results<br />
are obtained in case of higher content of β- and γ-isomers.<br />
Fig. 1. GC-MS chromatogram of hbCD (m/z 79 and 81)<br />
On the other hand, the LC-MS/MS allows separation of<br />
six individual enantiomers as demonstrates Fig. <strong>2.</strong>a. The LC<br />
chromatograms show diverse patterns of the isomeric composition.<br />
In the sediment samples (abiotic matrix), as shows<br />
Fig. <strong>2.</strong>b, γ-diastereoisomer is usually predominant, followed<br />
by α- and β-HBCD, what reflects the diastereomeric profile<br />
in various technical products. The content of the first isomer<br />
in the biota samples is the inverse and α-HBCD is the most<br />
abundant (no figure). It could be caused by biotransformation<br />
process in live organisms 5 . In addition to ability of excellent<br />
separation of individual enantiomers, LC-MS/MS provides<br />
lower limit of detection (0.5 ng g –1 lipid weight, 0.7 ng g –1<br />
dry mass) in comparison with GC-MS system (0.8 ng g –1 lipid<br />
weight, 0.8 ng g –1 dry mass) in case of fish samples, sediment<br />
and sewage sludge, respectively.<br />
The first results obtained from the analysis of the Czech<br />
environmental samples are resumed in Table I. The chub<br />
and bream livers contained both α-HBCD enantiomers and<br />
at the low concentration also β-enantiomers. The high level<br />
of γ-HBCD was determined in the sample of chub muscle<br />
from Podolí. This significantly higher level of γ-isomer in<br />
biota sample may indicate there is an emission source in<br />
particular locality present, because as mention above, γ-isomer<br />
dominates in technical mixture. The similar pattern of<br />
diastereomers was found also in the sediment and sewage<br />
sludge samples where only γ-HBCD was detected as shows<br />
Fig. <strong>2.</strong>b. Comparing the results obtained within our study,<br />
it was found that the GC levels of target analytes are just a<br />
s376<br />
Fig. <strong>2.</strong> LC-MS/MS chromatogram of (a) a standard of hbCD<br />
individual enantiomers and (b) a real sample of river sediment<br />
from Hradec Králové<br />
slightly overevaluated by about 13 % in case of α-diatereomers.<br />
Total differences in the results between LC-MS/MS<br />
and GC-MS can be cause by usage of α-HBCD as a calibrant<br />
together with diverse response factor of individual diastereomers<br />
in GC-MS.<br />
Table I<br />
The results of diastereoisomers obtained by LC-MS/MS<br />
and sum of HBCD as a result of application GC-MS in fish<br />
samples (ng g –1 lipid weight) and sediment/sewage sludge<br />
(ng g –1 dry mass)<br />
HBCD<br />
Results of<br />
Fish Locality Diastereoisomers<br />
GC-MS<br />
α β γ<br />
Chub němčice 34 1.4 n.d 36<br />
Bream němčice 68 0.4 n.d. 80<br />
Chub Klecany 6.6 n.d. n.d. 7.5<br />
Bream Lysá 59 1.1 n.d. 69<br />
Chub Podolí 16 6 105 58<br />
Sediment Hradec Králové n.d n.d 28.1 17.7<br />
Sewage Hradec Králové n.d n.d 103.9 156<br />
sludge<br />
Conclusions<br />
In presented study, two different analytical techniques<br />
(GC/MS and LC-MS/MS) were tested for the analysis of<br />
HBCD isomers in environmental samples. The potential of<br />
the first system is particularly in the determination of the total<br />
HBCD occurrence in samples. On the other hand, the latter<br />
one using chiral permethylated β-cyclodextrine stationary<br />
phase allows the separation and quantification of individual<br />
diastereomers. Comparing the results obtained within our<br />
study, it was found that the GC levels of target analytes are<br />
just little overevaluated. For this reason, the need for further<br />
investigations into differences between GC and LC results<br />
are necessary.
Chem. Listy, 102, s265–s1311 (2008) Environmental Chemistry & Technology<br />
HBCD profiles in fish are different from those observed<br />
in sediment and sewage sludge. In fish, usually α-HBCD is<br />
the major diastereomer, whereas in sediment and in sewage<br />
sludge is most abundant γ-HBCD. The processes affecting<br />
these differences in isomer composition are not fully<br />
investigated yet. LC-MS/MS is an appropriate for monitoring<br />
changes of diastereomers pattern.<br />
This study was undertaken within the projects MSM<br />
6046137305 and NPV II (2B06151).<br />
REFEREnCES<br />
1. Haug L. S., Thomsen C., Liane V. H., Becher G.: Chemosphere<br />
71, 1087 (2007).<br />
s377<br />
<strong>2.</strong> Heeb n. V., Schweizer W. B., Mattrel P., Haag R.,<br />
Kohler M., Schmid P., Zennegg M., Wolfensberger M.:<br />
Chemosphere 71, 1547 (2008).<br />
3. Gómara B., Lebrón-Aguilar R., Quintanilla-López J. E.,<br />
González M. J.: Anal. Chim. Acta 605, 53 (2007).<br />
4. Van Leeuwen S. P. J., De Boer J.: Mol. nutr. Food Res.<br />
25, 194 (2008).<br />
5. Yegers B. n., Mets A., Van Bommel R., Minkenberg<br />
C., Hamers T., Kamstra J. H., Pierce G. J., Boon J. P.:<br />
Environ. Sci. Technol. 39, 2095 (2005).
Chem. Listy, 102, s265–s1311 (2008) Environmental Chemistry & Technology<br />
P22 ThE CONTENT OF POLybROMINATED<br />
DIPhENyL EThERS IN FREShwATER FISh<br />
FROM bRNO wATER RESERVOIR<br />
M. HROCH, M. VáVROVá and V. VEČEREK<br />
Faculty of Chemistry, University of Technology Brno, Purkyňova<br />
118, 612 00 Brno, Czech Republic,<br />
hroch@fch.vutbr.cz<br />
Introduction<br />
One group of “new” persistent halogenated contaminants<br />
is represented by brominated flame-retardants (BFRs).<br />
BFRs are chemicals widely used in various products such as<br />
plastics and textiles to prevent a fire hazard. Generally two<br />
types of these compounds are in use. The reactive BFRs<br />
represented mainly by tetrabromobisphenol A (TBBPA) are<br />
incorporated into the polymeric materials by covalent binding,<br />
whereas the additive types, represented by polybrominated<br />
diphenyl ethers (PBDEs), polybrominated biphenyls<br />
(PBBs) and hexabromocyclododecane (HBCD) are embedded<br />
into a matrix of appropriate polymer.<br />
PBDEs are similar to polychlorinated biphenyls (PCBs)<br />
in structure and characteristics such as hydrophobic and<br />
semi-volatile and/or nonvolatile. Theoretically 209 congeners<br />
(5 majorities) of PBDEs exist with specific chemical<br />
and physical properties, which lead to various biological and<br />
toxicological effects. Alike other organohalogen compounds<br />
such as PCBs, DDT and other organochlorine pesticides, PB-<br />
DEs are lipophilic, very stable and resist to acids and basis,<br />
heat and light and biodegradation.<br />
Table I<br />
Physical and chemical characteristics of majority congeners<br />
Congener no. of Br Log Melting Slb. in water<br />
atom K ow point [°C] [mg ml –1 , 25°C]<br />
47 4 6.55 83.5–84.5 0.015<br />
99 5 7.13 90.5–94.5 0.0094<br />
100 5 6.86 102 0.04<br />
154 6 7.39 131–13<strong>2.</strong>5 8.7 × 10 –7<br />
209 10 9.97 30<strong>2.</strong>5 4.17 × 10 –9<br />
The concern over these anthropogenic compounds is<br />
that they can be released into the environment from products<br />
as they are not chemically bounded to the materials, and more<br />
importantly, they are persistent with a high bioaccumulation<br />
potential.<br />
PBDEs are being found as contaminants of indoor and<br />
outdoor environments. The presence of PBDE was proved in<br />
all the components of the environment such as air, sediment<br />
and sewage sludge as well as biological samples including<br />
biota, human blood, adipose tissues and breast milk. Quite<br />
high concentrations were found in the dust in flats and offices.<br />
s378<br />
Experimental<br />
This study presents results of measuring concentration of<br />
ten PBDE congeners (BDE-3, 15, 28, 47, 99, 100, 118, 153,<br />
154 and 183) in different species of fish using gas chromatography<br />
with electron captured detector (GC-ECD). These<br />
samples were collected from Brno water reservoir, which is<br />
situated near the Brno city.<br />
Five head of each kind were detected and the total PBDE<br />
congener concentrations (Σ PBDEs) in the fish were amur <<br />
bream < crucian < carp.<br />
C h e m i c a l s<br />
PBDE standards, all with declared 99% purity, were<br />
purchased from AccuStandard, Inc. (new Haven, USA).<br />
Working standard mixtures in isooctane contained following<br />
congeners: 4-BDE (BDE 3), 4,4’-diBDE (BDE 15),<br />
2,4,4’-triBDE (BDE 28), 2,2’,4,4’-tetraBDE (BDE 47),<br />
2,2’,4,4’,5-pentaBDE (BDE 99), 2,2’,4,4’,6-pentaBDE<br />
(BDE 100), 2,3’,4,4’,5-pentaBDE (BDE 118), 2,2’,4,4’,5,5’hexaBDE<br />
(BDE 153), 2,2’,4,4’,5,6’-hexaBDE (BDE 154),<br />
2,2’,3,4,4’,5’,6-heptaBDE (BDE 183).<br />
M e t h o d<br />
A homogenized fish tissue was desiccated with mixture<br />
of sea sand and anhydrous sodium sulphate. Soxhlet extraction<br />
carried out (6 hours) with hexane/petrolether solvent<br />
mixture (96 : 4, v/v) for isolation of target analytes from the<br />
sample. Concentrated crude extracts were purified by using<br />
multi layer column (300 × 8 mm; florisil, silica, alumina). The<br />
collected fraction was evaporated to dryness and re-dissolved<br />
in 1 ml of isooctane. After addition of a few drops of sulphuric<br />
acid the organic layer was used for GC analysis. Quantification<br />
of target analytes was carried out by high-resolution<br />
gas chromatography, where two capillary columns (DB-17<br />
MS column and HT-8 column) operated in parallel mode<br />
were used. Experiments were carried out on Agilent 6890 GC<br />
system and the analytes were identified by retention times.<br />
Results<br />
This paper reports PBDEs levels in freshwater fish.<br />
These were determined by gas chromatography with ECD.<br />
The identification of PBDEs in the fish samples was based<br />
on comparison of the retention times with those of the available<br />
authenticated standards. All results are summarized in<br />
Fig. 1. Chromatogram of carp-skin sample analysed by GC<br />
with electron captured detector in capillary column Db-17 MS
Chem. Listy, 102, s265–s1311 (2008) Environmental Chemistry & Technology<br />
Table II<br />
Concentrations of PBDE detected in carp skin and muscle<br />
[μg kg –1 ]<br />
Cong./ Skin Skin Muscle Muscle<br />
Carp Range Mean Range Mean<br />
BDE 3 21.2–26.3 24.8 14.6–17.0 15.2<br />
BDE 15 nd * – nd –<br />
BDE 28 nd – nd –<br />
BDE 47 66.7–188 118 54.5–78.2 66.4<br />
BDE 99 26.3–50.0 33.3 nd –<br />
BDE 100 49.8–136 98.2 37.9–55.1 46.3<br />
BDE 118 nd – nd –<br />
BDE 153 4<strong>2.</strong>5–77.1 5<strong>2.</strong>2 nd –<br />
BDE 154 37.1–98.6 69.3 28.6–34.1 30.5<br />
BDE 183 18.9–24.5 21.0 nd –<br />
* not detected<br />
Table III<br />
Concentrations of PBDE detected in crucian skin and muscle<br />
[μg kg –1 ]<br />
Cong./ Skin Skin Muscle Muscle<br />
Crucial Range Mean Range Mean<br />
BDE 3 69.6–175 – 81.3 81.3<br />
BDE 15 nd – nd –<br />
BDE 28 nd – nd –<br />
BDE 47 49.9–68.2 57.4 31.3 31.3<br />
BDE 99 nd – 16.5–27.9 24.4<br />
BDE 100 40.0–6<strong>2.</strong>3 57.8 nd –<br />
BDE 118 nd – nd –<br />
BDE 153 6<strong>2.</strong>2 6<strong>2.</strong>2 31.8–106 85.5<br />
BDE 154 23.6–25.1 24.7 nd –<br />
BDE 183 nd – nd –<br />
Tables II–IV. The levels of PBDEs in amur were bello tho<br />
limits of detection, therefore they were left out in the table<br />
summary. Fig. 1. shows representative chromatogram of carp<br />
skin sample analysed in capillary column DB-17 MS with<br />
50 % diphenyl- 50 % dimethylsiloxane stationary phase.<br />
The most abundant congeners determined in skin of<br />
investigated species were BDE 3, BDE 47, BDE 100 and<br />
BDE 153. Greater mean levels were observed in skin then<br />
muscle tissues.<br />
s379<br />
Table IV<br />
Concentrations of PBDE detected in bream skin and muscle<br />
[μg kg –1 ]<br />
Cong./ Skin Skin Muscle Muscle<br />
Bream Range Mean Range Mean<br />
BDE 3 4<strong>2.</strong>2–6<strong>2.</strong>2 48.3 26.0–31.5 29.8<br />
BDE 15 nd – nd –<br />
BDE 28 nd – nd –<br />
BDE 47 35.2 35.2 nd –<br />
BDE 99 nd – nd –<br />
BDE 100 19.8 19.8 13.2 13.2<br />
BDE 118 nd – nd –<br />
BDE 153 20.6–2<strong>2.</strong>8 21.7 18.6 18.6<br />
BDE 154 nd – nd –<br />
BDE 183 nd – nd –<br />
Polybrominated diphenyl ethers are very resistant to<br />
biodegradation and also show carcinogenic and mutagenic<br />
effects. Due to unavoidable emissions into the environment<br />
PBDEs have been found throughout the world both in abiotic<br />
(air, water, soil, sediment) and biotic (fish tissue, bird eggs,<br />
marine mammals) compartments. Into the future, will be very<br />
important and necessary monitoring these compounds in the<br />
environment and food chain especially.<br />
Financial support from Ministry of Education, Youth<br />
and Sports under MSM 6215712402 is greatly appreciated<br />
REFEREnCES<br />
1. Marsh G., Hu J., Jakobsson E., Rahm S.; Bbergman A.:<br />
Environ. Sci. Technol. 33, 3033 (1999).<br />
<strong>2.</strong> de Boer K., Boom J. P.: Polybrominated biphenyls and<br />
diphenyl ethers. The handbook of environmental chemistry<br />
3, new types of persistent halogenated compound,<br />
61–95, 2000.<br />
3. Kazda R., Hajšlová J., Poustka J., Čajka T.: Anal. Chim.<br />
Acta 520, 237 (2004)<br />
4. WHO/ICPS: Environmental health kriteria 162, Brominated<br />
diphenyl ethers, World health organization,<br />
Geneva, 1994.
Chem. Listy, 102, s265–s1311 (2008) Environmental Chemistry & Technology<br />
P23 ExAMINATION OF AbANDONED Sb<br />
DEPOSITS by MINERALOGICAL METhODS<br />
IN POPROČ (SLOVAKIA)<br />
MICHAL JAnKULáR a , TOMአKLIMKO b , ľUBOMíR<br />
JURKOVIČ a , BROnISLAVA LALInSKá b , PETER<br />
ŠOTTníK c , OTíLIA LInTnEROVá c and MICHAL<br />
ŠUTRIEPKA c<br />
Faculty of Natural Sciences Comenius University<br />
842 15 Bratislava, Slovak Republic,<br />
a Department of Geochemistry,<br />
b Department of Mineralogy and Petrology,<br />
c Department of Economic Geology,<br />
jankular@fns.uniba.sk<br />
Introduction<br />
The Poproč region has long been recognized as an<br />
important source of antimony in Europe. Mining began in<br />
the 17 th century and finished in 20 th century 1 . The abandoned<br />
Poproč Sb deposit is situated in the SE part of the Spišskogemerské<br />
Rudohorie Mts. (Slovakia). Geologically, the area<br />
consists of Paleozoic metamorphic rock complexes – graphitic<br />
and sericitic phyllites, metapsammites and metarhyolitic<br />
tuffs and granites. The Sb mineralization occurs as quartzcarbonate<br />
veinlets and impregnation in the host rocks. Antimony<br />
is the main ore mineral; others are pyrite, arsenopyrite,<br />
and various sulphides of Pb-Zn-Cu. The main non-metallic<br />
vein minerals are quartz, carbonates, tourmalines, albites,<br />
sericites, and chlorites. Extensive contamination related to<br />
the Sb deposit in Malé Karpaty Mts. was described previously<br />
2,3 . The study of arsenic and antimony bindings to ferrous<br />
ochres 4,5 , concentrations and distribution of As and Sb<br />
in oxidation rims of destabilized sulphides of impoundment<br />
sediment, and experimental investigation of geochemical<br />
barrier media were important. An investigation of biological<br />
and chemical oxidation was also conducted 6 . Rapid dissolution<br />
of Sb from impoundment sediment was studied at the<br />
nearby Dúbrava deposit 7 . Description of significant influence<br />
of long term mining activity and the potential effects of abandoned<br />
deposits on population health quality were described<br />
in the Zlatá Idka community (Spišsko-gemerské Rudohorie<br />
Mts.) 8 . Finally, a study of the Poproč area and its surroundings<br />
reported highly contaminated surface waters, soils, and<br />
stream sediments 9 . The As in soil samples exceeded class C<br />
standards of the Ministry of Agriculture of the Slovak Republic<br />
no. 531/1994-540 by 400 times, all stream sediment samples<br />
exceeded class C As and Sb limits, and concentrations of<br />
Sb were 100 times higher than sanitary regulatory limits for<br />
drinking water 10,11 .<br />
Experimental<br />
Samples were collected of geological materials and natural<br />
media (groundwater, surface waters, stream sediments,<br />
soils and ochres) and selected plant species (roots and shoots)<br />
in the field area shown in Fig. 1. Samples were preferentially<br />
collected in areas near potential local contamination sources<br />
s380<br />
(outflow from mines, tailings ponds and theirs surroundings,<br />
and mining wastes). Samples of soils, stream sediments,<br />
impoundment material, and plant tissues were dried and<br />
homogenized under laboratory conditions by standard procedure.<br />
Special techniques were needed to selectively dissolve<br />
the solid ochre samples from the Agnes and Filip adits outflow.<br />
Selective dissolution analysis is based on the different<br />
dissolution rates of various mineral phases and compounds12 .<br />
Based on the FeOX /FeDT ratio in analyzed ochre samples, it<br />
was possible to evaluate the relative crystallinity of the FeIII oxides and oxyhydroxides. Samples were dissolved by three<br />
different methods:<br />
• dissolution of Fe oxides and oxyhydroxides in hydrochloric<br />
acid<br />
• dissolution of Fe oxides and oxyhydroxides in dithionate-citronate-bicarbonate<br />
(DCB)<br />
•<br />
dissolution of Fe oxides and oxyhydroxides in ammonium<br />
acetate<br />
Samples of soils, sediments, waters, impoundment material,<br />
ochre, and plant tissues were analyzed in the geochemical<br />
laboratories of the State Geological Survey of the Slovak<br />
Republic. Selected chemical parameters (As, Sb, Zn, Cu, Pb,<br />
Fe, Al, Mn) were analyzed by atomic absorption spectrometry<br />
in the < 0.125 mm mesh size fraction.<br />
Results<br />
Chemical analyses of the various environmental media<br />
sampled confirm the previous field investigation findings that<br />
the area surrounding the abandoned Poproč Sb deposit is highly<br />
polluted.<br />
Results of selected chemical analysis data for soils are<br />
shown in Table I. The most important contaminants in the<br />
area are antimony and arsenic; their association is in accordance<br />
with the fact that the two elements are chemically similar<br />
13,14 . Their toxicology is also similar, and they are both<br />
carcinogenic 15,16 . Extremely high concentrations of Sb were<br />
recorded in the area surrounding the Agnes adit, with values<br />
ranging from 4,700 mg kg –1 to 10,000 mg kg –1 . The highest<br />
As level measured 56,900 mg kg –1 . These extreme Sb and As<br />
concentrations in soils near the Agnes adit are both a result of<br />
recent contamination. A 2 m thick layer of ochre precipitates<br />
was observed over a 200 m 2 area coming from the Agnes adit<br />
until the year 2004 when stable conditions were provided.<br />
The ochre precipitate, which potentially contained similarly<br />
high concentrations of toxic elements were in the past mechanically<br />
removed by water outflowing from the Agnes adit,<br />
discharging to the catchment of the Olšava River. Chemical<br />
analysis of ochre samples collected from the Agnes adit and<br />
dissolved in HCl show high content of As and Sb in ochre<br />
material (Table II); these toxic elements have long contaminated<br />
the surface water and stream sediments of the Olšava<br />
and Bodva Rivers.<br />
Antimony, analogous to arsenic, has an ability to bind<br />
to plant tissues and can be phytotoxic 17 . Considering the often-described<br />
mobility of these elements likely controlled by
Chem. Listy, 102, s265–s1311 (2008) Environmental Chemistry & Technology<br />
Fig. 1. Schematic map of investigated area<br />
Table I<br />
Selected chemical parameters of soil samples from surrounding<br />
of Sb deposit Poproč [mg kg –1 ]. Fe, Mn, Al, SO4<br />
expressed in %<br />
Adit Adit Adit Adit Im- Im<br />
Adit pound-<br />
Filip- Agnes Agnes Agnes pound-<br />
Filip<br />
subs OU OA1 OA2 ment ment<br />
(cover)<br />
As 72 298 11,060 26,380 56,900 1,898 2,800<br />
Sb 3,270 86,230 9,254 4,697 9,993 4,747 4,190<br />
Pb 274 1723 25 < 5 < 5 351 352<br />
Zn 122 352 135 1,655 3,272 71 60<br />
Cu 54 155 48 34 52 15 13<br />
Fe 4.23 4.29 17 30.8 35.6 0.92 5.67<br />
Mn 0.174 0.106 0.262 0.073 0.02 < 0.001 0.002<br />
Al 7.97 6.92 4.73 1.44 0.07 5.06 3.38<br />
SO 4 0.13 0.11 0.14 0.27 0.24 0.27 1.97<br />
Fe, Mn oxides and pH 18 , their biosorption into organisms or<br />
biovolatilization in organisms 19,20 is important. Plant tissues<br />
were sampled in the area of interest and high concentrations<br />
s381<br />
of As and Sb were detected in selected plant species. near<br />
the Agnes adit, the maximum As and Sb values of plant tissue<br />
were, respectively, 45.8 mg kg –1 and 1.9 mg kg –1 (dry<br />
weight).<br />
Table II<br />
Ochre samples chemical analyses (mg.kg-1)<br />
Chemical Spring 300 m nW Adit<br />
parameter from adit Agnes Agnes<br />
Fe 106,000 336,000<br />
As 8,600 34,000<br />
Sb 5,200 6,100<br />
Pb 104 97<br />
Zn 160 831<br />
Cu 44 0<br />
Mn 1,580 210<br />
Hg 0.4 1<br />
Cd 0 12<br />
na 8,540 1,360<br />
K 1,720 420<br />
Ca 10,600 2,460<br />
Mg 6,070 830<br />
Al 7,660 2,560<br />
S 23,300 5,950<br />
Conclusions<br />
The results of preliminary mineralogical and geochemical<br />
sampling near the abandoned Poproč Sb deposit reveal<br />
significant contamination of the surrounding environment.<br />
The most important toxic elements in the study area are As<br />
and Sb. High concentration levels measured in adit estuaries<br />
could be caused by inadequate mine closure/rehabilitation.<br />
Deposition of highly contaminated ochre precipitates near the<br />
Agnes adit and outflow are indicative of contaminated mine<br />
waters; inadequate recultivation has caused ochre precipitates<br />
(containing As and Sb) to be resuspended and to flow into the<br />
Olšava river catchment. The next step should be research into<br />
geochemical and mineralogical mobility and the bioavailability<br />
of the main contaminants in the environmental media.<br />
This work has been supported by the Slovak Research<br />
and Development Agency under contract No. APVV-0268-<br />
06.<br />
REFEREnCES<br />
1. Chovan M., Háber M., Jeleň S., Rojkovič I.: Ore textures<br />
in the Western Carpathians. Slovak Academic Press,<br />
Bratislava 1994.<br />
<strong>2.</strong> Miner. Slov. 35, 131 (2003). (in Slovak)<br />
3. Ministry of Education of the Slovak Republic: Risk contamination<br />
assessment of surroundings of Sb, Au and<br />
sulphide deposit in Pezinok and proposition for remediation:<br />
toxicity of As and Sb, acidification, AV/901/2002<br />
(VTP25) (2006 ME SR). (in Slovak)
Chem. Listy, 102, s265–s1311 (2008) Environmental Chemistry & Technology<br />
4. Slov. Geol. Mag. 5, 179 (1999).<br />
5. Geochim. Cosmochim. Acta 71, 4206 (2007).<br />
6. Andráš P., Milovská S., Kušnierová M., Adam M., Šlesarová<br />
A., Chovan M., Hajdušková ľ., Lalinská B.: 7th<br />
International Symposium on Environmental Geotechnology<br />
and Global Sustainable Development: Environmental<br />
hazards at the Sb-Au-S deposit Pezinok (Slovakia)<br />
in relation to the chemical and biological-chemical<br />
oxidation processes, Helsinki, 8. – 10. June 2004, p. 10<br />
7. Slov. Geol. Mag. 6, 61 (2000).<br />
8. Env. Geol. 51, 387 (2007).<br />
9. Ministry of Environment of the Slovak Republic: Poproč<br />
– tailings piles, ore dumps, impoundments, search<br />
investigation, state by April 1996, (1996 ME SR). (in<br />
Slovak)<br />
10. Ministry of Agriculture of the Slovak Republic: Maximum<br />
permissible values of harmful pollutants in soil and<br />
definition of qualified organizations to determine real<br />
values of these pollutants, no. 531/1994-540 (MA SR<br />
1994). (in Slovak)<br />
s382<br />
11. Government Directive of the Slovak Republic: Demands<br />
on water assigned to human usage and quality control<br />
assigned to human use, no. 354/2006 (2006). (in Slovak)<br />
1<strong>2.</strong> Geochim. Cosmochim. Acta 45, 421 (1981).<br />
13. WHO: Guidelines for Drinking Water Quality: Health<br />
Criteria and Other Supporting Information, (WHO<br />
1996).<br />
14. Earth-Science Rev. 59, 125 (2002).<br />
15. Water Res. 34, 4304 (2000).<br />
16. J. Clean. Prod. 13, 19 (2005).<br />
17. Ann. Rev. Plant Physiol. 29, 511 (1978).<br />
18. J. Hydrol. Hydromech. 55, 223 (2007).<br />
19. Environ. Pollut. 124, 93 (2003).<br />
20. Environ. Sci. and Pollut. Res. 14, 31 (2007).
Chem. Listy, 102, s265–s1311 (2008) Environmental Chemistry & Technology<br />
P24 DETERMINATION OF VOLATILE<br />
COMPOuNDS AND SACChARIDES AT ALDER<br />
wOOD hyDROLySIS<br />
FRAnTIŠEK KAČíK a , MARTA LAUROVá a and<br />
DAnICA KAČíKOVá b<br />
a Department of Chemistry and Chemical Technologies,<br />
b Department of Fire Protection,<br />
Faculty of Wood Sciences and Technology, Technical University<br />
in Zvolen, T. G. Masaryka 24, 960 53 Zvolen, Slovak<br />
Republic,<br />
kacik@vsld.tuzvo.sk<br />
Introduction<br />
A pretreatment of lignocellulosic biomass at the production<br />
of pulp, ethanol and other technically important chemicals,<br />
is a subject of research for a long time. The pretreatment<br />
main goal is to remove lignin and hemicelluloses, to decrease<br />
celullose crystallinity and to increase porosity of the lignocellulosic<br />
material. The various physical, physico-chemical an<br />
biological processes of pretreatment are used for this purpose<br />
at present 1,2 .<br />
One method is a high-pressure water prehydrolysis. It is<br />
realized at a wide range of temperatures (160–260 °C), but in<br />
the short time intervals (0.42–7 min) in dependence on wood<br />
species 3 .<br />
The hydrothermal pretreatments of lignocellulosic materials<br />
have got a different effect on their main components.<br />
Extractives, hemicelluloses and watersoluble lignin are released<br />
from wood in the temperature range 150–230 °C. The<br />
cellulose fraction depolymerises at the higher temperatures<br />
(210–280 °C) 3,4 .<br />
At wood hydrolysis also other compounds arise except<br />
saccharides. They can be processed (methanol, acetic acid,<br />
propionic acid, 2-furaldehyde), resp. their negative environmental<br />
influence must be solved 5 . Their concentration in the<br />
hydrolysates depends on wood species and the hydrolysis<br />
conditions, mainly on the temperature and the time of the<br />
treatment.<br />
The water prehydrolysis of biomass (by saturated water<br />
steam and hot high-pressure water) can be considered as a<br />
environmentally friendly technology, where it is not necessary<br />
to add any chemicals 6 .<br />
This paper aim was to research the release of saccharidic<br />
part and volatile compounds from alder wood (Alnus glutinosa<br />
(L.) GAERTn.) during the water hydrolysis.<br />
Experimental<br />
M a t e r i a l<br />
wood samples preparation<br />
The samples from the trunk wood of 59 years old alder<br />
(Alnus glutinosa (L.) GAERTn.) were chipped to the dimensions<br />
2 × 2 × 10 mm.<br />
s383<br />
wood analyses<br />
The amount of extractives soluble in the mixture toluene-ethanol<br />
(1 : 2) was determined in accordance with ASTM<br />
Standard D 1107-96 7 , the amount of cellulose by Seifert<br />
method 8 and the amount of holocelluse by Wise method 9 .<br />
Lignin amount was determined in accordance with ASTM<br />
Standard D 1106-96 10 .<br />
H y d r o l y s i s<br />
Wood chips (2 g) were put into the stainless autoclaves<br />
with internal volume 12 cm 3 and they were refilled by distilled<br />
water. The solid/liquor ratio was 1 : 4.<br />
The prehydrolysis was performed in the thermostate at<br />
the temperatures 160, 180 and 200 °C. The time of treatment<br />
was 30, 60, 120 and 240 min. Then the autoclave was cooled<br />
into the temperature 20 °C and the hydrolysate was filtrated.<br />
H y d r o l y s a t e s A n a l y s e s<br />
ph value<br />
Hydrolysates pH values were determined by the potenciometric<br />
method with pH meter inoLab pH 720 (WTW<br />
GmbH).<br />
Saccharides<br />
Saccharides amount in the hydrolysates was determined<br />
in the form of aldonitrilacetates by GC method 11 at the<br />
following conditions: column – 5 % PEGA Chromaton n-<br />
AW-DMCS (0.16–0.2 mm) 240 cm × 0.35 cm, column temperature<br />
– 200 °C, injector temperature – 260 °C, detector<br />
temperature – 250 °C, detector – FID, carrier gas – n 2 .<br />
Volatile compounds<br />
The volatile compounds in the hydrolysates (methanol,<br />
acetic acid, propionic acid, 2-furaldehyde) were determined<br />
by the method of GC 12 at the following conditions: column<br />
– Chromosorb 102 (80–100 mesh) 120 cm × 0.35 cm, column<br />
temperature – 195 °C, injector temperature – 250 °C, detector<br />
temperature – 250 °C, detector – FID, carrier gas – n 2 .<br />
Results<br />
During the hydrothermal treatment of wood, various<br />
acid compounds are released. It is confirmed by the measured<br />
values of pH (Table I). The increase of the hydrolysates<br />
acidity causes next degradation of wood matter and the glycosidic<br />
bonds in the polysaccharides are cleavaged.<br />
The hydrolysates acidity is due to the formation of socalled<br />
nascent organic acids (formic, acetic, propionic e.g.),<br />
which are formed by the cleavage of some functional groups<br />
from the polysaccharides and also by the decomposition of<br />
arised monosaccharides. These acids have got an important<br />
influence on the next course of the hydrolysis, therefore they<br />
catalyse the glycosidic bond cleavage in the polysaccharides<br />
13,14 .<br />
The used alder wood contained 84.06 % of holocellulose,<br />
41.26 % of cellulose, 21.45 % of lignin and 4.97 % of<br />
extractives.
Chem. Listy, 102, s265–s1311 (2008) Environmental Chemistry & Technology<br />
Table I<br />
Hydrolysates pH value<br />
Temperature [°C] Time [min] pH<br />
160 30 4.14<br />
160 60 3.46<br />
160 120 3.29<br />
160 240 3.18<br />
180 30 3.61<br />
180 60 3.18<br />
180 120 3.03<br />
180 240 3.09<br />
200 30 3.17<br />
200 60 <strong>2.</strong>95<br />
200 120 <strong>2.</strong>92<br />
200 240 <strong>2.</strong>97<br />
Table II<br />
Yield of monosaccharides in hydrolysates<br />
Temperature [°C] Time [min] Monosaccharides [g dm–3 ]<br />
160 30 1.56<br />
160 60 <strong>2.</strong>84<br />
160 120 4.46<br />
160 240 9.12<br />
180 30 <strong>2.</strong>46<br />
180 60 14.40<br />
180 120 7.96<br />
180 240 3.15<br />
200 30 3.05<br />
200 60 4.71<br />
200 120 <strong>2.</strong>23<br />
200 240 1.92<br />
At the temperature 160 °C the monosaccharides amount<br />
in the hydrolysates increased during the total time range<br />
(Table II). At the higher temperatures the maximum yield of<br />
monosaccharides was determined during 60 min of the hydrolysis.<br />
It is in accordance with 2-furaldehyde amount increase<br />
in the hydrolysate (Table IV). The highest concentration<br />
of monosaccharides was observed at the temperature 180 °C<br />
and the time of the hydrolysis 60 min.<br />
The similar trend we can see at the determination of total<br />
saccharides amount (Table III) determined after the hydrolysis<br />
by 3 % sulfuric acid. At the biggest yields of the saccharides<br />
(180 °C, 60 min) approximately one half of the saccharides<br />
amount is present in the form of monosaccharides and second<br />
half in the form of oligosaccharides and polysaccharides.<br />
In the hydrolysates there are various volatile compounds.<br />
Their amounts increase in dependence on the temperature and<br />
the time of treatment in most cases (Table IV).<br />
Methanol, arising mainly by the methoxyl group cleavage,<br />
is extreme toxic. In some cases it is necessary to remove<br />
it before the next treatment of the hydrolysate. In hardwoods<br />
there are 3–5 % of acetyl groups (CH 3 CO-), they give rise<br />
s384<br />
Table III<br />
Yield of total saccharides in hydrolysates<br />
Temperature Time Total saccharides<br />
[°C] [min] [g dm –3 ]<br />
160 30 <strong>2.</strong>43<br />
160 60 3.35<br />
160 120 15.06<br />
160 240 14.06<br />
180 30 3.83<br />
180 60 30.48<br />
180 120 1<strong>2.</strong>36<br />
180 240 3.29<br />
200 30 14.97<br />
200 60 6.40<br />
200 120 3.57<br />
200 240 1.23<br />
Table IV<br />
Yield of volatile compounds in hydrolysates<br />
Temp- Acetic Propionic 2-Furerature<br />
Time Methanol acid acid aldehyde<br />
[min] [g dm<br />
[°C]<br />
–3 ]<br />
[g dm –3 ] [g dm –3 ] [g dm –3 ]<br />
160 30 0.11 0.28 0.10 0.02<br />
160 60 0.31 1.35 0.53 0.14<br />
160 120 0.63 4.46 1.17 0.63<br />
160 240 0.54 5.77 0.94 1.64<br />
180 30 0.18 0.67 0.18 0.05<br />
180 60 0.47 5.35 0.92 0.89<br />
180 120 0.82 7.73 0.74 7.24<br />
180 240 0.84 7.52 0.65 9.23<br />
200 30 0.29 3.41 0.61 0.46<br />
200 60 0.40 7.72 0.59 6.43<br />
200 120 0.97 10.03 0.66 8.17<br />
200 240 1.13 <strong>2.</strong>95 0.82 5.12<br />
acetic acid at the hydrolysis. The acetic acid amount increases<br />
mainly at the first 120 min of the hydrolysis, then their<br />
increase is retarded. It corresponds with the results of birch<br />
wood hydrolysis, where the increase of acetic acid amount<br />
was slowed or decreased in the hydrolysis at the temperature<br />
200 °C 15,16 .<br />
2-Furaldehyde arises by pentose dehydratation and it<br />
can be isolated as a valuable product under certain conditions.<br />
The temperature of 180 °C causes the heavy increase<br />
of 2-furaldehyde, its concentration increases due to the condensation<br />
reactions at the temperature 200 °C.<br />
Conclusions<br />
From the experimental results obtained at the hydrolysis<br />
of alder wood can be concluded that at the mild conditions<br />
of hydrolysis the acetic acid and 2-furaldehyde concentration<br />
increases due to the saccharides deacetylation and dehydration,<br />
respectively. The amount of 2-furaldehyde decrease is
Chem. Listy, 102, s265–s1311 (2008) Environmental Chemistry & Technology<br />
due to its participation in the condensation reactions at the<br />
temperature 200 °C.<br />
The maximum of both monosaccharides and total saccharides<br />
contents were found at the temperature 180 °C and<br />
the time 60 min of the treatment.<br />
This work has been supported by the Slovak Reaserch<br />
and Development Agency under the contract No. APVV-<br />
0282-06 and by the Slovak Scientific Grant Agency under the<br />
contract No. VEGA 1/0385/08.<br />
REFEREnCES<br />
1. Sun Y., Cheng J.: Bioresour. Technol. 83, 1 (2002).<br />
<strong>2.</strong> Mosier n., Wyman Ch., Dale B., Elander R., Lee Y.Y.,<br />
Holtzapple M., Ladish M.: Bioresour. Technol. 96, 673<br />
(2005).<br />
3. Garrote G., Domínguez H., Parajó J. C.: Holz Roh<br />
Werkst 57, 191 (1999).<br />
4. Sasaki M., Adschiri T., Arai K.: Bioresour. Technol. 86,<br />
301 (2002).<br />
5. Horbaj P.: Energia 3, 52 (2001).<br />
6. Garrote G., Domínguez H., Parajó J. C.: J Chem Tech<br />
Biotechnol. 74, 1101 (1999).<br />
s385<br />
7. ASTM Standard D 1107-96: Standard test method for<br />
ethanol toluene solubility of wood (1998).<br />
8. Seifert V. K.: Das Papier 1960, 104.<br />
9. Wise L. E., Murphy M., D’Addieco A. A.: Paper Trade<br />
J. 122, 35 (1946).<br />
10. ASTM Standard D 1106-96: Standard test method for<br />
acid insoluble lignin in wood (1998).<br />
11. Kačík F., Solár R. : Analytická chémia dreva. Technická<br />
univerzita vo Zvolene, Zvolen 2000.<br />
1<strong>2.</strong> Kačík F.: Tvorba a chemické zloženie hydrolyzátov v<br />
systéme drevo-voda-teplo. Technická univerzita vo Zvolene,<br />
Zvolen 2001.<br />
13. Conner A. H., Lorenz L. F.: Wood Fiber Sci. 18, 248<br />
(1986).<br />
14. Garotte G., Domínguez H., Parajó J. C.: Holz Roh<br />
Werkst 59, 53 (2001).<br />
15. Sundqvist B., Karlsson O., Westenmark U.: Wood Sci.<br />
Technol. 40, 549 (2006).<br />
16. Kačík F., Výbohová E., Kačíková D.: Acta Facultatis<br />
Xylologiae 49, 39 (2007).
Chem. Listy, 102, s265–s1311 (2008) Environmental Chemistry & Technology<br />
P26 MODELING OF DISPERSION OF wINDbORNE<br />
MATERIAL IN ATMOSPhERE<br />
MICHAL KAPOUn a , RADIM DVOřáK b , FRAnTIŠEK<br />
ZBOřIL b and IVAn MAŠEK a<br />
Brno University of Technology,<br />
a Faculty of Chemistry,<br />
b Faculty of Information Technology,<br />
kapoun@fch.vutbr.cz<br />
Introduction<br />
Air pollution modeling is an attempt to describe the<br />
functional relation between emissions and occurring concentrations<br />
and deposition. Air pollution measurements present<br />
these occurring concentrations and deposition, but they can<br />
only give a snapshot at specific locations and times. In principle,<br />
the air pollution modeling can give a more complete and<br />
consistent description, including an analysis of the causesthe<br />
emissions sources-which have led to these concentrations/deposition.<br />
Air pollution models play an important role in science,<br />
because of their capability to investigate the importance of the<br />
relevant processes, and they play a major role in application<br />
(e.g. fire brigade intervention during chemical accidents) 1 .<br />
The atmospheric dispersion modeling, where the air pollution<br />
modeling belongs to, has a long history and it dates<br />
back to the end of 19th century, when Reynolds in 1895(ref. 2 )<br />
formulated criterion for the change from laminar to turbulent<br />
flow, in other words the diffusion, in pipes. During the next<br />
few decades, the huge progress was done in the describing of<br />
mathematical formulas and their correspondences to observations.<br />
These formulas were evaluated in analytical way<br />
and they were restricted to simple cases where the solution<br />
could be found. nowadays, the trend of atmospheric dispersion<br />
evolution is based on the numerical solution of diffusion<br />
equation.<br />
The diffusion equation is expressed in a form of partial<br />
differential equation (PDE). The solution of the equation can<br />
be derived by analytical process that is often very difficult<br />
to find. There exist many cases of PDE where the analytical<br />
solution to the PDE does not even exist. Thus, many kinds of<br />
numerical methods have been developed and they have been<br />
used next to the analytical ones. However, the problem exists<br />
in this kind of evaluation and it is the arising of numerical error.<br />
The only ways to check the accuracy is either to compare<br />
the results with the exact analytical solution or to compare it<br />
with the observation.<br />
In our work we have used the first case thus the form<br />
of diffusion equation had to be simplified so as its analytical<br />
solution can be calculated. The reason originates from the<br />
fact that it is not possible to find the exact analytical solutions<br />
in the majority of cases where the solutions are looked for 2 .<br />
s386<br />
Mathematical Models<br />
The general form of the diffusion equation describing<br />
atmospheric dispersion can be expressed as follows 1 :<br />
∂ C <br />
+ ∇ Cu = ∇( D∇<br />
C)<br />
+<br />
∂t<br />
+ chemistry + emmisions +<br />
+ dry _ deposition +<br />
+ wet _ deposition<br />
where C is a pollution concentration, u is a wind velocity,<br />
D are diffusion coefficients (their coordinate axes are D x ,<br />
D y and D z , respectively).<br />
The chemistry term presents atmospheric chemistry<br />
term that is used for the determination of a chemical substance<br />
influence to the atmosphere and to the dispersion process<br />
itself. The emissions term expresses the rate of the emissions<br />
in the atmosphere and its relation to the atmospheric<br />
dispersion of the specific pollutant. The last two terms, dry<br />
and wet depositions, are the major sink terms in the model<br />
and besides they determine the pollutant behavior above the<br />
terrain surface.<br />
In our case, we have used the advection-diffusion equation<br />
(A-DE) which is a part of equation (1) and where the<br />
terms chemistry, emissions and wet deposition are neglected.<br />
The reasons for this choice were that the chemistry and emissions<br />
terms are complex to find the analytical solution for<br />
them. The wet deposition plays an important role for watersoluble<br />
species only and it is not our primary concerns at this<br />
moment.<br />
Full form of A-DE can be expressed as follows:<br />
∂C <br />
∂C<br />
= −∇ Cu + ∇( D∇<br />
C) + W<br />
∂t ∂z<br />
where C, u and D symbols have the same meanings as<br />
in equation (1). W is a pollutant gravitational settling velocity.<br />
Equation (2) can be furthermore simplified if we apply<br />
following assumptions. When the wind speed value is sufficiently<br />
large, a diffusive transport is negligible in wind<br />
direction with respect to advection (Ermak 3 ). Moreover, the<br />
coefficients D y , and D z , depend on the downwind distance<br />
x only and they are therefore independent on the crosswind<br />
distance y and height distance z. From these facts, the diffusive<br />
terms can be simplified - the brackets are not needed<br />
anymore and the second derivatives appear. Last assumption<br />
is the stationary source with constant strength during time.<br />
Thus, the result of our simplification is a steady state form of<br />
equation (2):<br />
(1)<br />
(2)
Chem. Listy, 102, s265–s1311 (2008) Environmental Chemistry & Technology<br />
2<br />
∂C<br />
∂ C<br />
ux = Dy<br />
2 z<br />
∂x<br />
∂y<br />
( x)<br />
+ D ( x)<br />
2<br />
∂ C ∂C<br />
+ W 2<br />
∂z<br />
∂z<br />
Here u x is a wind speed in the x direction; all other variables<br />
are the same as in equation (2).<br />
To be completed, the PDE (3) needs to have specified<br />
boundary conditions. The first condition follows from an assumption<br />
of continuous point source with constant strength<br />
located in (0,0,h) coordinates:<br />
The next two conditions follow from the natural assumption<br />
that pollutant concentration approaches zero far from the<br />
source in the lateral y directions and high above the source:<br />
( )<br />
(3)<br />
C x, +∞ , z = 0 .<br />
(3b)<br />
( )<br />
C x, −∞ , z = 0 .<br />
(3c)<br />
C( x, y , +∞ ) = 0 .<br />
(3d)<br />
The last boundary condition is that pollutant deposition<br />
onto the ground occurs at a rate proportional to local air<br />
concentration 3 (for simplicity, the flat ground is taken into<br />
account only):<br />
⎡ ∂C<br />
⎤<br />
⎢<br />
D W C<br />
⎥<br />
vC<br />
⎣ ⎦<br />
( ∞ ) + = [ ] = 0<br />
z z<br />
∂z<br />
z=<br />
0<br />
.<br />
(3a)<br />
(3e)<br />
The deposition velocity v depends on many factors such<br />
as type and size of pollutant particles, the roughness of terrain<br />
and its other surface properties and the meteorological<br />
conditions.<br />
A n a l y t i c a l m o d e l<br />
The analytical solution of equation (3) with respect to<br />
boundary conditions (3a-e) is derived in (refs. 3,5,6 ), and it is<br />
done by expression (4):<br />
(4)<br />
s387<br />
The standard deviations of plume width and height, σ y<br />
and σ z , are defined in terms of their respective diffusion coefficients<br />
3,6 :<br />
The error function erfc (ξ) is defined in (ref. 4 ) as:<br />
n u m e r i c a l M o d e l<br />
In our model we have decided to use the well know<br />
method of lines, which was frequently used for solving different<br />
kinds of PDEs by classical analog and hybrid computers.<br />
In order to perform this method the given PDE (3) must be<br />
transformed into the system of ordinary differential equations<br />
(ODEs). To do that the discretization of all variables except<br />
one must be done. In our case we have discretized y (points<br />
j, step Δy) and z (points k, step Δz) variables and we have<br />
let the x variable continuous (because of the assumed wind<br />
direction).<br />
The obtained system of ODEs is as follows:<br />
( , , )<br />
dC x j k<br />
∂x<br />
=<br />
( ) ( , + 1, ) − 2 ( , , ) + ( , −1,<br />
)<br />
Dy x C x j k C x j k C x j k<br />
⋅ +<br />
u y<br />
2<br />
x<br />
∆<br />
( ) ( , , + 1) − 2 ( , , ) + ( , , −1)<br />
D x C x j k C x j k C x j k<br />
+<br />
z<br />
⋅ +<br />
u z<br />
2<br />
x<br />
∆<br />
( , , + 1 ) − ( , , −1)<br />
.<br />
W C x j k C x j k<br />
+ ⋅<br />
ux 2∆z<br />
The system of ODEs (6) is solved inside the <br />
interval along the y direction, and inside the along the<br />
z direction, where N j and N k are natural numbers. Thus the<br />
total number of ODEs is (2N j + 1) × (N k + 1) and all equations<br />
can be solved for current time point in parallel.<br />
The boundary condition (3a) is transformed to new initial<br />
conditions (7a):<br />
C<br />
C<br />
( 0,<br />
0,<br />
H )<br />
Q<br />
=<br />
u ∆y∆z<br />
x<br />
( 0,<br />
j,<br />
k)<br />
= 0 otherwise .<br />
(7)<br />
(7a)<br />
And new boundary conditions (7b–e) for the ODEs system<br />
(7) with respect to (3b–e) are:<br />
(5)<br />
(6)
Chem. Listy, 102, s265–s1311 (2008) Environmental Chemistry & Technology<br />
( x,<br />
+ N , k)<br />
= 0.<br />
C j<br />
( x,<br />
−N , k)<br />
= 0.<br />
C j<br />
C<br />
( x,<br />
j,<br />
N ) = 0.<br />
+ k<br />
( ∞)<br />
Dz<br />
C(<br />
x,<br />
j,<br />
0)<br />
=<br />
C(<br />
x,<br />
j,<br />
2)<br />
.<br />
2∆z(<br />
v −W<br />
) + D<br />
z<br />
( ∞)<br />
(7b)<br />
(7c)<br />
(7d)<br />
(7e)<br />
For integration of the system of ODEs (7) the 4 th order<br />
Runge-Kutta method was chosen. It has sufficient accuracy<br />
as is shown in the next chapter.<br />
Results<br />
As was mentioned above equation (3) supposes one point<br />
source that has constant strength. It means that the amount of<br />
pollutant is constant during time. The wind flows along x axis<br />
with constant speed and the ground is flat everywhere. In our<br />
experiments, all diffusion coefficients were constant in every<br />
space points during time, for simplicity.<br />
now everything is defined to solve our model of<br />
PDE (3) with boundary conditions (3a–e). The experiment<br />
has been done with following coefficient setting. The diffusion<br />
coefficients has been set like that: D y = 0.23 m 2 s –1 ,<br />
D z = 0.23 m 2 s –1 which is the parameter of ammonia, other<br />
coefficients has been: v = 2 m s –1 , W = 3 m s –1 , u x = 2 m s –1 ,<br />
Q = 0.1 kg s –1 and H = 1.5 m.<br />
The space discretization has been chosen as follows:<br />
N i = 600, N j = 50, N k = 50, Δx = 0.005 m, Δy = 0.05 m and<br />
Δz = 0.05 m. In this case the assumed space 3 m × <strong>2.</strong>5 m × <strong>2.</strong>5 m<br />
has been discretized into 1,500,000 points in which the equations<br />
have been calculated.<br />
V i s u a l i z a t i o n<br />
We made simple program/tool for solving given A-DE<br />
and for the visualization of the results with possibility of<br />
comparison the analytical and the obtained numerical soluti-<br />
Fig. 1. xy plane cut in zero depth, which means that the ground<br />
pollutant dispersion is shown. The wind flows from left to right<br />
s388<br />
ons. The program has possibility to make the cuts through the<br />
perpendicular grid in XY, XZ and YZ planes in any depth and<br />
the appropriate grid points can be plotted.<br />
Fig. 1. and Fig. <strong>2.</strong> show the XY and XZ cuts for our<br />
above-defined experiment. The level of gray (the lighter the<br />
more concentrated) expresses the amount of concentration of<br />
pollutant at each point - the most concentrated means approximately<br />
0.5% of source concentration.<br />
Fig. <strong>2.</strong> xZ plane cut in depth of 25 of overall depth 50 which<br />
means that the cut in depth of point source is shown. The wind<br />
flows from left to right<br />
Scales of axes (x is horizontal, y is vertical) in figures<br />
above are these:<br />
• Fig. 1.: x axis: m, y axis: m<br />
• Fig. <strong>2.</strong>: x axis: m, y axis: m<br />
The three-dimension (3D) visualization is another way<br />
to represent the calculated data in space. It has many advantages<br />
and gives to the user tool for fast investigation of the<br />
result. Many methods of gas or fluid visualization were developed<br />
however not all are suitable for our purpose. We can<br />
mention the stream ribbons, stream surfaces, particle traces,<br />
vector fields etc. 7 .<br />
Fig. 3. 3D visualization of pollutant dispersion in the atmosphere.<br />
The white color points show the highest concentration of<br />
pollutant, the black color points show its low concentration
Chem. Listy, 102, s265–s1311 (2008) Environmental Chemistry & Technology<br />
In our case, we have inspired in particle visualization<br />
of pollutant concentration. After many experiments of different<br />
ways of visualization, we conclude to the one showed in<br />
Fig. 3. The concentration is expressed by two basic methods<br />
– by color and by particle count. The level of the top concentration<br />
can be adjusted – in Fig. 3. the white means approximately<br />
1 % of source concentration, thus the user can see that<br />
this level of concentration will occurs in the presented scenario<br />
on the ground too. For the better perception of depth, the<br />
further particles are darkened, they do not interfere with the<br />
foreground particles.<br />
A c c u r a c y<br />
The problem of numerical calculation is the stability of<br />
the system and the accuracy of the calculation. Both depend<br />
especially on the size of calculation steps. In our case, when<br />
we have transformed the PDE (3) into the system of ODEs (7),<br />
three calculation steps exist.<br />
The first step Δx is a step along x axis and it is used as<br />
integration step in described experiment. Thus, its size primarily<br />
influences the accuracy of obtained results.<br />
Last two steps Δy and Δz discretize y and z variables and<br />
they have impact on the size of ODEs system (7). These steps<br />
subdivide the space in lateral directions and both are used<br />
for approximation of the second derivatives appearing in<br />
PDE (3). Therefore, they influence both the stability and the<br />
accuracy and they thus indirectly affect the size of Δx.<br />
Fig. 4. The absolute error of the numerical calculation. The<br />
vertical axis shows the error, the horizontal axis shows the distance<br />
from source along x axis (in wind direction)<br />
In case of our numerical solution of A-DE there exist<br />
specific properties of the calculation behavior, as you can<br />
see from our error measurement shown in Fig. 4., where the<br />
absolute error is shown. The error evolution is shown along<br />
the wind direction. More specifically the error is the mean<br />
error in all points (one plane) of the specific x distance.<br />
s389<br />
The greatest error along x axis has been measured close<br />
to the source, which is caused by definition of the initial condition<br />
(7a). Fig. 4. shows other peak of error which is around<br />
0.7 m distance from the source. That is the place where the<br />
plume reaches the ground. The boundary condition (7e) which<br />
is the approximation of boundary condition (3e) is the main<br />
reason of this error existence. It must be noted that the numerical<br />
calculations were stable in spite of measured errors.<br />
Conclusion<br />
The numerical method of A-DE solution has been proposed<br />
and implemented and the results have been presented.<br />
In addition, the accuracy of our model has been verified by<br />
comparison with the analytical solution.<br />
Presented method is relatively simple and easy to implement,<br />
therefore, it can be relatively easy extend to more<br />
general form of the A-DE which will be the main goal of the<br />
future project progress. The extensions could be the general<br />
wind direction and speed, the non-flat ground with obstacles<br />
(trees, buildings etc.), non-stationary point source/sources<br />
etc. Moreover, other atmospheric parameters such as temperature<br />
and humidity and substance chemical properties will<br />
be added to the model for even more physically and chemically<br />
correct behavior.<br />
This preliminary work will be served as a base for more<br />
sophisticated model that will be a part of the intelligent system<br />
for human protection against consequences of industrial<br />
accidents and its analysis. To do that many experiments and<br />
measurements of real substance outflows, gas dispersion etc.<br />
will have to be done.<br />
REFEREnCES<br />
1. Builtjes P. J. H.: Air Pollution Modeling and Its Application<br />
XIV (Gryning S.E., Schiermeier F.A., ed,), p. 3,<br />
Major Twentieth Century Milestones in Air Pollution<br />
Modelling and Its Application, Springer US, 2004.<br />
<strong>2.</strong> Reynolds O.: Philos. Trans. R. Soc. London, Ser. A ,<br />
1895, 123.<br />
3. Ermak D. L.: Atmos. Environ. 11, 231 (1977).<br />
4. Jacobson M. Z.: Fundamentals of Atmospheric Modeling.<br />
Cambridge University Press, new York 2005.<br />
5. Slanco P., Bobro M., Hanculak J., Geldova E.: Acta<br />
Montanistica Slovaca,, 313 (2000).<br />
6. Roussel G., Delmaire G., Ternisien E., Lherbier R.:<br />
Environmental Modelling & Software 15, 653 (2000).<br />
7. Pagendarm H. G.: Visualization and Intelligent Design<br />
in Engineering and Architecture, p. 315, Scientific Visualization<br />
in computational fluid dynamics, Computational<br />
Mechanics Publications, 1993.
Chem. Listy, 102, s265–s1311 (2008) Environmental Chemistry & Technology<br />
P27 REPROCESSING OF DANGEROuS PuT-OuT<br />
ChEMICALS AND wASTES<br />
JURAJ KIZLInK<br />
Faculty of Chemistry, Brno University of Technology, Purkyňova<br />
118, 612 00 Brno,<br />
kizlink@fch.vutbr.cz<br />
Introduction<br />
The possibilities of reprocessing of some dangerous put-<br />
out chemicals and wastes are described. The usual way for<br />
the disposal of these compounds and wastes is the effective<br />
combustion in the suitable incinerator. However, this facility<br />
must be equipped with effective furnace, vigorous supplier<br />
for air-oxygen, hold-up of waste gases for at least six seconds<br />
and also with effective cleaning of emissions 1–4 . Procedure is<br />
relatively simple, however too expensive. Some of these chemicals<br />
and wastes can be disposed by total decomposition by<br />
means of strong reactive chemical agents 5–10 . We suggested<br />
and also elaborated the chemical reprocessing of these chemicals<br />
or their wastes into some non-toxic chemicals, suitable<br />
for technical praxis.<br />
Proposed Procedures<br />
B e n z i d i n e ( 4 , 4 ’ - d i a m i n o d i p h e n y l )<br />
( 9 2 - 8 7 - 5 )<br />
Benzidine as dangerous proved chemical cancerogen is<br />
already put out from chemical praxis and usually its diposal is<br />
due to combustion in suitable mixtures of more combustible<br />
materials 1–4 . This compoun is possible to change by reprocessing<br />
into aromatic etherical compound. The base of this<br />
reprocessing is diazotation of benzidine (base, hydrochlorine,<br />
sulfate) in the methanolic solution by dry hydrochlorine and<br />
then with addition of concentrated water solution or finelly<br />
powdered alkaline nitrite in the ice bath. When diazotization<br />
is over, another methanol is added and the reaction<br />
mixture is very slowly heated (simmered) in the large flask<br />
under reflux water-cooled condenser. The diazonium salt is<br />
slowly decomposed, the nitrogen gas escape and in the methanol<br />
solution after heating up to boiling is converted into<br />
the 4,4’-dimethoxydiphenyl compound (fragrance). nOTE:<br />
The volume in the flask must be at least twice larger than<br />
volume of reaction mixture because the escape of nitrogen<br />
gas is vigorous and it is possible to reach explosion hazard<br />
of the flask. This compound often contains 4,4’-dihydroxydiphenyl<br />
as impurity, especially if this reaction is carried out in<br />
the presence of water.<br />
When we need the pure compound, it is possible to<br />
apply alkalization by means of alkaline lye and then to use<br />
some methylating agent, such as methyl iodide or dimethyl<br />
sulfate 11,12 . In the case we use ethanol as solvent, after boiling<br />
the diphenyl compound is obtained.<br />
The similar procedure is possible to use for other aromatic<br />
amines and diamines, such as 1,4-diaminobenzene known<br />
as p-phenylene diamine (Ursol S, alergen, harmful substance)<br />
and other aromatic diamines as 1-aminonaphtalene<br />
s390<br />
(alfa-naphtyl amine) and 2-aminonaphtalene (beta-naphtyl<br />
amine, Feba, Fenyl-beta, PBn), which is also very potent<br />
carcinogen!<br />
H y d r a z i n e ( D i a z a n e ) / 3 0 2 - 0 1 -<br />
2 / a n d A l s o H y d r a z i n e - H y d r a t e<br />
( 1 0 2 1 7 - 5 2 - 4 )<br />
Hydrazine in the salts (hydrochloride, sulphate) is relatively<br />
stable substance and its disposal is quite safe 5–10 . Hydrazine<br />
in the form of base or hydrate is also effective carcinogen<br />
and its disposal is usually realized by the means of<br />
combustion 1–4 .This substance is possible to convert to prosperous<br />
compound by boiling with benzaldehyde resulting<br />
into substituted hydrazone, known in the cosmetic industry<br />
under trade name Benzalazine (cheap UV-absorber for suncreams).<br />
H y d r o g e n C y a n i d e ( F o r m o n i t r i l e ,<br />
Z y k l o n B ) ( 7 4 - 9 0 - 0 8 ) a n d A l k a l i n e<br />
C y a n i d e s K C n ( 1 5 1 - 5 0 - 8 ) a n d<br />
n a C n ( 1 4 3 - 3 3 - 9 )<br />
Hydrogen cyanide and alkaline cyanides are very toxic<br />
substances. They could be totally decomposed under influence<br />
of strong oxidative agents, such as alkaline hypochlorites,<br />
hydrogen peroxide and fumic nitric acid, even to nitrogen,<br />
carbon dioxide and water 13–15 . However all concentrated<br />
alkaline cyanides could be converted by heating of their ethanolic<br />
solution together with benzyl chloride and the benzyl<br />
cyanide (phenylacetonitrile). After addition of toluene into<br />
reaction mixture, followed by azeotropical distillation and<br />
removal of reaction water the phenylacetic acid ethyl ester<br />
is obtained. This compound is possible to obtain as pure substance<br />
(fragrance) after suitable drying (calcium chloride or<br />
sodium sulphate) and distillation. After reduction by hydrides<br />
it is possible to obtain 2-phenylethanol (fragrance) as the chemical<br />
substitute of natural rose oil.<br />
REFEREnCES<br />
1. Brunner C. D.: Incineration Systems, Selection and<br />
Design, Van nostrand - Reinhold, new York 1984.<br />
<strong>2.</strong> Dawson G. W., Mercer B. W.: Hazardous Waste Management,<br />
Wiley, new York 1986.<br />
3. Bilitewski B., Hardtle G., Marek K.: Abfallwirtschaft,<br />
Springer Verlag, Berlin 1991.<br />
4. LaGrega M. D., Buckingham P. L., Evans J. C.: Hazardous<br />
Waste Management, McGraw-Hill, new York<br />
2001.<br />
5. Lunn G., Sansone B.: Destruction of Hazardous Chemicals<br />
in the Laboratory, Wiley, new York 1990.<br />
6. Luxon S. G.: Hazards in the Chemical Laboratory,<br />
Royal Society of Chemistry, London 199<strong>2.</strong><br />
7. Richardson M. L.: Risk Management of Chemicals,<br />
Royal Society of Chemistry, London 199<strong>2.</strong><br />
8. Stricoff R. S., Walters D. B.: Handbook of Laboratory<br />
Health and Safety, Wiley, new York 1995.
Chem. Listy, 102, s265–s1311 (2008) Environmental Chemistry & Technology<br />
9. Chereminisoff n. P.: Handbook of Solid Waste Management<br />
and Waste Minimization Technologies, Elsevier<br />
Science, Burlington 2003.<br />
10. Shafer D. A.: Hazardous Material Characterization,<br />
Wiley, new York 2006.<br />
11. Černý J. V., Černý M., Paleček M., Procházka M.: Organická<br />
syntéza – Organikum, Academia, Praha 1971.<br />
1<strong>2.</strong> Večeřa M., Panchartek J.: Laboratorní příručka Organické<br />
chemie, SnTL, Praha 1987.<br />
s391<br />
13. Kizlink J.: Nakládání s odpady, Fakulta chemická VUT,<br />
Brno 2007<br />
14. Kuraš M.: Odpady – jejich využití a zneškodňování,<br />
VŠCHT, Praha 1994<br />
15. Kuraš M.: Odpadové hospodářství, Ekomonitor, Chrudim<br />
2008.
Chem. Listy, 102, s265–s1311 (2008) Environmental Chemistry & Technology<br />
P28 APLICATION OF ChITOSAN FOR wATER<br />
TREATMENT<br />
ZUZAnA KLíMOVáa , PETR DOLEJŠa,b and MILADA<br />
VáVROVáa aInstitute of Chemistry and Technology of Environmental<br />
Protection, Faculty of Chemistry, Brno University of Technology,<br />
Purkyňova 118, 612 00 Brno, Czech Republic,<br />
bW&ET Team, box 27, Písecká 2, 370 11 České Budějovice,<br />
Czech Republic,<br />
klimova-z@fch.vutbr.cz<br />
Abstract<br />
Results of experimental study focused on the removal<br />
of humic substances and turbidity by cationic biopolymer<br />
chitosan are presented. Chitosan is a natural high-molecular-weight<br />
polymer prepared from chitin, which is a polysaccharide<br />
found in the exoskeleton of shellfish like shrimps<br />
or crabs. The high content of amino groups provides very<br />
interesting heavy metals chelating properties to chitosan.<br />
Chitosan is partially soluble in diluted mineral acids such as<br />
HnO 3 , HCl, H 3 PO 4 . We have used 0.5% solutions of chitosan<br />
diluted in 0.1M HCl. Aggregates of humic substances after<br />
inorganic coagulant or chitosan addition were separated by<br />
centrifugation. Tests were made with model humic water.<br />
The aim of this work was to found optimal use of chitosan<br />
and to compare its coagulative effectivity with that of standard<br />
coagulants – ferrous and clayey sulphate.<br />
Introduction<br />
Chitosan is a derivative of chitin, a polysaccharide that is<br />
the major component of the shells of crustaceans and insects.<br />
Chitin consists of long chains of acetylated D-glucosamine,<br />
that is, glucosamine with acetyl groups on the amino groups<br />
(n-acetylglucosamine). Chitosan is n-deacetylated chitin,<br />
although the deacetylation in most chitosan preparations<br />
is not complete (see Fig. 1.). Chitin itself is usually prepared<br />
from crab or shrimp shells or fungal mycelia. Treatment with<br />
an alkali then produces chitosan with about 70% deacetylation<br />
1,2 .<br />
Fig. 1. Structure of chitosan<br />
Chitosan as cationic polysaccharide is an important<br />
polymer flocculant in water treatment. It is known that in<br />
chitosan’s molecular structure contains many amino groups<br />
s392<br />
(–nH 2 ) and hydroxyl groups (–OH) on the molecular chain.<br />
These –OH and –nH 2 groups contain single-pair electrons<br />
that can offer the electron pair to empty d-trajectories of<br />
metal ions. Chitosan can therefore be used for removal of<br />
many unwanted metal ions from water such as Al 3+ , Zn 2+ ,<br />
Cr 3+ , Hg 2+ , Ag + , Pb 2+ , Ca 2+ and Cu 2+ etc. Because the active<br />
amino groups in chitosan molecule can be protonated with H +<br />
in water into a cationic polyelectrolyte 3 the molecule shows<br />
effects of static attraction and adsorption. Thus chitosan can<br />
also flocculate particles into digger flocs which become deposited.<br />
Chitosan can be effectively used for removing COD<br />
(organic contaminant) and SS (solid suspending substances)<br />
in water treatment.<br />
Compared with traditional chemical flocculants, chitosan<br />
has the following advantages: the required dosage is<br />
lower, a the depositing velocity is higher, also the efficiency<br />
of removing COD, SS and metal ions is better, sludge treatment<br />
is easier and there is no further pollution. Chitosan<br />
as a flocculant for treating of water will be more expensive<br />
than traditional flocculants. The objective opf our work was<br />
to prepare a cheaper composite based on the chitosan flocculant<br />
material and to make this up from lobster shells 4 and<br />
other chemical flocculants. This composite chitosan flocculant<br />
was planned not only to reduce flocculation cost but also<br />
to improve flocculating function, in comparison with single<br />
chitosan flocculant and traditional chemical flocculant polyaluminium<br />
chloride (PAC) 5 .<br />
Impurities present in the raw water are in suspended,<br />
colloidal, and dissolved form. These impurities are dissolved<br />
organic and inorganic substances, microscopic organisms,<br />
and various suspended inorganic materials. It is necessary to<br />
destabilize and bring together (coagulate) the suspended and<br />
colloidal material to form particles. Afterwards these particles<br />
are removed by filtration.<br />
Coagulation is accomplished by the addition of ions<br />
having the opposite charge to that of the colloidal particles.<br />
Since the colloidal particles are almost always negatively<br />
charged, the ions which are added should be cations or<br />
positively charged. Typically, two major types of coagulants<br />
are added to water. These are aluminium salts and iron salts.<br />
The most common aluminium salt is aluminium sulphate, the<br />
most common iron salt is ferric sulphate. Iron and aluminium<br />
salts are used as primary coagulants and the reactions that<br />
occur after addition of these coagulants are fairly well elucidated.<br />
More recently, organic polyelectrolyte coagulants<br />
have become also used. Organic coagulants are sometimes<br />
used in combination with inorganic coagulants. Depending<br />
on the specific chemistry of the target water, polymer use can<br />
vary from as little as 5 % of the total coagulant dosage to as<br />
much as 100 % ref. 6 .<br />
Chitosan has been widely used in vastly diverse fields,<br />
ranging from waste management to food processing, medicine<br />
and biotechnology. It becomes an interesting material<br />
in pharmaceutical applications due to its biodegradability<br />
and biocompatibility, and low toxicity. The protonization<br />
of amino groups in solution makes chitosan positively char-
Chem. Listy, 102, s265–s1311 (2008) Environmental Chemistry & Technology<br />
ged, and thereby very attractive for flocculation and different<br />
kinds of binding applications. Since most natural colloidal<br />
particles, including bacteria and macromolecules, are negatively<br />
charged, attractive electrostatic interactions may lead<br />
to flocculation 1,2,4 .<br />
Experimental<br />
C h i t o s a n S o l u t i o n s<br />
Chitosan is partially soluble in dilute mineral acids such<br />
as HnO 3 , HCl, H 3 PO 4 . We have used 0.5% solutions of chitosan<br />
TM 324 (Primex, Island) diluted in 0.1M HCl. The<br />
solution was prepared fresh before each set of experiments<br />
for consistency.<br />
M e t a l - B a s e d C o a g u l a n t s<br />
Ferric sulphate [Fe 2 (SO 4 ) 3 ] and aluminium sulphate<br />
[Al 2 (SO 4 ) 3 . 18H2 O], supplied by Kemifloc a.s. (Přerov,<br />
Czech Republic) or Kemwater ProChemie s.r.o., (Bakov<br />
nad Jizerou, Czech Republic) respectively were used for the<br />
experiments.<br />
Fig. <strong>2.</strong> Turbidity removal comparison between different initial turbidity levels<br />
s393<br />
M o d e l H u m i c W a t e r s<br />
Tests were made with model humic water. Model water<br />
was mixtures of distilled water, tap water and natural concentrate<br />
of humic substances sampled from a peatbog near<br />
Radostín. Selected model humic water parameters are given<br />
in Table I.<br />
Turbidity was formed by addition of bentonit. Absorbance<br />
at 254 nm was measured in 1-cm cell and absorbance at<br />
387 nm and at 820 nm were measured in 5-cm cell 7 .<br />
C o a g u l a t i o n T e s t s<br />
Coagulation test using centrifugation as the separation<br />
method was employed. This test did allow us to study formation<br />
of nOM particles by Brownian motion (perikinetic<br />
coagulation) and has the highest possible degree of reproducibility<br />
(in any place in the world) as temperature is the<br />
only parameter influencing the kinetics of particles formation.<br />
Aggregation time was 10 and 40 minutes. Absorbance at<br />
254 nm, 387 nm and 820 nm were evaluated.
Chem. Listy, 102, s265–s1311 (2008) Environmental Chemistry & Technology<br />
Table I<br />
Parameters of starting model humic waters<br />
pH 6.3<br />
AnC 4.5 [mmol dm –3 ] 0.4<br />
χ [mS m –1 ] 16.7<br />
A 254 (1 cm) 0.178<br />
A 387 (5 cm) 0.196<br />
A 820 (5 cm) 0.015<br />
turbidity [nTU] <strong>2.</strong>4<br />
χ – conductivity; AnC 4.5 – acidic neutralising capacity to<br />
pH 4,5; A 254 – absorbance at 254 nm; A 387 – absorbance at<br />
387 nm; A 820 – absorbance at 820 nm<br />
Results<br />
Chitosan solution was dosed into model waters with<br />
values of initial turbidity 25, 45, 100 a 200 nTU. The dosages<br />
of chitosan were from 0.5 to 5.0 mg dm –3 .<br />
Figs. 2 and 3. show comparison of removal of turbidity<br />
between different initial turbidity. Optimum coagulant<br />
dose ranged from <strong>2.</strong>0 to 3.0 mg dm –3 of chitosan. Removal<br />
of turbidity was more than 90 % in optimum dose. Application<br />
of higher dosages induced lower efficiency of turbidity<br />
removal. Values of turbidity were lower than <strong>2.</strong>0 nTU after<br />
treatment 8 .<br />
Conclusion<br />
Generally, the results show very good removal of humic<br />
substances and turbidity by chitosan. The optimum pH value<br />
for chitosan coagulation was between 6–7 ref. 9 .<br />
Almost 100% removal was reached when using relatively<br />
low dosages of chitosan. Value of turbidity lower than<br />
10 nTU was measured already at dosage of 0.5 g dm –3 . The<br />
results show that chitosan is a promising substitute of metalbased<br />
coagulants, which are traditionally applied in treatment<br />
of turbid humic waters.<br />
REFEREnCES<br />
1. Divakaran R., Sivasankara Pilla V. n.: Water Res. 36,<br />
2414 (2002).<br />
<strong>2.</strong> Dalwoo Corporation: Chitin, chitosan and chitosan<br />
oligomer from Crab Shells. [online]. cit. 2008-07-21<br />
http://members.tripod.com/~dalwoo/<br />
3. Safari,K., Elmaleh S., Coma J., Bankhouja K.: Chem.<br />
Eng. J. 27, 9 (2004).<br />
4. Defang Z., Gang Y., Penvi Z.: Chin. J. Environ. Sci. 1,<br />
62 (2002).<br />
5. Defang Z., Wu J., Kennedy J., F.: Carbohydr. Polym. 71,<br />
135 (2008).<br />
s394<br />
Fig. 3. Dependence of absorbance and ph at chitosan dosage<br />
6. Gulbrandsen: Organic polymers [online]. 200<strong>2.</strong> cit.<br />
2008-05-13. http://www.gulbrandsen.com/GTI_prod_<br />
4_3_06.shtml.<br />
7. Dolejš P.: In Sborník konference „Hydrochémia ‘83“.<br />
Bratislava: ČSVTS VÚVH, p. 361, 1983.<br />
8. Klímová Z., Dolejš P.: In Sborník konference PITNÁ<br />
VODA 2008, České Budějovice: W&ET Team, p. 213,<br />
2008.<br />
9. Klímová Z.: In Sborník konference VODA ZLÍN 2008,<br />
Zlínská vodárenská, a.s., Voding Hranice s.r.o., p. 65.
Chem. Listy, 102, s265–s1311 (2008) Environmental Chemistry & Technology<br />
P30 ThE EFFECT OF wASTE bASALT wOOLS<br />
ON ThE ChEMICAL, AGROChEMICAL,<br />
PEDOLOGICAL AND hyGIENIC-<br />
TOxICOLOGICAL SOIL PARAMETERS<br />
PETER KOVáČIK, ALEnA VOLLMAnnOVá and<br />
JAROSLAV nOSKOVIČ<br />
Department of Agrochemistry and Plant Nutrition,Faculty<br />
of Agrobiology and Food Resources, Slovak University of<br />
Agriculture in Nitra, Tr. A. Hlinku 2, 949 76 Nitra, Slovak<br />
Republic,<br />
Peter.Kovacik@uniag.sk<br />
Introduction<br />
The range of soil amendments applying in agriculture of<br />
European countries, and Asia as well is considerably wider<br />
than the one in Slovakia. However, after Slovak accession<br />
to EU it has started to diversify year by year, as many soil<br />
amendments affect positively on weathering of the mineral<br />
soil elements and mineralization of organic soil elements.<br />
They reduce production of non-soluble phosphorus compounds,<br />
thereby affect positively on the level of available soil<br />
nutrients. Consequently they are alternative sustaining harvest<br />
stabilization due to the financial shortage for purchase of<br />
the industrial and organic fertilizers 1 .<br />
The trial aim was to ascertain the affect of two almost<br />
identical recycled waste rock wools produced for hydroponic<br />
plant growing (Agroban) and for building industry<br />
(nobasyp) by the company Izomat nová Baňa on many soil<br />
parameters.<br />
Experimental<br />
C h a r a c t e r i s t i c s o f t h e W a s t e<br />
( R o c k ) B a s a l t W o o l s<br />
nobasyp is a commercial name for loose minced<br />
thermo-insulating material sold as nobasil. It is produced as<br />
a result of milling (recycling) of nobasil which has not met<br />
the requirements of the consumer (shape, thickness, colour,<br />
etc.). Agrodrap can be obtained by scrapping the pieces of<br />
rock wool (basalt wool) commercially sold as Agroban.<br />
In a similar way like nobasyp, Agrodrap is produced with<br />
the aim to evaluate Agroban which is made with different<br />
parameters than the particular buyer requires. Appropriate<br />
agrochemical and hygienic-toxicological parameters of used<br />
waste rock (basalt) wools were the condition for their inclusion<br />
in biological tests.<br />
V e g e t a t i o n T r i a l s<br />
The pot trial was realized in a vegetation cage located at<br />
the Slovak Agricultural University in nitra. 25 kg of Haplic<br />
Luvisol with a low content of C, accessible n and P and a<br />
high content of K were weighed out into 30 kg pots –1 . Every<br />
pot was sown with 100 spring barley grains. After the germination<br />
the number of the individuals was united to 75<br />
plants per pot. There were 8 treatments repeated four times<br />
(0 – control; nS 1 – nobasyp dose of 20 t ha –1, AD 1 – Agro-<br />
s395<br />
drap dose of 20 t ha –1 ; nPK – the dose of nPK fertilizers<br />
consisting of n dose – 140 kg ha –1 , P dose – 50 kg ha –1 and<br />
K – 40 kg ha –1 ; nPK + nS 1 – fertilizers + the basic dose of<br />
nobasyp 20 t ha –1 ; nPK + nS 1/2 – fertilizers + half a dose of<br />
nobasyp 10 t ha –1 , nPK + AD 1 – fertilizers + the basic dose<br />
of Agrodrap 20 t ha –1 ; nPK + AD 1/2 – fertilizers + half a dose<br />
of Agrodrap ). The doses of nPK nutrients (n – 3 g pot –1 , P<br />
– 1 g pot –1 , K – 2 g pot –1 ) were calculated taking into account<br />
the n an and accessible P, K contents in the Haplic Luvisol as<br />
well as the requirements of the nutrients for planned yield<br />
(6 t ha –1 of the grain).<br />
nitrogen was added in the fertilizer DAM 390, P in<br />
a form of simple superphosphate and K in a form of 60 %<br />
KCl. nobasyp and Agrodrap doses were chosen on the basis<br />
of knowledge 2 .<br />
The spring barley harvest was performed in a growth<br />
phase DC 91. After the harvest the soil samples were taken<br />
from the whole profile of each pot where was given a research<br />
in the effect of waste rock wools on many soil parameters.<br />
A n a l y t i c a l M e t h o d s<br />
Specific electric conductivity (EC) was determined by<br />
the conductometer Hana HI 8820 n. The hydrogen ions activity<br />
was sensed potentiometrically by the glass electrode (in<br />
a soil suspension) after 24 hours of effect 1M KCl on the soil.<br />
The cation exchange capacity was detected as a sum of the<br />
base of saturation and the total acidity of soil 3 . The total carbon<br />
content was sensed oxidometrically, oxidation with K 2 Cr 2 O 7<br />
in the environment H 2 SO 4 . Composition of humic substances<br />
was detected by Kononova – Beltchikova method 3 . The content<br />
of Cd, Pb, Cr, ni was detected after mineralization with<br />
HF + HClO 4 by atomic absorption spectrophotometry.<br />
Results and Discussion<br />
The application of nobasyp or Agrodrap (20 t ha –1 )<br />
has statistically significantly increased the cation exchange<br />
capacity (+ 35.7 % and + 17.2 %), the sum of exchange basic<br />
cations (+ 42 % and + 21.4 %) and the base of saturation<br />
of the soil (+ 4.7 % and + 3.6 %). The bulk density of the<br />
soil has been decreased significantly as well (–5.7 % and<br />
–<strong>2.</strong>5 %), whereas nobasyp has determined the parameters<br />
more importantly than Agrodrap. Established results are at<br />
disagreement with the contention 4 which assert that the use<br />
of the mineral wool do not improve physical parameters of<br />
the soil. The assertion is irrational, because their experiments<br />
were narrowly focused on the effect of the wools on the water<br />
reserves increase of eroded soil.<br />
Both materials have had a positive effect on the total<br />
carbon content (+ <strong>2.</strong>1 % and + 9.3 %) and and the organic<br />
matter quality, thereby have increased the humic acid share<br />
in the soil, whereas Agrodrap has had more significant effect<br />
on these parameters than nobasyp. The combined application<br />
with nPK fertilizers has increased the positive effect of the<br />
wools on the increase of the organic matter quality of the<br />
soil.
Chem. Listy, 102, s265–s1311 (2008) Environmental Chemistry & Technology<br />
Both waste rock wools have had an alcalic effect on the<br />
soil and have deadened acidic effect of the fertilizers and<br />
the negative effect on the increase of salt content in the soil<br />
as well. They have had the same effect on the content of nine<br />
determined heavy metals in the soil (Cd, Pb, Cr, Zn, Cu, Co,<br />
ni, Mn, Fe) as nPK fertilizers application.<br />
At the end of the trial was the content of six heavy<br />
metals (Cd, Pb, Cr, Cu, Co and ni) in all the treatments lower<br />
than before the start of the trial.<br />
Conclusions<br />
Due to the neutral effect of wools on the heavy metals<br />
content in the soil and the positive effect on the remaining<br />
soil parameters can be nobasyp and Agrodrap regarded as<br />
soil amendments.<br />
s396<br />
This work has been supported by grant projects VEGA<br />
No. 1/1346/04 and 1/4418/07<br />
REFEREnCES<br />
1. Marschner H.: Mineral nutrition of higher plants.<br />
Elsevier Academic press, San Diego, California, 889 p,<br />
2005.<br />
<strong>2.</strong> Kovacik P.: Acta fytotechnica et zootechnica 9, 5<br />
(2006).<br />
3. Hanes J.: Analyses of soil sorption properties. VUPOP<br />
Bratislava a SPU nitra, 136 p, 1999.<br />
4. Orlik T., Marzec M.: Acta cientarium Polonorum – Formatio<br />
Circumiectus 3(1), 81 (2004).
Chem. Listy, 102, s265–s1311 (2008) Environmental Chemistry & Technology<br />
P31 INFLuENCE OF wATER EROSION<br />
PROCESSES ON ThE bOTTOM SEDIMENT<br />
QuALITy<br />
nATáLIA KOVALIKOVá and MAGDALénA<br />
BáLInTOVá a<br />
a Civil engineering Faculty, Technical university of Košice,<br />
Vysokoškolská 4, 042 00 Košice,<br />
natalia.kovalikova@tuke.sk<br />
Introduction<br />
Erosion processes in watersheds belong to serious ecological<br />
and economical problems because of negative consequences<br />
in terms of soil and water deterioration as well as<br />
on the environment as a whole. Sediments, detached by the<br />
erosion, bind nutrients (particularly nitrogen and phosphorus),<br />
that can significantly affect the balance of the aquatic<br />
ecology, resulting in eutrophication of lakes and rivers 1 .<br />
More studies in Slovakia have been focused on the assessment<br />
of soil erosion, based upon principles and parameters<br />
defined in the Universal Soil Loss Equation, but neither from<br />
them has dealt with nutrient transport assessment in consequence<br />
of water erosion.<br />
This contribution deals with the nutrient transport from<br />
eroding upland fields by the small water basin Kľušov.<br />
Experimental<br />
M a t e r i a l a n d M e t h o d s<br />
The study of nutrient transport assessment in consequence<br />
of water erosion has been realized in vicinity of<br />
small water basin (SWB) Kľušov situated at the Tisovec<br />
stream in the east of Slovakia. Average depth of SWB is<br />
3.5 m and its total capacity is 72,128 m 3<br />
According to last measuring, the quantity of sediments<br />
in reservoir caused the decreasing of SWB capacity about<br />
33 % during 18 years. Therefore this reservoir was run the<br />
water off from 2005 to 2007 and has been chosen as model<br />
basin for our study.<br />
For bottom sediment quality assessment, there was realized<br />
sampling of bottom sediments and also sampling of<br />
arable land in vicinity of reservoir.<br />
Soil samples were taken according the modified methodology<br />
for nutrient transport assessment in consequence of<br />
water erosion. This methodology comes out from Decree<br />
of the Ministry of Agriculture of the Slovak Republic<br />
no. 338/2005 Coll. combine with Soil Sampling according<br />
to Mahler and Tindall 2 , because Slovak decree doesn’t assess<br />
soils in term of total phosphorus and nitrogen concentrations,<br />
it considers only with plant available nutrients.<br />
Soil samples were taken from arable land in period<br />
2006–2007.<br />
Together with soil samples also one composite sediment<br />
sample was taken from each selected locality – along the<br />
reservoir and by the dyke.<br />
Localities for sediment and soil sampling are shown in<br />
Fig. 1.<br />
s397<br />
Fig. 1. Sediment and soil sampling localities<br />
In the first stage of our research, the granularity impact<br />
of soil and sediment particles on the nutrient concentration<br />
was followed, because pollutants are preferentially attached<br />
to the finest particles (fractions below 63 microns) 3 .<br />
Samples of bottom sediments and soils were analyzed<br />
for total n and P in accredited laboratory of State Geological<br />
Institute of Dionyz Stur Spišská nová Ves.<br />
Results<br />
From chemical analyses (Table I) follows that nutrient<br />
concentrations in average soil sample (P1, P2) were nearly<br />
identical with concentrations of followed compounds in fractions<br />
below 63 microns (P1’, P2’).<br />
The concentrations of P, n in chosen sediment samples<br />
(S1–S8) were diverse due to irregular sediment deposition in<br />
the reservoir (Table II). These concentrations increase with<br />
proportion of the finest particle fraction and the higher concentrations<br />
are by the dyke (Fig. <strong>2.</strong>). In this case the literary<br />
information 3 about higher concentrations of the followed<br />
compounds (n, P) in sediment samples in fraction below 63<br />
microns has been confirmed. Because we found 4 that nutrient<br />
concentrations in sediment average sample (S1, S2, S5) and<br />
sediment fractions below 0.063 mm (S1’, S2’, S5’) are nearly<br />
identical, in the next research we have focused only on concentration<br />
in average sediment and soil sample (Table I, II).<br />
Table I<br />
Concentration of n and P in the arable land<br />
Sample n tot [%] P tot [%]<br />
P1 0.08 0.069<br />
P1’ 0.09 0.068<br />
P2 0.12 0.065<br />
P2’ 0.13 0.066<br />
P3 0.18 0.082<br />
P4 0.16 0.055<br />
P5 0.22 0.075<br />
P6 0.23 0.06<br />
P7 0.20 0.077<br />
P8 0.22 0.058
Chem. Listy, 102, s265–s1311 (2008) Environmental Chemistry & Technology<br />
nutrient transport assessment from soils to surface<br />
water was studied through transport of dissolved and adsorbed<br />
forms of n and P.<br />
Table II<br />
Concentration of n and P in SWB sediments<br />
Sample n tot [%] P tot [%]<br />
S1 0.26 0.112<br />
S1’ (100 %) 0.26 0.112<br />
S2 0.24 0.113<br />
S2’ (97.65 %) 0.24 0.110<br />
S3 0.22 0.066<br />
S4 0.23 0.066<br />
S5 0.24 0.112<br />
S5’ (89.24 %) 0.25 0.115<br />
S6 0.20 0.090<br />
S7 0.17 0.049<br />
S8 0.14 0.070<br />
Fig. <strong>2.</strong> Influence of sampling distance from the dyke on the N<br />
and P sediment concentration<br />
For determining nutrient concentrations in dissolved<br />
phase several leaching experiments were realized. Expe-<br />
s398<br />
riment results have shown that portion of dissolved phase<br />
represented 0.46–0.65 % of total P and 0.37–0.46 % of total n<br />
in the soil sample. According these findings, dissolved phase<br />
weren’t considered.<br />
As follows from Table I, nitrogen concentrations in<br />
adsorbed phase of soils varied from 0.08 % to 0.23 % and<br />
phosphorus concentrations were in range 0.054 % to 0.082 %.<br />
It depends on rates and date of fertilizer application and also<br />
on type of grown crop and its uptake rates (samples P1–P4<br />
before and P5–P8 after nitrogenous fertilizer application).<br />
Conclusions<br />
The concentration of nutrients in studied soil samples<br />
wasn’t influenced by their granularity and depends on the<br />
applicable fertilizer rates and grown plant uptake.<br />
The results from chemical analyses confirmed the literary<br />
information that the concentrations of P, n in chosen<br />
sediment samples are diverse due to irregular sediment deposition<br />
in the reservoir and increase with proportion of the<br />
finest particle fraction.Concentrations of P, n in sediments<br />
correspond to their concentrations in soils what is in accord<br />
with our results about their maximal portion in adsorbed<br />
phase.<br />
This work has been supported by the Slovak Grant<br />
Agency for Science (Grant No. 1/0613/08).<br />
REFEREnCES<br />
1. Bálintová M., Kovaliková n.: Sel. Sci. Pap. 1, 189<br />
(2005).<br />
<strong>2.</strong> Mahler R. L., Tindall T. A.: Coop. Ext. Bull.1997, 704<br />
3. Methodological instruction of Ministry of environment<br />
SR no. 549/98-2<br />
4. Kovaliková n., Bálintová M.: Acta Facultatis Ecologiae<br />
16, 129 (2007).
Chem. Listy, 102, s265–s1311 (2008) Environmental Chemistry & Technology<br />
P32 MODELLING AND DIAGNOSING OF<br />
MEChANICAL ENGINEERING LIFE CyCLE<br />
PRODuCTION PROCESS<br />
RUŽEnA KRáLIKOVá and ALEnA PAULIKOVá<br />
Technical University in Košice, Faculty of Mechanical Engineering,<br />
Department of Environmental Studies and Control<br />
Processes, Park Komenského 5, 041 87 Košice, Slovak<br />
Republic,<br />
ruzena.kralikova@tuke.sk<br />
Introduction<br />
Competing business challenges to interest in production<br />
process as determined factor for quality products, environment<br />
protection, production machinery condition, required<br />
parameters for machining and elaborateness for given accuracy.<br />
One of solution is the implementation modern simulating<br />
devices and applications of analogs in production practice.<br />
It is necessary to pay attention to production process<br />
as a determined factor for product quality, environment protection,<br />
production machinery state, required parameters for<br />
machining and elaborateness, which is given for achievement<br />
of required accuracy. One of solution is implementation of<br />
modern simulation devices and application of models in production<br />
operation.<br />
Environmental Strategies<br />
Environmental aspects, its loading and protection give<br />
production enterprises the possibility of evaluation of their<br />
production methodology, used technology, raw material and<br />
energy management in term of environmental influence reduction.<br />
However, the quality of these solutions dependeds on<br />
project quality for new building-up or reconstruction of production,<br />
there is need to add ecological aspects to ordinary<br />
methods of projecting.<br />
The ecological ones in determined term ensure sustainable<br />
development of environment. Policy, economy and<br />
ecology have got significant function. Works, function and<br />
possibilities in environmental creation and protection could<br />
be outlined in points which represent strategy of mechanical<br />
engineering development in environmental view at present:<br />
•<br />
•<br />
•<br />
•<br />
production of environmental suitable products,<br />
using of environmental acceptable technologies for their<br />
production,<br />
energy and raw material economy – low-waste, nonwaste<br />
and recycling technologies,<br />
machinery and devices production for environmental<br />
protection and creation (water treatment plants, filters,<br />
separators, traps, eco-technology).<br />
Model Creation of Mechanical Engineering Production<br />
Process<br />
Production process is the collection of human activity,<br />
machinery and physical processes and its results are particu-<br />
s399<br />
lar kinds of products. At every production process there are<br />
three factors:<br />
systematic activity – human work,<br />
work objects which are transformed to products – basic<br />
mechanical engineering products are machines, function<br />
groups, nodal points and components,<br />
means of work, which are production machines, devices,<br />
tools, accessories, helpers, transport and handling equipments,<br />
control technology1 •<br />
•<br />
•<br />
.<br />
During production process shape and composition materials<br />
are changed so that the result is the new utility value.<br />
The production process can start if production factors, inputs<br />
are disposable. One of inputs can be also the creation of production<br />
process model. That is why is necessary to have concrete<br />
data, which characterize given production process.<br />
By analysing of process activity there are scheme where<br />
particular phases of phenomena observation or object perform<br />
these activities that are each other connected and regulated<br />
by producer’s and customer’s decision.<br />
In accordance to environmental view the mechanical<br />
engineering production process is open system with its relation<br />
to surroundings. It has got full interaction among subjects.<br />
In accordance to relations this system is quite open which<br />
makes possible the full interaction to surroundings. In Fig. 1.<br />
and Fig. <strong>2.</strong> there is the comparison of production process<br />
from the point of the view:<br />
•<br />
•<br />
•<br />
•<br />
influence on the environment<br />
renewable and unrenewable resources exploitation of<br />
raw materials and energy<br />
interaction with other processes<br />
waste production 4 .<br />
Fig. 1. Nonenvironmental production process<br />
Environmental suitable production has to follow the<br />
main aim. Production process is regarded as system which<br />
creates closed structure with interaction of system environ-
Chem. Listy, 102, s265–s1311 (2008) Environmental Chemistry & Technology<br />
Fig. <strong>2.</strong> Environmental production process<br />
ment, i.e. Closed Loop Systems, Fig. 3. This system demonstrates<br />
renewable energy, nontoxic materials in a closed loop<br />
and sustainable product design. It is rooted within circular<br />
concepts of the product life cycle.<br />
Production process has also got its life cycle. There<br />
are characterized its production, system, technological and<br />
environmental phases. According to production aspects the<br />
process can be in beginning phase of its cycle. However<br />
according to environmental impact view can be out-of-date<br />
or according to qualitative parameters in leading countries<br />
“outsider”. Working out of equivalent model of production<br />
process is has got several phases as followings:<br />
Fig. 3. Closed Loop Systems 4<br />
P r e d i c t i o n A n a l y s i s<br />
Estimation of production running, its inputs and outputs<br />
is possible to make or by considering that production has got<br />
the same way eventually similar way or quite new and different<br />
way. The way is determined as kind of application, its<br />
evaluation, modification or change of production, systemic,<br />
technological and environmental approaches. It is important<br />
to establish the reliable obtained information. It can reach<br />
s400<br />
to use accurate methods of data collecting or application of<br />
measurement methods if there is an existing operation plant<br />
where it is possible to obtained parameters.<br />
D e v e l o p m e n t o f M e t h o d<br />
According to number of inputs and outputs, we can choose<br />
strategy or methods for model development. We obtained<br />
various types of models with the combination of individual<br />
parameters. If we choose the main point as economical point<br />
and inputs will be reduced only gains, expenses, costs per<br />
hour, costs per piece, etc. Very simply model comes into existence<br />
but in real operation there is not applied. Many customers<br />
ask for quality, ecology, and modern technology not<br />
only low price.<br />
M o d e l I m p l e m e n t a t i o n<br />
There is a verification of prediction and correctness of<br />
used methods. If the preparation is worked out in details then<br />
the implementation is simple and the model can be applied<br />
in short time. Implementation makes possible to modify<br />
a model and it creates other opportunity to regulate and to<br />
adjust the model.<br />
C o n t r o l l i n g o f M o d e l<br />
After successful implementation of model there is final<br />
period – i.e. control. It is the adjusting according to external<br />
and internal operational demands. All feedback relations in<br />
system can be used and following modifications, which do<br />
not influence the model creation but only they simulate all<br />
changes in production.<br />
A p p l i c a t i o n o f M o d e l<br />
Model, which is created in this way, exists from its<br />
beginning to its end and this model makes possible to eliminate<br />
or minimize mistakes. These mistakes would be developed<br />
directly in operation without the using of previous simulation.<br />
Model becomes the control tool for production process.<br />
Mistakes in model are cheaper than real production and changes,<br />
which are done in model, are reversible as well. Production<br />
enterprises can use Model for improving or representation<br />
for customers, contact persons from state institutions,<br />
for certification of quality of environmental management,<br />
for training and courses of employees or for comparison of<br />
product quality to competing product. In model there are all<br />
accessible methods and technologies, which product operator<br />
requires. One of methods is Life Cycle Assessment (LCA) 2 .<br />
Life Cycle Assessment<br />
Life Cycle Assessment is very often term predominately<br />
in environmental management field. Every mechanical engineering<br />
product shows environmental “track” in environment<br />
and this way these environmental impact are evaluated during<br />
all its life cycle – from the cradle to grave. It is complicated to<br />
obtain enough data number from operation. Or obtained data<br />
are different values, units or time and accuracy of obtaining.
Chem. Listy, 102, s265–s1311 (2008) Environmental Chemistry & Technology<br />
Production process is also concerned hundreds of products<br />
and its characters are complicated. In LCA there are<br />
assessed for example harmful substances released into the air<br />
and water, amount of solid waste as well, energy and raw<br />
material consumption, human environmental effects, who are<br />
in production. Tools of LCA cover general matters as well as<br />
localizations independent from evaluation methods.<br />
Modelling of process means the using of all available<br />
methods from LCA, SEM, standards ISO 14000 and 9000<br />
and technological processes, LCA technologies and likewise.<br />
Complex model can also simulate production accidents 3 .<br />
Multicriterial Environmental Evaluation of using Chemicals<br />
in Individual Plants<br />
This evaluation is based on quantification of parameters<br />
for environment quality by means of unbalanced evaluating<br />
effects of production process.<br />
Fig. 4. Multicriterial evaluation for using of chemicals in production<br />
process<br />
Objectivity of solution has got number of evaluating<br />
coefficients, their optimal number in interval 20–25. Deriving<br />
from following relations it is possible to determine Q j<br />
– value of environmental chemical load:<br />
aij - a j<br />
Qj = ∑ × k j , (1)<br />
s<br />
j j<br />
where:<br />
Q j – value of environmental load,<br />
a ij – value j-element of vector,<br />
s401<br />
ā j – average value of j-element ,<br />
s j – standard deviation of modified j-descriptor,<br />
k j – reduction constants.<br />
Example for application of multicriterial evaluation for<br />
using of chemicals in production process is in Fig. 4.<br />
It is possible to determine from application of multicriterial<br />
evaluation which operational plant is the most loaded, i.e.<br />
the plant with the higher Q j - value.<br />
Conclusions<br />
Methods for monitoring and checking of technological,<br />
chemical and environmental aspects for production can have<br />
other applications as well.<br />
There are in various enterprises for development of technology<br />
or optimalization of operation according to customer’s,<br />
producer’s or environmental engineer’s demands. This period<br />
is period IT technologies and it could show that environmental<br />
pollution is slowing because operation plats of individual<br />
productions began to behave more understanding.<br />
Model of life cycle for production process is one of tools<br />
that helps producers made with optimal technology, develop<br />
products with optimal balanced performance and costs,<br />
characters which are up to standards for environment, health<br />
and safety.<br />
Acknowledgement (This work has been supported<br />
by VEGA 1/3231/06: (2006–2008) Modelling of Working<br />
Environment Factors and Their Optimalization in Specified<br />
Conditions of Mechanical Engineering Enterprises).<br />
REFEREnCES<br />
1. Králiková, R., Pauliková, A.: In: SYM-OP-IS 2006: Simpozijum<br />
o operacionim istraživanjima: Banja Koviljača,<br />
Beograd: Instirut Mihailo Pupin, 2006. p. 45-48.<br />
<strong>2.</strong> Králiková, R., Pauliková, A., Wessely, E.: In: Industrial<br />
engineering – adding innovation capacity of labour<br />
force and entrepreneur: 5th international DAAAM Baltic<br />
conference, p. 203. Tallinn, Estonia 2006.<br />
3. Kozáková, ľ.: In: 11th Conference on Environment and<br />
Mineral Processing, p.23. Ostrava, Czech Republic<br />
2007.<br />
4. www.cleanproduction.org/images/closed-loop-diagram.<br />
gif, citated on 28 th May, 2008.
Chem. Listy, 102, s265–s1311 (2008) Environmental Chemistry & Technology<br />
P33 SIMuLATION OF ChEMICAL FACTORS IN<br />
wORKING ENVIRONMENT<br />
ALEnA PAULIKOVá and RUŽEnA KRáLIKOVá<br />
Technical University in Košice, Mechanical Engineering<br />
Faculty, Department of Environmental Studies and Control<br />
Processes, Park Komenského 5, 041 87 Košice, Slovak<br />
Republic,<br />
ruzena.kralikova@tuke.sk<br />
Introduction<br />
Mechanical engineering has not got so many environmental<br />
impacts as chemical industry but its technologies often<br />
use various chemicals to improve its operations. Working<br />
environment of mechanical engineering is also a subsystem<br />
of global geosphere environment.<br />
People spend so long term that they identify this working<br />
environment with their microenvironment. People are<br />
often influenced by several factors in this “small world” of<br />
them. These factors categorize some working activities from<br />
point of view the environmental and health risks. The categorization<br />
of our working activities involves the known details<br />
about factors of work and working environment.<br />
At industry plants there is most of workers exposed to<br />
a combination of multiple factors of working environment<br />
which influence their health and comfort. The category is<br />
determined separately for individual factors but there is no<br />
methodology of working activities assessment for any combination<br />
of individual factors 1 .<br />
By means of modern software simulation there is designed<br />
the methodology with the look-up functions of program<br />
Vensim for a complex assessment of working environment in<br />
specific conditions of mechanical engineering enterprises.<br />
Chemical Parameters in Cutting Process<br />
In cutting processes there are a lot of chemical parameters<br />
which improve or make worse human working environment.<br />
These chemicals exist in various form and states. The<br />
liquids and aerosols create predominant part of the states.<br />
C u t t i n g F l u i d s<br />
Cutting emulsion is a dispersion system of two insoluble<br />
liquids. One creates microscopical drops dispersed in the<br />
other liquid. At machining only emulsion type: oil in water is<br />
used. Milk appearance or transparent appearance depends on<br />
size of oil drops. For the first case the drops are larger and for<br />
the second case the drops are smaller than 10 mm 3 .<br />
Mineral oil and water almost do not generate an emulsion.<br />
That is why the other component is needed – emulator<br />
which covers oil drops with absorption coat protecting their<br />
repeated mergence. Soaps, organic amino compounds, sulphonate<br />
compounds and the like are used as emulators.<br />
Mineral oils conditioned with emulators are called<br />
emulsive oils. They also contain anticorrosive, antibacterial<br />
and high-pressure additives. The content of mineral oils in<br />
emulsive oils is 50–75 %.<br />
s402<br />
The second component of basic emulsion compounds<br />
is water which has got very good cooling effect. However,<br />
raw water has got a lot of defaults for a preparation of industrial<br />
emulsions, i.e. presence of limestone and magnesium<br />
which are liquated and they create hard-removable sediments<br />
on metal surfaces. The sediments silt up piping, sieves, tanks<br />
and also seal the functional parts of machinery 2 .<br />
As well the corrosive influences and high contents of<br />
micro-organisms are harmful in water for an emulsion preparation.<br />
An anticorrosive protection is performed by the<br />
anticorrosive additives, i.e. soda, borax, sodium phosphate<br />
or sodium silicate. These additives soft water and decrease<br />
its surface tension. They improve wettability, cooling effects<br />
and create alkaline environment. Alkaline environment is<br />
suitable from point of view an anticorrosive protection of ferrous<br />
metals. There are pH under 9.0 because safety and health<br />
reasons. If pH is higher then there is a damage of protective<br />
coats and rubber parts of machines.<br />
The main default is an inclination to micro-organism<br />
contamination what makes short cutting fluid durability by<br />
decisive way. If there is an emulsion value of pH 9.5 and higher<br />
then micro-organism development is decelerated. However,<br />
in this condition the emulsion is health unsuitable, irritate<br />
skin and airways.<br />
A d d i t i v e B I O S T A T ® f o r C u t t i n g<br />
F l u i d s<br />
BIOSTAT ® is a common name for new generation set<br />
of antibacterial and fungicidal preparations which have been<br />
developed for 8 years in the framework of environment friendly<br />
production.<br />
Preparation set BIOSTAT ® is inorganic origin and its<br />
influence is based on three activity principles:<br />
•<br />
•<br />
•<br />
the strong electrochemical influence of Ag ion operating<br />
directly with energy reaction in an electron-transportation<br />
string of cellular proteins<br />
the irreversible denaturation of sulfhydryl groups of<br />
micro-organism proteins by means of the ion exchange<br />
H by Ag<br />
the strong oxidation possibility of product of BIOSTAT ® ,<br />
which causes the catalytic oxidation H 2 O molecule and<br />
air oxygen generating hydrogen peroxide. Hydrogen<br />
peroxide is fissioned consequently into H 2 O molecule<br />
and oxygen radical 3 .<br />
Determination of Parameters for Model<br />
Simulation software Vensim is a graphical model tool.<br />
By means of it, we can draft, document, simulate, analyse<br />
and optimize various simulation models of industrial technologies.<br />
One of the technologies is also machining with using<br />
of chemicals, which belongs to the difficult tasks solved in<br />
environmental engineering protection.<br />
The keystone of s model imulation is determination and<br />
application of following variables in the sketch with nodes<br />
and connecting curves:
Chem. Listy, 102, s265–s1311 (2008) Environmental Chemistry & Technology<br />
•<br />
•<br />
•<br />
•<br />
level parameters – amounts of cutting fluids<br />
rates – operations or technological processes<br />
constant variable – chemical factors<br />
auxiliary variables – derived parameters for chemical<br />
and environmental impacts.<br />
M o d e l f o r C u t t i n g F l u i d C h e m i c a l s<br />
In Fig. 1. there is the sketch of applied parameters for<br />
using of cutting liquids in machining and in Fig. <strong>2.</strong> there is<br />
the simulation of these parameters.<br />
Fig. 1. used parameters of cutting liquids in machining<br />
S i m u l a t i o n f o r C u t t i n g F l u i d<br />
C h e m i c a l s<br />
Fig. <strong>2.</strong> Simulation parameters of cutting liquids<br />
There is a chemical world of systems driven by cause<br />
and affect. Those systems include production, protection,<br />
biological, chemical, thermodynamic or workflow.<br />
s403<br />
Environmental or chemical systems can be modelled<br />
as nodes representing system variables and connecting lines<br />
representing causal effects. The changing value of one variable<br />
can cause another to increase or decrease. Understanding<br />
how a system really works is the first step towards using,<br />
improving or automating 4 .<br />
R e s u l t s<br />
We can change chemical status of the overall machining<br />
process with the movement of slider. Every constant has got<br />
its own slider. The change of constant value influences the<br />
value of auxiliary variables and then they influence value of<br />
level parameters.<br />
This similar model can help the technicians or workers<br />
to properly dose various additives, to fill up fresh cutting<br />
fluids, to increase total productivity and to save expenses.<br />
Conclusions<br />
By the assessment of individual quantitative indicators<br />
of cutting fluid chemical status we can draw these conclusions:<br />
used cutting fluids began to spoil the most often by long<br />
term of cleaning of individual machines and cutting fluid<br />
reservoirs<br />
the insertion of additive BIOSTAT ® into cutting fluids to<br />
lengthen their durability and cleaning intervals.<br />
the declination of Ag is caused its sedimentation of<br />
undissolved additive in the cutting fluid reservoirs and<br />
its removal by means of workflows or waste-flows of<br />
cutting fluids<br />
the cutting fluids flows need for their cycle the segment<br />
of sedimentation reservoir and filters to improve working<br />
environment<br />
additive BIOSTAT ® •<br />
•<br />
•<br />
•<br />
•<br />
does not cause allergic reaction of<br />
respiratory or dermal characters.<br />
This work has been supported by VEGA 1/3231/06:<br />
(2006–2008) Modelling of Working Environment Factors<br />
and Their Optimalization in Specified Conditions of Mechanical<br />
Engineering Enterprises.<br />
REFEREnCES<br />
1. Pauliková A.: Habilitation Thesis, Technical University,<br />
Košice, 2008.<br />
<strong>2.</strong> Ruiz J. M, Kollár V, Brokeš P.: Priemyselné technológie,<br />
Grafické štúdio Ing. Peter Juriga, Bratislava 2000.<br />
3. Ansil: Manuál pre aplikáciu prípravku Biostat ® (Slovenská<br />
republika), 2006.<br />
4. www.excelsoftware.com, August 8, 2007.
Chem. Listy, 102, s265–s1311 (2008) Environmental Chemistry & Technology<br />
P34 MuLTI-RESIDuE METhOD FOR<br />
ThE ANALySIS OF PESTICIDES AND<br />
MyCOTOxINS IN CEREALS by LC-MS/MS<br />
OnDřEJ LACInA, JAnA URBAnOVá, ALEXAnDRA<br />
KRPLOVá and JAnA HAJŠLOVá<br />
Institute of Chemical Technology Prague<br />
Technická 5, 166 28 Prague 6,<br />
ondrej.lacina@vscht.cz<br />
Introduction<br />
In the recent decade, liquid chromatography–tandem<br />
mass spectrometry (LC MS/MS) operated in a selected reaction<br />
monitoring mode, has become the main tool for the analysis<br />
of food and environmental contaminants presenting wide<br />
range of physico-chemical properties. This approach allowed<br />
the introduction of multiresidue methods with up hundreds<br />
target analytes determined in a single run. However, most of<br />
these methods are focused only on one group of food contaminants<br />
such as pesticides, veterinary drugs, mycotoxins,<br />
plant toxins, etc. Considering the fact, that sample preparation/detection<br />
principles are basically similar for most of<br />
these methods, we attempted to determine pesticide residues<br />
and mycotoxins - contaminants representing different sources<br />
of origin in single run. The comprehensive LC-MS-MS<br />
multi-residue method has been developed and validated for<br />
14 Fusarium toxins, 4 aflatoxins, ochratoxin A, 3 Alternaria<br />
toxins and 200 pesticides.<br />
Experimental<br />
C h e m i c a l s a n d R e a g e n t s<br />
Certified pesticide and mycotoxins standards were<br />
purchased from Dr. Ehrenstorfer GmbH (Germany), Riedel<br />
de Haen (Germany) and/or Biopure (Austria). Individual<br />
analyte stock solutions (concentrations in the range<br />
0.3–3mg ml –1 ) were prepared in either methanol or acetonitrile,<br />
depending on the solubility of particular analyte. These<br />
solutions were used for preparation of mixed standard solution<br />
in acetonitrile (10 µg ml) and stored in –18 °C. Deionized<br />
water for preparation of a mobile phase was produced<br />
by Milli–Q apparatus (Millipore, Germany). Ammonium formate<br />
for mass spectrometry was obtained from Fluka (Buchs,<br />
Germany). Acetonitrile (Sigma-Aldrich, Germany) and methanol<br />
(Merck, Germany) were HPLC gradient grade solvents<br />
for pesticide residue analysis.<br />
S a m p l e P r e p a r a t i o n<br />
5 g of sample were weighted into 50 ml PTFE centrifugation<br />
tube. Then, 20 ml of extraction mixture of acetonitrile/<br />
water/formic acid (75 : 24 : 1, v/v/v) were added and the tube<br />
was placed onto laboratory shaker for 90 min. After this time,<br />
the tube was centrifuged (Hettich, Germany) at 11,000 rpm<br />
for 5 min and aliquot of extract was diluted by a water in<br />
a ratio 2 : 1 and filtered through a 0.45 µm PTFE filter Iso-<br />
DiscTM (Supelco, USA), and transferred into a vial.<br />
s404<br />
H P L C - M S - M S A n a l y s i s<br />
The HPLC analyses of selected pesticides and mycotoxins<br />
were performed using an Alliance LC system (Waters,<br />
USA) equipped with an Atlantis T3 column (100 × <strong>2.</strong>1 mm<br />
I.D., 3 µm particle size, Waters, USA) maintained at 30 °C.<br />
The mobile phase contained 0.005M ammonium formate<br />
in deionized water (A) and methanol (B), flow rate was<br />
0.3 ml min –1 . The optimized chromatographic method started<br />
at mobile phase composition of 5 % of B and was hold for<br />
0.5 min, then rising linearly to 60 % of B and then 100 %<br />
at 15 min. This composition was held for 8 min to remove<br />
co-extracted matrix from column, 6min re-equilibration to<br />
initial mobile phase composition followed. Sample injection<br />
volume 8µl was used in all experiments.<br />
HPLC system was connected to tandem mass spectrometer<br />
Quattro Premier XE (Waters, USA) operated in positive<br />
electrospray ionization mode. The capillary voltage was set<br />
to 3,500 V, source temperature was maintained at 120 °C and<br />
desolvation temperature was 380 °C. The masses of parent<br />
and daughter ion, cone voltage and collision energy were<br />
tuned previously for each analyte and two MS/MS transitions<br />
were acquired for each of them.<br />
Results<br />
O p t i m i z a t i o n o f S a m p l e<br />
P r e p a r a t i o n<br />
QuEChERS extraction method published and extensively<br />
tested in a recent years 1–3 has become the widely used<br />
method for isolation pesticide residues from various matrices.<br />
QuEChERS method employs acetonitrile (MeCn)<br />
extraction followed by partition induced by added salts. If<br />
necessary dispersive SPE clean-up is performed. The partition<br />
step discriminate a lot of bulk matrix compounds such<br />
as sugars and/or acids, which would interfere with determinative<br />
step, however also recovery of polar target analytes is<br />
reduced. For this reason, the QuEChERS has not become an<br />
extraction method of choice for mycotoxins, especially for<br />
relatively polar B trichothecenes.<br />
It should be noted, that existing multi-mycotoxins<br />
methods are based on the extraction by MeCn i.e. use similar<br />
solvent as QuEChERS. Although the sources of food contamination<br />
by pesticides and mycotoxins are fairly different in<br />
their nature, from analytical point of view there are a large<br />
number of representatives of these two groups, possessing<br />
similar physico-chemical properties. On this account, it is a<br />
conscionable concept to put together analysis of mycotoxins<br />
and pesticide residues in one multi-toxin method.<br />
The bottleneck of such method might be the sample<br />
preparation step, since it is necessary to achieve acceptable<br />
recovery for all analytes and at the same time discriminate<br />
extraction of matrix components, which could cause suppression<br />
of ionization as far as electrospray (ES) is employed<br />
in LC-MS method. In principle, achieving simultaneously<br />
these two requirements is impossible, and, therefore the only<br />
feasible approach is to examine extract directly without any<br />
purification 4–5 .
Chem. Listy, 102, s265–s1311 (2008) Environmental Chemistry & Technology<br />
Several extraction solvents including MeCn, methanol<br />
(MeOH) and their mixtures with water were tested to achieve<br />
good recovery for a wide range of analyte polarities. MeOH<br />
and its mixtures with water offered good extraction efficiency<br />
for polar and semi-polar compounds, however high amount<br />
of matrix was also co extracted. Only aqueous MeCn was<br />
used, because of poor extraction of polar analytes by pure<br />
solvent. It is a common practice in many multi-mycotoxin<br />
methods to employ azeotropic mixture of 84 % MeCn and<br />
16 % water. This approach was developed for easy purification<br />
by Mycosep and subsequently solvent evaporation,<br />
nevertheless omitting purification step enabled improvement<br />
of extraction efficiency of polar compounds (such as DOn-<br />
3-glucoside, acephate, propamocarb) by increasing of water<br />
content in extraction mixture up to 25 % (v/v). At the same<br />
time, acceptable recoveries were still obtained for relatively<br />
non-polar analytes represented e.g. by zearalenon and pyrethroid<br />
insecticides.<br />
It should be noted that the addition of water prior to<br />
extraction into low moisture samples as cereals is also recommended<br />
by a document n° SAnCO/2007/3131. To improve<br />
recovery of fumonisin mycotoxins and protect unstable basesensitive<br />
pesticides against the hydrolysis, addition of 1 % of<br />
formic acid into extract mixture was necessary.<br />
The final extract was diluted by water to decrease content<br />
of MeCn and consequently to reduce matrix effects.<br />
Different ratios of MeCn and water in a vial were tested,<br />
nevertheless the content of water higher than 50% caused<br />
precipitation of matrix components and consequently decreasing<br />
of recovery of non-polar analytes.<br />
O p t i m i z a t i o n o f L C - M S - M S<br />
As mentioned above, no purification step was employed,<br />
so chromatographic separation plays an important role to<br />
separate analytes and matrix to decrease matrix effects.<br />
Although slow gradient was used, very strong signal suppression<br />
(over 80 % lower signal of matrix matched standard as<br />
compared to solvent standard) still occurred for some of later<br />
eluting compounds.<br />
Many LC-MS pesticide multi-residues method use only<br />
ESI + ionization, because almost of analytes ionize only in<br />
positive mode or better sensitivity/selectivity is achieved<br />
under these conditions. Although B-trichothecenes offer better<br />
sensitivity in a negative mode by formation adducts with<br />
acetic or formic anion (depends on composition of mobile<br />
phase), ionization in positive mode is also possible. The main<br />
advantage of positive mode is a compatibility with more than<br />
95 % pesticides and other mycotoxins (aflatoxins, fumonisins)<br />
which do not give any ions in ESI – .<br />
M e t h o d V a l i d a t i o n<br />
The distribution of recoveries of all analytes in wheat is<br />
showen in Fig. 1. The recovery and repeatability of particular<br />
analyte was obtained from analysis of spiked wheat material<br />
at 100 μg kg –1 . The extraction method offers a good recovery<br />
for both, acids and bases and covered a wide range of pola-<br />
s405<br />
rities. The trueness of method was demonstrated by analysis<br />
of reference materials for mycotoxins (ochratoxin A, deoxynivalenol,<br />
nivalenol, T-2 and HT-2 toxins) and proficiency<br />
testing materials obtained from FAPAS 0950 and EUPT-C1/<br />
SRM<strong>2.</strong> For all reference materials and positive findings in<br />
proficiency tests were achieved satisfactory score |z| < <strong>2.</strong><br />
Fig. 1. Distribution of recoveries of all 222 pesticide residues<br />
and mycotoxins at concentration level 100 μg kg –1 in wheat<br />
Conclusions<br />
The multi-toxin LC-MS-MS method for simultaneous<br />
analysis of 200 pesticide residues and 22 mycotoxins in<br />
cereals has been developed and fully validated. Acceptable<br />
recoveries and repeatabilities have been achieved for most<br />
of analytes. The trueness of generated data was also documented.<br />
The authors are convinced that this high throughput<br />
approach will find a wide use in many control laboratories in<br />
close future.<br />
This study was carried out with support from the Ministry<br />
of Education, Youth and Sports, Czech Republic from the<br />
project MSM 6046137305 and partly from the project NAZV<br />
1B53043 supported by the Ministry of Agriculture, Czech<br />
Republic.<br />
REFEREnCES<br />
1. Annastasiades M., Lehotay S. J., Štajnbaher D., Schenck<br />
F. J.: J. AOAC 86, 412 (2003).<br />
<strong>2.</strong> Lehotay S. J., Maštovská K., Lightfield A. R.: J. AOAC<br />
88, 615 (2005).<br />
3. Lehotay S. J., Maštovská K., Yun S. J.: J. AOAC 88, 630<br />
(2005).<br />
4. Sulyok M., Krska R., Schuhmacher R.: Anal Bioanal<br />
Chem 389, 1505 (2007).<br />
5. Sulyok M., Berthiller F., Krska R., Schuhmacher R.:<br />
Rapid Commun. Mass Spectrom. 20, 2649 (2006).
Chem. Listy, 102, s265–s1311 (2008) Environmental Chemistry & Technology<br />
P35 AERObIC MTbE bIODEGRADATION by<br />
PAeCilOMyCes vAriOTii<br />
BLAZO LALEVIC a , VERA RAICEVIC a , LJUBInKO<br />
JOVAnOVIC b , DRAGAn KIKOVIC c and MIOMIR<br />
nIKSIC a<br />
a Faculty of Agriculture, Nemanjina 6, 11080 Belgrade-<br />
Zemun,<br />
b Institute for Multidisciplinary Research, Kneza Viseslava,<br />
11000 Belgrade,<br />
c Faculty of science, Lole Ribara 29, 38220 Kosovska Mit-<br />
rovica<br />
lalevicb@yahoo.com<br />
Introduction<br />
Methyl tert-butyl ether (MTBE) has been used since the<br />
1970s as a gasoline additive and octane booster to replace<br />
lead and other toxic additives and to improve combustion<br />
efficiency of gasoline. Because of useful properties, MTBE<br />
has become one of the organic compounds with the highest<br />
production in the world 1 . In 1999, about 3.3 million tons had<br />
produced in the European Union 2 . In the United States, in<br />
1998, MTBE was the fourth-most-produced chemical 3 . However,<br />
its extremely water solubility, mobility and volatilization<br />
have resulted in its contamination of surface soils, groundwater<br />
and sediments mainly from leaky tanks and spills 4 . A<br />
report by the U.S. Geological Survey identified MTBE as the<br />
second most common contaminant of urban aquifers in the<br />
USA 5 . The U.S. Environmental Protection Agency 6 has listed<br />
MTBE as a possible human carcinogen and recommended<br />
concentration in drinking water below 40 μg dm –3 .They also<br />
proposed the methods for removal of MTBE from environments.<br />
Bioremediation is methods, which use natural biological<br />
activity of microorganisms and plants to transform or<br />
destroy different toxic contaminants 7 . Previous bioremediation<br />
studies reported little or no biodegradation of MTBE<br />
under aerobic 8,9 and anaerobic 10,11 condition. However,<br />
authors 4,9,12,13 reported that pure and mixed bacterial cultures<br />
have been capable for MTBE biodegradation. There are only<br />
a few reports of fungal strains capable of biodegradation of<br />
MTBE 14,15,16 so far.<br />
The aim of this paper was to investigate the capacity of<br />
fungal strain Paecilomyces variotii, isolate 129b, for MTBE<br />
biodegradation at different MTBE concentration in laboratory<br />
conditions.<br />
Material and Methods<br />
I s o l a t i o n a n d I d e n t i f i c a t i o n o f<br />
F u n g u s P a e c i l o m y c e s V a r i o t i i<br />
The fungal strain of Paecilomyces variotii, isolate<br />
129b, was isolated from the wastewater of API separator in<br />
Oil Refinery Pancevo, Serbia. The cultures maintained onto<br />
rose bengal streptomycin agar (RBSA) plates 17 at 26 °C. The<br />
identification based on fungal morphological characteristics<br />
s406<br />
growing in malt agar and Czapek yeast agar (CYA), using the<br />
key for identification 18 .<br />
D e g r a d a t i o n E x p e r i m e n t<br />
Liquid suspension cultures grown axenically in 250ml<br />
glass bottles. The growth medium (80 ml) was mineral salts<br />
medium 14 . The medium sterilized at 121 °C for 15 min and<br />
inoculated with 10 % (v/v) of suspension of Paecilomyces<br />
variotii conidia (13.8 × 10 5 ). After addition of different MTBE<br />
concentrations, the liquid suspension cultures incubated for<br />
19 days at 26 °C and shaken at 120 rpm. All the experiments<br />
were conducted in triplicate.<br />
T h e Y i e l d o f P a e c i l o m y c e s<br />
V a r i o t i i M y c e l i a<br />
The yields of mycelia measured after 19 days by means<br />
of dry weight. Liquid suspension cultures were vacuum filtered<br />
onto filter papers. Mycelia and filters were dried at 65 °C<br />
for 24 h and reweighed. The control variant was without<br />
MTBE as an sоle energy and carbon source. The experiments<br />
were conducted in triplicate.<br />
A n a l y t i c a l M e t h o d s<br />
The MTBE used in these experiments originates from<br />
industrial facilities of Oil Refinery Pancevo. Consumption of<br />
MTBE was monitored by a Agilent Technologies 6890n gas<br />
chromatograph (GC) fitted with a flame ionization detector. A<br />
30 m × 0.53 mm ID, 3.0 μm DB-624 column was used (J&W<br />
Scientific, Folsom, CA, USA). The temperature program was<br />
50 °C for 2 minutes, ramp 8 °C min –1 to 100 °C, hold 3 minutes.<br />
The injector temperature was 170 °C and detector (FID)<br />
temperature 300 °C. The flow hydrogen was 40 ml min –1 ,<br />
flow air 450 ml min –1 and make up gas n 2 25 ml min –1 .<br />
The headspace (Agilent 7694E Head Sampler) was:<br />
vial equilibration time 30 min; bath temp. 80 °C; valve/temp<br />
loop 85 °C; transfer line temp. 120 °C; loop size 1 ml; pressure<br />
time 0.00 min; loop fille time 0.050 min; loop eq. time<br />
0.05 min; inject time 1.0 min. Internal standard was acetonitrile<br />
(retention time <strong>2.</strong>951 min). The MTBE retention time<br />
was 3.310 min. In experiment, headspace samples (100 μl)<br />
were taken with gas-tight syringes.<br />
The consumption of MTBE was measured in the beginning<br />
of the experiment and after 5; 12; 15 and 19 days.<br />
Results<br />
The soils of Oil Refinery Pancevo are heavy polluted<br />
with different organic substances and it can be expected to<br />
find out big diversity of fungus and bacteria whose use pollutants<br />
there as sole source of carbon and energy. During different<br />
experiments, about 40 bacteria and 14 different fungi<br />
strains were identified and isolated. One of the fungi founded<br />
there, after testing, showed high ability to consume MTBE.<br />
That fungus is isolated and identified as Paecilomyces variotii,<br />
isolate 129b, and used in experiments. Ours results<br />
showed that degradation rate was depending on initial MTBE<br />
concentration (10.85; 34.34 and 83.15 ppm used) and time
Chem. Listy, 102, s265–s1311 (2008) Environmental Chemistry & Technology<br />
of sampling. After 19 days of incubation, the degradation of<br />
initial middle (34.34) and high (83.15) MTBE concentration<br />
stopped, while the degradation of lowest MTBE concentration<br />
(10.85) continued after incubation period (Table I).<br />
Table I<br />
The decreasing of MTBE concentration (ppm) caused by fungal<br />
strain Paecilomyces variotii isolate 129b<br />
MTBE [ppm] 5th day 12 th day 15 th day 19 th day<br />
10.85 6.6 6.08 <strong>2.</strong>45 1.55<br />
34.34 33.5 23.34 19.19 20.2<br />
83.15 74.3 46.92 38.25 40.7<br />
Moreover, even different pattern of degradation the fungal<br />
strain of Paecilomyces variotii, isolate 129b, decreased<br />
MTBE concentration in all treatments used (Table II). The<br />
highest degradation rate (<strong>2.</strong>23 ppm per day) was in the treatment<br />
with the highest concentration used, (from 83.15 to<br />
40.70). In the middle treatment, the degradation rate decreased<br />
to 0.744 ppm per day and in lowest concentration the<br />
degradation rate further decrees to 0.490 ppm per day. However,<br />
the total MTBE degraded by fungi is to be in highest<br />
concentration used (4<strong>2.</strong>7 ppm for 19 days). From the Table III<br />
it can be seen that there is no substantial change in the fungus<br />
yields (mg/ml) compared treatments and control.<br />
Table II<br />
The MTBE degradation rate [%] caused by fungal strain<br />
Paecilomyces variotii isolate 129b<br />
MTBE 5th day 12 th day 15 th day 19 th day<br />
[ppm] [%] [%] [%] [%]<br />
10.85 39.2 44.0 77.4 85.7<br />
34.34 <strong>2.</strong>4 3<strong>2.</strong>0 44.1 41.2<br />
83.15 10.6 43.6 54.0 51.1<br />
The highest yield of Paecilomyces variotii mycelia was<br />
noticed at lowest initial MTBE concentration. The addition of<br />
MTBE slightly affects mycelia yield and is similar to control.<br />
The results of mycelia yield is in correlation with degradation<br />
results, because the highest mycelia yield is noticed in variant<br />
with lowest concentration used, but even that the difference<br />
among treatments are not statistically significant.<br />
Table III<br />
Paecilomyces variotii mycelia biomass after 19 days of<br />
MTBE treatments<br />
MTBE initial<br />
concentration<br />
repeats [mg ml –1 ]<br />
[ppm] I II III<br />
average<br />
[mg ml –1 ]<br />
10.85 0.010 0.026 0.037 0.024<br />
34.34 0.019 0.022 0.012 0.018<br />
83.15 0.018 0.025 0.014 0.019<br />
control 0.013 0.022 0.016 0.017<br />
s407<br />
The results of experiments showed that the fungal strain<br />
Paecilomyces variotii isolate 129b, is capable of MTBE utilization<br />
as sole source of carbon and energy to support growth.<br />
The highest MTBE degradation rate was at the lowest initial<br />
MTBE concentration. The addition of MTBE had a negative<br />
effect on degradation rate but total MTBE degraded was<br />
higher.<br />
Discussion<br />
Fungi are highly successful in survival because of their<br />
great physiological versatility. Their ability to produce extracellular<br />
enzymes is of great survival value. Fungi are involved<br />
in the biodegradation processes of undesirable materials<br />
(waste, pesticides, detergents, oil spills etc.) into harmless<br />
products 19 . The utilization of filamentous fungi for bioremediation<br />
processes has been limited compared with bacteria.<br />
Because of enzyme production in different environmental<br />
conditions, the fungi perform the degradation of broad<br />
spectrum of pollutants 20 . One of enzyme that is responsible<br />
for MTBE degradation is alcohol dehydrogenase 14 , who affects<br />
the TBF formation during the MTBE oxidation. Because<br />
of its gelatinolytic and cellulolytic activity, the fungus Paecilomyces<br />
variotii is capable of biodegradation of some aromatic<br />
volatile organic compounds (VOC) like toluene 21 , formaldehyde<br />
22 and alkylbenzenes 23 . In addition, recent reports<br />
showed that Paecilomyces variotii could be use in cadmium<br />
biosorption 24 and for bioremediation of aflatoxine 25 . Previous<br />
mycoremediation studies indicated that different fungal<br />
cultures have capability of MTBE biodegradation 15,16 .<br />
The results of investigation shown that Paecilomyces<br />
variotii mycelia can grow in the presence of different MTBE<br />
concentration. MTBE degradation rate is lowest in the latest<br />
phase of incubation period. This conclusion is in accordance<br />
with previous MTBE studies 14 , where the MTBE degradation<br />
rate progressively declined during the mycelia incubation<br />
with MTBE alone. Our experiments showed that the<br />
degradation rate was lower than in previous studies 14 , but the<br />
initial MTBE concentration was lower than in our investigation.<br />
The slower degradation rate was also possibly due to<br />
presence of methanol, which was solvent for MTBE. Other<br />
authors 15 also reported similar conclusion.<br />
The low degradation rate and yield of mycelia indicates<br />
that MTBE may be a poor substrate and energy source<br />
and/or that an intermediate during degradation may inhibit<br />
the microbial growth 12 . During the MTBE degradation, intermediates<br />
concentrations increased, while concentration of<br />
MTBE was decreased 26 . This conclusion confirms the MTBE<br />
degradation by microbial pure cultures. The results showed<br />
that ether bonds could be cleavage by certain microorganisms,<br />
although some investigations showed that this bond<br />
is not biodegradable or resistant to biodegradation 27 . According<br />
to this conclusion is a result of yield of Paecilomyces<br />
variotii mycelia, which was comparatively low. The low<br />
yield of microbial cultures in the presence of MTBE was also<br />
reported in earlier studies 28 , probably because this compound<br />
is metabolic and electron transport inhibitor 9 .
Chem. Listy, 102, s265–s1311 (2008) Environmental Chemistry & Technology<br />
This investigation confirms that the fungus Paecilomyces<br />
variotii isolate 129b can utilize the MTBE as a sole<br />
source of energy and carbon and could be use in degradation<br />
of recalcitrant contaminants such as the fuel oxygenates.<br />
Conclusions<br />
Based on these results following conclusions are<br />
obtained:<br />
• The degradation capability of Paecilomyces variotii isolate<br />
129b depend on initial MTBE concentration and on<br />
time of sampling.<br />
• During the experiment, the highest degradation rate was<br />
conducted at lowest initial MTBE concentration. After<br />
incubation period, the degradation of initial middle and<br />
high MTBE concentration stopped, while the degradation<br />
of lowest MTBE concentration continued.<br />
• The highest yield of Paecilomyces variotii mycelia was<br />
notices at lowest initial MTBE concentration, but even<br />
that the difference among treatments are not statistically<br />
significant.<br />
• The fungus Paecilomyces variotii isolate 129b can utilize<br />
the MTBE as a sole energy and carbon source and<br />
could be use in degradation of recalcitrant contaminants<br />
such as the fuel oxygenates.<br />
REFEREnCES<br />
1. Schmidt, T. C., Schirmer, M., Weiβ, H., Haderlein, S. B.:<br />
J. Contam. Hydrol. 70, 173 (2004).<br />
<strong>2.</strong> Krayer von Krauss, M., Harremoës, P.: Late Lessons<br />
from Early Warnings: The Precautionary Principle<br />
1896–2000. Environmental Issue Report, Vol. 2<strong>2.</strong> Office<br />
for Official Publications of the European Communities,<br />
Copenhagen. (2001).<br />
3. Johnson, R., Pankow, J., Bender, D., Price, C., and Zogorski,<br />
J.): Environ. Sci. Technol. 34, 210A. (2000).<br />
4. Hanson, J. R., Ackerman, C. E., Scow, K. M.: Appl.<br />
Environ. Microbiol. 65, 4788 (1999).<br />
5. Squillace, P. J., Zogorski, J. S., Wilber, W. G., Price,<br />
C. V. Environmental Science and Technology 30, 1721<br />
(1996).<br />
6. U.S. Environmental Protection Agency: Overview. EPA<br />
510-F-97-014. Office of Solid Waste and Emergency<br />
Response, Washington, DC (1998).<br />
7. Vidali, M.: Pure Appl. Chem. 73, 1163 (2001).<br />
8. Jensen, H. M., Arvin, E.: Contaminated soils ’90F<br />
(Arndt, M. Hinsenveld, and W. J. van den Brink (eds.),.<br />
Kluwer Academic Publishers, Dordrecht, The netherlands.<br />
445–448 (1990).<br />
s408<br />
9. Salanitro, J. P., Diaz, L. A., Williams, M. P., Wisniewski,<br />
H. L.: Appl. Environ. Microbiol. 60, 2593 (1994).<br />
10. Mormile, M. R., S. Liu, and J. M. Suflita.: Environ. Sci.<br />
Technol. 28, 1727 (1994).<br />
11. Yeh, C. K., and J. T. novak: Water Environ. Res. 66, 744<br />
(1994).<br />
1<strong>2.</strong> Mo, K., Lora, C. O., Wanken, A. E., Javanmardian, M.,<br />
Yang, X., Kulpa, C. F.: Appl. Environ. Microbiol. 47, 69<br />
(1997).<br />
13. Lalevic, B., Raicevic Vera, Kikovic, D., Jovanovic Lj.:<br />
Proceedings of XI Eco-conference, p. 271. novi Sad,<br />
(2007).<br />
14. Hardison, L. K., Curry, S. S., Ciuffetti, L. M., Hyman,<br />
M. R.: Appl. Environ. Microbiol. 63, 3059 (1997).<br />
15. Magaña-Reyes, M., Morales, M., Revah, S.: Biotechnol.<br />
Lett 27, 1797 (2005).<br />
16. Lalevic, B., Dabic, D., Raicevic, V., Kikovic, D., Jovanovic,<br />
Lj., niksic, M.: Mater. Prot. 3, 45 (2006).<br />
17. Peper, I. L., Gerba, C. P., Brendencke, J. W.: Acad. Press,<br />
San Diego, 11-33 (1995).<br />
18. Samson, R. A., Hoekstra, E. S., Frisvad, J. C. Baarn-<br />
Delft: Centraalbureau voor Schimmelcultures, Seventh<br />
edition (2004).<br />
19. Gopinath, S. C. B., Anbu, P., Hilda, A.: Mycoscience 46,<br />
119 (2005).<br />
20. Bennett, J. W., Faison, B. D.: Manual of Environmental<br />
Microbiology, Washington DC: ASM Press, 758–765<br />
(1997).<br />
21. Estevez, E., Veiga, M. C., Kennes, C.: J. Ind. Microbiol.<br />
Biotechnol. 32, 33 (2005).<br />
2<strong>2.</strong> Kondo, T., Morikawa, Y., Hayashi, n.: Appl. Microbiol.<br />
Biotechnol. 77, 995 (2008).<br />
23. Kennes, C., Veiga, M. C.: J. Biotechnol. 113, 305<br />
(2004).<br />
24. Chatterjee, n.: Thapar Institute of Engineering and<br />
Technology (Deemed University) PATIALA- 147 004<br />
(2006).<br />
25. El-Shiekh, H., Mahdy, H. M., El-Aaser, M.: Pol. J.<br />
Microbiol. 56, 215 (2007).<br />
26. Alimohammadi, M., Mesdaghinia, A. R., Mahmoodi,<br />
M., nasseri, S., Mahvi, A. H., nouri, J.: Iran J. environ.<br />
Health Sci. Eng. 2, 237 (2005).<br />
27. Erika, L. J., Christy, A. S., Kirk, T. O., Michael, R. H.:<br />
Appl. Environ. Microbiol. 70, 1023 (2004).<br />
28. Hristova, K., Gebreyesus, B., Mackay, D., Scow, K. M.:<br />
Appl. Environ. Microbiol. 69, 2616 (2003).
Chem. Listy, 102, s265–s1311 (2008) Environmental Chemistry & Technology<br />
P36 bIOLEAChING OF ANTIMONy MINERALS<br />
by bACTERIA ACiDiTHiObACillus<br />
ferrOOxiDANs AND DesulfOvibriO<br />
DesulfuriCANs<br />
ALEnA LUPTáKOVá a , EVA MAČInGOVá a , STEFAnO<br />
UBALDInI b and JAnA JEnČáROVá a<br />
Institute of Geotechnics of Slovak Academy of Sciences, Watsonova<br />
45, 043 53 Kosice, Slovak Republic,<br />
luptakal@saske.sk<br />
Introduction<br />
In several gold ores, gold is trapped in the matrix in of<br />
metallic sulphides (FeS 2 , Sb 2 S 3 etc.). In such cases recovery<br />
of gold from refractory ores requires a pre-treatment to liberate<br />
the gold particles from the host mineral. For the pre-treatment<br />
of gold ores exist several hydro- and biohydrometallurgical<br />
processes 1 . The fundamental of biohydrometallurgical<br />
processing for sulphide minerals is the application of microorganisms,<br />
which on the basis of their metabolic processes<br />
can increase or decrease mobility of metals 2,3,4 .<br />
In the area of biohydrometallurgical processing of goldbearing<br />
antimony sulphide minerals and concentrates the<br />
iron- and sulphur-oxidising bacteria have the very important<br />
function as well as on the ground the new knowledge also<br />
the sulphate-reducing bacteria 5,6,7 . Using involved bacteria<br />
to catalyse the breakdown of sulphides that host the gold<br />
is an important biological method for the pre-treatment of<br />
refractory gold ores. Following this biological treatment<br />
a combination of chemical and physical methods are used for<br />
leaching (e.g. the cyanide process) and concentration (e.g.<br />
the electrowinning) of gold. Although these methods are well<br />
accepted by industry, they harbour limitations in the processing<br />
of low-grade refractory ores, and regulatory agency/public<br />
acceptance of cyanide use. The objectives of this work<br />
were to evaluate the use of iron- and sulphur-oxidising bacteria<br />
Acidithiobacillus ferrooxidans (At. ferrooxidans) and<br />
sulphate-reducing bacteria Desulfovibrio desulfuricans (Dsv.<br />
desulfuricans) in the biohydrometallurgical processing of<br />
gold-bearing antimony sulphide minerals. Experiments were<br />
conducted at laboratory scale on a refractory gold-bearing<br />
stibnite coming from Santa Rosa de Capacirca Mine, Bolivia.<br />
Involved bacteria were used separately at different conditions<br />
for the pre-treatment of the aforementioned sample in order<br />
to increase the subsequent gold recovery during cyanidation<br />
processes. The At. ferrooxidans application is based on the<br />
their ability to oxidize and dissolve pyrite and stibnite, thus<br />
releasing the entrapped gold particles. The using of the bacteria<br />
Dsv. desulfuricans is based on their ability of the bacterially<br />
H 2 S production for the alkaline leaching of stibnite.<br />
Experimental<br />
M i c r o o r g a n i s m s<br />
In the experiment were used bacteria At. ferrooxidans<br />
isolated from the acid mine water 8 (deposit Smolník, Slovakia)<br />
and Dsv. desulfuricans isolated from the potable mineral<br />
s409<br />
water 9 (Gajdovka spring, Kosice, Slovakia). The isolation<br />
was performed by the modified dilution method 10 .<br />
S a m p l e s o f O r e<br />
The sample of gold-bearing antimony sulfide minerals<br />
used was obtained from Bolivia 6 (Santa Rosa de Capacirca<br />
Mine). Mineralogical characterisation by X-ray Diffraction<br />
(XRD) showed the presence of quartz (SiO 2 ), stibnite (Sb 2 S 3 )<br />
and pyrite (FeS 2 ). Their chemical composition includes<br />
21.93 % Si, 4.94 % Sb, 4.28 % Fe and 3.77 % (S). Quantitative<br />
chemical analysis was performed by Inductively Coupled<br />
Plasma Spectrometry (ICP).<br />
B i o l e a c h i n g T e s t b y B a c t e r i a<br />
Bacteria At. ferrooxidans and Dsv. desulfuricans were<br />
used separately. The experimental tests were conducted in a<br />
fed batch reactor at 30 °C under aerobic and dynamic conditions<br />
(with At. ferrooxidans) and anaerobic and static conditions<br />
(with Dsv. desulfuricans). The weight of the sample<br />
of gold-bearing antimony sulfide minerals was of 10 g. The<br />
total volume of feed solution consisted of 100 ml selective<br />
nutrient medium 1 9K(A) for At.f. with pH <strong>2.</strong>5; and DSM-63<br />
medium 10 for Dsv. desulfuricans with pH 7.5. The abiotic<br />
control was carried out without the bacteria application at<br />
the same conditions. Dissolved metals in liquid phase during<br />
the experiments were determined using an atomic absorption<br />
spectrophotometer. After 120 days the solid phases were<br />
recovered by filtration and were saved for the consequently<br />
test of cyanidation.<br />
Results<br />
The results of the bioleaching i.e. the pre-treatment of<br />
gold-bearing antimony sulphide minerals are demonstrated<br />
by Figs. 1.–4.<br />
Fig. 1. Dissolution of Fe by bacteria Acidithiobacillus ferrooxidans<br />
from the sample of gold-bearing antimony sulfide minerals.<br />
c – concentration of Fe, t – time of bioleaching,<br />
– Acidithiobacillus ferrooxidans, – abiotic control<br />
Fig. 1. presents the dissolution of the Fe by bacteria<br />
At. ferrooxidans and in the cases from the start until the end<br />
of experiments the concentration of Fe in liquid phase increase.<br />
From beginning, probably due to interaction between
Chem. Listy, 102, s265–s1311 (2008) Environmental Chemistry & Technology<br />
the mineral and the cultural medium and after 14 days by<br />
direct and indirect influence of bacteria At. ferrooxidans. This<br />
fact demonstrates the comparison of the Fe dissolution curve<br />
shape of At. ferrooxidans and abiotic control. It confirms the<br />
bioleaching of pyrite (FeS 2 ).<br />
Fig. <strong>2.</strong> Dissolution of the Sb by bacteria Acidithiobacillus ferrooxidans<br />
from the sample of gold-bearing antimony sulfide<br />
minerals. . c – concentration of Sb, t – time of bioleaching,<br />
– Acidithiobacillus ferrooxidans, – abiotic control<br />
Fig. 3. Influence of bacteria Desulfovibrio desulfuricans for the<br />
Fe dissolution under the alkaline leaching of gold-bearing antimony<br />
sulfide minerals. c – concentration of Fe, t – time of bioleaching,<br />
– Desulfovibrio desulfuricans, – abiotic control<br />
Fig. <strong>2.</strong> shows the trend of the Sb dissolving. Initially,<br />
during 7 days the concentration of Sb increases in the At. ferrooxidans<br />
presence and abiotic control, probably due to<br />
interaction between the mineral and the cultural medium. After<br />
7 days the abiotic control allocated the circa constant Sb<br />
concentration in liquid phase until the end. After 35 days was<br />
recorded the depression as follows was observed the decreasing<br />
of the Sb concentration until the end of experiments in<br />
the At. ferrooxidans presence. This fact can be interpreted on<br />
the bases the creation of the insoluble antimony oxosulphates<br />
– (SbO) 2 SO 4 according the reaction (1) 11 :<br />
s410<br />
Sb 2 S 3 + 6O 2 + 2H 2 O → (SbO) 2 SO 4 + 2H 2 SO 4<br />
Figure 3 presents the Fe concentration in liquid phase at<br />
the using bacteria Dsv. desulfuricans that was from beginning<br />
until the end almost zero. Although the little increase was<br />
observed after 19 days. This situation can be resolve by the<br />
Fe precipitation with bacterially produced hydrogen sulphide<br />
under the influence of bacteria Dsv. desulfuricans After 40<br />
days it’s the intense increase was recorded in the experiments<br />
without bacteria. Just now concerning this fact we have not<br />
the adequate understanding. At the end of the experiments the<br />
Fe concentration at presence SRB and abiotic control were<br />
again almost zero.<br />
Figure 4 shows the Sb concentration in the liquid phase<br />
at the using bacteria Dsv. desulfuricans From the confrontation<br />
of the Sb concentration curve shape in the abiotic control<br />
and in the presence bacteria you can see that the influence of<br />
bacteria Dsv. desulfuricans was not significant. The contamination<br />
of the abiotic control by bacteria Dsv. desulfuricans<br />
was not evidence. After 20 days was observed the formation<br />
of the shined cover on the reactor wall in the presence bacteria.<br />
Its can be explain to the Sb concentration decreasing.<br />
Fig. 4. Influence of bacteria Desulfovibrio desulfuricans for the<br />
Sb dissolution under the alkaline leaching of gold-bearing antimony<br />
sulfide minerals. c – concentration of Sb, t – time of bioleaching,<br />
– Desulfovibrio desulfuricans, – abiotic control<br />
After ending the solid phases were recovered by filtration<br />
from solution. The solid phases were saved for the<br />
consequently test of cyanidation and liquid phases for the<br />
electrowinning.<br />
Conclusions<br />
Experimental studies confirmed:<br />
• the bacteria At. ferrooxidans have the positive influence<br />
on the dissolving of pyrite (FeS2 ) and stibnite (Sb2S3 )<br />
to occur in the used sample of gold-bearing antimony<br />
sulphide minerals,<br />
• the increase, subsequent the depression and the decreasing<br />
of the Sb concentration during the bioleaching<br />
(1)
Chem. Listy, 102, s265–s1311 (2008) Environmental Chemistry & Technology<br />
•<br />
experiments with bacteria At. ferrooxidans can be interpret<br />
on the bases the creation of the insoluble antimony<br />
oxosulphates – (SbO) 2 SO 4 ,<br />
the bacteria Dsv. desulfuricans does not show the<br />
expressive influence for the alkaline leaching antimonybearing<br />
materials.<br />
This work was supported by the Slovak Research and<br />
Development Agency under the contract No. APVV-51-<br />
027705, Slovak Grant Agency VEGA No. 2/0075/08 and Slovak<br />
– Italian bilateral project.<br />
REFEREnCES<br />
1. Karavajko G. I., Rossi G., Agate A. D., Groudev S. G.,<br />
Avakyan Z. A.: Biogeotechnology of metals. Centre of<br />
projects GKnT, Moscow 1988.<br />
<strong>2.</strong> Gadd G. M.: Curr. Opin. Biotechnol. 11, 271 (2000).<br />
3. Kadukova J., Stofko M.: Environmetálne biotechnológie<br />
pre hutníkov. Equilibria s.r.o., Kosice 2000.<br />
4. Poulin R., Lawrence R. W.: Miner. Eng. 9, 799 (1996).<br />
5. Solozhenkin P. M., Lyalikova-Medvedeva n. n.: J. of<br />
Mining Sci. 37, 534 (2001).<br />
s411<br />
6. Ubaldini S., Veglio F., Toro L., Abbruzzese C.: Miner.<br />
Eng. 13, 1641 (2000).<br />
7. Solozhenkin P. M., nebera V. P.: Proc. of 15th International<br />
Biohydrometallurgy symposium: Biohydrometallurgy:<br />
a sustainable technology in evolution (Tsezos<br />
M., Hatzikioseyian A., Remoudaki E., eds.), p.10. national<br />
Technical University of Athens, Zografou, Athens<br />
2004.<br />
8. Luptakova A., Kusnierova M.: Proceedings of 2nd<br />
International Conference on Environmental Research<br />
and Assessment (Patroescu M., Matache M., ed.), p. 254.<br />
Bucharest 2006.<br />
9. Luptáková A., Kušnierová M., Fečko P.: Minerálne biotechnológie<br />
II., sulfuretum v prírode a v priemysle. ES<br />
VŠB – TU Ostrava, Ostrava 200<strong>2.</strong><br />
10. Ronald M. A.: Principles of Microbiology. Mosby, new<br />
York 1995.<br />
11. Postgate J. R.: The sulphate-reducing bacteria. Cambridge<br />
University Press, Cambridge 1984.<br />
1<strong>2.</strong> Lyalikova n. n.: Trans. Mosc. Soc. 24, 11 (1966).
Chem. Listy, 102, s265–s1311 (2008) Environmental Chemistry & Technology<br />
P37 ThE RECLAMATION OF CALCIuM<br />
SuLPhATE SLuDGES by SuLPhATE-<br />
REDuCING bACTERIA<br />
ALEnA LUPTáKOVá a and MáRIA KUŠnIEROVá a<br />
Institute of Geotechnics of Slovak Academy of Sciences, Watsonova<br />
45, 043 53 Kosice, Slovak Republic,<br />
luptakal@saske.sk<br />
Introduction<br />
Combustion of fossil fuels containing sulfur releases<br />
sulfur oxides to the atmosphere. If lime or limestone scrubbing<br />
desulfurizes combustion gases, calcium sulfates sludges<br />
are generated and these must be disposed of. Many processes<br />
for their treatment have been developed. Under appropriate<br />
conditions these sulfate can be converted to sulfide by the<br />
anaerobic bacterial sulfate reduction, which is the basic metabolic<br />
process of sulfate-reducing bacteria (SRB).<br />
The SRB represent a group of chemoorganotrophic<br />
and strictly anaerobic bacteria that may be divided into four<br />
groups based on rRnA sequence analysis 1 : Gram-negative<br />
mesophilic SRB, Gram-positive spore forming SRB, thermophilic<br />
bacterial SRB and thermophilic archaeal SRB. They<br />
include genera like Desulfovibrio, Desulfomicrobium, Desulfobacter,<br />
Desulfosarcina, Desulfotomacullum, Thermodesulfobacterium,<br />
Archaeoglobus, etc.<br />
Considering the inorganic or organic character of energy<br />
source of SRB there are two types of anaerobic respiration<br />
of sulfates authotrophic and heterotrophic 2 . SRB produce<br />
a considerable amount of gaseous hydrogen sulfide, which<br />
reacts easily in the aqueous solution with heavy metal, forming<br />
metal sulfides that have low solubility. In the bacterial<br />
anaerobic reduction of sulfates the organic substrate (lactate,<br />
malate, etc.) or gaseous hydrogen is the electron donor and<br />
sulfates is the electron acceptor.<br />
The industrial technologies for the desulfurization<br />
of combustion products produced during the generation<br />
of electric energy by combustion of fossil fuels use limestone<br />
(CaCO 3 ) as an absorption agent. The desulfurization<br />
of combustion products proceeds in the absorber in several<br />
stages. This process results in the formation of gypsum suspension<br />
(CaSO 4 . 2H2 O) which is incorporated into the final<br />
stored product – “stabilizate” – after being treated together<br />
with other wastes (ash, burnt lime, desulphurization waste<br />
water, etc.).<br />
The objective of our study was to verify experimentally<br />
the possibility of using gypsum contained in the above-mentioned<br />
“stabilizate” as the source of electron acceptors for the<br />
growth of SRB with the prospect of the recycling of desulfurization<br />
agent – limestone.<br />
Experimental<br />
M i c r o o r g a n i s m s<br />
A culture of SRB (genera Desulfovibrio and Desulfotomaculum)<br />
was obtained from drinking mineral water<br />
Gajdovka (locality Kosice-north, Slovak Republic). For the<br />
s412<br />
isolation and cultivation of these bacteria a selective nutrient<br />
medium (DSM-63 – Postgate′s C medium) was used 3 .<br />
L i q u i d P h a s e<br />
The feed solution (the selective nutrient medium (DSM-<br />
63 – Postgate’s C medium without sulfates) was prepared by<br />
dissolving analytical grade salts such as: K 2 HPO 4 0.5 g dm –3 ,<br />
nH 4 Cl 1 g dm –3 , CaCl 2 . 6H2 O 0.1 g dm –3 , MgCl 2 . 6H2 O<br />
0.3 g dm –3 , C 3 H 5 O 3 na <strong>2.</strong>0 g dm –3 , C 2 H 3 O 2 Sna 0.1 g dm –3<br />
and C 6 H 8 O 6 0.1 g dm –3 in distilled water.<br />
S o l i d P h a s e<br />
The sample of “stabilizate“ from Vojany power plant<br />
(Slovak Republic) was used in the experiments. Mineralogical<br />
characterisation by X-ray Diffraction (XRD) showed the<br />
presence of CaSO 4 40.84 %, SiO 2 2<strong>2.</strong>70 %, Al 2 O 3 10.70 %,<br />
Fe 2 O 3 4.26 % and CaO 3.00 %.<br />
A n a l y t i c a l P r o c e d u r e s<br />
A turbidimetric method was used to measure the concentration<br />
of soluble sulfate ion concentrations in the<br />
liquid phase 4 . Samples were centrifuged for 10 minutes at<br />
10,000 rpm before performing the analysis. Digital pH-<br />
meter GPRT 144 AGL was used. Qualitative changes of<br />
“stabilizate” were performed by the qualitative X-ray diffraction<br />
analysis using Dron-2 instrument and energy dispersive<br />
spectrometry (EDS) analysis using instruments, which consisted<br />
of a scanning electron microscope BS 300 and an X-ray<br />
microanalyser EDAX 9100/60. Samples of solid phase were<br />
dried and coated with gold before the EDS analysis.<br />
B i o l o g i c a l U t i l i z a t i o n o f G y p s u m<br />
f r o m “ S t a b i l i z a t e ”<br />
Series of anaerobic tests were studied in a fed batch<br />
reactor in the thermostat at 30 °C. Samples of “stabilizate”<br />
were kept in static conditions for a period of 40 days at pH<br />
7.5. The weight of “stabilizate“ was 20 g. The stock culture<br />
of SRB was used as an inoculum (10 %, v/v). The total<br />
volume of feed solution consisted of 200 ml distilled water<br />
and 300 ml selective nutrient medium for SRB (DSM-63<br />
– Postgate’s C medium without sulfates). The abiotic control<br />
was carried out without the SRB application at the same<br />
conditions. After 40 days the solid phase was filtered, dried<br />
and analyzed using the qualitative X-ray analysis and energy<br />
dispersive spectrometry (EDS) analysis.<br />
Results<br />
The formation of black precipitates and the sensorial detection<br />
of classical strong H 2 S smell were observed after 3–4<br />
days from the beginning of the process. These remarks were<br />
not detected in the abiotic control until the end of the experiment.<br />
Changes of sulphates concentration during the discontinuous<br />
cultivation of sulphate-reducing bacteria using gypsum<br />
contained in the “stabilizate” as the source of electron acceptors<br />
for the growth of SRB are shown in Fig. 1. The results of<br />
qualitative X-ray diffraction analysis of original “stabilizate”,
Chem. Listy, 102, s265–s1311 (2008) Environmental Chemistry & Technology<br />
bacterially treated “stabilizate” and “stabilizate” of abiotic<br />
control are shown in Figs. <strong>2.</strong>–4. They show the significant<br />
qualitative changes in the “stabilizate” initiated by SRB. The<br />
sulfates from the original major component of “stabilizate”<br />
– CaSO 4 . 2H2 O (Fig. <strong>2.</strong>) – were reduced according by SRB<br />
forming hydrogen sulfide as proved by the sensorial detection<br />
of classical strong H 2 S smell. This is indirectly confirmed by<br />
Fig. 3, which proves the extinction of CaSO 4 and formation<br />
of CaCO 3 according to equation (1):<br />
SRB<br />
2C 3 H 5 O 3 na + CaSO 4 → 2CH 3 COOna + CO 2 +<br />
CaCO 3 + H 2 S + H 2 O<br />
The above-mentioned changes have not been observed<br />
in abiotic control as documented by the comparison of qualitative<br />
X-ray analysis of “stabilizate” before applying SRB<br />
(Fig. <strong>2.</strong>) with the qualitative X-ray analysis of “stabilizate”<br />
in abiotic control (Fig. 4.). The results of energy dispersive<br />
spectrometry (EDS) analysis and scanning electron microscope<br />
of original “stabilizate”, bacterially treated “stabilizate”<br />
and “stabilizate” of abiotic control are shown in Figs. 5.–7.<br />
They fall into line with Figs. <strong>2.</strong>, 3. and 4. and suggest on the<br />
Fig. 1. Changes of sulfates concentration during the discontinuous<br />
cultivation of sulfate-reducing bacteria.<br />
c – sulfates concentration, t – time of sulfate-reducing bacteria<br />
cultivation, – “stabilizate” with SRb, – “stabilizate” without<br />
SRb (abiotic control)<br />
Fig. <strong>2.</strong> Qualitative x-ray analysis of “stabilizate” before application<br />
of sulfate-reducing bacteria. I – intenzity, u – 2-theta<br />
uhol, 1 – CaSO 4 . h2 O, 2 – SiO 2<br />
(1)<br />
s413<br />
elimination of CaSO 4 . 2H2 O form “stabilizate”. The element<br />
composition of solid phases (Figs. 5., 6. and 7.) accepts with<br />
this fact.<br />
Fig. 3. Qualitative x-ray analysis of solid phase formed by the<br />
effect of SRb on “stabilizate”. I – intenzity, u – 2-theta uhol,<br />
1 – CaCO 3 , 2 – SiO 2<br />
Fig. 4. Qualitative x-ray analysis of solid phase in abiotic con-<br />
Fig. 5. EDS qualitative analysis of “stabilizate” before application<br />
of sulfate-reducing bacteria
Chem. Listy, 102, s265–s1311 (2008) Environmental Chemistry & Technology<br />
Fig. 6. EDS qualitative analysis of solid phase formed by the<br />
effect of SRb on“stabilizate”<br />
Conclusions<br />
The results confirmed the theoretical assumptions on the<br />
use of gypsum, which forms the substantial component of<br />
“stabilizate”, as the source of sulphate for sulphate-reducing<br />
bacteria, which produce hydrogen sulphide in the process of<br />
bacterial reduction of sulphates. They also showed the possibility<br />
of recycling desulphurization agent – limestone.<br />
This work was supported by the Slovak Research and<br />
Development Agency under the contract No. APVV-51-<br />
027705, Slovak Grant Agency VEGA No. 2/0075/08 and Slovak<br />
– Italian bilateral project.<br />
s414<br />
Fig. 7. EDS qualitative of solid phase in abiotic control<br />
REFEREnCES<br />
1. Castro H. F., Williams n. H., Ogram A.: FEMS Microbiol.<br />
31, 1 (2000).<br />
<strong>2.</strong> Odom J. M., Rivers Singleton J. R.: The sulphate-reducing<br />
bacteria Contemporary Perspectives, Springer-<br />
Verlag, new York 1993.<br />
3. Karavajko G. I., Rossi G., Agate A. D., Groudev S. G.,<br />
Avakyan Z. A.: Biogeotechnology of metals. Centre of<br />
projects GKnT, Moscow 1988.<br />
4. APHA, Standard Methods for the Examination of Water<br />
and Wastewater, 17 th edition, American Public Health<br />
Association, USA, Washington D. C., 1989.
Chem. Listy, 102, s265–s1311 (2008) Environmental Chemistry & Technology<br />
P38 bIOLOGICAL-ChEMICAL REGENERATION<br />
OF DESuLPhuRIZATION SORbENTS bASED<br />
ON ZINC FERRITE<br />
MáRIA KUŠnIEROVá, ALEnA LUPTáKOVá,<br />
VLADIMíR ŠEPELáK and MáRIA PRAŠČáKOVá<br />
Institute of Geotechnics SAS, Watsonova 45, 043 53 Kosice,<br />
Slovak Republic,<br />
kusnier@saske.sk<br />
Introduction<br />
The energetic demands of people in present, as well<br />
as in the future will be supplied mainly by the energy from<br />
the fossil sources, which is accompanying with the negative<br />
impact on the environment in the form of emissions of sulphate<br />
and carbonate compounds. For desulphurization and<br />
decarbonization of these emissions more commercial technological<br />
methods have been developed, to which belongs<br />
also the utilization of solid sorbents (filters) based on the zinc<br />
ferrite. The studies of Grindly 1 and Krisham 2 helped to clear<br />
up the high-temperature process of desulphurization of waste<br />
gases after coal combustion which can be described by the<br />
chemical equation:<br />
3ZnFe 2 O 4 + 3 H 2 S + H 2 → ZnS + 2FeS + 4H 2 O (1)<br />
In dependence on the conditions of the combustion process<br />
there is according to the Lamoreaux 3 a possibility of a<br />
occurring of another reaction of the iron (occurring in the<br />
solid sorbents) with waste gases of carbon, leading to formation<br />
of carbide. This is governed by the equations:<br />
3FeO + CO → Fe 3 C + 2O 2<br />
3Fe + CO → Fe 3 C + ½O 2<br />
The phase composition of sulphurized (amortised) sorbents<br />
shows the presence of sulphidic and carbidic structures<br />
located mainly on the surface of particles of zinc ferrite<br />
(respectively Zn Fe 2 O 3 – micropellets of zinc ferrite). They<br />
became inactive and the further utilization is constrained to<br />
their regeneration. In relation with the most effective methods<br />
of manifold recycling of sorbents, several methods of their<br />
regeneration were studied.<br />
The literature shows two methods of regeneration of<br />
sulphatizing sorbents based on zinc ferrite. The first method<br />
commercially used, is a oxidising pyrolysis of sulphides 2 . In<br />
this process are the sulphidic structures in dependence on the<br />
temperature of the oxidising rousting transformed step by<br />
step at the first stage to the sulphates and at the second stage<br />
which corresponds to the temperature of sulphates decomposition<br />
(in the temperature range from 480 to 600 °C) to the<br />
oxides, according to the equations (4) and (5):<br />
2FeS + 3.5O 2 → Fe 2 O 3 + 2SO 2<br />
(2)<br />
(3)<br />
(4)<br />
s415<br />
ZnS + 1.5O 2 → ZnO + SO 2<br />
The second method of the regeneration of desulphurization<br />
sorbents which is introduced by Sakao 4 , is based on the<br />
principle of pressure leaching of ZnS in water environment at<br />
the temperature over 550 °C. This method is described by the<br />
equation, almost identical with the Eq. (5):<br />
ZnS + 1.5O 2 → ZnO + SO 2<br />
The commercially available technologies of sulphides<br />
processing and treatment (as sources of colour and rare<br />
metals) have nowadays started with utilization of biologicalchemical<br />
processes (bio-leaching); where the physical and<br />
chemical base of degradation of sulphidic structures is identical<br />
with the methods of regeneration of desulphurization<br />
sorbents mentioned above.<br />
The principle of all mentioned methods is the process of<br />
sulphides oxidation with utilization of various methods of catalysis.<br />
In the process of thermic regeneration is the oxidising<br />
reaction catalysed by the thermic energy, at pressure leaching<br />
by the pressure and temperature.<br />
The aim of this paper is to testify the biological-chemical<br />
method as a new method of sorbents regeneration, utilising<br />
the catalytic effect of the metabolism of an acidophilous bacteria<br />
– Thiobacillus ferrooxidans, oxidising the sulphate and<br />
iron 8 .<br />
Experimental<br />
M a t e r i a l<br />
Zinc ferrite<br />
For biological-chemical regeneration, zinc ferrite after<br />
sulphurization test was used.The powder sample containing<br />
90 % zinc ferrite and 10 % bentonite binder by weight was<br />
pelletized to cylindrical pellets, calcined in air from room<br />
temperature to 970 K, and crushed and sieved to the size<br />
of a stainless steel cylinder, in which 25 g of pelletized sorbent<br />
was packed.The simulated coal gas had the following<br />
composition: 30 % vol. CO, 50 % vol. n 2 , 19.5 % vol. H 2 ,<br />
and 0.5 % vol. H 2 S. Total gas flow-rate diring absoption was<br />
5,000 cm 3 min –1 . The desulphurization tests were stopped<br />
when the H 2 S concentration of the effluent gas was above<br />
50 ppm. The details of the sulphurization experiments are<br />
described also in our previous papers 6,7 .<br />
bacteria<br />
The bacteria used in experiments was: Thiobacillus<br />
ferrooxidans, isolated from the mining drainage waters of<br />
sulphides deposits, which is cultivated for a long time on<br />
the sphalerite (ZnS) substrates. The leaching solution was<br />
formed by cultivated medium according to the Silverman<br />
and Lundgren 5 , in which the cells of bacteria were scattered.<br />
The pH value of the solution at the beginning of the reaction<br />
was 1.6.<br />
(5)<br />
(6)
Chem. Listy, 102, s265–s1311 (2008) Environmental Chemistry & Technology<br />
M e t h o d s<br />
The experiments of biological-chemical way of regeneration<br />
were realized by the form of charge leaching tests at<br />
the suspension density 5 % at the temperature of 30 °C, under<br />
continuos stirring for the period of 19 days. The qualitative<br />
changes of investigated zinc ferrite during the process of biologico-chemical<br />
way of regeneration were evaluated by:<br />
• RTG diffraction analysis (diffractometer DROn 2,0<br />
Technsabexport, Russian, FeKa radiation),<br />
• particle size distribution (granulometer Helos and Rodos,<br />
Sympatec GmbH Claustahl Zellerfeld),<br />
• BET adsorption method for measuring the adsorption<br />
surface (Micromeritics, Gemini 2360, in nitrogen atmosphere),<br />
• chemical analysis of the content of Zn and Fe in the<br />
leach (atom absorption spectroscopy on the instrument<br />
Spectra AA-30 ,Varian, Australia).<br />
Results<br />
RTG diffraction analysis of amortised sorbents revealed<br />
except of the rest ferrite zinc (Franklinite, ZnFe 2 O 4 ), which<br />
represents probably the nonreacted cores of micropelets, also<br />
the presence of the formed sulphidic, sulphate, oxidic and<br />
carbidic compounds: b-sphalerite (ZnS), wurtzite (ZnS with<br />
addition of Fe), pyrite (FeS 2 ), melanterite (FeSO 4 . 9H2 O),<br />
elemental sulphur (S), magnetite (Fe 3 O 4 ), hematite (a-Fe 2 O 3 )<br />
and cohenite (Fe 3 C).<br />
The bio-leaching of this product leads to the biologicochemical<br />
degradation of amortised layers located on the surface,<br />
which is accompanied by the extraction of Zn and Fe<br />
to the leach. The changes of the concentration of introduced<br />
elements in the leach in dependence on the time of leaching<br />
are shown in Table I.<br />
The concentration of Zn in the leach during the observed<br />
time interval showed the arising trend, while in the Fe concentration<br />
dependence has been appeared the maximum (after<br />
15 days the concentration of the leached ferrite decreased).<br />
As the realized experiments represent the spontaneous<br />
non-regulated process of biologico-chemical oxidation, it is<br />
possible to assume that the decrease of the Fe concentration<br />
Table I<br />
The time dependence of changes of Zn and Fe concentration<br />
in the leach during the biological-chemical regeneration of<br />
amortised sorbents based on zinc ferrite<br />
Time leaching Concentration Concentration<br />
[days] Fe [g dm –3 ] Zn [g dm –3 ]<br />
0 0.37 0.62<br />
3 0.37 1.21<br />
5 1.48 1.56<br />
7 1.50 1.73<br />
10 1.39 <strong>2.</strong>68<br />
14 0.52 <strong>2.</strong>81<br />
17 0.55 <strong>2.</strong>97<br />
19 0.61 3.19<br />
s416<br />
Fig. 1. Comparison of x-ray phase analysis of zinc ferrite sorbent,<br />
A – primary, b – pasivated, C – biologically and chemicaly<br />
regenerised<br />
Legend: w – wurtzite, F – franclinite, S – sphalerite<br />
was caused by the precipitation of the secondary oxididic<br />
compositions of the iron. This assumption has been confirmed<br />
by the RTG diffraction analysis of the leach. After finishing<br />
the biological-chemical leaching of amortised sorbent the<br />
extinction of the most of secondary structures formed by<br />
sorption of sulphate compositions was observed by the RTG<br />
method (Fig. 1.).<br />
The regenerated sample contained the franklinite, addition<br />
of magnetite, metal zinc and the rest of wurtzite, which<br />
during the observed period manifested itself as refractory<br />
mineral and to its destruction the longer period or the change<br />
of electrochemical conditions of leaching should be needed 9 .<br />
Referring to the reality, that the effectivity (the sorption<br />
capacity) of sorbents is directly connected with the sizes<br />
of their surfaces and inversely with the particles sizes, the<br />
changes of these parameter were also studied (Fig. <strong>2.</strong>). The<br />
process of biological-chemical regeneration caused intense<br />
changes in the adsorption surface of sorbents, it has changed<br />
from the value of <strong>2.</strong>8245 m 2 g –1 at amortised sample to the<br />
value of 6.2543 m 2 g –1 at the regenerated sample.<br />
The expressive change was also registered at the distribution<br />
of the particles sizes. The value of mean particle<br />
diameter has decreased from the value of 9 mm at amortised<br />
sorbent to <strong>2.</strong>19 mm at the regenerated sorbents (Table II).
Chem. Listy, 102, s265–s1311 (2008) Environmental Chemistry & Technology<br />
A<br />
B<br />
C<br />
Fig. <strong>2.</strong> Mophology of surface of the zinc ferrite sorbent, A – primary,<br />
b – pasivated, C – biological and chemical regenerised<br />
Conclusions<br />
The presented results confirm the possibility of utilization<br />
of the biological-chemical method as a new regeneration<br />
method of desulphurization sorbents based on zinc ferrite.<br />
The big advantage of this process in comparison with conventional<br />
regeneration methods is the lowering of the temperature<br />
of leaching from 500°C to 30°C. The period of the<br />
duration of the regeneration seems to be an disadvantage, its<br />
lowering requires the additional research aimed at the con-<br />
s417<br />
Table I<br />
Comparison of the selected fysical and chemical charakteristic<br />
of the zinc ferrite sorbents before and after biological and<br />
chemical regeneration<br />
Specific Surfaces<br />
Average of<br />
Sample surface SA factor f *<br />
particles<br />
[m2 g –1 ] d50 [μm]<br />
primary<br />
sorbent<br />
pasivated<br />
sorbent<br />
regenerised<br />
sorbent<br />
<strong>2.</strong>6 1.022 4.77<br />
<strong>2.</strong>8 1.478 9.10<br />
6.2 1.797 <strong>2.</strong>19<br />
tinual optimalization of conditions for biologico-chemical<br />
regeneration.<br />
This work was supported by the Slovak Research and<br />
Development Agency under the contract No. APVV-51-<br />
027705.<br />
REFEREnCES<br />
1. Grindley T., Steinfeld G.: Proceedings. 4 th Annual<br />
Contractor ´s Meeting on Contaminant Control in Hot<br />
Coal-Derived Gas Streams. U. S. Department of Energy/<br />
METC. Morgantown, WV. DOE/ METC, 85-3, pp. 314-<br />
446. Morgantown 1984.<br />
<strong>2.</strong> Krishan G. n.,Tong G. T., Lamoreaux R. H., Brittain R.<br />
D.: Wood B.J.: Proceedings of Fifth Annual Contractor´s<br />
Meeting on Contaminant Contro in Hot Coal-Derived<br />
Gas Streams. U. S. Department of Energy/METC. Morgantown,<br />
WV. DOE/ METC-85/6025, pp. 6-18. Morgantown<br />
1985.<br />
3. Lamoreaux R.M., Brittain R.D., Zieger J., Leach. S.C.:<br />
Determination of Solid Phase Boundaries in Coal Gas<br />
Desulfurization by Zinc Ferrite., U. S. Department of<br />
Energy/METC. Technical Report DOE/MC 21096-219<strong>2.</strong><br />
Morgantown, WV, 1986.<br />
4. Sasaoka E., Hatori M., Sada n., Uddin A.: Ind. Eng.<br />
Chem. Res. 39, 3844 (2000).<br />
5. Buchanan R. E. and Bigons n. E. Bergy´s Manual of<br />
Determinative Bacteriology., 8 th ed., Baltimore, 1974.<br />
6. Wutzer R., Steinike U., Lorenz P., Rossahl,B.: Brennstoff-Wärme-Kraft<br />
45, 477 (1993).<br />
7. Šepelák V., Rogachev Yu., Steinike U., Uecker D. Ch.,<br />
Krumeich F., Wissmann S., Becker K. D.: Brennstoff-<br />
Wärme-Kraft 48, 1996, 28.<br />
8. Barret J., Hughes M. n., Karavajko G. I., Spencer P. A.:<br />
Metal extraction by bacterial oxidation of minerals. Eôis<br />
Horwood, new York, London, Toronto, Sydney, Tokyo,<br />
Singapore, 1996.<br />
9. Baláž P., Kušnierová M., Varencova V. I., Mišura B.: J.<br />
Miner. Process. 40, 273 (1994).
Chem. Listy, 102, s265–s1311 (2008) Environmental Chemistry & Technology<br />
P42 CAuSES OF ACCIDENTS REGARDING<br />
TRANSPORT OF DANGEROuS GOODS<br />
JAnA VICTORIA MARTInCOVá a , IVAn MAŠEK a and<br />
JIří MARTInEC b<br />
a Faculty of Chemisty Brno, University of Technology, Purkyňova<br />
118, 612 00 Brno, Czech Republic,<br />
b Clean Energies Unit, Institute for Energy, JRC, 1755 ZG<br />
Petten, The Netherlands,<br />
platina@email.cz<br />
Introduction<br />
Transport of dangerous substances can be characterized<br />
by a permanent or relative contact with the population and<br />
represents in all possible stages a potential hazard. Related<br />
to human health, injury or death people during accidents<br />
also damage to property and the affected environment, the<br />
transport of dangerous goods is very serious problem. Road<br />
– accidents in hazardous materials transportation have increased<br />
95 % in the last 30 years. This negative feature of the<br />
excessive traffic is evident due to available statistics of the<br />
accidents in the whole Europe. Besides the noticeable number<br />
of accidents in the cases related to the transport of dangerous<br />
substances the economical point of view in increasing<br />
costs is under general concern.<br />
The most frequented transportation regarding dangerous<br />
goods is on the roads in the Europe.<br />
Results<br />
Accident registration has been launched in 2000 in the<br />
Czech Republic by the traffic police. Data from 2000 to 2002<br />
are not very precise because of administration faults. Data<br />
registered since 2003 has been more precise.<br />
As an example of main causes of accidents the accident<br />
frequency in 2003 and 2004 were used – regarding accidents<br />
conform to the directive ADR (European Agreement Concerning<br />
the International Carriage of Dangerous Goods by<br />
Road). There was a new code system regarding causes of<br />
accidents used. Previous code system included causes and<br />
their consequences related to the hazard. The new system<br />
Fig. 1. Main cause of accident, 2003<br />
s418<br />
is focused only on the main cause of accident. The aim of the<br />
system is the minimal and concise list of codes.<br />
All results regarding causes of accidents were worked<br />
out by cooperation with Police of the Czech Republic.<br />
Figs. 1. and <strong>2.</strong> show the main causes of ADR accidents<br />
which are evident.<br />
Fig. <strong>2.</strong> Main cause of accident, 2004<br />
1 – overtaking, 2 – side-on crash, 3 – speeding (not keep a safe distance),<br />
4 – driver did not adapt speed (to condition and character<br />
of a road, cargo character, skills of a driver, character of a car), 5<br />
– poor attention of a driver (skid, crashing into a barrier, off the<br />
road, collision with a car, a stationary car, a driving car, collision<br />
with a pedestrian, collision with a bicycle), 6 – while reversing, 7<br />
– uncontrolled driving of truck set, 8 – driving roadside, 9 – not<br />
respecting railway signals, 10 – turning round, 11 – technical<br />
fault (on the vehicle, on the vehicle set), 12 – turning off, 13 –<br />
non-acquaintance with or bad judgment of the size of the truck,<br />
14 – crash with upstream driving car, 15 – bad fixation of a<br />
cargo, 16 – falling asleep, micro-sleep, 17 – not respecting traffic<br />
signs (“right of way”, prohibitive), 18 – not giving right of way,<br />
19 – bad driving in the traffic lane (side-on crash, inadvertence<br />
of the parallel driving car), 20 – character of the road, damage of<br />
the road, 21 – contrary climatic conditions, 22 – impaired driving,<br />
23 – cause is unknown<br />
Reasons of accidents are mostly the same when considering<br />
small cars or trucks. The main reasons are human<br />
error; poor attention of drivers and their reactions and no<br />
acceptance of the speed limit.<br />
The experience of drivers is crucial and each company (transporting<br />
dangerous goods according to the ADR) should have a<br />
possibility to check driver’s crime sheet regarding accidents and<br />
other offences.<br />
From the figures below the age of drivers causing<br />
accidents is evident. The statistic results from years 2003 and<br />
2004 for construction of Figs. 3. and 4. were used.<br />
From the mentioned results is evident, that the age of<br />
drivers has no effect on the accident frequency (ADR) or<br />
the cause. In fact many of available studies show relation<br />
between frequency of accidents (regarding total number of<br />
car accidents) and age drivers.
Chem. Listy, 102, s265–s1311 (2008) Environmental Chemistry & Technology<br />
Fig. 3. Age of drivers during accidents, 2003<br />
Fig. 4. Age of drivers during accidents, 2004<br />
Conclusions<br />
The Czech Republic is one of the countries with the largest<br />
accident frequency and high number of deaths of people<br />
s419<br />
during accidents. Reasons for accidents are mostly the same<br />
when considering small cars or trucks. The main reason is<br />
human error – insufficient attention of drivers and their reactions,<br />
further more no acceptance of the speed limit.<br />
Substances included in the group of flammable substances<br />
(according with European ADR directive) represent the most<br />
frequently transported dangerous materials on the roads. A risk<br />
assessment for dangerous substances is performed using different<br />
kinds of methods. In order to propose and create methods for the<br />
safe transport of dangerous goods is at first necessary to perform<br />
an extensive analysis of the existing situation. Methods must be<br />
also focused, made relevant to different localities and the industry<br />
to represent different surroundings. More strict penalties could be<br />
applied. The experience of drivers is crucial and each company<br />
(transporting substances according to ADR) should have to check<br />
drivers’ crime sheet regarding accidents and other offences and<br />
also prove their skills.<br />
There is possibility to improve the situation through our preparedness,<br />
self-education, and interest regarding the problem.<br />
REFEREnCES<br />
1. Police of the Czech Republic, Statistics.<br />
<strong>2.</strong> United nations Economic Commission for Europe:<br />
Directive ADR – European Agreement Concerning the<br />
International Carriage of Dangerous Goods by Road,<br />
United nations, new York and Geneva, 2006.<br />
3. Lees, F. P.: Prevention in the Process Industries, Butterworths,<br />
London, 1980.<br />
4. Scenna n. J., Santa Cruz A. S. M.: Reliab. Eng. Syst.<br />
Saf. 90, 83 (2005).<br />
5. Martincova, Masek, nBC 2006, Symposium on chemical,<br />
biological, nuclear and radiological threats – a<br />
safety and security challenge, Tampere, Finland 2006.<br />
6. Martincova J., Masek I.: 34 th International Conference<br />
of SSCHE, Tatranské Matliare, May 2008.
Chem. Listy, 102, s265–s1311 (2008) Environmental Chemistry & Technology<br />
P43 RISKS FACTORS OF SOCIAL DEVELOPMENT<br />
AS ENVIRONMENT FOR MANAGEMENT<br />
IVAn MAŠEK a and JAROMíR nOVáK b<br />
a Brno University of Technology, Faculty of Chemistry, Purkynova<br />
118, Brno, 612 00, Czech Republic,<br />
b Palacký University Olomouc, Philosophical Faculty, Krizkovskeho<br />
12, Olomouc, 771 80, Czech Republic,<br />
masek@fch.vutbr.cz<br />
Introduction<br />
All things, phenomena, and processes have their own<br />
causes and consequences. They bring along pros and cons;<br />
they can be controlled and chaotic, can and cannot be influenced.<br />
Social development has been getting more and more<br />
complicated, undergoing fast changes; being difficult to predict.<br />
If the last century was said to be a century of changes,<br />
this feature will be more significant and determining for further<br />
development. There is more and more urgent need to ask<br />
questions about further development and search for answers<br />
to them. What is our future going to be like? What factors<br />
are there going to become determinants for further phenomena<br />
and processes management? It is necessary to deal with<br />
negative consequences of our decision making processes. For<br />
the purpose of this contribution, concerning the topic of the<br />
conference, We are going to try to briefly describe some of<br />
the crucial factors development, which could be considered<br />
as risks.<br />
Authors think that everybody can be influenced by them,<br />
as well as influence them him/herself. This concerns especially<br />
those people who manage.<br />
Risk factors<br />
F a c t o r 1 – P o p u l a t i o n<br />
A c c u m u l a t i o n D y n a m i c s<br />
The number of the Earth population grows unevenly,<br />
especially in materially immature countries. In materially<br />
mature countries the birth rate is descending, there are a<br />
growing number of seniors. This will evoke changes in processes<br />
as well as in number and quality of human population,<br />
its behaviour and migration.<br />
Population aging will influence its integration into<br />
economic and other socially significant processes. Social<br />
and health systems, material and non-material needs, such<br />
as boarding, dressing, hygiene, travelling, free time, home<br />
equipment; relationship between people and generations will<br />
change. Country defence potential will change, too.It is a big<br />
difference between the needs to negate poverty with a lack of<br />
capital and material production, and, on the contrary, to offer<br />
capital and material production to poverty.<br />
F a c t o r 2 – I n e q u a l i t y o f t h e W o r l d<br />
W e a l t h<br />
There are a few countries that experience a relative prosperity.<br />
On the other hand it is estimated that up to two billions<br />
of people suffer absolute poverty. There are about fifteen<br />
s420<br />
countries on the planet which record growth, but more than a<br />
hundred countries record descent or stagnation. According to<br />
some records there are 85 % shopping expenses for 20 % of<br />
the richest people. On the other hand 20 % of the poorest people<br />
must settle for 1.1 % of the world incomes (as compared<br />
to 1.4 % in 1991 and <strong>2.</strong>3 in 1960).<br />
More than a billion people do not have access to medical<br />
services, basic education or drinkable water, two billions<br />
do not have electricity and 80 % of the world population do<br />
not have the slightest possibility to telecommunicate and this<br />
access new information and communication technologies,<br />
which can, for example, enable distant studies.<br />
It has also been found out that if the world population<br />
used the same ways of development and consumption as<br />
north America, we would need three planets like the Earth<br />
is.<br />
The gap between the rich and the poor is getting bigger.<br />
On one side there are great chances to balance the inequalities,<br />
and on the other side they are being deepened. The problems<br />
of justice are to be seriously dealt with. The poor can<br />
not pay for the prosperity of the rich.<br />
The inequalities are deepened not only among countries,<br />
or the north and the South, but also among people inside the<br />
countries. For instance, in the USA the rate between the highest<br />
and the lowest salaries has risen from 35 multiple up to<br />
150 multiple within the last 20 years. We witness deepening<br />
of inequalities even here in our republic. Is it right for the<br />
poor to contribute the rich? How long will it last to the poor<br />
to start taking from the rich or at least make their wealth less<br />
pleasant? There are such cases and most probably there will<br />
be more and more of them.<br />
F a c t o r 3 – T h e E n v i r o n m e n t<br />
Pressure caused by human activities having impact<br />
on nature systems is huge. Generally, it is connected with<br />
great material movement. Unrenewable resources are being<br />
fatigued, wasted, species of fauna and flora perish, water<br />
and air are being polluted, and number of natural as well as<br />
human-caused disasters is growing.<br />
There have been mostly warning and non-optimistic statements<br />
published in the last few years. They are often contradictory.<br />
Yet, they have something in common – they make<br />
us think and act. Acting in the sense of adequate performance<br />
does not appear very often. It is so for many reasons.<br />
Europe, as well as other continents, is going to face<br />
droughts and floods. Water level of seas can rise up to one<br />
meter. There is a threat of devastating winds. World map is<br />
expected to change.<br />
According to the Living Planet Report, published by<br />
the World Wildlife Fund (WWF), standards of our lives can<br />
collapse in three decades. It is because we have been withdrawing<br />
from the planet every year up to one fifth more than<br />
the planet is able to renew. If the development continues this<br />
way, the biological capacity withdrawal deficit will reach up<br />
to 220 % in the half of the century.
Chem. Listy, 102, s265–s1311 (2008) Environmental Chemistry & Technology<br />
The report states that the life expectancy will rapidly<br />
decline around the year 2030. Level of education and world<br />
economy will irrefutably collapse.<br />
Unrenewable resources are being fatigued and wasted,<br />
species of fauna and flora perish, water and air are being<br />
polluted, and number of natural as well as human-caused<br />
disasters is growing. Environment knows no frontiers. In the<br />
past years at international conferences attention was paid to<br />
greenhouse gases emissions, yet no success was reached. For<br />
example – the USA produce <strong>2.</strong>5 multiple of carbonic oxide<br />
emissions per person than Europe. In the USA the emissions<br />
production growth is eighteen per cent; the world average is<br />
nine per cent.<br />
A hectare of tropical forests disappears every two<br />
seconds. The species disappear from hundred to thousand<br />
times faster then they would when living in a harmonic<br />
environment.<br />
Water problems are increasingly urgent. What may happen<br />
is that this century will even become a century of a war<br />
over water, food and raw materials. Water means life. Lack<br />
of water is more and more apparent. Rivers, streams, swamps<br />
and moor land dry up.<br />
Unrenewable resources are being fatigued, wasted,<br />
species of fauna and flora perish, water and air are being<br />
polluted, and number of natural as well as human-caused<br />
disasters is growing. Environment knows no frontiers. In the<br />
past years attention was paid to greenhouse gases emissions<br />
at international conferences, yet no success was reached. For<br />
example – the USA produce <strong>2.</strong>5 multiple of carbonic oxide<br />
emissions per person than Europe. Water problems are increasingly<br />
urgent. Maybe this century will even become a war<br />
over water, food and raw materials.<br />
F a c t o r 4 – G l o b a l i z a t i o n<br />
Consequently to almost complex globalization the world<br />
is really or relatively diminishing, with no regard to continents,<br />
countries, districts. Mutual dependency of population<br />
is growing incredibly; consequences of individual’s mistakes<br />
significantly affect others.<br />
Here an essential question is to be asked: What is the connection<br />
between often absurdly defended freedom of individuals<br />
and at the same time the growing mutual dependence of<br />
people? Apart from freedom there is also justice and stability,<br />
balance and equality. So far we have been witnessing more of<br />
globalization of power, profit and exploitation. It is necessary<br />
to globalize responsibility for nature and people in it.<br />
Great attention is being paid to globalization in various<br />
discussions. It has its positive features as well as big negatives.<br />
We must find a way to tame it to avoid a great disaster.<br />
If we manage to run the globalization processes there is<br />
a chance for a positive development. It is good that Movements<br />
against wild globalization start to appear.<br />
s421<br />
F a c t o r 5 – I n t e g r a t i o n a n d<br />
D i s i n t e g r a t i o n<br />
Various groups come into being and on the contrary,<br />
states decay, therefore the there is bigger and undesirable<br />
atomization. People, regions and countries have their own<br />
interests, often of vital importance, which can be and are in<br />
contradiction with interests and aims of other countries. It<br />
is difficult do make compromise solutions. Politics and economics<br />
deal more often with the consequences than causes.<br />
Almost 20 new countries have arisen within the past 10 years,<br />
which have different political systems and aims, which are,<br />
apart from other, based on nationalistic principles.<br />
The role of international organisations changes – Un,<br />
EU, International monetary fond, World Bank, WTO, nATO<br />
and others. We can not say that the changes are always positive,<br />
transformation is essential.<br />
F a c t o r 6 – n C B W e a p o n s<br />
There are a growing number of countries which have or<br />
will have nuclear weapons. That increases the world insecurity<br />
as well as opportunities to destroy. Here is important to<br />
note the proliferation of military equipment and technologies<br />
of ambiguous use, like nBC weapons. Gun trade volume is<br />
not low. For example, in the last three years, American companies<br />
sold weapons for nearly 19 milliard dollars; French<br />
companies for 4 milliards dollars, and German ones for 1<br />
milliard dollars.<br />
Besides official, by governments approved gun trades<br />
there is a trade that is being tolerated and concluded by<br />
governments. There is also illegal gun trade.<br />
A big threat of today is a black market dealing with<br />
nuclear material and nuclear equipment. Gaining theoretical<br />
knowledge in the way of overpaying the specialists or<br />
documents is a current problem, too. non-proliferation of all<br />
kinds of weapons, especially nBC weapons has another side,<br />
too. It is that they are kept by countries that have already<br />
had them. The logic is simple – why do some countries have<br />
them, and why the others do not? Why can you have them<br />
but we cannot? Once these weapons exist, it is a question of<br />
time and money for the others to get them. The “others” can<br />
potentially mean terrorists. Why have these weapons actually<br />
been developed and why do they exist? If the development<br />
does not change, the world will take a risk of self-destruction.<br />
The danger can be bigger than it was during the cold war<br />
time. During the cold war time, these weapons “helped” keep<br />
peace, though the peace was unstable and faulted.<br />
There is a growing number of countries which have<br />
or will have nuclear weapons. That increases the world<br />
insecurity as well as a chance to destroy. Here is important<br />
to note the spread of military equipment and technologies of<br />
ambiguous use, like nBC weapons.<br />
F a c t o r 7 – V i o l e n c e G r o w t h<br />
It is easily provable that there is a quantitative as well<br />
as qualitative growth of violence. Here it is appropriate to<br />
remember Erich Fromm who defines violence as an urgent
Chem. Listy, 102, s265–s1311 (2008) Environmental Chemistry & Technology<br />
consequence of a non-lived and crippled life. A person who<br />
is not able to create must destroy. We have been witnessing<br />
growth of violence. The violence has many forms – human<br />
(physical and mental), military, economy, financial, political,<br />
etc. Difference between war and peace has been becoming<br />
less apparent as seen from many contemporary examples.<br />
The volume of gun-running is not small. For example, in the<br />
last three years American companies sold weapons for nearly<br />
19 milliard dollars, French companies for 4 milliard dollars<br />
and German ones for 1 milliard dollars. People tend to feel<br />
insecure. Violence has negative influence on mental, physical,<br />
and social health.<br />
F a c t o r 8 – P e r m a n e n t D e v e l o p m e n t<br />
Probably never in human history was people’s ability to<br />
self destroy as high as it is today. Will we control the ability<br />
or cope with it? Is permanent development possible? Is there<br />
and will there be enough sources for needs filling? Values and<br />
needs vary with individuals, regions, states and continents<br />
– will the differences be apparent? One of many world principles<br />
is stability and balance. Let us admit that something<br />
like this exists in materially developed world. The situation,<br />
however, can rapidly change into misbalance and dramatic<br />
value, visions and ideology conflicts.<br />
The world has been changing fast and dramatically. Is<br />
mankind able to accept these changes throughout its physical<br />
and mental essence? Probably everybody must admit that<br />
mere existence of modern technologies brings along civilisation<br />
risks that were unthinkable several years ago. How can<br />
the modern technologies be used and controlled for general<br />
use? Do modern technologies serve people or do people serve<br />
modern technologies?<br />
F a c t o r 9 – A b i l i t y t o M a n a g e<br />
To be able to cope with development and suppress<br />
negative factors as much as possible, the problems have to<br />
be recognised and described openly and impartially. It also<br />
necessary to find consensual solution – to manage. Management<br />
is, in its essence, optimal use of available sources. The<br />
main group of sources include: human, financial, material,<br />
information and time sources.<br />
Risk factors are unpleasant parts of life. They can, however,<br />
work as challenge for searching for solution. Individual<br />
and social scruples make people tend to avoid thinking about<br />
unpleasant things. This phenomenon can be seen every day.<br />
However, burying heads into sand and pursuing ostrich-like<br />
policy will not lead to success. This policy will lead to postponing<br />
and not solving the problems and, in its consequences,<br />
will be nonreturnably harmful.<br />
It is necessary to independently examine the risk factors<br />
and, if necessary, to establish an independent institution for<br />
these purposes. Avoiding unpleasant things can cause their<br />
outbreak. Political institutions have to be included in this<br />
s422<br />
work in larger extent than they are today. Without wearing<br />
ideological blinkers must we ask questions like: “Is it true?<br />
Can it be true?” instead of “who and why said that?”.<br />
If we characterise contemporary and, especially, future<br />
environment as turbulent, it will not be an empty or just interesting<br />
concept. In various studies there have been characterised<br />
dozens of risks that can reach different levels of significance<br />
and different levels of development. It is probable<br />
that there may quickly appear new unexpectable, and, from<br />
today’s point of view, unpredictable risks. Unfortunately, we<br />
make some decisions using logic of today or even yesterday.<br />
Environment has been becoming more and more complicated;<br />
technologies have been in progress. People and their<br />
understanding, thinking and behaviour are changing, too.<br />
It is necessary to ask the main question: Is there (do we<br />
have) any visions, plans, and directions for the new century?<br />
Are there any devices for them? Don’t we focus on shortterm,<br />
purpose-made, selfish solutions, which will chase us<br />
into a trap? Don’t we remove consequences instead of causes<br />
of our decisions?<br />
We are certain that the crucial key matter of future is<br />
regulation, management, ability and willingness to manage<br />
even within international standards, as well as balanced unity<br />
of managing items. It is necessary to solve problems within<br />
international standards without selfishness, using the principles<br />
of solidarity and balanced values substitutions. It will<br />
take us a long time to do so.<br />
Conclusions<br />
The above stated factors are mutually interconnected;<br />
they influence each other, change their content and extent.<br />
There is a possibility of chaotic and unrestrained development<br />
along with uncontrollable, unpredictable changes resulting<br />
from these factors. In their consequences, these changes<br />
create risks and threats. It is very important for the top management<br />
representatives to realise the characters of development<br />
factors. These factors concern each of us, too.<br />
REFEREnCES<br />
1. Beck, U.: Riziková společnost. Sociologické nakladatelství,<br />
Praha 2004.<br />
<strong>2.</strong> Huntington, Samuel P. Střet civilizací. Rybka publishers,<br />
Praha 2001.<br />
3. němeček, P., a kol.: Možné trendy rozvoje podniků. Akademické<br />
nakladatelství CERM, Brno 2004.<br />
4. novák, J.: Možné vývojové tendence okolí managementu.<br />
In Sborník konference GEMAN 04 „General<br />
management“. Plzeň: Sdružení EVIDA Plzeň, 2004.<br />
5. Rašek, A.: Zpráva o stavu České republiky-oblast bezpečnosti.<br />
CESES, UK Praha, 2004.<br />
6. Souček, Z.: Sežer! nebo budeš sežrán?! ? In Sborník<br />
konference PEMAN 05 „Personal management“. Plzeň:<br />
Sdružení EVIDA Plzeň, 2005.
Chem. Listy, 102, s265–s1311 (2008) Environmental Chemistry & Technology<br />
P44 CAN wE ENSuRE SAFER ENVIRONMENT<br />
FOR CuLTuRAL hERITAGE?<br />
IVAn MAŠEK a and ZDEnA ROSICKá b<br />
a Brno University of Technology, Faculty of Chemistry, Purkynova<br />
118, Brno, 612 00, Czech Republic,<br />
b Universita of Pardubice, Faculty of Restoration, Jiraskova<br />
3, Litomysl, 570 01, Czech Republic,<br />
masek@fch.vutbr.cz<br />
Introduction<br />
Books should be kept in a stable environment. This is<br />
best effected by preventing temperature changes around the<br />
collection or ensuring that any changes made will be very<br />
gradual. In addition, books in fragile condition should be<br />
placed in close-fitting, nearly airtight enclosures. They protect<br />
materials from dust and airborne pollutants; reduce the<br />
exchange of moisture between the paper in the books and the<br />
air. Slow changes in air temperature around a book will not<br />
cause harm, even sudden upward temperature changes are<br />
not too damaging. In case the book in a protective enclosure<br />
is suddenly cooled, water will condense on the enclosure’s<br />
interior walls when the temperature drops bellow the dew<br />
point of the air within the enclosure.<br />
The climate maintained in a library is the result of a<br />
compromise between the needs of the readers and the staff,<br />
maintenance demands and the structure of the building which<br />
should result in minimizing the deterioration rate of the collection.<br />
It is believed that that the rate of deterioration of library<br />
materials doubles with every 10°C increase of temperature.<br />
This belief is based on the fact that the speed of chemical<br />
reactions depends in large part of temperature. Recommended<br />
temperature ranges for a variety of library materials.<br />
A certain amount of relative humidity is necessary for<br />
paper to retain its flexibility but scientists disagree about<br />
the optimum relative humidity desirable because increased<br />
moisture content increases the rate of deteriorative chemical<br />
reactions and mold will grow. The recommended level<br />
of relative humidity is a compromise among several require-<br />
ments:<br />
•<br />
•<br />
•<br />
level of moisture high enough to maintain flexibility,<br />
level low enough to slow deterioration of materials and<br />
control insects and mold,<br />
level that will do no structural harm to library buildings<br />
due to condensation in cold weather.<br />
Molds cause a downy or furry growth on the surface of<br />
organic matter; they can develop on leather, cloth, paper, etc.,<br />
especially in the presence of relatively high heat and relative<br />
humidity. Every cubic meter of air contains thousands of<br />
molds spores that cover surface of library objects. Mold and<br />
mildew eat books and papers. The cellulose, adhesives and<br />
starches in the sizing provide a source of nutrition that enables<br />
the fungi to excrete digestive enzymes that convert these<br />
materials into forms they can digest. Molds usually attack<br />
bindings before the text block because it lands on the binding<br />
s423<br />
first, the cellulose is more difficult to digest and the text block<br />
is tightly closed.<br />
Salvage of Flood Damage Papers<br />
It should be noted that flood damage to some items may<br />
be irreversible. The treatment of objects of high monetary,<br />
historic or sentimental value should only be performed in<br />
consultation with a conservator.<br />
Many people are sensitive to mold and some mold species<br />
are toxic. The best way to prevent or stop the outbreak<br />
of mold is to remove items from environmental conditions<br />
that encourage mold growth: high temperature, high relative<br />
humidity, stagnant air and darkness. If wet and moldy materials<br />
cannot be dried immediately they may be stabilized by<br />
freezing. Placing damaged items in a personal or commercial<br />
freezer will not kill mold, however, it will put the mold<br />
in a dormant state until time and the appropriate treatment<br />
environment are available. Active mold look fuzzy or slimy.<br />
Dormant mold is dry and powdery. Mold which remains<br />
active after freezing or after the host material appears dry<br />
may be treated with exposure of 1–2 hours to ultraviolet radiation<br />
from the sun. Extreme caution must be exercised when<br />
treating material outdoors: too much radiation will accelerate<br />
deterioration and may cause fading, wind may cause<br />
physical damage, and high relative humidity or condensation<br />
caused by rapid temperature changes may also exacerbate<br />
mold growth. Dormant mold spores will reactivate as soon as<br />
conditions are favorable. They should, therefore be removed<br />
from items and may be brushed or vacuumed away.<br />
There are both chemical and non-chemical means to kill<br />
mold. Effective treatment can be fungi-static or fungicidal.<br />
Fungi-static treatments are those preventing the mold spores<br />
from germinating but do not kill the mold. Freezing is one of<br />
methods. Fungicidal treatment kills the mold and its spores.<br />
no safe large-scale treatment imparts lasting or residual mold<br />
control. That is why it is important to change the environment<br />
so it inhibits mold growth. In addition, there is some evidence<br />
that books and papers treated with fungicides may be more<br />
susceptible to mold after treatment than they were prior to<br />
the outbreak.<br />
Fig. 1. Flood damaged book
Chem. Listy, 102, s265–s1311 (2008) Environmental Chemistry & Technology<br />
Paper is very fragile when it is wet. In some cases it may<br />
be desirable to remove caked-on mud and dirt as dirt left by<br />
receding water may be contaminated. Wet documents or photographs<br />
which cannot be air dried within two days should be<br />
frozen to inhibit mold growth. Circulating air will effectively<br />
dry most items. Physical distortions may result but information<br />
will be saved. Blotting materials for air drying should be<br />
clean and absorbent. Screening material such as window screens,<br />
well supported and stacked with spaces between them<br />
provide an excellent compact drying surface. The porous surface<br />
assists air circulation and promotes drying.<br />
Without intervention glossy materials such as paperback<br />
book covers, art books, etc. are likely to stick together. Loose<br />
glossy materials should be spread out in one layer for air<br />
drying. Bound glossy materials must be interleaved between<br />
every page to prevent sticking.<br />
As to books, interleaving material should be placed<br />
between the text block and the front back covers. If time and<br />
supplies allow interleaving material should be placed intermittently<br />
throughout the text as well. Evaporation of water as<br />
it wicks into the interleaving paper will enhance drying.<br />
Several classes of photographs are highly susceptible to<br />
water damage and the recovery rate will be very low. Old<br />
photographs and negatives can never be frozen. Most prints,<br />
negatives and slides may successfully be individually air<br />
dried face up. Contemporary photographic prints and negatives<br />
which are still wet and have stuck together may separate<br />
after soaking in cold water, however, this type of treatment<br />
could cause irreversible damage. Highly valued items,<br />
particularly prints, for which there is no longer a negative,<br />
should be referred to a conservator immediately.<br />
s424<br />
Conclusions<br />
The most critical element affecting the longevity of<br />
library materials is the environment in which they are used<br />
and stored. The sitting of the building, its orientation to the<br />
sun, building’s location in areas safe from flooding and other<br />
natural disasters, planted areas and trees near perimeter walls,<br />
the design of roofs, basements, and location of windows considering<br />
stack areas. But it is not only buildings and their<br />
design that cause problems: libraries house millions of books<br />
published on acidic paper, high temperatures and humidity<br />
cause chemical reactions between the cellulose in paper, the<br />
acids residing in the fibers, and pollutants in the atmosphere,<br />
all of which accelerate deterioration.<br />
Adjusting the environment near the building can help<br />
considerably in reducing problems inside.<br />
REFEREnCES<br />
1. Ritzenthaler M. L.: Archives and Manuscripts: Conservation:<br />
A Manual on Physical Care and Management.<br />
SAA Basic Manual Series. Chicago: Society of American<br />
Archivists, 1993.<br />
<strong>2.</strong> Padfield T.: Climate Control in Libraries and Archives.<br />
In Preservation of Library Materials: Conference held<br />
the National Library of Austria, Vienna, 1986. IFLA<br />
Publications, 41. Munchen:K.G.Saur, 1987.<br />
3. nyberg S.: The Invasion of the Giant Spore. SOLInET<br />
Preservation Program Leaflet no 5: Southeastern<br />
Library network, Inc., november 1, 1987.
Chem. Listy, 102, s265–s1311 (2008) Environmental Chemistry & Technology<br />
P47 CIVIL PROTECTION IN ThE CZECh<br />
REPubLIC AND ITS PERSPECTIVES<br />
OTAKAR J. MIKA and LEnKA FIŠEROVá<br />
Faculty of Chemistry, Brno University of Technology, Purkyňova<br />
118, 61200 Brno, Czech Republic,<br />
mika@fch.vutbr.cz<br />
Introduction<br />
From the legal, institutional and structural points of<br />
view the history of the conception of civil protection in the<br />
Czech Republic was relatively complicated during 90-ties.<br />
The above development accompanied fundamental socialpolitical<br />
changes in the country after 1989 without being<br />
completed with adaptation of legislation focused on civil<br />
protection. Even if the importance of civil protection reflecting<br />
increasing risks of anthropogenic, natural and mixed<br />
origin in peace conditions was fully accepted by specialists<br />
and the responsible state authorities passed individual measures<br />
aimed on gradual change of the state then, the global<br />
conception of civil protection was approved by the Czech<br />
government as late as in 200<strong>2.</strong><br />
The Act no. 239 of June 28, 2000 on integrated rescue<br />
system introduced the term civil protection into the Czech<br />
legal code. According to the above act civil protection is<br />
understood as fulfillment of civil protection tasks, especially<br />
warning, evacuation, sheltering and emergency survival of<br />
civilian population and further measures to ensure protection<br />
of their lives, health and possessions with reference to the<br />
article no. 61 of Protocol Additional to the Geneva Conventions<br />
of August 12, 1949 on protection of international armed<br />
conflicts victims (Protocol I).<br />
Civil protection has become an integral and priority<br />
domain of emergency planning and management. In connection<br />
with its systematical implementation and practical<br />
realization the necessity of university education for qualified<br />
emergency managers mastering thoroughly both theoretical<br />
and practical background of civil protection has been proved.<br />
history of Civil Defense and Protection<br />
Purposeful and qualified attention has been paid to the<br />
practical and theoretical problems of civil protection in the<br />
Czech Republic (former Czechoslovakia) for more than<br />
seventy years.<br />
As early as in 1929, after World War I, the Centre for<br />
Civil Defense was established by the Czechoslovak Ministry<br />
of Defense as a response to both complicated international<br />
political situation then and to growing fears of danger from<br />
air force war activities threatening civilians especially with<br />
chemical warfare agents. The Centre was run as a voluntary<br />
organization via local bodies with the semi-official support<br />
of central authorities and with active participation of organizations<br />
whose program was concentrated on defense activities.<br />
One year later the organization Protection of Civilians<br />
against Air Raids arose.<br />
s425<br />
A remarkable change of situation was noticed in the<br />
first half of 30-ties of the previous century. At that time the<br />
attempt of nazi Germany to realize its political aims aggressively<br />
by all the available means expressed by its intensive<br />
building military and air forces was becoming more and more<br />
apparent.<br />
The authorities of the Czechoslovak Republic reflected<br />
the above situation by introduction of a series of individual<br />
precautions resulting in passing the Act no. 82/1935 Coll.<br />
on protection from and on defense against air raids. The base<br />
for system of legal regulations for civil protection was set<br />
both by promulgation of the above law and by establishment<br />
of Civil Air Defense (referred to as CAD). Amending the<br />
above law another Act no. 75 of April 1938 represented a<br />
reaction to immediate threat of the Czechoslovak Republic<br />
by fascist Germany. The conception of CAD in the pre-war<br />
Czechoslovak Republic fulfilled requirements then and under<br />
given conditions it comprised the first historical phase of systematic<br />
and effective attempt to solve the problems of civil<br />
protection.<br />
During the occupation of the Czechoslovak Republic by<br />
nazis the CAD was liquidated and its compartments, units<br />
and material equipment were taken over by the German Air<br />
Defense in 1941. After liberation in 1945 the CAD passed out<br />
of existence. The first attempts to re-establish it were realized<br />
after 1948.<br />
Regardless of certain individual measures the work<br />
on institutionalization of a civil defense (referred to as CD)<br />
organization culminated in 1951 by acceptation of Government<br />
resolution on civil defense fixing gradual organizational,<br />
personal and material building of civil defense in the<br />
legal code.<br />
Between 1951 and 1970 civil defense was focused<br />
solely on protection against conventional weapons and on<br />
priority ensurance of protection against weapons of mass<br />
destruction effects (referred to as WMD). In 1955 the<br />
Research Institute of Civil Defense was established. Transfer<br />
of civil defense subject to protection against weapons of mass<br />
destruction expressed crucial qualitative change that resulted<br />
in acceptance of the new Resolution of Government of the<br />
Czechoslovak Republic no. 49/1958 Coll. on civil defense<br />
of the Czechoslovak Republic. For its support the following<br />
services were founded: medical, energy, gas, transport, fire,<br />
order, road and bridge, municipal, shelter, water-technical,<br />
agricultural, camouflage, construction-technical and supply<br />
ones. Operative control of civil defense was ensured by CD<br />
staffs whose members were mainly regular soldiers.<br />
Based on the legal resolution of Federal Assembly no.<br />
17/1976 Coll. drawing on doctrinal theory of Warsaw pact<br />
countries the subordination of CD was transferred from the<br />
Federal Ministry of Interior to the Federal Ministry of national<br />
Defense effective January 1, 1976. The State Defense<br />
Council became the supreme body for state defense control.<br />
Federal Ministry of national Defense was entrusted to<br />
become the central body of state administration for organization,<br />
coordination and control of CD on the whole area of the
Chem. Listy, 102, s265–s1311 (2008) Environmental Chemistry & Technology<br />
Czechoslovak Republic. Local authorities at all levels were<br />
responsible for provision of tasks and needs of CD. Between<br />
1976 and 1989 CD followed directives of the State Defense<br />
Council.<br />
In June 1991 the State Defense Council approved the<br />
Conception of Civil Defense in the Czech and Slovak Federative<br />
Republic reflecting trends of CD development abroad<br />
with the aim to focus on protection of population against<br />
non-military emergency events. For the first time in the<br />
Czechoslovak history clear differentiation of functions and<br />
tasks of CD in times of peace and during military alerts was<br />
expressed.<br />
Substantial changes were implemented after division<br />
of the federal state into two independent ones and after the<br />
establishment of the Czech Republic on January 1, 1993. Effective<br />
that day the operation of the former Federal CD staff<br />
was transferred to the Staff of Civil Defense of the Czech<br />
Republic. On March 17, 1993 the Resolution of the Government<br />
of the Czech Republic no. 126/1993 Coll. on the state<br />
of civil protection in the Czech Republic, its structure and<br />
material needs ensurance was passed. The government states<br />
there that the formation of the new civil protection system<br />
(referred to as CP) will be realized together with the new conception<br />
of the Army of the Czech Republic with full respect to<br />
the Protocols Additional I and II to the Geneva Conventions.<br />
On September 1, 1993 the Central Body for Civil Protection<br />
of the Czech Republic was established by the directive of<br />
then minister of defense. The body became an authority of<br />
the Ministry of Defense responsible for execution of state<br />
administration in CP affairs and at the same time it replaced<br />
the Staff of Civil Protection of the Czech Republic.<br />
In 1997 the Government of the Czech Republic confirmed<br />
the resolution no. 710/1997 Coll. transferring the<br />
authority to execute state administration on CP from the<br />
Ministry of Defense to the Ministry of Interior and set the effective<br />
date on January 1, 2000 in the resolution no. 53/1999<br />
Coll. In the new organization structure the Central Body<br />
for Civil Protection of the Czech Republic and regional CP<br />
bodies were united with the Fire Rescue Service of the Czech<br />
Republic (referred to as FRS). This way the activities of CP<br />
of the Czech Republic as an institution was terminated and<br />
the General Directorate of FRS of the Ministry of Interior<br />
became central authority entrusted with civil protection.<br />
Effective Legislation Focused on Ensurance of Civil<br />
Protection<br />
The government of the Czech Republic approved the<br />
Conception of Civil Protection until 2006 with the Prospect<br />
to 2015 (referred to as conception 2006) in its resolution no.<br />
417/200<strong>2.</strong> The conception solves protection of civilians systematically.<br />
The government obliged ministers and heads of<br />
other authorities, governors and city mayors of Prague, Brno,<br />
Ostrava and Plzeň to implement fully the measures comprised<br />
in the above conception 2006 that emphasizes responsibility<br />
of ministries, central state authorities, local authorities,<br />
persons and physical persons for CP specified by laws. The<br />
s426<br />
conception was revised by the resolution of the Czech government<br />
no. 21/2005 Coll.<br />
In the above conception 2006 civil protection was<br />
characterized as a system of activities and procedures, subject<br />
related authorities, other subjects and individual citizens<br />
resulting in minimization of impacts of emergencies on lives<br />
and health of inhabitants, on possessions and environment.<br />
At the beginning of 2008 (on February 25) the Government<br />
of the Czech Republic passed the resolution no. 165<br />
“On Evaluation of the State of Implementation of the Conception<br />
of Civil Protection until 2006 with the Prospect to<br />
2015 and on the Conception of Civil Protection until 2013<br />
with the Prospect to 2020” giving more details on CP in the<br />
Czech Republic. This resolution contains 25 pages of specialized<br />
text from the field of CP and the Schedule of Implementation<br />
of Provisions on CP until 2013 with the Prospect to<br />
2020 (referred to as conception 2013 and schedule). Inspite<br />
of the attempt to design the conception 2013 and schedule<br />
from the contemporary point of view it is necessary to point<br />
at inconsistent solutions of some problems concerned.<br />
Civil protection represents an extremely important aspect<br />
of life of modern society. The supreme legislative regulation<br />
of the Czech Republic, the Constitution, ensures protection of<br />
lives, health, possessions of Czech citizens and protection of<br />
environment. Similarly to other developed European countries<br />
the security-political situation in the Czech Republic has<br />
been re-evaluated during the last decade of the 20 th century.<br />
As the result of substantial political changes at the beginning<br />
of 90-ties military threat in Europe and global war conflict<br />
became less probable. Attention was focused on non-military<br />
risks important from the point of view of individual countries<br />
and security of their citizens.<br />
Regarding the importance of civil protection its problems<br />
should be specified and expressed in a special law.<br />
Possible content and extent of the suggested law on civil pro-<br />
tection follows:<br />
•<br />
•<br />
•<br />
•<br />
•<br />
•<br />
•<br />
•<br />
•<br />
Introductory provisions<br />
Definitions and basic terms<br />
General provisions<br />
Emergency events and crisis states<br />
Basic organization and technical measures for civil protection<br />
Protection of citizens against impacts and effects of<br />
emergency events and crisis states<br />
Preparedness of citizens for emergency events and crisis<br />
states<br />
Execution of state administration in the field of civil protection<br />
Effectiveness of the act<br />
Besides the above mentioned legislative regulation a<br />
project “Who is Who in Civil Protection” should be implemented.<br />
Authors and proposers will appreciate inspiring and<br />
constructive ideas and comments concerning the project.
Chem. Listy, 102, s265–s1311 (2008) Environmental Chemistry & Technology<br />
Project: Who is Who in Civil Protection in the Czech<br />
Republic<br />
Aim of the project:<br />
• to compile a database of specialists in the fields related<br />
to civil protection in the Czech Republic<br />
• to support preparedness and capacity of action of professional<br />
and voluntary bodies related to civil protection<br />
• to list bodies or people in the database based on voluntary<br />
principle (protection of personal data of listed participants<br />
of the project)<br />
•<br />
•<br />
•<br />
•<br />
•<br />
•<br />
Project outcomes:<br />
Proceedings (printed publication)<br />
Implementation and update of a website<br />
Participating organizations – initial suggestion:<br />
Universities: e.g. Technical University of Ostrava<br />
– Faculty of Safety Engineering; University of Defense<br />
Brno – Institute of nBC Defense Vyškov; Police Academy<br />
of the Czech Republic, Prague, Department of<br />
Crisis Management; Brno University of Technology,<br />
Faculty of Chemistry; Tomas Bata University Zlín; University<br />
of South Bohemia, České Budějovice; Palacky<br />
University Olomouc; University of Pardubice; University<br />
of Economics, Prague etc.<br />
Research institutes and specialized institutions: e.g.<br />
Population Protection Institute Lázně Bohdaneč; Military<br />
Technical Institute of Protection Brno; national<br />
Institute for nuclear, Chemical and Biological Protection<br />
Kamenná; State Office for nuclear Safety, Prague etc.<br />
Companies and firms manufacturing and marketing<br />
materials for civil protection (e.g. syndicate of companies<br />
Czech nBC team etc.)<br />
Ministries: Ministry of Interior – General Directorate of<br />
Fire Rescue Service and Police of the Czech Republic;<br />
Ministry of Health – Department of Crisis Preparedness,<br />
Emergency Medical Service, Air Rescue Service,<br />
selected hospitals; Ministry of Defense; Ministry of<br />
Industry and Trade; Ministry of Transport; Ministry of<br />
Education, Youth and Sport; Ministry of Environment;<br />
voluntary bodies, e.g. Czech Red Cross, Mountain Rescue<br />
Service of the Czech Republic etc.<br />
Proposed personal data of specialists to be listed in the<br />
“Who is Who in Civil Protection in the Czech Republic”<br />
database:<br />
s427<br />
•<br />
•<br />
•<br />
•<br />
•<br />
First name and surname, academical degrees<br />
Employment history/accomplishments<br />
Major contemporary professional orientation<br />
Major supervised projects and publications in the field<br />
of CP in recent 5 (10) years<br />
Contact information for communication: address, telephone<br />
and fax numbers, e-mail address etc.<br />
Implementation of the above process makes sense when<br />
its outcomes are accessible e.g. on a special website available<br />
for selected specialists assigned with passwords and when the<br />
database is regularly updated.<br />
Conclusions<br />
Contradictory and contrary character of civilization<br />
activities accompanied with permanent proliferation of security<br />
risks results in increasing danger for citizens caused by<br />
growing number and types of emergency events. The development<br />
of corresponding security system lags behind the<br />
above described process, which makes the problems of civil<br />
protection permanently unresolved.<br />
Civil protection as a system of specialized measures<br />
remains an integral part of crisis management and represents<br />
its priority in non-military emergency events. Concerning the<br />
systematic approach to solve individual types and kinds of<br />
emergency events civil protection is understood as a separately<br />
controlled and coordinated domain.<br />
With regard to growing importance of civil protection<br />
nowadays and in future preparation of and negotiation on<br />
special legislative regulations (see the proposed law on civil<br />
protection above) based on a “set of acts on crisis states”<br />
passed in the half of 2000 year and effective January 1, 2001<br />
can be highly recommended. The field of civil protection<br />
deserves proper background in thorough legislation.<br />
REFEREnCES<br />
1. Zeman M., Mika O. J.: Protection of Citizens. Brno University<br />
of Technology, Faculty of Chemistry, Brno 2007<br />
<strong>2.</strong> Silhanek B., Dvorak J.: Short History of Civil Protection.<br />
Ministry of Interior, General Directorate of FRS of the<br />
Czech Republic, Prague 2003<br />
3. Kratochvilova, D.: Protection of Citizens, Society of<br />
Safe and Fire Engineering, Ostrava 2005<br />
4. Krulik O., Masek I., Mika O. J.: Phenomenon of Current<br />
Terrorism. Brno University of Technology, Faculty of<br />
Chemistry, Brno 2008
Chem. Listy, 102, s265–s1311 (2008) Environmental Chemistry & Technology<br />
P48 APPLICATION OF DGT METhOD FOR<br />
ASSESMENT OF AVAILAbILITy OF hEAVy<br />
METALS TO PLANTS<br />
Z. MLáDKOVá a , K. PEŠKOVá a,b , B. DOČEKAL b ,<br />
H. DOČEKALOVá a and P. ŠKARPA c<br />
a Department of Environmental Chemistry and Technology,<br />
Faculty of Chemistry, Brno University of Technology, Purkyňova<br />
118, 612 00 Brno, Czech Republic,<br />
b Institute of Analytical Chemistry, Czech Academy of Science,<br />
Veveří 97, 602 00 Brno, Czech Republic,<br />
c Mendel University of Agriculture and Forestry, Faculty of<br />
Agronomy, Zemědělská 1, 613 00 Brno, Czech Republic,<br />
mladkova@fch.vutbr.cz<br />
Introduction<br />
At present time problems of toxic metal contamination<br />
of soils are often solved. The form of metals present in the<br />
environment is an important factor affecting their bioavailability.<br />
Metals are often bound to various organic complexing<br />
ligands as humic substances, which influences their mobility.<br />
Therefore, studies of metal speciation are necessary for<br />
understanding how metals can move in nature systems.<br />
Leaching procedures are especially used for determination<br />
of toxic metals concentration in soils. Simple leaching<br />
procedures using aqua regia, ethylenediaminetetraacetic acid<br />
(EDTA), nitric acid or sodium nitrate are usually recommended<br />
and applied. However, leaching procedures give no<br />
information about the metal fraction which is really available<br />
for the root system of plants. Therefore, new approaches are<br />
still being searched to obtain a better characterization of bioavailable<br />
forms of metals and their transport in soils.<br />
Recently an in situ technique capable of quantitatively<br />
measuring labile metal species has been developed 1 . This<br />
technique, known as diffusive gradients in thin films (DGT),<br />
has been successfully used to measure the in situ concentrations<br />
of metals in natural waters, sediments and soils and has<br />
been shown to be a promising tool to assess metal phytoavailability<br />
in a wide range of soils. The technique is based<br />
on accumulation of solutes in a resin layer after passing through<br />
a well-defined diffusive gel layer. The mass of solutes<br />
accumulated in the resin during a period of deployment time<br />
is measured.<br />
The aim of this work was to assess the heavy metal<br />
uptake of radish and to test the capability of DGT to predict<br />
phytoavailability of the metals for this plant.<br />
Experimental<br />
S o i l T r e a t m e n t a n d L e a c h i n g<br />
P r o c e d u r e s<br />
Homogenized and sieved soil, which had been sampled<br />
in Zabcice site, was used in the experiment. Content of<br />
Cd and Cu extractable with nitric acid, acetic acid, EDTA,<br />
sodium nitrate and water was determined in the soil according<br />
to the recommendation of the Community of Bureau<br />
of Reference (BCR) 2 and Gupta 3 . Portion of 6 kg of the soil<br />
s428<br />
was weight into each of 40 pots. Soil portions in individual<br />
pots were spiked by adding solution of Cd and Cu, so that<br />
the concentration of the metal in the soil was increased by<br />
1 ppm Cd, 2 ppm Cd, 100 ppm Cu and 200 ppm Cu. The pots<br />
with non-spiked soil portions served as control samples. After<br />
3 months, leaching with the same agents was carried out<br />
with artificially contaminated samples.<br />
D G T E x p e r i m e n t<br />
The gels for DGT were prepared according to the conventional<br />
procedures (DGT Research, Ltd., Lancaster, UK) 4 .<br />
The DGT piston probes were deployed at 24 ± 1 °C in each<br />
soil sample in triplicate with the moisture content of 150 % of<br />
maximum water holding capacity MWHC for 24 hours. After<br />
elution of the resin gel with 1M HnO 3 , the accumulated mass<br />
of Cd or Cu was determinated.<br />
P o t E x p e r i m e n t<br />
Radish (Raphanus sativa) was sown both in the control<br />
and contaminated soils. Five plants of radish were grown in<br />
each of four pots with the same soil sample. Six weeks after<br />
sowing the radishes were harvested, rinsed with deionized<br />
water; the root divided into the white inner part and the<br />
red outer part and digested using the dry mode mineralizer<br />
(APIOn). Dry matter content in both parts was determined<br />
by drying samples in a oven at 105 °C.<br />
D e t e r m i n a t i o n o f M e t a l s<br />
Content of Cu and Cd was determined by electrothermal<br />
atomic absorption spectrometry (ETAAS) employing Perkin-<br />
Elmer Model 4110 Zeeman atomic absorption spectrometer.<br />
Recommended conditions were applied.<br />
Results<br />
Concentration of Cd and Cu found in soil samples by<br />
leaching with nanO 3 and water and in dry matter of radish<br />
edible parts are summarized in Tables I and II. The test sample<br />
was also characterized by other leaching agents. Content<br />
of elements in this soil related to nitric acid, acetic acid<br />
and EDTA leachate fractions was 49.1 ± <strong>2.</strong>8; 45.5 ± 1.9;<br />
11.8 ± 0.8 μg kg –1 Cd and 6.80 ± 0.50; 0.256 ± 0.051;<br />
3.10 ± 0.17 mg kg –1 Cu.<br />
The content of both metals is significantly higher in<br />
contaminated soils as intended. The results show that added<br />
metals are strongly bound to the soil matrix. The amount of<br />
extractable Cd and Cu with nanO 3 reaches only 10 % and<br />
even only 0.1 % of added metal, respectively. The concentrations<br />
found by means of DGT technique are within 1–2<br />
orders of magnitude lower than the concentrations in sodium<br />
nitrate leachates for both metals.<br />
The dry matter content was determined in both analyzed<br />
parts of radishes. The red outer part and the white inner part<br />
contained on average 11 % and 5 % of dry matter, respectively.<br />
Cd and Cu concentration in both parts of radish increases<br />
with increasing content of these metals in soils. The<br />
Cd and Cu uptake in red outer part of radish is higher than
Chem. Listy, 102, s265–s1311 (2008) Environmental Chemistry & Technology<br />
in white inner part. The fluctuation of individual results indicates<br />
higher biological variability among the plants grown in<br />
the experimental pots.<br />
Table I<br />
Cadmium content in soils and in dry matter of plant samples<br />
grown in these soils<br />
Leaching –<br />
nanO 3<br />
Concentration of Cd [μg kg –1 ]<br />
Control soil Cd 1 ppm soil Cd 2 ppm soil<br />
0.47 ± 0.10 46.7 ± 8.5 249 ± 32<br />
Leaching –<br />
water<br />
0.85 ± 0.10 1.89 ± 0.73 3.77 ± 0.51<br />
DGT unit 0.015 ± 0.003 1.54 ± 0.26 3.38 ± 0.96<br />
Radish –<br />
white part<br />
86.0 ± 20.0 2,430 ± 212 4,860 ± 1,230<br />
Radish –<br />
red part<br />
282 ± 67 3,543 ± 762 6,260 ± 1,420<br />
Conclusions<br />
Metal concentration (Cd, Cu) in radish depends on the<br />
concentration of the metal in soils in which the plants were<br />
grown. DGT technique can provide relevant information on<br />
accessible form of elements in the soil.<br />
Acknowledgement: This work was performed and supported<br />
within the Institutional research plan AV0Z40310501.<br />
s429<br />
Table II<br />
Copper content in soils and in dry matter of plant samples<br />
grown in these soils<br />
Concentration of Cd [μg kg –1 ]<br />
Control Cu 100 ppm Cu 200 ppm<br />
soil soil soil<br />
Leaching – 10.9 ± <strong>2.</strong>1 210 ± 11 202 ± 39<br />
nanO 3<br />
Leaching – 7.71 ± 0.40 75.9 ± 18.9 77.9 ± 6.3<br />
water<br />
DGT unit 0.191 ± 0.030 3.71 ± 0.19 4.96 ± 0.33<br />
Radish – 2,340 ± 440 7,220 ± 1,160 11,600 ± 4,600<br />
white part<br />
Radish – 3,520 ± 505 15,200 ± 1,830 42,800 ± 21,400<br />
red part<br />
REFEREnCES<br />
1. Davison W., Zhang H.: nature 367, 545 (1994).<br />
<strong>2.</strong> Ure A. M., Quevauviller P., Muntau H., Griepink B.: Int.<br />
J. Environ. Anal. Chem. 51, 135 (1993).<br />
3. Gusta S. K., Aten C.: Int. J. Environ. Anal. Chem. 51, 25<br />
(1993).<br />
4. DGT measurements in waters, soils and sediments; DGT<br />
Research Ltd., Lancaster, UK http://www.dgtresearch.<br />
com, (January 2008).
Chem. Listy, 102, s265–s1311 (2008) Environmental Chemistry & Technology<br />
P49 SPECTROPhOTOMETRIC<br />
MICRODETERMINATION OF PhOSPhATE<br />
bASED ON ThE ION ASSOCIATION COMPLEx<br />
wITh RhODAMINE b IN wATER<br />
MARTIn MOOS and LUMíR SOMMER<br />
Brno University of Technology,Chemistry and Technology of<br />
Environmental Protection, Purkyňova 118, 612 00 Brno,<br />
xcmoos@fch.vutbr.cz<br />
Introduction<br />
Phosphate may be a serious problem for the ecosystem 1,2<br />
since it is the main reason for the eutrophication of natural<br />
surface waters. In the presence of phosphate, a considerable<br />
growing of anabaena is observed which release toxins after<br />
their extinction. Moreover, the phosphates cause a considerably<br />
growing of water plants which consume the oxygen<br />
contents in water, and interfere with the aquatic life. The<br />
visual spectrophotometry 3,4 often based on the interaction of<br />
molybdatophosphate or molybdatovanadato-phosphate with<br />
some basic dyes is often used for its determination. 5–8 The<br />
formation of an ion associate with the sensitive Rhodamine B<br />
(Tetraethylrhodamine) was studied in detail in this paper.<br />
Experimental<br />
C h e m i c a l s<br />
All chemicals used were in analytical grade quality.<br />
0.01 mol dm –3 standard solution of phosphate was prepared<br />
from 0.3402 g KH 2 PO 4 (Lachema, Brno, Czech Republic)<br />
in 250 ml, previously dried 1h at 130 °C.<br />
0.3 mol dm –3 solution of sodium molybdate, (Lachema,<br />
Brno, Czech Republic) and 1 × 10 –3 mol dm –3 , solution of<br />
Rhodamine B (Tetraethylrhodamine), (Merck, Darmstadt,<br />
SRn) in milli Q water were stock solutions.<br />
Brij 35 (Aldrich, Steinheim, SRn), Triton X 100 (Calbiochem<br />
Co., San Diego, USA) and Polyvinylalcohol (PVA)<br />
(Sigma, Steinheim, SRn) surfactants were in 1 % wt. aqueous<br />
solutions.<br />
Astasol standard solutions with 1 g dm –3 of SiO 3 2- , Ca 2+ ,<br />
Al 3+ , Fe 3+ , K + , na + , Mg 2+ , As 3+ , Cl – , SO 4 2– , nH4 + , nO3 – ,<br />
nO 2 – (Analytika, Praha, ČR), were used for studying interferences.<br />
R e a l W a t e r s S a m p l e s<br />
Surface water from the River Sázava, mineral water<br />
Korunní, drinking water from the Brno water supply and sea<br />
water from the Mediterranean Sea were sampled. The water<br />
samples were filtered by using membrane filter with pore size<br />
0.45 µm.<br />
I n s t r u m e n t<br />
Spectrophotometer Spectronic UnICAM UV 500<br />
(Spectronic Unicam, UK, Cambridge).<br />
s430<br />
C a l i b r a t i o n p l o t s a n d l i m i t s o f<br />
d e t e c t i o n<br />
All linear calibration plots were evaluated according<br />
to the standard ČSn ISO 8466-1 10 characterizing necessary<br />
statistical characteristics for evaluation of linear calibration<br />
plots (variation range homogeneity test and linearity test).<br />
The detection limits were expressed according to Graham<br />
9 , Miller 11 and to IUPAC 13 .<br />
The method of continuous variation 12 was used for the<br />
evaluation of the mol ratio of components.<br />
Results<br />
The sequence of mixing components has an important<br />
effect for the sensitivity and reproducibility of the<br />
method. The maximal absorbance was reached for the following<br />
order of mixied components: phosphate → nonionic<br />
surfactant → sodium molybdate → sulphuric acid →<br />
Rhodamine B. The absorbance of the ternary species of<br />
12–molybdatophosphate with Rhodamine B reaches its<br />
maximum value for 8.3 × 10 –5 mol dm –3 Rhodamine B and<br />
0.03 mol dm –3 sodium molybdate after 20 min. at 572 nm.<br />
The higher concentrations of both components are responsible<br />
for the absorbance decreases.<br />
E f f e c t o f A c i d i t y<br />
In the following range 0.1–3.0 mol dm –3 , the absorbance<br />
considerably decreased with the increasing concentration of<br />
sulphuric acid. 1 mol dm –3 of H 2 SO 4 was optimal for obtaining<br />
stable absorbance of the associate in time. Hydrochloric<br />
acid has a similar effect but 1.5 mol dm –3 was used for further<br />
measurements.<br />
E f f e c t o f s u r f a c t a n t s<br />
Three non-ionic surfactants were used, Brij 35, Triton<br />
X 100 and PVA respectively, from which 0.01 % wt.<br />
of Brij 35 was optimal. In the presence of Triton X 100 the<br />
adsorption of the ion associate on glass surface was observed.<br />
PVA 30,000–70,000 mol. weight does not prevent turbidity<br />
in solution.<br />
C a l i b r a t i o n P l o t s a n d D e t e c t i o n<br />
l i m i t s ( L O D )<br />
The strictly linear calibration plots were evaluated for six<br />
concentration levels between1 × 10 –6 –7 × 10 –6 mol dm –3 . The<br />
points were measured in triplicate for the optimal conditions<br />
1 mol dm –3 sulphuric acid, 0.01 % wt. Brij 35, 0.03 mol dm –3<br />
sodium molybdate and 8.3 × 10 –5 mol dm –3 Rhodamine B for<br />
the evaluation were used.<br />
e f f e c t o f i o n s<br />
1,000 : 1 Mg 2+ , K + , na + , nH 4 + , nO3 – , SO4 2– , Cl – , HCO3 –<br />
did not interfere the determination of 1 × 10 –6 mol dm –3<br />
H 2 PO 4 and 100 : 1 Al 3+ , Fe 2+ , Ca 2+ . As (III, V) and nO 2 –<br />
interfered above concentrations only which are not present<br />
in natural waters. The SiO 3 2– was successfully masked with<br />
6.7 × 10 –4 mol dm –3 tartaric acid.
Chem. Listy, 102, s265–s1311 (2008) Environmental Chemistry & Technology<br />
Table I<br />
Calculated values from calibration plots<br />
T h e S t o i c h i o m e t r y o f t h e T e r n a r y<br />
S p e c i e s o f 1 2 - M o l y b d a t o p h o s p h a t e<br />
w i t h R h o d a m i n e B<br />
The molar ratio of components in the ion associate<br />
was expressed from the method of continuous variations1<strong>2.</strong><br />
n<br />
y = 0.1421x + 0.0104 R 2 = 0.9987<br />
X Δ α a 0.40 × 10 –6 mol dm –3 1.24 × 10 –5 g dm –3<br />
X Δ β a 1.18 × 10 –6 mol dm –3 3.66 × 10 –5 g dm –3<br />
X m b 0.79 × 10 –6 mol dm –3 <strong>2.</strong>44 × 10 –5 g dm –3<br />
X 3σ c 0.83 × 10 –6 mol dm –3 <strong>2.</strong>56 × 10 –5 g dm –3<br />
ε σ d 142123 ± 3767 mol –1 cm –1 dm 3<br />
x<br />
1− x<br />
max<br />
= .The resulting value of n was n = = 1<br />
max<br />
0,<br />
5<br />
1−<br />
0,<br />
5<br />
Fig. 1. The point 0 on the jobs curve corresponds with the<br />
maximal concentration of the Rhodamine b and zero concentration<br />
of phosphate, the point 1 with the maximal concentration<br />
of phosphate and zero concentration of Rhodamine b. points<br />
belong to the total absorbance of solution, points belong to the<br />
Rhodamine b blank<br />
This molar ratio corresponds with the ratio between phosphate<br />
and Rhodamine B as 1 : 1. Which describes the composition<br />
of the ion associate such as H 2 P[Mo 3 O 10 ] 4 – . RhB + in<br />
1 mol dm –3 H 2 SO 4 .<br />
A p p l i c a t i o n s F o r t h e R e a l S a m p l e s<br />
o f W a t e r<br />
For all kinds of water, the method of standard additions<br />
in six concentration levels which are 1, 2, 4, 6,<br />
7 × 10 –6 mol dm –3 was used. The concentration of phosphate<br />
was found 0.1 ± 0.02 mg dm –3 triplicate the values in the<br />
.<br />
s431<br />
Fig. <strong>2.</strong> The supposed structure of the ion associate<br />
river water and 0.16 ± 0.007 mg dm –3 phosphate in the drinking<br />
water. The determination could not be carried out by<br />
this approach for mineral water because of increased contents<br />
of silicate in solution. The optimal concentration of<br />
6.7 × 10 –4 mol dm –3 tartaric acid is not effective for masking<br />
but the necessary higher concentration of tartaric acid would<br />
interfere with the determination of phosphate. The concentration<br />
of phosphate in the analyzed sea water was under the<br />
detection limit and the method of standard addition can not<br />
be used.<br />
REFEREnCES<br />
1. Klein G., Perera P.: Eutrophication and health. WHO<br />
and EC, Luxembourg 200<strong>2.</strong><br />
<strong>2.</strong> Pitter P.: Hydrochemie. VŠCHT, Praha 1999.<br />
3. Marczenko Z.: Separation and spectrophotometric<br />
deter-mination of elements. Ellis-Horwood, Chichester<br />
1986.<br />
4. Malát M.: Absorpční anorganická fotometrie. Academia,<br />
Praha 1973.<br />
5. Xiao L. H., Jia Z. Z.: Anal. Chim. Acta 55, 580 (2006).<br />
6. Sommer L., Doležal J.: Scripta fac. Sci. nat. Univ. Purk.<br />
Brun 19, 159 (1989).<br />
7. Kratochvíla J., Sommer L.: Scripta Fac. Sci. nat. Univ.<br />
Purk. Brun 10, 53 (1980).<br />
8. Kartikeyan S., Rao T. P., Iyer C. S. P., Damodaran A. D.:<br />
Microchimica Acta 71, 113 (1994).<br />
9. Graham R. C.: Data Analysis for the Chemical Science.<br />
VCH Publisher, new York 1993.<br />
10. ČSn ISO 8466-1: Kalibrace a hodnocení analytických<br />
metod a určení jejich charakteristik -Část 1: Statistické<br />
hodnocení lineární kalibrační funkce (březen 1994).<br />
11. Miller J. n., Miller J. C.: Statistics and Chemometrics<br />
for Analytical Chemistry. Pearson Education Limited,<br />
new York 2005.<br />
1<strong>2.</strong> Sommer L., Hniličková M.: Bull. Soc. Chim. France<br />
1959, 36.<br />
13. MacDougall D.: Anal. Chem. 52, 2242 (1980).
Chem. Listy, 102, s265–s1311 (2008) Environmental Chemistry & Technology<br />
P50 DETERMINATION OF uRANIuM by ICP-<br />
AES IN ThE AbSENCE AND PRESENCE OF<br />
PRECONCENTRATION ON MACROPOROuS<br />
SORbENTS<br />
MARTIn MOOS, KRISTýnA URBánKOVá and LUMíR<br />
SOMMER<br />
Brno University of Technology,Chemistry and Technology of<br />
Environmental Protection, Purkyňova 118, 612 00 Brno,<br />
xcmoos@fch.vutbr.cz<br />
Introduction<br />
Determination of uranium at very low concentrations<br />
often needs preconcentration in order to meet the detection<br />
limit of a given analytical method. Matrix interferences are<br />
another problem when using AAS and ICP-AES. The preconcentration<br />
by solid phase extraction is simple, rapid and usually<br />
help to eliminate interferences from the matrix elements.<br />
Several sorbents were used for preconcentration and separation<br />
of trace uranium (VI) 1 , among them the macroporous<br />
Amberlite XAD resins 2,3 , silica 4,5 , active carbon 6 and polyurethane<br />
foam 7 which can be loaded with completing reagents.<br />
The modified Amberlite XAD 4 resin in various particle size<br />
was studied for the sorption of uranium in this paper prior to<br />
the final determination by ICP-AES 1–3 .<br />
Experimental<br />
C h e m i c a l s<br />
All chemicals used were of analytical grade quality.<br />
1 g dm –3 standard solution of uranium (VI) Astasol<br />
(Analytika, Praha, Czech Republic)<br />
0.5 g dm –3 solution of 4-(2-pyridylazo)resorcinol (PAR)<br />
from, Lachema, Brno, Czech Republic, the ammonium salt<br />
of pyrrollidincarbodithioate (APDC) from, Lachema, Brno,<br />
Czech Republic, 8-hydroxyquinoline-5-sulphonic acid (8-<br />
HQS) from Aldrich, Steinheim, Germany and 1,2-dihydroxybenzene<br />
(PYR) from Lachema, Brno, Czech Republic in<br />
distilled water were stock solutions.<br />
Cationic surfactants 1-ethoxycarbonylpentadecyl-trimethylammonium<br />
bromide (Septonex ® ) from Tamda, Oloumouc,<br />
Czech Republic, benzyldimethyltetradecyl-ammonium<br />
chloride (Zephyramin ® ) from Merck, Darmstadt, Germany<br />
and benzyldimethyldodecyl-ammonium bromide (Ajatin®)<br />
from Fluka, Buchs, Switzerland were in 0.1 mol dm –3<br />
aqueous solutions.<br />
The macropourous sorbent Amberlite ® XAD 4 (Fluka,<br />
Buchs, Switzerland) was previously dried 24 h at 100 °C,<br />
milled and sieved; the fraction 0.32–0.63 µm was used and<br />
ctivated in methanol for 24 hours. 200 mg of activated sorbent<br />
was filled into empty cartridges. The columns were finally<br />
washed by 10 ml of acetone and 10 ml of distilled water.<br />
Solutions for the sorption or the eluent were aspirated<br />
through the sorbent-filled plastic cartridges using the vacuum<br />
pump operated vacuum suction device Dorcus (Tessek,<br />
Praha, Czech Republic). A peristaltic pump UnIPAM 315<br />
(Scientific instrument, Warszawa, Poland) was attached with<br />
s432<br />
3 mm wide silicon tubing to the cartridges and operated at a<br />
solution flow rate of 1 ml min –1 .<br />
I n s t r u m e n t<br />
An echelle-based ICP-spectrometer with a prism predisperser<br />
IRIS AP (Thermo Jarell Ash, U.S.A.) containing<br />
a CID detector with 512 × 512 pixels for 195–900 nm, axial<br />
plasma discharge and echelle grating with 54.4 lines mm –1<br />
was used. The plasma source was a generator with 27.12 MHz<br />
with the power output of 1.35 kW. The plasma argon flow rate<br />
was 12 dm 3 min –1 . The integration time was 30 s. The results<br />
were the average of 3 measurements. Spectral lines (nm) in<br />
high orders: U 385.958 and U 409.014 nm were tested for<br />
the determination and the spectral line 385.958 was used for<br />
future measurement.<br />
C a l i b r a t i o n P l o t s a n d L i m i t s o f<br />
D e t e c t i o n<br />
All linear calibration plots were evaluated according to<br />
the ČSn ISO 8466-1 standard including the variation range<br />
homogeneity test and linearity test 8 . The confidence limits of<br />
the plot are also expressed.<br />
The recovery was calculated by the expression<br />
c(<br />
U )<br />
R =<br />
eluted ⋅<br />
c(<br />
U ) applied onto the column<br />
where f is the enrichment factor.<br />
The detection limit was expressed according to Graham<br />
9 , Miller 10 from the calibration plots and to IUPAC 11<br />
from 10 points of the blank.<br />
Results<br />
D e t e r m i n a t i o n o f U r a n i u m b y<br />
I C P - A E S i n t h e A b s e n c e o f<br />
P r e c o n c e n t r a t i o n<br />
Some determination in geological samples was earlier<br />
described 12 . A 10% signal decrease was observed for<br />
0.75 mol dm –3 HnO 3 , but for 1 mol dm –3 HCl the decrease<br />
reaches 20 %. In the presence of various 3 × 10 –3 mol dm –3<br />
surfactants, Brij 35, Zephyramine, Ajatin and dodecylsuphate<br />
the 5–15 % increase of the calibration slope was observed.<br />
Similarly, the slope of calibration plots increased by 5 % in<br />
the presence of 6 × 10 –5 mol dm –3 PAR, 9 × 10 –5 mol dm –3<br />
APDC or <strong>2.</strong>2 × 10 –5 mol dm –3 8-HQS. (cf. Table I)<br />
C a l i b r a t i o n p l o t s a n d e f f e c t o f<br />
i n t e r f e r i n g i o n s<br />
The strictly linear calibration plots were evaluated<br />
for seven concentration levels between 0.1 mg dm –3 –<br />
50 mg dm –3 . The points were measured in triplicate. The detection<br />
limits were X ∆ α = 1.26 mg dm –3 , X∆ β = 3.69 mg dm –3<br />
according to Graham, X ∆ m = 1.13 mg dm –3 according to Miller<br />
and 0.30 mg dm –3 according to IUPAC.<br />
For 1–3 mg dm –3 U, no interference were observed for<br />
100 : 1 nO 3 – , Cl – , SO4 2– , SiO3 2– , nH4 + , na + , K + , Ca 2+ , Mg 2+ ,<br />
f<br />
(1)
Chem. Listy, 102, s265–s1311 (2008) Environmental Chemistry & Technology<br />
Table I<br />
The regression equation for different selected systems<br />
U (VI) Solution regression equation<br />
Basic a y = 4.48x + 1.29<br />
Septonex b y = 4.49x + 0.23<br />
Dodecylsulphate c y = 5.37x + 1.08<br />
0.75 mol dm –3 HnO3 y = 4.04x + <strong>2.</strong>18<br />
1 mol dm –3 HCl y = 3.75x + 3.18<br />
PAR d y = 4.95x + 1.32<br />
APDC e y = 4.83x + 0.43<br />
a calibration plots for 1 mg dm –3 –15 mg dm –3 U without orga-<br />
nic reagents ;<br />
b 3 × 10 –3 mol dm –3 Septonex;<br />
c 3 × 10⁻³ mol dm –3 sodium dodecylsulphate;<br />
d 2 × 10 –5 mol dm –3 PAR;<br />
e 3 × 10 –5 mol dm –3 APDCin solution<br />
Al 3+ . The 10 : 1 excess of multicomponent standards containing<br />
Br – , Cl – , Br – , SO 4 2– , PO4 3– or Cd 2+ , Co 2+ , Cr 3+ , Cu 2+ ,<br />
Mn 2+ , Pb 2+ , V 5+ and Zn 2+ (each of metal ion) in the absence<br />
or presence of Y 3+ internal standard (1 mg dm –3 ) did not<br />
interfere. 10 : 1 excess of Fe 3+ interferes strongly by the 50%<br />
signal decrease in the presence of Y 3+ .<br />
D e t e r m i n a t i o n o f U r a n i u m b y I C P -<br />
A E S A f t e r t h e P r e c o n c e n t r a t i o n o n<br />
M o d i f i e d A m b e r l i t e X A D 4<br />
Prior to the sorption, the column was conditioned by<br />
10 ml of 5 × 10 –3 mol dm –3 Septonex whose pH was adjusted<br />
by hydrochloric acid and sodium hydroxide. This procedure<br />
was always used for the sorption.<br />
E f f e c t o f S u r f a c t a n t s a n d O r g a n i c<br />
R e a g e n t s<br />
The retention efficiency of 3 mg dm –3 U from 50 ml<br />
volume with the optimal pH 9 without surfactants and organic<br />
reagents was 56 % only. The elution of uranium from the<br />
column was carried out with 10 ml acetone and 1 mol dm –3<br />
nitric HnO3 (1 : 1). The various surfactants were used such<br />
as non-ionic Brij 35, cationic Septonex or Zephyramine<br />
and anionic dodecyl sulphate respectively, from which<br />
5 × 10 –3 mol dm –3 of Septonex was optimal for conditioning<br />
and allowed the recovery of 96 % U. The recovery with<br />
dodecylsulphate was 81 % U. Brij 35 produced a foam in the<br />
column and Zephyramine did not prevent turbidity during<br />
evaporation, when HnO3 was used for elution.<br />
Moreover the sorption of 1.5–15 mg dm –3 of U was<br />
quantitative by using 6 × 10 –5 mol dm –3 PAR and 9 × 10⁻⁵<br />
– 1.8 × 10 –4 mol dm –3 APDC which corresponds with the 5 or<br />
10 fold excess of reagent and the recovery nearly 100 % was<br />
obtained in the presence of 1.3 × 10 –4 mol dm –3 8-HQS and<br />
1.4 × 10 –4 mol dm –3 PYR. Thus, 6 × 10 –5 mol dm –3 of PAR was<br />
recommended for following preconcentration.<br />
s433<br />
Fig. 1. Effect of organic reagents. pH = 5; pH = 7;<br />
pH = 9; a 6 × 10 –5 mol dm –3 PAR, b 1.2 × 10 –4 mol dm –3 PAR,<br />
c 9 × 10 –5 mol dm –3 APDC, d 1.8 × 10 –4 mol dm –3 APDC,<br />
e 6.7 × 10 –5 mol dm –3 8-hQS, f 1.3 × 10 –4 mol dm –3 8-hQS,<br />
g 1.4 × 10 –4 mol dm –3 PyR; h <strong>2.</strong>7 × 10 –4 mol dm –3 PyR, 3 mg dm –3 u<br />
was sorbed after conditioning the sorbent with 5 × 10 –3 mol dm –3<br />
Septonex solution<br />
E f f e c t o f p H<br />
The influence of pH on the sorption follows from Table II.<br />
The sorption was quantitative in the interval of pH 7–9.<br />
Table II<br />
Effect of pH on the sorption a<br />
pH recovery [%]<br />
9 100.0 ± 3.6<br />
8 99.5 ± 3.7<br />
7 100.6 ± <strong>2.</strong>4<br />
6 89.6 ± 4.8<br />
5 88.6 ± 5.3<br />
4 8<strong>2.</strong>7 ± 0.9<br />
a From 50 ml of sample with 3 mg dm –3 U, in the presence<br />
of 6 × 10 –5 mol dm –3 PAR and after conditioning the sorbent<br />
with 5 × 10 –3 mol dm –3 Septonex solution. The sorption was<br />
carried out in triplicate<br />
E f f e c t o f E l u e n t s<br />
For the quantitative elution of the complex of uranium<br />
(VI) with the used reagents, acetone, ethanol and methanol<br />
in different ratio with 1 mol dm –3 nitric acid were tested. The<br />
most effective eluent with 100% recovery of U was 10 ml of<br />
1 : 1 acetone and 1 mol dm –3 nitric acid or the 1 : 1 mixture of<br />
acetone and 4 mol dm –3 HnO 3 mixtures. The best eluents are<br />
compared in Table III.<br />
Conclusions<br />
The sorbent XAD-4 in the presence of 4-(2pyridylazo)resorcinol<br />
or pyrrollidincarbodithioate was<br />
observed for the separation and preconcentration of Uranium<br />
(VI) at pH 9. The column of Amberlite XAD 4 of<br />
particle size 0.32–0.63 µm was washed with 10 ml of acetone<br />
and 10 ml of distilled water, and conditioned with
Chem. Listy, 102, s265–s1311 (2008) Environmental Chemistry & Technology<br />
Table III<br />
The recovery with different eluents<br />
Elution reagent Recovery of U [%] a<br />
Ethanol-HnO 3 [1 mol dm –3 ] 92 ± 5<br />
Aceton-HnO 3 [1 mol dm –3 ] 100 ± 3<br />
Methanol-HnO 3 [1 mol dm –3 ] 94 ± 2<br />
a eluted with 10 ml of eluent in triplicate<br />
5 × 10 –3 mol dm –3 Septonex solution. The sample solution<br />
containing 1.5–15 mg dm –3 U with 6 × 10 -5 mol dm –3 of PAR<br />
was applied on the column with 1 ml min –1 . The column<br />
was then washed with 15 ml of distilled water and uranium<br />
eluted with a mixture of acetone : 1 mol dm –3 HnO 3 (1 : 1) .<br />
The organic solvent was removed by evaporation under an IR<br />
lamp to 2 ml in a suitable Teflon ® dish. The residue was then<br />
diluted to 10 ml by distilled water and analyzed by ICP-AES.<br />
(cf. Table IV)<br />
REFEREnCES<br />
1. Rao T. P., Metilda P., Gladis J. M.: Talanta 68, 1064<br />
(2006).<br />
<strong>2.</strong> Ramesh A., Mohan K. R., Seshaiah K.: Talanta 57, 243<br />
(2002).<br />
3. Singh B. n., Maiti B.: Talanta 69, 393 (2006).<br />
4. Leepipatpiboon V.: J. Chromatography A 697, 137<br />
(1995).<br />
5. Ueda K., Koshino Y., Yamamoto Y.: Anal. Lett. 18, 2345<br />
(1985).<br />
6. Okamota Y., Murata T., Kumamaru T.: Anal. Sci. 7, 879<br />
(1991).<br />
s434<br />
Table IV<br />
The efficiency for uranium (VI) in the presence of org. reagent<br />
at pH 9 on Amberlite XAD 4<br />
Org. reagent Uranium (VI)<br />
1.5 mg dm –3 3 mg dm –3 15 mg dm –3<br />
PAR a 1.53 ± 0.02 <strong>2.</strong>99 ± 0.05 14.75 ± 0.12<br />
APDC b 1.65 ± 0.09 3.05 ± 0.05 15.69 ± 0.15<br />
APDC c 1.43 ± 0.07 3.01 ± 0.05 14.48 ± 0.69<br />
a 6 × 10 –5 mol dm –3 PAR,<br />
b 9 × 10 –5 mol dm –3 APDC,<br />
c 1.8 × 10 –4 mol dm –3 APDC,<br />
d The sorbent conditioned with 5 × 10 –3 mol dm –3 Septonex<br />
and the sorption carried out in triplicate<br />
7. Ferreira S. L. C.: Spec. Chim. Acta Part B 62, 4 (2007).<br />
8. ČSn ISO 8466-1: Kalibrace a hodnocení analytických<br />
metod a určení jejich charakteristik -Část 1: Statistické<br />
hodnocení lineární kalibrační funkce (březen 1994).<br />
9. Graham R. C.: Data Analysis for the Chemical Science.<br />
A Guide to Statistical Techniques, VCH Publisher, new<br />
York 1993.<br />
10. Miller J.n., Miller J. C.: Statistics and Chemometrics for<br />
Analytical Chemistry. Pearson Education Limited, new<br />
York 2005.<br />
11. MacDougall D., Crummett W.B.: Anal. Chem. 52, 2242<br />
(1980).<br />
1<strong>2.</strong> Kanický V., Abu-Ajamieh Y., Awadat A. W.: Scripta Fac.<br />
nat. Univ. Masaryk. Brun. 25, 21 (1995).
Chem. Listy, 102, s265–s1311 (2008) Environmental Chemistry & Technology<br />
P51 SIMuLTANEOuS SPECIATION OF SELENIuM<br />
AND MERCuRy IN <strong>ENVIRONMENTAL</strong><br />
SAMPLES by uSING A COLuMN SwITChING<br />
SySTEM wITh LIQuID ChROMATOGRAPhy<br />
COuPLED TO ICP-MS<br />
F. MOREnO, T. GARCíA-BARRERA and J. L. GóMEZ-<br />
ARIZA<br />
Departamento de Química y Ciencia de los Materiales “Prof.<br />
J. C. Vílchez Martín”. Facultad de Ciencias Experimentales.<br />
Universidad de Huelva, Campus de El Carmen. 21007<br />
Huelva (Spain),<br />
fernando.moreno@dqcm.uhu.es<br />
Introduction<br />
Mercury is a very toxic element which damages the central<br />
nervous system, endocrine system, kidneys, and other<br />
organs. Exposure over long periods of time or heavy exposure<br />
to mercury vapour can result in brain damage and ultimately<br />
death. Mercury and its compounds can produce serious birth<br />
defects.Compounds of mercury tend to be much more toxic<br />
than the element itself. 1–3<br />
On the other hand selenium is an essential micronutrient<br />
for animals with biological functions as cofactor. However<br />
it is toxic in large doses. Selenium deficiency can lead to<br />
Keshan and Kashin-Beck diseases. If it is taken in excess it<br />
can lead to seleniosis. In addition, several studies have suggested<br />
a link between cancer and selenium deficiency 4 .<br />
It has been issued that Se-methionine inhibits some neurotoxic<br />
effects of methylmercury. 5–7<br />
For this reason, the development of new analytical strategies<br />
for multielemental speciation is a primordial issue.<br />
In the present study, a new method for the detection<br />
of Se- and Hg- species has been developed, including chiral<br />
species.<br />
Experimental<br />
I n s t r u m e n t a t i o n<br />
The HPLC system is an Agilent 1100 series. The<br />
columns used were a Phenomenex Bondclone C18,<br />
300 mm × 3.90 mm, 10 μm; and an Astec Chirobiotic T<br />
column, 250 mm × 4.6 mm.<br />
An inductively coupled plasma mass spectrometer<br />
Model HP 4500 (Hewlett Packard, Yokogawa, Analytical<br />
System, Tokyo, Japan) equipped with a Babington nebuliser<br />
was used in this study.<br />
R e a g e n t s a n d S t a n d a r d s<br />
All reagents were of analytical reagent grade. Deionized<br />
water (18 MΩ cm –1 ) was obtained from a Milli-Q water<br />
purification system (Millipore, UK). 2-mercaptoethanol 98%<br />
was purchased from Sigma–Aldrich (Steinheim, Germany)<br />
and tetraethylammonium chloride from Fluka (Switzerland).<br />
Ammonium acetate and nitric acid were obtained from Merck<br />
(Darmstadt, Germany).<br />
s435<br />
Stock standard solutions of 1,000 mg Se dm –3 were<br />
prepared in deionized water from selenocystine (SeCys 2 ,<br />
Sigma), seleno-DL-methionine (Se-DL-Met, Sigma), seleno-<br />
L-methionine (Se-L-Met, Sigma), selenomethylselenocysteine<br />
(SeMeSeCys, Sigma), selenocystamine (SeCA, Sigma),<br />
sodium selenate (na 2 SeO 4 ) and sodium selenite (na 2 SeO 3 ).<br />
Methylmercury chloride stock standard solution was<br />
prepared at 1,000 mg Hg dm –3 by dissolving methylmercury<br />
chloride (Merck (Darmstadt, Germany) into 2% HnO 3 .<br />
Mercury chloride stock standard solution was prepared as<br />
1,000 mg Hg dm –3 solution by dissolving mercury chloride<br />
(Merck (Darmstadt, Germany) into 10% HnO 3 .<br />
P r o c e d u r e<br />
A 0.075% tetraethylammonium chloride water solution<br />
at pH 4.5 (mobile phase A) and a 5% (v/v) methanol-water<br />
solution containing 0.06 mol dm –3 ammonium acetate and<br />
0.1% (v/v) 2-mercaptoethanol (mobile phase B) were used as<br />
the mobile phases for HPLC. The flow rate was 1 ml min –1 and<br />
the sample injection volume was 100 μl. The columns were<br />
connected using three valves to build a column swithching<br />
system and species were on-line detected by ICP-MS. The<br />
columns outlets were connected directily to the nebulizer of<br />
the ICP-MS system.<br />
Elemental detection was performed using a model 4500<br />
ICP-MS system. The plasma and auxiliary argon flow rates<br />
were 15 and 1 dm 3 min -1 , respectively. The nebulizer gas flow<br />
rate was 1.28 dm 3 min -1 . The forward RF power was fixed at<br />
1,266 W. The dwell time was 3 seconds per isotope and 77 Se,<br />
82 Se and 202 Hg were monitored.<br />
Table I<br />
HPLC conditions<br />
Time Mobile phase Columns<br />
0–5.1 A RP<br />
5.1–6.15 A RP + Chiral<br />
6.15–8.3 A RP<br />
8.3–13.3 A RP + Chiral<br />
13.3–25 B RP<br />
RP = Phenomenex Bondclone C18 column,<br />
300 mm × 3.90 mm, 10 μm<br />
Chiral = Astec Chirobiotic T column, 250 mm × 4.6 mm,<br />
In our study of selenium and mercury speciation have<br />
been successfully separated six selenium compounds and<br />
two major mercury compounds in biological samples using<br />
a reversed-phase column. The chiral species of selenium was<br />
later separated with the second column.<br />
After the injection in the loop, all species go into the<br />
reversed phase column and later directly to the ICP-MS,<br />
using the mobile phase A. With this program, SeCM, SeCys,<br />
SeMeSeCys and Se (IV) elute before 5.1 minutes. At 5.1<br />
minutes we active the second column, and D-selenomethionine<br />
and L-selenomethionine go throught the chiral column.<br />
After that, at 6.15 minutes we switch off the chiral column,
Chem. Listy, 102, s265–s1311 (2008) Environmental Chemistry & Technology<br />
then Se (VI) go out from reversed phase column to the ICP-<br />
MS. At 8.3 minutes we switch on the chiral column again<br />
going out D-Selenomethionine and L-Selenomethionine.<br />
At this moment, MeHg and inorganic mercury are still<br />
inside the reversed phase column and to get their separation,<br />
at 13.3 minutes we disconnect the chiral column again and<br />
the mobile phase B is pumped. With this change we get the<br />
elution of MeHg and inorganic mercury.<br />
Results<br />
Fig. 1. illustrates the chromatograms obtained with the<br />
method proposed and the Table II show the species detected,<br />
their retention times, detection limits and linear range. The<br />
detection limits vary between 0.3 and 9.7 ng depending<br />
of the species. The Relative Standard Deviation (% RSD) for<br />
the retention time is below 1 % for all species and for peak<br />
area is below 19 % for all species.<br />
Fig. 1. Chromatogram obtained by the proposed method for<br />
77 Se, 82 Se and 202 hg isotopes<br />
Conclusions<br />
This work reports for the first time an analytical methodology<br />
for the chromatographic separation of mercury and<br />
selenium species including chiral ones.<br />
The methodology proposed for the simultaneous speciation<br />
allows a deeper insight into the interaction between Se<br />
and Hg-species which is a key question due to the beneficious<br />
effect of Se-species into Hg toxicity.<br />
s436<br />
Table II<br />
Retention times, detection limits and linear range of the<br />
species<br />
Retention Detection Linear<br />
Peak Species time limit range<br />
[s] [ng] [ppb]<br />
1 Se-cystamine 16<strong>2.</strong>2 6.24 6<strong>2.</strong>4–1,000<br />
2 Se-cystine 189.2 4.03 40.2–500<br />
3<br />
Se-methylselenocysteine<br />
243.3 7.78 77.8–1,000<br />
4 Se (IV) 279.3 7.26 7<strong>2.</strong>6–1,000<br />
5 Se (VI) 420.8 6.63 66.3–1,000<br />
6 Se-L-methionine 717.3 9.67 96.7–1,000<br />
7 Se-D-methionine 75<strong>2.</strong>4 4.78 47.8–1,000<br />
8 Peak due to mobile phase change<br />
9 Methylmercury 1,265.1 4.40 44.0–10,000<br />
10 Inorganic mercury 1,344.4 0.30 3–10,000<br />
The developed methodology allows high sample throughput<br />
and low sample consumption that is highly important<br />
for the application to food and biological samples.<br />
This method don’t has memory effect in the system.<br />
REFEREnCES<br />
1. Devi M., Fingerman M.: B Environ. Contam. Tox. 55,<br />
746 (1995).<br />
<strong>2.</strong> Drevnick P. E., Roberts A. P., Otter, R. R., Hammerschmidt<br />
C. R., Klaper, R., Oris, T.: Comp. Biochem.<br />
Phys. C 147, 331 (2008).<br />
3. Zahir F., Rizwi S. J., Haq S. K., Khan R. H.: Environ. Toxicol.<br />
Phar. 20, 351 (2005).<br />
4. Whanger P. D.: J. nutr. 119, 1236 (1989).<br />
5. Weber D. n., Connaughton V. P., Dellinger J. A., Klemer<br />
D., Udvadia A., Carvan III M. J.: Physiol. Behav. 93,<br />
250 (2008).<br />
6. Dos Santos A. P. M., Mateus M. L., Carvalho C. M. L.,<br />
Batoréu M. C. C.: Toxicol. Lett. 169, 121 (2007).<br />
7. Wen-Xiong W., Wong R. S. K., Wang J., Yu-fong Y.:<br />
Aquat. Toxicol. 68, 39 (2004).
Chem. Listy, 102, s265–s1311 (2008) Environmental Chemistry & Technology<br />
P53 VOLATILE ORGANIC SubSTANCES PRESENT<br />
IN SPICES AND SPRuCE NEEDLES<br />
LUDMILA MRAVCOVá, MILADA VáVROVá, JOSEF<br />
ČáSLAVSKý, MICHAELA STOUPALOVá, ILOnA<br />
HLAVáČKOVá and HAnA VíTEČKOVá<br />
Brno University of Technology, Faculty of Chemistry, Purkyňova<br />
118, 612 00 Brno,<br />
mravcova@fch.vutbr.cz<br />
Introduction<br />
Essential oils are volatile lipophilic substances, usually<br />
colorless. Most often, essential oils consist of terpenes,<br />
namely monoterpenic hydrocarbons, aldehydes, alcohols,<br />
ketones, acids, esters. Their content substances are usually<br />
classified as isoprenoids and phenylpropanoids groups 1 . Their<br />
characteristic scent is conditioned by terpenic compounds, in<br />
general 2 .<br />
The TLC (thin layer chromatography) method can be<br />
used for the identification of essential oil present in spice 1 .<br />
This method is simple, without need of sofisticated and<br />
expensive instrumentation. Defined amount of the analysed<br />
mixture is applied on the starting line of a plate covered by<br />
a thin layer of sorbent (stationary phase). Chromatographic<br />
plate is then placed into the developing chamber with mobile<br />
phase, which rises slowly and evenly through the thin layer,<br />
transporting the individual components of the analyzed mixture<br />
by various speed. Dried thin layer with perceptible stains<br />
of particular compounds of the mixture situated in different<br />
distances from the start – represents TLC chromatogram. The<br />
identification of compounds is performed either via comparison<br />
of their migration distances with standards, or by<br />
comparison of their R F values with those obtained from the<br />
literature 3 .<br />
Another option to identify essential oils is application<br />
of SPME (Solid phase microextraction) in connection with<br />
GC/MS. Solid phase microextraction is simple and efficient<br />
sorptive – desorptive technique used for solventless isolation/<br />
preconcentration of target analytes from the sample matrix 4 .<br />
In the field, this procedure could be also used as passive sampling<br />
method. During this procedure, analytes are sorbed by<br />
thin layer of stationary phase placed on the SPME fiber. The<br />
SPME process continues until the equilibrium in the system<br />
is reached. In physical-chemical terms, the SPME technique<br />
state of equilibrium depends on the analyte properties and on<br />
the type and thickness of polymer covering the silica fiber 4 .<br />
Experimental<br />
For the identification of essential oils present in spice<br />
(caraway, cardamom, pepper, sweet pepper, calamint, cinna-<br />
mon and muscat), two methods were used 5 :<br />
•<br />
•<br />
TLC<br />
SPME, GC/MS<br />
s437<br />
T L C<br />
Spice essential oils isolation proceeded in the following<br />
manner. Spice samples were extracted by ethanol for<br />
10 minutes. After that, the extract was filtered and the spice<br />
was reextracted twice for 20 minutes by petroleum ether.<br />
Extracts were concentrated on the vacuum rotary vaporizer<br />
to the defined volume.<br />
By means of micropippete, concentrated extracts were<br />
applied on the chromatographic plate (Alugram Sil G). The<br />
distance of applied stains was between 0.5–1 cm, the volume<br />
of applied sample was always 10 μl and 20 μl. Ethanol and<br />
petroleum ether extracts I and II were applied on plates.<br />
Plates were developed in a closed chromatographic<br />
chamber, which was filled with a developing agent – mobile<br />
phase formed by the mixture of toluene and ethyl acetate<br />
(ratio 93 : 7). Developing was ascensive and was let in progress<br />
until the mobile phase reached the distance of 1 cm<br />
from the top of the plate. Plates were let to dry and then they<br />
were sprayed by developer for the purpose of visualization of<br />
stains created by separated substances. The used developer<br />
consisted of ethanol and sulphuric acid (ratio 95 : 5), which<br />
was mixed in 1 : 1 ratio with one-percent solution of vanillin<br />
in ethanol. After the chemical detection, plates were dried<br />
again in the drier at the temperature of 105 °C for 5 minutes.<br />
Identification of vizualized stains was performed via comparison<br />
of experimental R F values with those published in the<br />
literature 6 .<br />
S P M E – G C / M S<br />
Weighted amounts of individual spices (1 g) were put<br />
into vials. Substances from spice were sorbed from the headspace<br />
by SPME fiber at the temperature of 40 °C. The compounds<br />
were then directly injected into the gas chromatograph.<br />
The SPME fiber used was 65 μm polydimethylsiloxan/<br />
divinylbenzene (PDMS/DVB) from Supelco. Gas chromatograph<br />
with mass spectrometric detector was Agilent 6890n<br />
GC/5973 MSD. The HP-5MS column (Agilent Technologies,<br />
USA), 30 m × 0.25 mm × 0.25 μm was used, the injector temperature<br />
was 270 °C, oven program was: 45 °C, 2 min, 5 °C<br />
to 200 °C, hold 2 min. He at a flow of 1 ml min –1 (constant<br />
flow mode) was used as a carrier gas, transferline temperature<br />
was 250 °C, ion source temperature was 230 °C, quadrupole<br />
temperature was set to 150 °C. Direct interface connection<br />
was applied, electron ionization at 70 eV was employed.<br />
Results<br />
TLC chromatograms evaluation was performed in<br />
accordance with requirements of the Pharmaceutical Codex 6<br />
, which is valid for phytopharmaca and recomends TLC as<br />
an optimum screening method. R F values were calculated<br />
for each of detected stains. This factor was also used for the<br />
identification. Besides the retention factor, also the colours of<br />
the stains were compared. For example, the comparison of all<br />
sweet pepper extracts shows Table I. In column “Identified<br />
Compound”, unambiguously identified content substance
Chem. Listy, 102, s265–s1311 (2008) Environmental Chemistry & Technology<br />
is presented in bold; where no compliance existed, “n.i.” is<br />
stated, which stands for “not identified”. Concerning results,<br />
it is evident that not all the content substances were present<br />
in all extracts. Mostly, they were detected in the ethanolic<br />
extract and in the first petroleum extract and their presence in<br />
these two extracts was influenced by the chemical nature of<br />
these substances.<br />
Table I<br />
Identification of volatile compounds in sweet pepper<br />
extracts<br />
RF Ethanol RF Petroleum RF Petroleum Identified<br />
ether I ether II compound<br />
– 0.17 – pinene<br />
0.23 0.22 – cymene<br />
0.28 – – terpinene<br />
0.38 0.41 0.39 n.i.<br />
0.52 0.65 0.67 n.i.<br />
0.69 0.68 – n.i.<br />
0.93 – – n.i.<br />
0.96 – – n.i.<br />
0.99 – – n.i.<br />
As the second method of essential oils components<br />
analysis, SPME in connection with GC/MS was used. The<br />
method was optimalized and measurements were performed<br />
under conditions mentioned above. Also by this method, not<br />
the concentration of substances, but their identification was<br />
the matter of concern. In contrast to TLC, the isolation/preconcentration<br />
of target compounds was performed via headspace<br />
method. To confirm the presence of a given substance<br />
nIST spectral library search was used. The Fig. 1. shows<br />
chromatogram of sweet pepper spice. In Table II is a summary<br />
of substances identified via spectral library search in<br />
this spice.<br />
Fig. 1. Chromatogram of sweet pepper<br />
By comparison of Tables I and II it is obvious, that more<br />
single volatile substances and their isomers can be recognised<br />
s438<br />
Table II<br />
Retention times and identification of compounds present in<br />
sweet pepper<br />
Peak number Retention Time Identification<br />
1. 7.97 α-pinene<br />
<strong>2.</strong> 9.24 β-pinene<br />
3. 9.71 β-myrcene<br />
4. 10.09 α-felandrene<br />
5. 10.26 3-karene<br />
6. 10.46 α-terpinene<br />
7. 10.71 p-cymene<br />
8. 10.84 limonene<br />
9. 11.76 γ-terpinene<br />
10. 1<strong>2.</strong>66 4-karene<br />
by means of SPME in connection with GC/MS. Similar comparison<br />
could be made at all spices used.<br />
Conclusion<br />
Analytical separation-based methods were used for the<br />
identification of content substances present in essential oils of<br />
seven spice species. Following results were obtained:<br />
The isolation of essential oils content substances can be<br />
performed by the means of either appropriate solvent<br />
extraction, or passive sampling via SPME.<br />
Screening chromatography method on the thin layer<br />
(TLC) is appropriate for the quick identification of content<br />
substances in essential oils. This method is also<br />
recommended by the Pharmaceutical Codex6 •<br />
•<br />
.<br />
• Decisive GC/MS method enabled the identification of<br />
more content substances, including some isomers, at all<br />
spice and herbal tea samples analysed.<br />
This work was supported by the Ministry of Education<br />
of the Czech Republic under research project MSM 621<br />
71242<strong>2.</strong><br />
REFEREnCES<br />
1. Marsili, R.: Techniques for Analyzing Food Aroma. CRC<br />
1996.<br />
<strong>2.</strong> Podlech, D.: Kapesní atlas léčivé rostliny, Slovart<br />
2007.<br />
3. Wager, H., Bladt, S., Zgainski, E. M.: Plant drug analysis.<br />
Springer – Verlag 1984.<br />
4. Pawliszyn, J.: Solid Phase Microextraction: Theory and<br />
Practice. Wiley-VCH 1997.<br />
5. Sides, S., Robards, K., Helliwell, S.: Trend.Anal.Chem.,<br />
19, 322 (2000).<br />
6. Český farmaceutický kodex. X-EGEM 1993.
Chem. Listy, 102, s265–s1311 (2008) Environmental Chemistry & Technology<br />
P54 ChANGES IN CAROTENOIDS PATTERN IN<br />
MOugeOTiA sP. ALGAE INDuCED by hIGh<br />
LIGhT STRESS<br />
eDWARD MUnTEAn, VICTOR BERCEA, nICOLETA<br />
MUnTEAn and nICOLAE DRAGOş<br />
University of Agricultural Sciences and Veterinary Medicine<br />
Cluj-Napoca, 3–5 Calea Mănăştur, 400372 Cluj-Napoca,<br />
Romania,<br />
edimuntean@yahoo.com<br />
Introduction<br />
When exposure to light exceeds a maximum that can be<br />
used productively by the photosynthesys, a violaxanthin deepoxidation<br />
leads to antheraxanthin and finally to zeaxanthin,<br />
the excessive energy being then dissipated as heat 1 . At lower<br />
irradiance, zeaxanthin is re-epoxidated back to violaxanthin<br />
by zeaxanthin-epoxidase (Fig. 1.).<br />
Fig. 1. The xanthophyll cycle<br />
This reversible interconversion of zeaxanthin and violaxanthin<br />
via antheraxanthin was called xanthophyll cycle or<br />
violaxanthin cycle, being initially studied in higher plants 6,7 ;<br />
further researches established that it has a photoprotective<br />
role, removing the excess excitation energy from the photosynthetic<br />
antennae 1–4 , protecting in this way photosynthetic<br />
organisms from dammage by excessive light. The aim of this<br />
research was to establish the way in which the carotenoid<br />
biosynthesis is influenced by high light stress in the green<br />
algae Mougeotia sp. Agardt.<br />
Experimental<br />
The carotenoid standards were kindly provided by F.<br />
Hoffmann – La Roche, Basel, Switzerland. All solvents were<br />
HPLC grade purity (ROMIL Chemicals). The green algae<br />
Mougeotia sp. Agardt (AICB 560) originated from the collection<br />
of the Institute of Biological Researches Cluj-napoca;<br />
it was grown in a Bold nutritive solution mixed by introducing<br />
air containing 5 % CO 2 , under continuous illumination<br />
(300 µmol m –2 s –1 , measured with a Hansatech Quantum Sensor<br />
QSPAR), at an average temperature of 20 °C for 15 days.<br />
Extraction and high performance liquid chromatography analysis<br />
(HPLC) were conducted according to a previous published<br />
procedure 5 . Separations were performed on an Agilent<br />
1100 system, using a nucleosil 120-5 C 18 column and the<br />
s439<br />
following mobile phases: A – acetonitrile : water (9 : 1) and<br />
B – ethyl acetate. The flow rate was 1 ml min –1 . and the solvent<br />
gradient was as follows: from 0 to 20 min. – 10 % to 70 % B,<br />
then from 20 to 30 min. – 70 % to 10 % B.Carotenoids identification<br />
was completed based on HPLC co-chromatography<br />
with authentic carotenoid standards.<br />
Results<br />
The HPLC chromatogram from Fig. <strong>2.</strong>a reveals the<br />
carotenoid pattern for the saponified extract of Mougeotia sp.<br />
control sample, dominated by two major carotenoids: lutein<br />
and β-carotene. Besides, four xanthophylls (violaxanthin,<br />
lutein, zeaxanthin and 5,6-epoxy-β-carotene) and four carotenes<br />
(α-carotene, β-carotene, 9Z-β-carotene and 15Z-β-carotene)<br />
were also identified.<br />
When the Mougeotia culture was exposed to a high light<br />
irradiation (4,500 µmol m –2 s –1 ), the content of antheraxanthin<br />
increased strongly as a result of de-epoxidation (Fig. <strong>2.</strong>b,<br />
Table I), the carotenoid pattern being dominated by lutein and<br />
antheraxanthin, while among minor carotenoids 5,6-epoxyβ-carotene<br />
moved out and zeaxanthin appeared.<br />
Table I<br />
The carotenoid concentrations of target carotenoids [μg ml –1<br />
algal suspension]<br />
Control Irradiation Recovery after<br />
Carotenoids sample with 4,500 irradiation<br />
[μmol m –2 s –1 ]<br />
Violaxanthin 0.02 0.01 0.10<br />
Antheraxanthin 0.10 0.60 0.05<br />
Lutein 1.00 0.56 0.37<br />
Zeaxanthin 0.00 0.05 0.02<br />
5,6-epoxy-β-carotene 0.04 0.00 0.03<br />
α-carotene 0.04 0.01 0.02<br />
β-carotene 0.19 0.03 0.10<br />
9Z – β-carotene 0.04 0.01 0.02<br />
15Z – β-carotene 0.01 traces 0.01<br />
The whole carotenoid pattern was affected by the light<br />
stress (Fig. <strong>2.</strong>a and <strong>2.</strong>b), not only the xanthophylls involved<br />
in the xanthophyll cycle. Chromatograms emphasize another<br />
important aspect in the studied matrix: the xanthophyll cycle<br />
converts violaxanthin mainly in antheraxanthin, not in zeaxanthin;<br />
this finding agrees with results reported for Mantoniella<br />
squamata 3 , where they were attributed as consequences for<br />
the mechanism of enhanced non-photochemical energy dissipation.<br />
The recovery after the light stress leads to a reversible<br />
epoxidation to violaxanthin, revealed by the chromatogram<br />
from Fig. <strong>2.</strong>c, the final higher violaxanthin level being correlated<br />
with a strong decrease in antheraxanthin concentration<br />
(Fig. <strong>2.</strong>c, Table I), while the new chromatographic pattern is<br />
dominated by four major carotenoids: lutein, β-carotene, violaxanthin<br />
and 5,6-epoxy-β-carotene.
Chem. Listy, 102, s265–s1311 (2008) Environmental Chemistry & Technology<br />
Fig. <strong>2.</strong> hPLC chromatograms of carotenoids from the Mougeotia<br />
sp. samples: a – control sample; b – illumination with<br />
4,500 μmol m –2 s –1 ; c – recovery after illumination. Peak identities<br />
are: 1: violaxanthin, 2: antheraxanthin, 3: lutein, 4: zeaxanthin,<br />
5: 5,6-epoxy-β-carotene, 6: α-carotene, 7: β-carotene, 8: 9Z<br />
– β-carotene, 9: 15Z – β-carotene<br />
a<br />
b<br />
c<br />
s440<br />
Conclusions<br />
The obtained data reveals the way in which the carotenoid<br />
pattern is affected by high light stress in the analyzed<br />
algal strain, as well as the way this reacts during the recovery<br />
stage.<br />
They proved that the xanthophyll cycle’s regulatory<br />
mechanism is functional in Mougeotia sp. algae, leading to<br />
an almost complete interconversion of violaxanthin to antheraxanthin<br />
and zeaxanthin. However, its contribution to nonphotochemical<br />
quenching is not as significant as in higher<br />
plants; the small amounts of zeaxanthin recorded during<br />
experiments suggesting that this strain posses another dissipation<br />
mechanism(s) which operates together with xanthophyll<br />
cycle.<br />
Hence, HPLC analysis revealed a particular behavior of<br />
Mougeotia spp. algae under intense illumination: the major<br />
de-epoxidation product of violaxanthin is not zeaxanthin, but<br />
antheraxanthin. More than that, the high light stress affects<br />
the whole carotenoid biosynthesis, starting with the violaxanthin<br />
cycle’s precursor: β-carotene.<br />
This work has been supported by 2-CEx06-11-54/ 2006<br />
research grant.<br />
REFEREnCES<br />
1. Darko E., Schoefs B., Lemoine Y.: J. Chromatogr. A.<br />
876, 111 (2000).<br />
<strong>2.</strong> Demmig-Adams B.: Trends Plant Sci. 1, 21 (1996).<br />
3. Goss R., Böhme K., Wilhelm C.: Planta 205, 613<br />
(1998).<br />
4. Masojídekl J., Kopeckýl J., Koblížek M., Torzillo G.:<br />
Plant Biol. 6, 342 (2004).<br />
5. Muntean E., Bercea V.: Studia Universitatis Babeş-<br />
Bolyai, Physica, L, 4b, 668 (2005).<br />
6. Sapozhnikov D. I., Krasnovskaya T. A., Mayevskaya<br />
A. n.: Dok.Acad.nauk.SSSR, 113, 465 (1957).<br />
7. Yamamoto H., nakayama O. M., Chichester C. O.:<br />
Arch. Biochem.Biophy. 97, 168 (1962).
Chem. Listy, 102, s265–s1311 (2008) Environmental Chemistry & Technology<br />
P55 SIMuLTANEOuS ION ChROMATOGRAPhIC<br />
DETERMINATION OF ANIONS AND CATIONS<br />
IN SuRFACE wATERS FROM FIZES VALLEy<br />
eDWARD MUnTEAn, TAnIA MIHăIESCU, nICOLETA<br />
MUnTEAn and RADU MIHăIESCU<br />
University of Agricultural Sciences and Veterinary Medicine<br />
Cluj-Napoca, 3–5 Calea Mănăştur, 400372 – Cluj-Napoca,<br />
Romania,<br />
edimuntean@yahoo.com<br />
Introduction<br />
Water Framework Directive 11 demands a concerted<br />
approach in order to achieve a good ecological state for all<br />
water bodies across Europe. The objectives agreed must be<br />
coordinated beyond the level of individual survey areas and<br />
consolidated for the river basin district as a whole.<br />
Fizes catchement, part of Somes catchement tributary of<br />
Tisa watershed, is located in Transylvania Plain, in the northern<br />
part of Romania. A distinctive feature of this area is<br />
the presence of ponds, mainly used for fishery. The major<br />
pollution sources are represented by sediments (generated by<br />
erosional processes and transported in the water bodies) and<br />
diffuse pollution sources (originated from agricultural activities<br />
and the improper septic systems of the localities). Fizes<br />
catchement, through its features of relatively low antropic<br />
pressures and with little structural changes, represents a natural<br />
laboratory for designing and implementing programs of<br />
restorations of watersheds in agricultural landscapes.<br />
In such a context, chemical analysis is usually employed<br />
to identify the aquatic system characteristics including the<br />
assessment of inputs, distribution of various chemical species<br />
and characterization the outputs generated by the physical,<br />
chemical and biological processes developed within the<br />
water bodies. Among the specific chemical indicators, the<br />
inorganic species hold an important place, determining largely<br />
the behavior and evolution of the aquatic system.<br />
The new analytical techniques, generated by the advent<br />
of ion chromatography (IC) deliver a more precise measurement<br />
of the various inorganic species present in the water<br />
body. IC is a high-performance ion-exchange chromatography<br />
technique for the separation and quantification of lowmolecular-weight<br />
ions 1–8 , being in use since 1975, from the<br />
time of the development of the eluent suppressor 6 . Because<br />
of its high accuracy and reliability, IC is nowadays the one<br />
of the most powerful tool for analysis of environmental samples<br />
1,5 , becoming an important technique for the determination<br />
of ionic species for monitoring water quality. This technique<br />
was used for the system of fishing ponds, streams and<br />
ground waters from Fizes Valley watershed (Fig. 1.), which<br />
was studied in order to assess the effects of antropic pollution<br />
through leaching of fertilizers from soils and waste waters<br />
from the villages within its catchement.<br />
An IC method with conductivity detection was developed,<br />
enabling the simultaneous determination of six cations<br />
(Li + , na + , K + , nH 4 + , Mg 2+ and Ca 2+ ) and seven anions (F – ,<br />
s441<br />
Cl – , Br – , nO 2 – , nO3 – , PO4 3– and SO4 2– ) in a single run, saving<br />
thus analytical time, sample pre-treatment and reagents.<br />
Fig. 1. Fizes catchement river network map, with sampling<br />
points’ locations<br />
Experimental<br />
Chemicals for mobile phases’ preparation were of analytical<br />
grade: 4-hidroxybenzoic acid (Acros Organics), lithium<br />
hydroxide (Scharlau) and nitric acid (Merck). Ultrapure water<br />
with a specific resistance of 18.2 MΩ cm –1 was utilized for<br />
preparation of mobile phases as well as for sample dilution,<br />
being obtained from a Direct Q 3UV Smart (Millipore). All<br />
solutions were stored in polyethylene bottles which had been<br />
thoroughly rinsed with ultrapure water. Mobile phases were<br />
filtered through a 0.45 μm membrane (Millipore), and then<br />
degassed using an Elmasonic S30 H ultrasonic bath before<br />
use. Standard working calibration solutions were prepared<br />
from a “six cation standard-II” (Dionex Corporation) and<br />
from “seven cation standard-II” (Dionex Corporation). The<br />
external standard method was used for quantification.<br />
Water samples were collected from seven sources<br />
located in Fizes watershed; samples were passed through a<br />
0.45 μm membrane filter (Millipore), and then were stored<br />
for 24 hours at 4 °C in 0.5 dm 3 polyethylene containers 9,10 ,<br />
each sample was analyzed in triplicates. The samples with<br />
ion concentrations exceeding the calibration range were<br />
diluted accordingly and re-analyzed.<br />
Analyses were performed on a Shimadzu system, consisting<br />
from: a Proeminence DGU 20As online degasser, a<br />
Proeminence LC-20AP solvent delivery module, an automatic<br />
sample injector SIL-10AF, a conductivity detector CDD-<br />
10Avp, a Proeminence CTO-20A column oven, a FCV-10AH 2<br />
valve unit, an Allsep Anion 7u column (150 × 4.6 mm), an<br />
Universal Cation 7u (100 × 4.6 mm) and a Proeminence<br />
CBM-20A system controller in a configuration which is<br />
represented schematically in Fig. <strong>2.</strong> Instrument control, data<br />
acquisition and data analysis were accomplished by a computer<br />
running “LCsolution” ver.1.<strong>2.</strong> software.<br />
300 µl samples were injected in each case; using a temperature<br />
of 40 °C, a total separation of 23 min. was effective<br />
for a good resolution for all seven anions from the mixed
Chem. Listy, 102, s265–s1311 (2008) Environmental Chemistry & Technology<br />
Fig. <strong>2.</strong> Schematic representation of the IC system configuration<br />
used for simultaneous analysis of cations and anions<br />
standard solution (fluoride, chloride, nitrite, bromide, nitrate,<br />
phosphate and sulphate – Fig. 3.) and for all six cations<br />
(lithium, sodium, ammonium, potassium, magnesium and<br />
calcium – Fig. 4.), all peaks being baseline separated.<br />
Fig. 3. Separation for a standard mixture of anions (Allsep<br />
Anion 7u column, using as mobile phase a 4-hidroxybenzoic acid<br />
4mM solution with ph-ul adjusted to 7.5 with LiOh 0.1M, the<br />
flow rate being 0.85 ml min –1 )<br />
Fig. 4. Separation for a standard mixture of cations (universal<br />
Cation 7u column, using as mobile phase a 3 mM hNO3 solution,<br />
the flow rate being 0.5 ml min –1 )<br />
A LGC certified reference material (LGC6020, SPS<br />
ww2) was used for validation.<br />
Results<br />
Calibrations were achieved using five levels of concentration,<br />
for accurately determine the concentration of target<br />
ions. The calibration curves show a good linearity with<br />
R > 0.99 as indicated in Table I, Figs. 5. and 6.<br />
s442<br />
Table I<br />
Results of regression analysis for calibrations<br />
Anion<br />
Linearity<br />
range [ppm]<br />
Regression equation R<br />
F – 4.02–20.10 C = 0.000130278A + 0.83973 0.9978<br />
Cl – 20.40–10<strong>2.</strong>00 C = 0.000117938A – 0.523926 0.9997<br />
nO 2– 20.20–101.00 C = 0.000156194A + 0.11461 0.9997<br />
Br – 20.00–100.00 C = 0.000230581A + 1.34467 0.9995<br />
nO 3– 20.00–100.00 C = 0.000214872A + 0.28929 0.9999<br />
PO 4 3– 40.00–200.00 C = 0.00023591A – 0.68846 0.9994<br />
SO 4 2– 9.94–79.52 C = 0.0001677A – 1.1364 0.9994<br />
Li + 0.99–4.99 C = 0.00000262A – 0.7806 0.9993<br />
na + 4.06–20.30 C = 0.000015644A – <strong>2.</strong>12366 0.9997<br />
nH 4 + 10.30–50.60 C = 0.000015822A + 1.04561 0.9999<br />
K + 5.02–25.10 C = 0.000000898A + 0.62187 0.9997<br />
Ca 2+ 5.04–25.20 C = 0.000000475A + 0.41618 0.9998<br />
Mg 2+ 10.18–50.90 C = 0.000011512A + 1.09553 0.9998<br />
Fig. 5. Calibrations for the reported anions
Chem. Listy, 102, s265–s1311 (2008) Environmental Chemistry & Technology<br />
Fig. 6. Calibrations for the reported cations<br />
s443<br />
From the 13 quantifiable ions, only eight were found<br />
in the analyzed water samples: na + , K + , nH 4 + , Mg 2+ , Ca 2+ ,<br />
Cl – , nO 3 – , PO4 3– and SO4 2– , within a concentration range of<br />
6.64 ppm (for K + ) to 346.27 ppm (for SO 4 2– ). Calibrations for<br />
these ions are presented in figures 5 and 6.<br />
Table II provides information on the anion concentration<br />
while Table III reveals the cation concentration from the<br />
investigated surface waters.<br />
Table III<br />
The anions’ concentrations in the studied water sources (mean<br />
values ± SD)<br />
Location Cl– [ppm] nO 3 – [ppm] SO4 2– [ppm]<br />
Draw well near<br />
Tăul Popii lake<br />
66.99 ± 3.29 79.97 ± 3.97 343.28 ± 17.14<br />
Spring near<br />
Tăul Popii lake<br />
27.53 ± 1.39 – 141.17 ± 7.03<br />
Cătina lake 66.54 ± 3.37 25.63 ± 1.21 346.27 ± 17.31<br />
Geaca lake 57.21 ± <strong>2.</strong>81 23.69 ± 1.15 264.03 ± 13.29<br />
Ţaga lake 94.11 ± 4.70 23.02 ± 0.93 279.85 ± 13.85<br />
ştiucii lake 60.28 ± <strong>2.</strong>96 – 63.69 ± <strong>2.</strong>91<br />
Fizeş river 191.53 ± 9.46 – 254.32 ± 1<strong>2.</strong>62<br />
The higher nitrate concentration in the draw well is<br />
due to the fact that a relatively high nitrate concentration is<br />
a general characteristic for underground water resources in<br />
Fizes catchement; this catchement has substantial diffusion<br />
pollution sources originated by manure and animal breeding.<br />
The chloride concentration ranges from 27.53 ppm (in<br />
a spring located near Tăul Popii lake) to 191.53 ppm (Fizes<br />
river), possible to explain due to the geological substrate of<br />
the area, salt being present as outcrops in the lower part of the<br />
catchement. The sulfate concentration was high in all samples,<br />
ranging from 63.69 ppm (in Stiucii lake) to 347.26 ppm<br />
(in Cătina lake).<br />
All the concentration values are consistent with the<br />
general geological composition of the area. Slightly different<br />
values measured in different points of water surface sampling<br />
points in the same collector (Fizes valley) stream could be<br />
explained as consequence of normal variation due to different<br />
water contact duration among the watershed, during precipitation<br />
events.<br />
Conclusions<br />
This research revealed the state of the water quality<br />
and also clarified some aspects related to the process of self<br />
purifications of the water system in the considered area. The<br />
upstream ponds retain most of the sediment and pollutants<br />
through mechanisms of sedimentation and self-purification,<br />
most of the pollution sources being also located in the upper<br />
part of the catchement.<br />
Data gathered will serve as beneficial experience for<br />
future rehabilitation measures. Using the proposed IC configuration,<br />
the laboratory productivity increases much, as there<br />
is no longer necessary to prepare two sample sets – one for
Chem. Listy, 102, s265–s1311 (2008) Environmental Chemistry & Technology<br />
Table III<br />
The cations’ concentrations in the studied water sources (mean values ± SD)<br />
Location na + [ppm] nH 4 – [ppm] K + [ppm] Mg 2+ [ppm] Ca 2+ [ppm]<br />
Draw well near<br />
Tăul Popii lake<br />
121.60 ± 6.03 15.28 ± 0.73 20.96 ± 1.03 108.05 ± 5.33 76.17 ± 3.80<br />
Spring near<br />
Tăul Popii lake<br />
25.93 ± 1.26 1<strong>2.</strong>02 ± 0.51 6.64 ± 0.30 69.27 ± 3.42 65.43 ± 3.25<br />
Cătina lake 168.31 ± 8.41 1<strong>2.</strong>31 ± 0.44 15.54 ± 0.72 156.96 ± 7.79 76.27 ± 3.73<br />
Geaca lake 158.05 ± 7.84 14.62 ± 0.70 17.52 ± 0.86 151.21 ± 7.53 71.25 ± 3.48<br />
Ţaga lake 103.47 ± 5.15 13.03 ± 0.63 19.15 ± 0.94 104.22 ± 5.19 54.07 ± <strong>2.</strong>65<br />
ştiucii lake 28.79 ± 1.40 1<strong>2.</strong>65 ± 0.59 18.43 ± 0.90 18.80 ± 0.93 9.10 ± 0.41<br />
Fizeş river 275.94 ± 13.78 11.11 ± 0.36 15.52 ± 0.74 14<strong>2.</strong>90 ± 7.17 74.97 ± 3.74<br />
anion analysis, the other for cation analysis. With one injection,<br />
the autosampler introduces the sample in both analysis<br />
channels.The method has potential to be used in water quality<br />
surveys in the purpose of correlating diffuse pollution inputs<br />
with changes in water quality. Specific self purification processes<br />
can also be operatively estimated.<br />
REFEREnCES<br />
1. Cickarik D., Dersek-Timotic I., Onjia A., Rajakovic I.: J.<br />
Serb. Chem. Soc. 70, 995, (2005).<br />
<strong>2.</strong> Gjerde D. T., Fritz J. S., Schmuckler G.: J. Chromatogr.<br />
187, 35 (1980).<br />
3. Gjerde D. T., Fritz J. S.: Ion Chromatography. Hüthig,<br />
Heidelberg, 2000.<br />
4. Helaleh M. I. H., Al-Omair A., Tanaka K., Mori M.:<br />
Acta Chromatogr. 15, 247, (2005).<br />
s444<br />
5. Shpigun O. A., Zolotov Y: A. Ion Chromatography in<br />
Water Analysis. West Sussex, England, Ellis Horwood<br />
Ltd., 1988.<br />
6. Small H., Stevens T. S., Bauman W. C.: Anal. Chem. 47,<br />
1801 (1975).<br />
7. Smith F. C., Chang R. C.: The practice of ion-chromatography.<br />
Wiley, 1984.<br />
8. Weiss J.: Ion Chromatography, VCH, Weinheim, 1995.<br />
9. ISO 5667-1: 1980: Water quality – sampling, part 1: guidance<br />
on the design of sampling programmes.<br />
10. ISO 5667-2: 1991: Water quality – sampling – part 2:<br />
guidance on sampling techniques.<br />
11. Directive 2000/60/EC of the European Parliament and<br />
of the Council of 23.11.2000 establishing a framework<br />
for Community action in the field of water policy.
Chem. Listy, 102, s265–s1311 (2008) Environmental Chemistry & Technology<br />
P56 STRATEGIES TO REDuCE DETECTION<br />
LIMITS IN ThE ANALySIS OF bROMINATED<br />
FLAME RETARDANTS IN <strong>ENVIRONMENTAL</strong><br />
SAMPLES<br />
MICHAELA náPRAVníKOVá, JAnA PULKRABOVá,<br />
PETRA HRáDKOVá, JAKUB SCHůREK, JAn<br />
POUSTKA and JAnA HAJŠLOVá<br />
Institute of Chemical Technology, Prague, Department of<br />
Food Chemistry and Analysis, Technická 3, 166 28 Prague 6,<br />
Czech Republic,<br />
michaela.napravnikova@vscht.cz<br />
Introduction<br />
Polybrominated diphenyl ethers (PBDEs) represent<br />
an important class of brominated flame retardants (BFRs)<br />
which are widely used in various consumer products such as<br />
electronic equipment, textiles and plastics 1 . These chemicals<br />
are highly persistent and bioaccumulative what leads to their<br />
ubiquitous occurrence in the environment 2 , both in abiotic<br />
and biotic matrices.<br />
Compared to major group of organohalogenated persistent<br />
organic pollutants (POPs) such as polychlorinated biphenyls<br />
(PCBs), the levels of PBDEs in respective environmental<br />
compartments are typically lower by one order of magnitude.<br />
On this account, low detection limits (LODs) are needed for<br />
their reliable control.<br />
Gas chromatography coupled to mass spectrometry<br />
(GC/MS) operated in either electron ionization mode (EI)<br />
or in negative chemical ionization (nCI) are commonly<br />
employed analytical procedures of determination these compounds<br />
3 . In nCI mode monitoring of abundant bromine ions<br />
(m/z 79 and 81) provides a more sensitive and selective option<br />
compared to EI. nowadays, comprehensive two-dimensional<br />
(orthogonal) gas chromatography coupled to time-of-flight<br />
mass spectrometry (GC × GC/TOFMS) has become another<br />
challenging alternative to analyze very complex PBDEs mixtures<br />
4 .<br />
In any case, achieving low LODs is also associated with<br />
the amount of sample introduced into GC system. The most<br />
commonly used GC injection technique for PBDEs is a splitless<br />
injection mode 3 , however, several studies were reported<br />
a possibility to employ a large-volume programmed-temperature<br />
vaporizer injection (PTV) in the determination of these<br />
compounds 5 .<br />
This paper presents the method performance characteristics<br />
obtained in several GC systems used for quantification<br />
of PBDEs.<br />
Experimental<br />
For our experiments a standard mixture of most common<br />
PBDE congeners (BDEs no. 28, 47, 49, 66, 85, 99, 100, 153,<br />
154 and 183) purchased from AccuStandard inc. (USA) was<br />
used. The real-life sample containing trace amount of PBDEs<br />
was a purified extract obtained from fish tissue by procedure<br />
s445<br />
described by Hajšlová et al. 6 . To assess LODs achievable<br />
under various GC conditions following set-up were tested:<br />
• PTV-GC/MS (EI),<br />
• PTV-GC/MS (nCI),<br />
• GC/TOFMS (EI),<br />
• PTV-GC/TOFMS (EI).<br />
P T V - G C / M S ( E I ) a n d P T V - G C / M S<br />
( n C I )<br />
GC/MS analyses were performed on an Agilent 6890n<br />
gas chromatograph coupled to a mass selective detector<br />
(Agilent 5975XL Inert MSD) equipped with quadrupole<br />
analyzer operated in nCI or EI mode using splitless or PTV<br />
injection. The GC conditions were as follows: a DB-XLB<br />
capillary column (15 m × 250 μm i.d. × 0.1 μm, J&W Scientific);<br />
a oven temperature program: from 105 °C (held for<br />
vent time) to 260 °C (held for 1 min) at 50 °C min −1 then to<br />
300 °C at 20 °C min –1 and held for 3 min; carrier gas: helium<br />
with constant flow 1.5 ml min −1 . The MS was operating in the<br />
selected ion monitoring (SIM) mode (monitored ions were<br />
m/z 79, 81, 159, 161 and m/z 406, 484, 564, 484, 562 for<br />
nCI and EI mode, respectively). The MS (nCI) parameters<br />
were as follows: reagent gas: methane; temperatures of MSD<br />
interface, ion source, and quadrupole: 280 °C, 150 °C, and<br />
150 °C, respectively. The temperatures of MSD interface,<br />
ion source and, quadrupole for MS (EI) system were 280 °C,<br />
230 °C and, 150 °C, respectively.<br />
Four parameters for PTV injection were tested: vent<br />
time (VT), vent flow (VF), injection volume (IV) and splitless<br />
period. Starting injection temperature was 50 °C (held<br />
4.6 min) and it was ramped to 350 °C at 500 °C min –1 .<br />
G C / T O F M S a n d P T V - G C / T O F M S<br />
The analyses were performed on a Pegasus 4D instrument<br />
(Leco, USA) consisting of an Agilent 6890n gas chromatograph<br />
equipped with splitless and/or PTV injector and<br />
a Leco Pegasus III high-speed time-of-flight mass spectrometer.<br />
The same, DB-XLB capillary column was used for<br />
determination of analytes. The GC conditions were similar<br />
to PTV–GC/MS system. The interface temperature was<br />
280 °C. The MS acquisition rate was 11 Hz, the mass range<br />
35–850 amu, the ion-source temperature 300 °C, and the detector<br />
potential –1875 V.<br />
Results<br />
In the first part of this study, the implementation and optimalization<br />
of a PTV injection coupled with GC/MS (EI and/<br />
or nCI mode) was realized. A solvent standard solution of<br />
above mentioned PBDE congeners was used for optimalization<br />
PTV injection conditions. Optimal parameters assessed<br />
by the comparison of a peak height of individual analytes<br />
were as follows:<br />
•<br />
•<br />
vent time: 90 s<br />
vent flow: 60 ml min –1
Chem. Listy, 102, s265–s1311 (2008) Environmental Chemistry & Technology<br />
Table I<br />
LODs of individual PBDE congeners [ng ml –1 isooctane] for the GC/MS techniques tested<br />
•<br />
•<br />
GC/MS (EI) GC/MS (nCI)<br />
Analyte PTV–GC/MS (EI) PTV–GC/MS GC/TOFMS (EI) PTV–GC/TOFMS<br />
(splitless) (splitless) (nCI)<br />
BDE 28 1.0 0.05 0.1 0.01 <strong>2.</strong>3 0.3<br />
BDE 47 1.0 0.1 0.1 0.01 3.1 0.6<br />
BDE 49 1.0 0.1 0.1 0.01 <strong>2.</strong>5 0.4<br />
BDE 66 1.0 0.1 0.1 0.01 3.7 0.6<br />
BDE 85 <strong>2.</strong>0 0.2 0.3 0.01 1.3 0.7<br />
BDE 99 1.5 0.1 0.3 0.01 3.0 0.4<br />
BDE 100 1.5 0.1 0.1 0.01 0.6 0.6<br />
BDE 153 5.0 0.1 0.6 0.02 3.2 0.9<br />
BDE 154 3.5 0.1 0.3 0.02 <strong>2.</strong>5 0.7<br />
BDE 183 3.0 0.2 0.2 0.06 7.1 1.5<br />
injection volume: multiple injection 2 × 10 μl<br />
splitless period: 2 min.<br />
The repeatability of the PTV–GC/MS injection,<br />
expressed as a relative standard deviation (RSD, n = 10)<br />
ranged from 3.8 to 6.3 % and 3.8 to 10.3 % for nCI and EI<br />
mode, respectively. Similar RSD values for multiple injections<br />
were obtained (3.8–9.2 % and 1.7–10.8 % for nCI and<br />
EI mode, resp.) were determined for spiked fish lipid extract<br />
(1 ng g –1 lipid weight).<br />
LODs calculated as a quantity of analyte that generates<br />
a response 3-time higher than the noise level of the detection<br />
system (based on the injection of solvent standard solution<br />
mixture) are summarized in Table I. LOQs were the minimum<br />
concentrations of analytes that was possible to quantify<br />
with acceptable accuracy and precision. Under these conditions,<br />
the LOQ was the lowest calibration level and corresponded<br />
for particular analyte to 3 × LOD. Generally, in nCI<br />
mode, significantly lower LODs were obtained compared to<br />
EI mode. On the other hand, the identification of individual<br />
PBDEs was only based on their retention times. PBDEs are<br />
eluted in order of increasing bromine number and intensity<br />
Fig. 1. Chromatogram of mixed standard of PbDEs obtained<br />
by GC/MS (NCI)<br />
s446<br />
of appropriate responses was obtained in following order in<br />
case of GC/MS (nCI) system: BDE 28 > BDE 49 ~ BDE<br />
47 ~ BDE 66 ~ BDE 100 > BDE 99 ~ BDE 85 ~ BDE<br />
154 ~ BDE 153 > BDE 183 (see Fig. 1.). Similar chromatogram<br />
obtained by PTV-GC/TOFMS (EI) is documented<br />
in Fig. <strong>2.</strong><br />
Fig. <strong>2.</strong> Chromatogram of mixed standard of PbDEs obtained<br />
by PTV–GC/TOFMS (EI)<br />
Table I shows a significant reduction of LODs by almost<br />
one order of magnitude (to values 0.01–0.06 ng ml –1 by the<br />
use of PTV which allowed introduction of 1–250 µl of sample<br />
(only 1–5 µl were injected by pulsed splitless).<br />
PTV–GC/TOFMS provide LODs similar to PTV–GC/<br />
MS (EI) and values were ranged from 0.3 to 1.5 ng ml –1 . The<br />
main advantage of this technique is availability of full mass<br />
spectral information for all sample components, i.e. confirmation<br />
of target analytes.<br />
Conclusions<br />
In the present work, LODs of individual PBDE congeners<br />
were reduced using various GC systems in analysis<br />
of these analytes in various matrices such as environmental<br />
samples (fish muscle, sediment etc.). Four different injection
Chem. Listy, 102, s265–s1311 (2008) Environmental Chemistry & Technology<br />
techniques, three of them employing PTV, were tested in our<br />
study.<br />
•<br />
•<br />
•<br />
Generaly, the nCI mode provided signifficantyl lower<br />
LODs compared with EI mode coupled to all tested GC/<br />
MS system.<br />
The lowest LODs were obtained by GC/MS coupled to<br />
the PTV injection operated in nCI mode, under these<br />
conditions large quantity of analytes without solvent<br />
(due to PTV injection) and high selectivity for bromine<br />
ions (due to MS-nCI mode) could be performed.<br />
PTV-GC/TOFMS employing splitless injection provided<br />
similar results in comparison with GC/MS (nCI)<br />
using splitless injection.<br />
This study was undertaken within the projects MSM<br />
6046137305 and NPV II (2B06151) both supported by the<br />
Ministry of Education, Youth and Sports of the Czech Republic.<br />
s447<br />
REFEREnCES<br />
1. Čajka T., Hajšlová J., Kazda R., Poustka J.: J.Sep.Sci.<br />
28, 601 (2005).<br />
<strong>2.</strong> Mariani G., Canuti E., Castro-Jiménez J., Christoph E.<br />
H., Eisenreich S. J., Hanke G., Skejo H., Umlauf G.:<br />
Chemosphere (2008), in press.<br />
3. Covaci A., Voorspoels S., de Boer J.: Environ. Int. 29,<br />
735 (2003).<br />
4. Dallüge J., Beens J., Brinkman U. A. Th.: J. Chromatogr.<br />
A. 1000, 69 (2003).<br />
5. Tollbäck P., Björklund J., Östman C.: J. Chromatogr. A<br />
991, 241 (2003).<br />
6. Hajšlová J., Pulkrabová J., Poustka J., Čajka T., Randák<br />
T.: Chemosphere 69, 1195 (2007).
Chem. Listy, 102, s265–s1311 (2008) Environmental Chemistry & Technology<br />
P58 SIMuLTANEOuS DETERMINATION OF<br />
MERCuRy, LEAD AND CADMIuM IN<br />
AQuEOuS SAMPLES uSING PECTIC ACID-<br />
MODIFIED CARbON PASTE ELECTRODE<br />
JOSE H. SAnTOS and SEAn GERARD WARD<br />
Department of Chemistry, University of Brunei Darussalam,<br />
Tungku Link, Gadong BE1410, Brunei Darussalam,<br />
joey@fos.ubd.edu.bn<br />
Introduction<br />
Anodic stripping voltammetry (ASV) and its variants are<br />
the most sensitive electroanalytical techniques employed for<br />
trace heavy metal analysis. Mercury electrodes have been widely<br />
used for ASV due to their ease of use and compatibility<br />
with a number of heavy metal species. Recently, however,<br />
there are major concerns regarding the use of mercury in the<br />
laboratory because of hazards it poses to humans and other<br />
living organisms. Prompted by environmental issues, some<br />
of the applications of modified carbon paste electrodes (CPE)<br />
are aimed at the development of mercury-free electrodes for<br />
ASV 1 . In this paper, we investigated the use of pectic acid as<br />
a modifier for CPE and its utilization for the analysis of some<br />
representative heavy metal species.<br />
Pectic acid, also known as polygalacturonic acid, is a<br />
natural polymer found in citrus rinds. It consists of chains of<br />
300 to 1000 units of galacturonic acid monomer joined with<br />
α 1 → 4 linkages. When incorporated in a CPE, the exposed<br />
carboxylic acid groups are responsible for the accumulation<br />
of heavy metal ions on the electrode surface presumably through<br />
ion-exchange or complex-formation processes.<br />
The aim of this study is to fabricate pectic acid-modified<br />
CPE and examine various experimental conditions that affect<br />
the analytical signal when used as a working electrode for the<br />
ASV of mercury, lead and cadmium in aqueous samples.<br />
Experimental<br />
Pectic acid isolated from orange peel was obtained from<br />
Fluka and used without further purification. Mineral oil,<br />
graphite powder were purchased from Sigma-Aldrich while<br />
1,000-ppm standard solutions of Hg (II), Pb (II) and Cd (II)<br />
were from Sharlau (Spain). All other chemicals used were at<br />
least AR grade.<br />
All electrochemical experiments were carried out using<br />
a BAS 100B Electrochemical System (BioAnalytical System)<br />
in the Osteryoung square wave stripping voltammetry mode<br />
(OSWSV) or cyclic voltammetry (CV) utilizing Ag/AgCl<br />
reference electrode and a Pt wire counter electrode.<br />
Modified carbon paste was prepared by thoroughly<br />
mixing 4 : 1 (w/w) ratio of graphite powder to powdered<br />
pectic acid and enough mineral oil to form a paste typical<br />
for conventional CPEs. A portion of prepared paste was then<br />
tightly packed on the cavity (2-mm dia.) of previously cut<br />
200-ml pipette tip where a copper rod was inserted on the<br />
other end to establish electrical contact.<br />
s448<br />
The modified CPE was first immersed in a sample solution<br />
containing the heavy metal ion being analyzed. After a<br />
predetermined period of time, referred to as accumulation<br />
time, the electrode was removed from the sample and rinsed<br />
thoroughly with water. The electrode was then transferred<br />
into a voltammetric cell containing deoxygenated 0.1M<br />
HCl for ASV. The accumulated metals were first reduced by<br />
applying a sufficiently negative potential of –800 mV for<br />
60 s, then re-oxidized while anodically scanning the potential.<br />
The peak-type I-E plots resulting from the anodic scan<br />
were recorded and evaluated.<br />
Results and Discussion<br />
P r e l i m i n a r y S t u d i e s<br />
Cyclic voltammetric experiments revealed that pectic<br />
acid-modified CPE possesses a useful potential window<br />
ranging from –900 mV to 1200 mV relative to the Ag/AgCl<br />
reference electrode when the supporting electrolyte used was<br />
deoxygenated 0.1M HCl. Preliminary investigations also<br />
showed that Cd, Pb and Hg undergoes redox transformations<br />
at about –690, –470 and +100 mV, respectively, using the<br />
above CPE and electrolyte combination. In principle, these<br />
metal species may be simultaneously detected and conveniently<br />
analyzed with well resolved analytical peaks using the<br />
modified CPE.<br />
I n d i v i d u a l A n a l y s i s<br />
Results of ASV experiments using laboratory prepared<br />
solutions containing a single metal species are consistent<br />
with the literature 2,3 . For all the three heavy metal species,<br />
as the concentration increases or the accumulation time is<br />
prolonged, the peak current also increases in a linear fashion<br />
until such an instance where current signal plateaus and further<br />
increase in concentration or accumulation time does<br />
not anymore amplify the peak height. This is due to the fact<br />
that the higher the concentration or the longer the electrode<br />
is immersed into the solution containing the analyte; more<br />
metal ions are able to accumulate on the surface, which consequently<br />
provides a higher current. Saturation point is attained<br />
when the active sites for metal accumulation are maximized<br />
resulting to levelling of current response. Using an<br />
accumulation time of 2 min and other parameters described in<br />
the experimental section, the sensitivities and detection limits<br />
are reported in Table I. Sensitivities were calculated from the<br />
slopes of individual calibration curves within the linear dynamic<br />
range while detection limits (LOD) were estimated based<br />
on three times the standard deviation of the blank. Further<br />
Table I<br />
Analytical data for pectic acid-modified CPE<br />
Metal<br />
Sensitivity LOD LOL<br />
[μA ppm –1 ] [ppm] [ppm]<br />
cadmium 20 0.25 20<br />
lead 50 0.15 50<br />
mercury 10 0.40 50
Chem. Listy, 102, s265–s1311 (2008) Environmental Chemistry & Technology<br />
improvements in LOD and limits of linearity (LOL) were<br />
observed upon increasing or decreasing the accumulation<br />
time, respectively.<br />
Fig. 1. ASV for solutions containing 1 ppm Pb, 3 ppm hg and<br />
varying Cd: (a) 1, (b) 3, (c) 5, (d) 10 ppm<br />
Fig. <strong>2.</strong> ASV for solutions containing 1 ppm Cd, 3 ppm hg and<br />
varying Pb: (a) 1, (b) 3, (c) 5, (d) 10 ppm<br />
s449<br />
Fig. 3. ASV for solutions containing 1 ppm Cd, 1 ppm Pb and<br />
varying hg: (a) 3, (b) 5, (c) 10, (d) 20 ppm<br />
S i m u l t a n e o u s A n a l y s i s<br />
When two or three metals studied in this project are present<br />
in the same solution, well resolved peaks with characteristic<br />
potentials corresponding to specific metal species are<br />
observed as shown in Figs. 1., <strong>2.</strong> and 3.<br />
Although linearity between peak height and concentration<br />
is maintained, careful inspection of individual peaks<br />
revealed that sensitivity decreases when the three metal ions<br />
co-exist. Moreover, as the concentration of one metal increases,<br />
the current signal for the other two decreases. This is<br />
presumably due to competition for binding sites among the<br />
metal ions and their varying affinities to carboxylate groups<br />
in pectic acid.<br />
Acknowledgement (This work has been supported by the<br />
Ministry of Development of Brunei Darussalam).<br />
REFEREnCES<br />
1. Wang J.: Electroanalysis 3, 255 (1991).<br />
<strong>2.</strong> YantaseeW., Lin Y., Fryxell G. E., Busche B. J.: Anal.<br />
Chim. Acta 502, 207 (2004).<br />
3. Ghiaci M., Rezaei B., Kalbasi R. J.: Talanta 73, 37<br />
(2007).
Chem. Listy, 102, s265–s1311 (2008) Environmental Chemistry & Technology<br />
P59 DETECTION OF FOREIGN ORGANIC<br />
SubSTANCES IN wATER AND bIOLOGICAL<br />
SAMPLES<br />
e. SAVELIEVA, n. KORYAGInA, n. KHLEBnIKOVA,<br />
n. GOnCHAROV and A. RADILOV<br />
Research Institute of Hygiene, Occupational Pathology and<br />
Human Ecology, Saint-Petersburg, Russia,<br />
esavelieva59@mail.ru<br />
Introduction<br />
The chemical analysis of biomedical samples (bodily<br />
fluids, tissues) aimed at revealing exposure to toxic chemicals<br />
(TCs) can be directed to the following targets:<br />
(i) TCs themselves, when their metabolism is slow<br />
enough,<br />
(ii) Low-molecular metabolites of TCs,<br />
(iii) High-molecular adducts of TCs with proteins.<br />
Right choice of target (marker) with account for the life<br />
cycle of a TC (adsorption–distribution – metabolism – excretion)<br />
predetermines success of analysis. The targets (i) and<br />
(ii) are more convenient to determine by conventional GC-<br />
MS methods but are unsuitable for retrospective analysis in<br />
view of their short life time in the organism. We developed<br />
procedures for the determination in biomedical samples of all<br />
the three groups of biomarkers of TCs.<br />
Results and Discussion<br />
Direct analysis of a TC in biomedical samples was considered<br />
to be a rational approach in toxicokinetic research<br />
on fluoroacetic acid, one of the most potent metabolic poinsons<br />
(FAA). Salts of FAA are still used in some countries for<br />
rodent population control; deadly poisoning of humans and<br />
farm animals was also described. At our laboratory, procedures<br />
for the determination of O-alkyl esters of methylphosphonic<br />
acid (low-molecular metabolites of organophosphorus<br />
warfare agents, OPWAs) and thiodiglycol (metabolite of<br />
sulfur mustard) were also developed. These metabolites are<br />
products of both biogenic and abiogenic hydrolysis of the<br />
parent agents, and, therefore, their determination in environmental<br />
samples is actual for retrospective analysis aimed at<br />
establishing the fact and degree of environmental pollution<br />
with the corresponding agents. Of particular importance for<br />
forensic analysis are universal procedures suitable both for<br />
water and for biological fluids. We developed universal procedures<br />
for the determination of FAA, methylphosphonic acid<br />
(MPA), ethyl MPA (marker of VX), isopropyl MPA (marker<br />
of sarin), isobutyl MPA (marker of Russian VX), pinacolyl<br />
MPA (soman marker), and thiodiglycol in water, urine, and<br />
blood plasma.<br />
For retrospective establishment of exposure to TCs,<br />
procedures for the determination of reactivation products<br />
of blood plasma butyryl cholinesterase (BChE) inhibited by<br />
OPWAs and of thiodiglycol isolated by alkaline hydrolysis<br />
from albumin adducts. These procedures all are based on GC/<br />
MS combined with solid-phase microextraction (SPME).<br />
s450<br />
Solid-phase microextraction is a unique method that<br />
allows one to combine on a single stage extraction from a<br />
matrix, concentration, and injection of a sample. SPME offers<br />
a great advantage of analyzing the whole sample rather<br />
than its aliquot, and, therefore, is more than about an order<br />
of magnitude more sensitive compared with traditional separation<br />
and concentration methods. SPME poses no threat of<br />
contamination of a GCMS system by matrix components. Of<br />
key importance for successful SPME analysis is right choice<br />
of microfiber, conditions for sorption (temperature, time,<br />
sample mixing mode, ionic strength of analyzed solution)<br />
and desorption (temperature, delay time).<br />
Therefore, in developing an SPME procedure, one<br />
should optimize the following parameters:<br />
•<br />
•<br />
•<br />
•<br />
Type of microfiber<br />
Sorption and thermodesorption temperatures of target<br />
analytes<br />
Sorption and thermodesorption times<br />
Ionic strength of the solution.<br />
Before GC/MS analysis nonvolatile target compounds<br />
were derivatized either in situ with subsequent concentration<br />
of the volatile derivative on microfiber (analysis for FAA)<br />
or directly on microfiber with vapors of derivatizing agents<br />
(analysis for MPA and its O-alkyl esters).<br />
In what follows we schematically represent certain of<br />
the mentioned procedures. Fig. 1. shows the block scheme of<br />
the determination of sodium fluoroacetate in various media.<br />
In view of the fact that the volatile derivative, ethyl fluoroacetate,<br />
is sampled from equilibrium vapor, the sample matrix<br />
scarcely affects the results of analysis. The developed procedure<br />
is universal and can be applied both for control of drinking<br />
water and for toxicokinetic and forensic investigations.<br />
Fig. 1. Block scheme of the unified procedure for the determination<br />
of sodium fluoroacetate in water and biomedical samples<br />
by SPME-GCMS<br />
The detection limits are 0.001 mg ml –1 for drinking<br />
and natural waters, 0.01 mg ml –1 for blood plasma, and<br />
0.01 mg ml –1 for organ homogenates (without recounting for<br />
dry weigh). The procedure is described in detail in ref. 1 .<br />
For the determination of the low-molecular metabolites<br />
of organophosphorus warfare agents, MPA and its alkyl
Chem. Listy, 102, s265–s1311 (2008) Environmental Chemistry & Technology<br />
esters, in urine we suggested a procedure involving extraction<br />
of the analytes on microfiber, their silylation with N-tertbutyldimethylsilyl-N-methyltrifluoroacetamide<br />
(MTBSTFA)<br />
directly on microfiber, thermodesorption of the resulting derivatives<br />
in a hot GC injector, GC separation, and MS detection<br />
in the SIM mode. Three types of microfibers of various polarities<br />
were tested: 50/30 µm DVB/Сarboxen/PDMS, 85 µm<br />
Сarboxen/PDMS, and 70 µm Carbowax/DVB (Fig. 1.). The<br />
best results were obtained on the first microfiber.<br />
Unlike certain related techniques, SPME provides a<br />
unique possibility for experimenting with various types of<br />
microfibers differing from each other in chemical nature and<br />
micropore size. Development of an SPME procedure always<br />
begins with searching for an optimal microfiber. This process<br />
is illustrated in Fig. <strong>2.</strong><br />
Fig. <strong>2.</strong> Efficiency of various microfibers for the determination<br />
of MPA and O-AMPAs as tert-butyldimethylsilyl derivatives<br />
In vivo animal (rats) experiments gave evidence for the<br />
possibility of revealing exposure to OPWAs at the ≥0.5 LD 50<br />
level within no less than 48 h after exposure. Urinary metabolites<br />
of OPWAs could, in principle, be detected within two<br />
weeks after exposure, but even if sufficiently high doses of<br />
OPWAs were applied. The procedure is schematically represented<br />
in Fig. 3 and described in detail in ref. 2 .<br />
For retrospective establishment of exposure to OPWAs<br />
we developed an SPME-GCMS procedure based on reactivation<br />
of inhibited BChE (Fig. 4.). Reactivation of blood BChE<br />
inhibited by OPWAs by the action of fluoride ion gives rise<br />
to the parent compounds in the case of G-type agents or fluoroanhydrides<br />
in te case of V-type agents. SPME is especially<br />
efficient in this case, since the reactivation products are trapped<br />
by microfiber and thus eliminated from the reaction zone,<br />
which drives the reactivation process. Soman is best retained<br />
by microfiber. In should be noted that the developed procedure<br />
is feasible for the determination of total soman and for<br />
the separate determination of reactivated and intact soman.<br />
s451<br />
Fig. 3. block scheme of the procedure for the determination of<br />
O-AMPAs in urine by SPME-GCMS<br />
Conclusions<br />
Procedures for the determination in biomedical samples<br />
of biomarkers of TCs have been developed. For fluoroacetic<br />
acid, the detection limits are 0.001 mg ml –1 for drinking<br />
and natural waters, 0.01 mg ml –1 for blood plasma, and<br />
0.01 mg g –1 for organ homogenates (without recounting for dry<br />
Fig. 4. block scheme of the determination of blood plasma<br />
bChE reactivation products by SPME-GCMS<br />
weigh). For organophosphorus warfare agents, the detection<br />
limits in the analyzed sample volumes are 0.01 mg dm –3 for<br />
sarin and 0.002 mg dm –3 for soman. The analysis time (including<br />
sample preparation) is <strong>2.</strong>5 h. Exposure to OPWAs by the<br />
results of analysis for inhibited BChE reactivation products<br />
can be revealed within 2 and more weeks after intoxication<br />
with high doses.<br />
REFEREnCES<br />
1. Koryagina n. L., Savelieva E. I., Khlebnikova n. S.,<br />
Goncharov n. V., Jenkins R. O., Radilov A. S.: J. Anal.<br />
Bioanal. Chem. 386, 1395 (2006).<br />
<strong>2.</strong> Savelieva E. I., Koryagina n. L., Khlebnikova n. S.,<br />
Feld V. E., Radilov A. S.: Sixth International Chemical<br />
and Biological Medical Treatment Symposium. p. 64,<br />
Spiez, Switzerland 2006.<br />
3. Savelieva E. I., Koryagina n. L., Radilov A. S., Khlebnikova<br />
n. S., Feld V. E.: Fourth World Congress on<br />
Chemical, Biological and Radiological Terrorism. p. 18,<br />
Dubrovnik 2007.
Chem. Listy, 102, s265–s1311 (2008) Environmental Chemistry & Technology<br />
P60 DETERMINATION OF SuLFONAMIDES IN<br />
wATER uSING MuLTI-wALLED CARbON<br />
NANOTubES SPE AND hPLC wITh<br />
FLuORESCENCE DETECTOR<br />
STEFAnIA SIMOn a , DAn LUPU a , ALEXAnDRU BIRIS a<br />
and COnSTAnTIn BELE b<br />
a National Institute for Research and Development of Isotopic<br />
and MolecularTechnologies, R-400293, Cluj-Napoca, Romania,<br />
b University of Agricultural Sciences and Veterinary<br />
Medicine,R-400372,Cluj-Napoca, Romania,<br />
stefania@itim-cj.ro<br />
Introduction<br />
Multi-walled carbon nanotubes (MWCnTs) are a novel<br />
carbon material, repeatedely discussed in the literature for<br />
the solid phase extraction (SPE) of several organic contaminants.<br />
1–3<br />
In this paper a sensitive method was developed for the<br />
determination of six commonly sulfonamides (SAs) in water<br />
by SPE using MWCnTs as adsorbent. Final analysis was carried<br />
out by HPLC coupled with fluorescence detection.<br />
Experimental<br />
R e a g e n t a n d W a t e r S a m p l e s<br />
Sulfadimethoxine (SDM), sulfadiazine (SDZ), sulfamethoxazole<br />
(SMX), sulfamerazine (SMR), sulfanilamide<br />
(SnA), sulfaguanidine (SGn) and fluorescamine were obtained<br />
from Sigma-Aldrich. MWCnTs were purchased from<br />
Institute for Research and Development of Isotopic and<br />
Molecular Technologies Cluj-napoca, Romania. Deionized<br />
and redistilled water was prepared on Milli-Q Plus (Millipore).<br />
Acetonitrile, ortophosphoric acid (H 3 PO 4 ) and dipotassiumphosphate<br />
(K 2 HPO 4 ) were purchased from Merck. A<br />
river water sample was collected from Somes (Cluj-napoca)<br />
and filtered through 0.45 μm nylon membrane and stored at a<br />
temperature of 4 °C.<br />
C h r o m a t o g r a p h i c S y s t e m a n d<br />
C o n d i t i o n s<br />
All experiments were carried out by using Shimadzu VP<br />
Series liquid chromatograph equipped with a degasser and<br />
a mixer of mobile phase. A fluorescence (FL) detector FR-<br />
10 AXL with excitation wavelength of 405 nm and emission<br />
wavelength of 495 nm was used to analyse the tested solutions.<br />
Chromatographic separation was performed on a Alltima<br />
RP C-18 column (250 mm × 4.6 mm, 5 μm). Gradient<br />
elution with a mixture of acetonitrile (solvent A) – phosphate<br />
buffer pH 3.5 (solvent B) at a flow rate of 1 ml min –1 was<br />
applied. The initial gradient conditions were: 65 % solvent B<br />
for the first 25 min, decreasing to 50 % in 25 min, finally it<br />
was brought back to 65 % in 5 min and held for 5 min until<br />
the next injection.<br />
s452<br />
E x t r a c t i o n P r o c e d u r e<br />
The cartridge packed with 200 mg MWCnTs was prepared<br />
in a 6ml polypropylene syringe and the sorbent was<br />
retained by two polyethylene frits. The solutions (water<br />
sample or water sample spiked with analytes) adjusted to<br />
pH 6 were loaded at a flow rate of 4 ml min –1 .Then, SAs<br />
were eluted using a mixture of 3 ml ammonium acetate<br />
water solution (0.2M) and 6 ml acetonitrile.The eluate was<br />
evaporated to about 3 ml under nitrogen stream in a 35 °C<br />
block heater. Then 3 ml of methylene chloride was added and<br />
each samples was mixed and separated. The lower layer was<br />
evaporated to near dryness. The extract was reconstituted in<br />
1.0 ml mobile phase. The analytes were quantified by HPLC<br />
with a pre-column derivatization with fluorescamine (400 μl<br />
of sample + 400 μl of fluorescamine 0.1 %).The whole solution<br />
was mixed with a vortex mixer. The sample was filtered<br />
through a 0.45 μm nylon filter and after standing for 30 min<br />
at ambient temperature was ready for analysis.<br />
Results<br />
The effect of the pH was investigated over the range of<br />
pH 4–8 and it was found that the pH of sample solutions in<br />
the whole range nearly had no influence on the extraction of<br />
SAs.<br />
To investigate the influence of sample volume, different<br />
volumes of pure water were spiked with a constant mass of<br />
0.25 μg of each analyte. It was found that the recoveries of<br />
SAs<br />
decreased slightly with the increase of sample volume. When<br />
the volume was 200 ml, the recoveries of 55–93 % were<br />
obtained for the six SAs.<br />
For elution of SAs we selected a mixture of ammonium<br />
acetate and acetonitrile 1 : 2 (v/v) and better recoveries were<br />
obtained when eluent volume amounted to 9 ml.<br />
The results of the linearity of SAs determined under the<br />
optimized conditions and using 200 ml of spiked pure water<br />
are reported in Table I. The linearity of each compound measured<br />
by HPLC method was good from 0.05 to 5 ng ml –1 .<br />
The correlation coefficient of the calibration curves were<br />
above 0.999.<br />
Table I<br />
Retention time (t R ) and linearity of SAs<br />
Sulfonamide t R [min] b a a b<br />
SMX 11.23 21.694 0.564<br />
SnA 17.69 20.944 0.574<br />
SDZ 20.43 9.402 0.245<br />
SMR 2<strong>2.</strong>94 16.644 –0.192<br />
SGn 4<strong>2.</strong>32 8.021 0.071<br />
SDM 46.68 5.560 0.104<br />
b a : Slope<br />
a b : Intercept<br />
The recoveries of analytes were evaluated using 200 ml<br />
of environmental water samples (Somes river) spiked with
Chem. Listy, 102, s265–s1311 (2008) Environmental Chemistry & Technology<br />
the mixture of SAs at 0.25 and <strong>2.</strong>5 ng ml –1 and enriched and<br />
analyzed by this system. The results are listed in Table II.<br />
Table II<br />
Recoveries of SAs spiked water samples (n = 3)<br />
Sulfonamides Spiked [ng ml –1 ] Recovery [%]<br />
SMX<br />
SnA<br />
SDZ<br />
SMR<br />
SGn<br />
SDM<br />
0.25 57 ± 5.2<br />
<strong>2.</strong>5 55 ± 6.4<br />
0.25 74 ± 7.3<br />
<strong>2.</strong>5 73 ± 6.8<br />
0.25 82 ± 4.3<br />
<strong>2.</strong>5 77 ± 3.7<br />
0.25 58 ± 5.4<br />
<strong>2.</strong>5 56 ± 7.6<br />
0.25 93 ± 4.1<br />
<strong>2.</strong>5 88 ± 6.9<br />
0.25 87 ± <strong>2.</strong>5<br />
<strong>2.</strong>5 79 ± 5.3<br />
The chromatogram of the river water sample spiked with<br />
SAs is shown in Fig. 1.<br />
Conclusions<br />
The HPLC method with fluorescence detection characterized<br />
by a good reliability for quantitative determination of<br />
six different kinds of SAs from environmental samples has<br />
been developed. The results showed that MWCnTs could be<br />
used as a potent SPE sorbent for SAs.<br />
This work has been supported by the Natio-nal Authority<br />
for Scientific Research of Romania, CEEX project no.<br />
62/2006.<br />
s453<br />
Fig. 1. SPE-LC-FL chromatogram of river water sample<br />
spiked with <strong>2.</strong>5 ng ml –1 of each compound. (1) SMx; (2) SNA; (3)<br />
SDZ; (4) SMR; (5) SGN; (6)SDM<br />
REFEREnCES<br />
1. niu H., Cai Y., Shi Y., Wei F., Liu J., Mou S., Jiang G.:<br />
Anal. Chim. Acta 594 , 81(2007).<br />
<strong>2.</strong> Fang G.Z., He J.X., Wang S.: J. Chromatogr. A 1127, 12<br />
(2007).<br />
3. Zhao H., Wang L., Qiu Y., Zhou Z., Zhong W., Li X.:<br />
Anal. Chim. Acta 586, 399 (2007).
Chem. Listy, 102, s265–s1311 (2008) Environmental Chemistry & Technology<br />
P61 MICRObIOLOGIAL REMEDIATION OF<br />
METAL-CONTAMINATED SOIL<br />
VALéRIA SnOPKOVá<br />
Department of Biotechnology, Institute of Geotechnics the<br />
Slovak Academy of Sciences,<br />
Watsonova 45, 043 53 Košice, Slovak Republic.<br />
snopkova@saske.sk<br />
Introduction<br />
Soil contamination with anthropogenic heavy metals,<br />
which mainly comes from industrial activity, atmospheric<br />
deposition and land application of sewage sludge, has received<br />
much attention in the recent years. The anthropogenic<br />
heavy metals are to be easily accumulated in the topsoil1,<br />
resulting in potential problems such as toxicity to plants and<br />
animals 1,2 , accumulation in food chain, perturbation of the<br />
ecosystem and adverse health effects 4,5 . Metals, which are<br />
significantly toxic to human beings and ecological environment,<br />
include chromium (Cr), cooper (Cu), lead (Pb), mercury<br />
(Hg), zinc (Zn), manganese (Mn), cadmium (Cd), nickel<br />
(ni), arsenic (As) and iron (Fe), etc. 6 .<br />
Contaminated soil is notoriously difficult to treat because<br />
the contaminants are often tightly bound to the soil particles.<br />
Conventional remediation technologies are becoming less<br />
popular due to the high treatment costs and bioremediation<br />
processes to improve the contaminant removal efficiency<br />
and cost effectiveness. However, as an innovative technology,<br />
there are many factors to be investigated with the future<br />
development 7 .<br />
bioremediation<br />
Bioremediation is defined as a method using living organisms,<br />
or their particles (enzymes) to reduce, eliminate, fixate<br />
or transform contaminants presented in the soil, in sediments,<br />
in waters or in the air 8,9 . In the bioremediation processes<br />
bacteria, fungi, yeasts and plants present the most imposed<br />
organisms. Recently, the ability of algaes and planktons are<br />
being researched. Some technologies are based on the use<br />
of general or genetically modificated organisms 8 . Bioremediation<br />
works by either transforming or degrading contaminants<br />
to non-hazardous or less hazardous chemicals. These<br />
processes are called, respectively, biotransformation and<br />
biodegradation. Biotransformation is any alteration of the<br />
molecular or atomic structure of a compound by microorganisms.<br />
Biodegradation is the breaking down of organic substance<br />
by microorganisms into smaller organic or inorganic<br />
components 9 .<br />
Metal – Microbe Interactions<br />
Microorganisms, especially bacteria, exist in complex<br />
biogeochemical matrices in subsurface sediments and soils 9<br />
and are known to mediate many geochemical processes 10,11 .<br />
They can interact with metals via many mechanisms, some of<br />
which may be used as the basis of the potential bioremediation<br />
strategies 9 . Microbes can mobilize metals through autot-<br />
s454<br />
rophic and heterotrophic leaching, chelation by microbial<br />
metabolites and siderophores, and methylation, which can<br />
result in volatilization. Conversely, immobilization can result<br />
from sorption to cell components or exopolymers, transport<br />
into cells and intracellular sequestration or precipitation as<br />
insoluble organic and inorganic compounds, e.g. oxalates 12,13<br />
sulphides or phosphates 14,15 .<br />
M e t a l M o b i l i z a t i o n<br />
bioleaching. Metals can be leached from solid matrices<br />
via autotrophic and heterotrophic leaching. Chemolitotrophic<br />
and heterotrophic bacteria have the major role.<br />
Most autotrophic leaching is carried out by chemolithotrophic,<br />
acidophilic bacteria which fix carbon dioxide and<br />
obtain energy from the oxidation of ferrous iron or reduced<br />
sulfur compounds, which causes the solubilization of metals<br />
because of the resulting production of Fe(III) and H 2 SO 4 16,17 .<br />
The microorganisms involved include sulfur-oxidizing bacteria,<br />
e.g., Acidihiobacillus thiooxidans, iron- and sulfur-oxidizing<br />
bacteria, e.g., Acidithiobacillus ferrooxidans and ironoxidizing<br />
bacteria, e.g., Leptospirillum ferrooxidans 18,19 .<br />
In the case of oxide, carbonate and silicate ores, limits<br />
are set for the use of thiobacilli. For such ores, research is<br />
being done on the use of heterotrophic bacteria. In this case,<br />
metals are dissolved by organic acids, or complexing, or chelating<br />
agents produced by the bacteria. Heterotrophic bacteria<br />
require organic supplement for growth and energy supply.<br />
Among the bacteria, members of the genus Bacillus are most<br />
effective in metal solubilization 19 .<br />
Siderophores are low molecular weight Fe(III) coordination<br />
compounds that are excreted under iron-limiting conditions<br />
by microorganisms, particularly bacteria and fungi,<br />
to enable accumulation of iron from the environment 20,21 .<br />
Although primarily produced as a means of obtaining iron,<br />
siderophores are also able to bind other metals such as magnesium,<br />
manganese, chromium (III), gallium (III) and radionuclides<br />
such as plutonium (IV) 22,23 .<br />
biomethylation of Hg, As, Se, Sn, Te and Pb can be<br />
mediated by a range of bacteria under aerobic and anaerobic<br />
conditions. Methyl groups are enzymatically transferred to<br />
the metal, and the given species may transform a number of<br />
different metal(-loid)s. Methylated metal compounds formed<br />
by these processes differ in their solubility, volatility and<br />
toxicity 23 .<br />
M e t a l I m o b i l i s a t i o n<br />
bioacumulation and biosorption. Bacteria can physically<br />
remove heavy metals from solution through association<br />
of these contaminants with biomass. Bioaccumulation is the<br />
retention and concentration of substance within an organism.<br />
In bioaccumulation, metals are transported from the outside<br />
of the microbial cell trough the cellular membrane, into the<br />
cell cytoplasm, where the metals are sequestred 9,24 . Biosorption<br />
describes the association of soluble substances with the<br />
cell surface. Sorption does not require an active metabolism.<br />
The amount of metal biosorbed to the exterior of bacterial
Chem. Listy, 102, s265–s1311 (2008) Environmental Chemistry & Technology<br />
cells often exceeds the amount predicted using information<br />
about the charge density of the cell surface 9,25 .<br />
bioprecipitation. Sulfate reduction is an example for<br />
the precipitation of metals ions in solution. Sulfate-reducing<br />
bacteria form metal sulfides that are insoluble. The stability<br />
of these sulfides depends on maintenance of anoxic conditions<br />
7,24 , and nutrients are also inevitable. Stimulating sulfate<br />
reducion can increase pH also and form metal hydroxides and<br />
oxides that precipitate and do not migrate in soil and groundwater<br />
7 .<br />
biooxidation, bioreduction. Microorganisms are also<br />
known to oxidize and reduce metal contaminants. Mercury<br />
and cadmium can be oxidized while arsenic and iron can<br />
be reduced by microorganisms. Cr(VI) can be oxidized to<br />
Cr(III) that is less mobile and toxic. Bacteria such as Bacilus<br />
subtilis and SRB in the presence of sulfur can perform this<br />
reaction 7 .<br />
bioremediation Technologies<br />
According to the site, bioremediation technologies are<br />
divided to:<br />
in-situ – are carried out at the place of the contamination,<br />
ex-situ – the contaminated matter is taken off from the<br />
natural locality and it is consequently processed26 •<br />
•<br />
.<br />
Ex situ bioremediation is usually realized on the specific<br />
revised place or in the reactor. The pre-treating of contaminated<br />
matter increases the efficiency of this process 26 . Ex-situ<br />
methods have been around longer and are better understood,<br />
and they are easier to contain, monitor, and control. However,<br />
in-situ bioremediation has several advantages over ex-situ<br />
techniques. In-situ treatment is useful for contaminants that<br />
are widely dispersed in the environment, present in dilute<br />
concentrations, or otherwise inaccessible (e.g., due to the presence<br />
of buildings or structures). This approach can be less<br />
costly and less disruptive than ex-situ treatments because no<br />
pumping or excavation is required. Moreover, exposure of<br />
site workers to hazardous contaminants during in-situ treatment<br />
is minimal 27 .<br />
Broadly, bioremediation strategies can be further divided<br />
into natural attenuation, biostimulation, and bioaugmentation<br />
strategies 27 .<br />
bioaugmentation presents an addition of microorganisms<br />
or their products, such as biosurfactants or enzymes28.<br />
Thus, inoculation of ‘specialized’ biomass may allow for<br />
an increased biodegradation of target pollutants as well as a<br />
more effective detoxification of the solid matrix 29 . Another<br />
common result of bioaugmentation is the dramatic reduction<br />
of remediation times 30,31 . Indigenous or exogenous, standard<br />
or modified microorganisms are used 32,33 . Generally, they<br />
present mixed cultures of microorganisms, but it could be<br />
also pure bacterial strains adapted onto the aimed contaminant<br />
in the laboratory 34,35 .<br />
biostimulation can be aggressive or passive, in that<br />
electron donors, electron acceptors, and trace nutrients can<br />
s455<br />
be injected into the environment to stimulate indigenous<br />
organisms to increase biomass or activity to affect the contaminant.<br />
Passive biostimulation techniques include simple<br />
infiltration galleries or simply spreading fertilizer on surface<br />
without any pumping or mixing 25,27 .<br />
Natural attenuation relies on the intrinsic bioremediation<br />
capabilities of that environment. Environments high<br />
in organic carbon and energy sources, low contaminant concentrations,<br />
and without significant nutrient deficiencies may<br />
be able to degrade or transform the contaminants of concern<br />
without any intervention 27 .<br />
Conclusions<br />
Environmental biotechnologies with applications of<br />
bacteria are eco-friendly and cost effective. They present<br />
natural technologies for treatment of toxic metals from soil.<br />
The following development is desirable, because of the high<br />
specificity and the time-consuming of biological processes<br />
and because of the difficulty to control them.<br />
Acknowledgement (This work has been supported by<br />
Slovak Academy of Science No. VEGA 2/0049/08<br />
REFEREnCES<br />
1. Samsoe-Petersen L., Larsen E.H., Larsen P.B., Bruun P.:<br />
Environ. Sci. Technol. 36, 3057 (2002).<br />
<strong>2.</strong> Ma Y., Dickinson n.M., Wong M.H.: Biol. Fertil. Soils<br />
36, 79 (2002).<br />
3. Berti W.R., Jacobs L.W.: J. Environ. Qual. 25, 1025<br />
(1996).<br />
4. Forstner U., 1995. In: Metal Speciation and contamination<br />
of Soil. (Allen H.G., Huang C.P., Bailey G.W.,<br />
Bowers A.R. ed.), CRC Press, Boca Raton, FL, (1995).<br />
5. Stalikas C.D., Mantalovas Ach., Pilidis G.A.: Sci. Total<br />
environ. 206, 17 (1997).<br />
6. Meena A.K., Mishra G.K., Rai P.K., Rajagopal Ch.,<br />
nagar P.n.: J. Hazard. Mater. 112, 161 (2005).<br />
7. Mulligan C.n., Yong, R.n, Gibbs B.F.: Eng. Geol. 60,<br />
193 (2001).<br />
8. Dercová K., Makovníková J., Barančíková B., Žuffa J.:<br />
Chemické listy 99, 682 (2005).<br />
9. Tabak H.H., Lens P., van Hullebusch E.D., Dejonghe<br />
W.: Environ. Sci. Technol. 4, 115 (2005).<br />
10. Ehrlich H.L.: Appl. Microbiol. Biotechnol. 48, 687<br />
(1997).<br />
11. Ledin M.: Earth Scien. Rev. 51, 1 (2000).<br />
1<strong>2.</strong> Gharieb M.M., Sayer J.A., Gadd G.M.: Mycol. Res.<br />
102, 825 (1998).<br />
13. Sayer J.A., Gadd G.M.: Mycol. Res. 101, 653 (1997).<br />
14. White C., Gadd G.M.: Microbiol. 142, 2197 (1996).<br />
15. Yong P. Macaskie L.E.: J. Chem. Technol. Biotechnol.<br />
63, 101 (1995).<br />
16. Rawlings D.E.: in: Biomining: Theory, Microbes and<br />
Industrial Processes (Rawlings D.E., ed.) Springer-Verlag,<br />
Berlin, 1997.
Chem. Listy, 102, s265–s1311 (2008) Environmental Chemistry & Technology<br />
17. Schippers A., Sand W.: Appl. Environ. Microbiol. 65,<br />
319 (1999).<br />
18. Ewart D.K., Hughe, M.n.: Adv. Inorg. Chem. 36, 103<br />
(1991).<br />
19. Bosecker K.: FEMS Microbiol. Rev. 20, 591 (1997).<br />
20. John S.G.: Environ. Sci. Technol. 35, 2942 (2001).<br />
21. White Ch., Wilkinson S. C., Gadd G.M.: Internat. Biodet.<br />
Biodeg. 35, 17 (1995).<br />
2<strong>2.</strong> Birh L., Bachofen R.: Experienta 46, 827 (1990).<br />
23. Gadd G.M.: Geoderma 122, 109 (2004).<br />
24. Gaszó L.G.: Cejoem 7, 178 (2001).<br />
25. Palmisan A., Hazen T., Bioremediation of metals and<br />
radionuclides. Prepared for the nABIR, LBnL – 42595<br />
(2003).<br />
26. Kubal M., Burkhard J., Březina M.: in Dekontaminační<br />
technológie. VŠCHT, Praha 200<strong>2.</strong><br />
27. Hazen T.C., Tabak H.H.: Environ. Sci. Technol. 4, 157<br />
(2005).<br />
s456<br />
28. Gentry T.J, Josephson K.L., Pepper I.L.: Biodegrad. 15,<br />
67 (2004).<br />
29. Silva E., Fialho A.M., Sá-Correia I., Burns R.G., Shaw<br />
L.J.: Environ. Sci. Technol. 38, 632 (2004).<br />
30. Zhang C., Hughes J.B., nishino S.f., Spain J.C.: Environ.<br />
Sci. Technol. 34, 2810 (2000).<br />
31. Robles-Gonzales I.V., Fava F., Poggi-Voraldo H.M.:<br />
Microb. Cell. Fact. 7, 1 (2008).<br />
3<strong>2.</strong> Boon n., Goris J., de Vos. P., Verstraet W., Top E.M.:<br />
Appl. Environ. Microbiol 66, 2906 (2000).<br />
33. Vidali M., Pure Appl. Chem. 73, 1163 (2001).<br />
34. Ramasamy K., Parwin Banu K., Parwin Banu S.: in:<br />
Enviromental bioremediation technologies. (Singh S.n.,<br />
Tripathi R.D., ed.), p.7. Springer, new York 2004.<br />
35. Dercová K.: Odpady 4, 16 (2004).
Chem. Listy, 102, s265–s1311 (2008) Environmental Chemistry & Technology<br />
P62 DISTRIbuTION OF PhThALIC ACID ESTERS<br />
(DEhP, DbP) IN ChICKEN TISSuES AND<br />
ORGANS<br />
VLASTA STAnCOVá a , ALŽBETA JAROŠOVá a , LEnKA<br />
KRáTKá a , JIří HARAZIM b and PAVeL SUCHý c<br />
a Mendel University of Agriculture and Forestry Brno<br />
Faculty of Agronomy, Zemědělská 1, 613 00, Brno, Czech<br />
Republic,<br />
b Central Institute for Supervising and Testing in Agriculture,<br />
Hroznová 2, 656 06, Brno, Czech Republic,<br />
c University of Veterinary and Pharmaceutical Sciences Brno,<br />
Palackého 1/3, 612 42, Brno, Czech Republic,<br />
xwegsch0@node.mendelu.cz<br />
Introduction<br />
Phthalates, ubiquitous food and environmental contaminants,<br />
are the most frequently used plasticizers for PVC. Due<br />
to the widespread use of plasticized PVC for a vast number<br />
of technical purposes and for some food contact materials,<br />
the phthalates are produced in huge amounts. Several million<br />
tons of phthalates are used per year worldwide in the production<br />
of soft polyvinyl chloride and other plastics. Phthalates<br />
are not chemically bound in to the products and are released<br />
continuously into the air or leach from the products 1 . The<br />
migration of phthalates from packaging materials containing<br />
these compounds to fatty foodstuffs is a well-known source<br />
of food contamination 2 . Major and most toxic phthalic acid<br />
esters (PAEs) associated with food are di-2-ethylhexyl phthalate<br />
(DEHP) and di-n-butyl phthalate (DBP). PAEs entering<br />
the human body are rapidly hydrolyzed to the monoesters and<br />
than metabolized and excreted with urine and feces 1 .<br />
PAEs are considered highly hazardous to human health<br />
because they disrupt the hormonal balance and impair reproduction<br />
and development. Some of them are considered as<br />
potential carcinogens, teratogens and mutagens. Additionally,<br />
phthalates are suspected to trigger asthma and dermal diseases<br />
in children. The main objective of the present work is to<br />
investigate the real content of DEHP and DBP in samples of<br />
chicken’s muscle, skin, fat and liver 3 .<br />
Experimental<br />
M e t h o d s<br />
Phthalates content measurement in lyophilisated chicken<br />
tissues is made in four separate steps, where every sample<br />
is analyzed in parallel which brings additional measurement<br />
correctness check. Blank is important for glass cleaness<br />
check and to specify chromatography background. First<br />
step consists of fat extraction from tissues using mixture of<br />
organic solvents (acetone : hexane; 1 : 1). In second step, after<br />
dissolving co-extracts in mobile phase (dichlormethane:<br />
cyclohexane; 1 : 1), they are separated by Bio-Beads S-X3<br />
gel-permeation chromatography. Third step comprise of cleaning<br />
of eluate with usage concentrated sulfuric acid. High<br />
performance liquid chromatography on Separon SGX C 18<br />
with UV detection at 224 nm was last, fourth step. The mobile<br />
s457<br />
phase was acetonitrile – water (1 : 1) pumped at a flow-rate<br />
of 1.0 ml min –1 . Retention time of DBP was ca. 3.5 min. and<br />
DEHP ca 8 min.<br />
M a t e r i a l s<br />
32 chickens ROSS 308 were used in our work. Chickens<br />
were separated into four groups of eight Chickens depending<br />
on ingredients in feeding mixture. Chickens in second group<br />
were fed common feeding mixture fortificated by 3% coleseed<br />
oil with low phthalate content into BR2 and 5% into<br />
BR3. In this case, vegetative oil was stored in the tin container.<br />
Common feeding mixture with 3% coleseed oil with<br />
high phthalate content added into BR2 and 5% into BR3 was<br />
fed by third group. Coleseed oil for third group was stored in<br />
plastic wrapping. The fourth group was comprised by chickens<br />
fed by routine feeding mixture with addition 3% animal<br />
fat into BR2 and 5% into BR3. 42 days old chickens were<br />
butchered and their muscles, skin, fat and liver were used for<br />
making samples for analysing. Samples were lyophilisated<br />
and before next analysing were hold in freezer in –18 °C.<br />
Table I illustrates contents of both phthalates in feeding mixture<br />
used in our work.<br />
Table I<br />
Contents of both phthalates in ingredients added to feeding<br />
mixture<br />
DBP DEHP ΣDBP + DEHP<br />
[mg kg –1 ] [mg kg –1 ] [mg kg –1 ]<br />
Coleseed oil<br />
(tin)<br />
15.56 <strong>2.</strong>25 17.81<br />
Coleseed oil<br />
(plastic)<br />
51.35 < 0.20 51.35<br />
Animal fat 43.28 <strong>2.</strong>10 45.38<br />
Results<br />
Figs. 1.–4. represents chickens separated into four groups<br />
groups depending on kind of ingredients in feeding mixture.<br />
Each figure expresses average value of contents DEHP and<br />
DBP in edible part of chicken’s body. Fig. 1. demonstrates<br />
real average contents of phthalates in muscle (0.35 mg kg –1<br />
DEHP; 0.22 mg kg –1 DBP), skin (1.18 mg kg –1 DEHP;<br />
0.36 mg kg –1 DBP), fat (1.36 mg kg –1 DEHP; 0.47 mg kg –1<br />
DBP) and liver (0.16 mg kg –1 DEHP; 0.02 mg kg –1 DBP) in<br />
group of chickens fed by common feeding mixture without<br />
phthalate addition. Findings in muscle (0.08 mg kg –1 DEHP;<br />
0.08 mg kg –1 DBP), skin (1.10 mg kg –1 DEHP; 0.51 mg kg –1<br />
DBP), fat (1.92 mg kg –1 DEHP; 0.49 mg kg –1 DBP) and liver<br />
(0.24 mg kg –1 DEHP; 0.11 mg kg –1 DBP) of second group is<br />
depicted in Fig. <strong>2.</strong> Contamination of muscle (0.32 mg kg –1<br />
DEHP; 0.15 mg kg –1 DBP), skin (1.38 mg kg –1 DEHP;<br />
0.57 mg kg –1 DBP), fat (3.27 mg kg –1 DEHP; 1.28 mg kg –1<br />
DBP) and liver (0.16 mg kg –1 DEHP; 0.03 mg kg –1 DBP) of<br />
chickens of third group shows Fig. 3. In fourth group we determined<br />
following contents of phthalates: muscles (0.39 mg kg –1<br />
DEHP; 0.22 mg kg –1 DBP), skin (1.60 mg kg –1 DEHP;
Chem. Listy, 102, s265–s1311 (2008) Environmental Chemistry & Technology<br />
0.44 mg kg –1 DBP), fat (1.85 mg kg –1 DEHP; 0.74 mg kg –1<br />
DBP) and liver (0.23 mg kg –1 DEHP; 0.13 mg kg –1 DBP).<br />
Fig. 1. First group of chickens fed by common feeding mixture<br />
Fig. <strong>2.</strong> Second group of chickens fed by common feeding mixture<br />
with addition of coleseed oil with low phthalates content<br />
Conclusions<br />
Our measurements proved lipophilic character of phthalates,<br />
which were accumulated in chicken’s fat tissue and<br />
skin. That means that fat tissue is useful indicator of phthalates<br />
contamination. Liver, despite containing more fat than<br />
muscles, had lower values of phthalates mainly because of<br />
their enzymatic base, which were transforming phthalates to<br />
metabolites. Relatively high contents of phthalates in control<br />
group points at ubiquitous content of these contaminants.<br />
The values of DEHP and DBP were identically higher in all<br />
samples.<br />
s458<br />
Fig. 3. Third group of chickens fed by common feeding mixture<br />
with addition with coleseed oil with high phthalates content<br />
Fig. 4. Fourth group of chickens fed by common feeding mixture<br />
with addition of animal fat<br />
Acknowledgement (This work has been supported by<br />
Czech National Agency for Agriculture Research (NAZV CR),<br />
project QG60066/2005).<br />
REFEREnCES<br />
1. Wormuth M., Scheringer M., Vollenweider M., Hungerbuhler,<br />
K.: Risk Anal. 26, 803 (2006).<br />
<strong>2.</strong> Schmidt R. H., Rodrick G. E.: Food Safety Handbook.<br />
Wiley, new Jersey 2003.<br />
3. Schettler T.: Int. J. Androl. 29, 134 (2006).
Chem. Listy, 102, s265–s1311 (2008) Environmental Chemistry & Technology<br />
P63 PuRIFICATION PROCESS INFLuENCE ON<br />
ThE PAh DETERMINATION IN REAL SOIL<br />
SAMPLES<br />
MICHAELA STOUPALOVá, MILADA VáVROVá,<br />
LUDMILA MRAVCOVá and VLADIMíR VEČEREK<br />
University of Veterinary and Pharmaceutical Sciences Brno,<br />
Faculty of Veterinary Hygiene and Ecology<br />
Palackého 1–3, 612 42 Brno, Czech Republic,<br />
stoupalovam@vfu.cz<br />
Introduction<br />
The analytical procedure usually consists of several partial<br />
steps: the isolation of analytes, extract purification, and<br />
the concentration of monitored analytes 1 . environmental<br />
analysis currently tends to use such analytical procedures to<br />
allow the reliable and fast determination of monitored substances<br />
at the lowest possible costs. In the field of sample preparation,<br />
attention is devoted particularly to the combination<br />
of methods which enable the selective extraction of analytes<br />
followed by their concentration. The accuracy and precision<br />
of measurement in particular are monitored in the instrumental<br />
end-point as they are closely linked to the selectivity and<br />
sensitivity of analytical instruments. A special emphasis is<br />
laid on the confirmation techniques which should prove the<br />
results obtained using a typical method and reduce the risk of<br />
false-positive and false-negative results 2,3 .<br />
Polycyclic aromatic hydrocarbons (PAHs) are formed<br />
in the incomplete combustion of organic matter, for example<br />
during combustion of fossil fuel or wood, in running engines<br />
of motor vehicles, during fire and during free incineration of<br />
biomass or municipal waste 4 . They are also produced naturally,<br />
for example in active volcanoes.<br />
Individual PAHs differ significantly by their properties<br />
which define their potential risks. They are characterized by<br />
great variability in terms of toxic, physicochemical and chemical<br />
properties that may affect the environment. They produce<br />
different effects on individual species and the link<br />
between toxicity of individual PAHs and their structure<br />
is currently being investigated 5 .<br />
Experimental<br />
The effect of the purification procedure on the content of<br />
analytes was investigated in samples of soil. The isolation of<br />
PAHs from soil was performed using microwave extraction.<br />
Samples were purified using column chromatography. HPLC<br />
was used as final analytical method.<br />
e x t r a c t i o n<br />
The isolation of PAHs from soil was performed using<br />
microwave extraction. The extraction step lasted 25 minutes,<br />
at a temperature of 120 °C and an input of 1,200 W, by using<br />
20 ml of a hexane/acetone (1 : 1) mixture. Microwave extraction<br />
provided two sets of samples; each set was subsequently<br />
subjected to a different purification method.<br />
s459<br />
P u r i f i c a t i o n<br />
We monitored influence of the purification process on<br />
the determination of monitored analytes. We carried out comparison<br />
of two purification process.<br />
Purification 1: Samples were cleaned-up using column<br />
chromatography on a silica column (5 g). The sample was<br />
applied on the top of the column; 10 ml of hexane were<br />
applied on the top of the column prior to the complete adsorption<br />
of the sample on the column, followed by elution with<br />
5 ml of an eluting mixture consisting of hexane : dichloromethane<br />
(1 : 1) and finally with 10 ml of the same mixture. The<br />
last fraction was collected.<br />
Purification 2: The samples in the second set were purified<br />
using column chromatography on a column with silica<br />
gel (4 g) and florisil (4 g). The sample was applied directly<br />
on the prepared column. The column was washed with 60 ml<br />
of a hexane : dichloromethane (1 : 1) mixture prior to the complete<br />
adsorption of the sample into the sorbent. The whole<br />
eluate was collected.<br />
H P L C<br />
The determination itself was performed using the HPLC<br />
Agilent 1100 Series with a DAD and FLD detectors. The<br />
HPLC determination was carried out under following conditions:<br />
gradient elution (A = 60 % water/40 % acetonitrile;<br />
B = 100 % acetonitrile); 0 min A, 30 min B, 40 min. B, 42<br />
min A For separation SUPELCOSIL LC-PAH column was<br />
used (25 cm × <strong>2.</strong>1 mm × 5 µm). The flow-rate of the mobile<br />
phase was constant, 0.4 ml min –1 , temperature 30 °C. FLD<br />
settings were: 0–17.4 min λ ex = 260 nm, λ em = 350 nm;<br />
17.4–42 min λ ex = 260 nm, λ em = 420 nm. DAD setting was:<br />
λ = 225 nm.<br />
Results<br />
The main aim of this work was to investigate the effect<br />
of the purification process on the content of monitored PAHs<br />
in the real samples of soil. For better clarity, the results are<br />
provided in graphs and expressed in percentage; for assessment,<br />
the values determined in the first set of samples (purification<br />
on silica) were chosen as 100 % for assessment purposes.<br />
The results are presented in Figs. 1.–3. for individual<br />
samples of soil.<br />
It follows from Fig. 1. that both purification techniques<br />
provided comparable results. Fig. <strong>2.</strong> shows the results for<br />
Fig. 1. Influence of a purification procedure – soil A
Chem. Listy, 102, s265–s1311 (2008) Environmental Chemistry & Technology<br />
Fig. <strong>2.</strong> Influence of a purification procedure – soil B<br />
Fig. 3. Influence of a purification procedure – soil E<br />
soil B, better results were obtained using the first purification<br />
method where the third fraction was the only fraction<br />
analysed. Samples of soil C exhibited a common trend for<br />
lower-molecular-weight PAHs where the method of extract<br />
s460<br />
purification had hardly any effect on the final content in the<br />
given matrix. On the contrary, the second purification method<br />
using two sorbents (silica gel and florisil) was proven optimal<br />
for the PAHs with higher molecular weight.<br />
Conclusions<br />
However, in this context it is important to point out that<br />
the yield of pre-analytical techniques is significantly influenced<br />
by the sample matrix by the way of matrix effects. The<br />
structure and chemical qualities of individual PAH also plays<br />
an important role.<br />
This work has been supported by by the grant given by<br />
Ministry of Education, Youth and Sports of the Czech Republic<br />
no. 621571240<strong>2.</strong><br />
REFEREnCES<br />
1. Poustka J.: Dissertation. VSCHT Prague, Prague, Czech<br />
Republic, 1995.<br />
<strong>2.</strong> Kocourek V., Hajšlová J., Holadová K.: Methods of<br />
xenobiotics determination in food. Laboratory Manual.<br />
Part III. VÚPP, STIPP Prague, 199<strong>2.</strong><br />
3. Kocourek V., Vávrová M., Uhnák J.: Methods of xenobiotics<br />
determination in food. Laboratory Manual. Part<br />
II. VÚPP, STIPP Prague, 1990.<br />
4. Jech L. Polycyclic aromatic hydrocarbons (PAHs).<br />
AXYS-VARILAB s.r.o., Prague, 2006.<br />
5. Jelínková G.: Diploma thesis. VUT Brno, Brno, Czech<br />
Republic, 2003.
Chem. Listy, 102, s265–s1311 (2008) Environmental Chemistry & Technology<br />
P64 OPTIMALIZATION OF SPME METhOD<br />
FOR SPICE CONTENTuAL SubSTANCES<br />
DETERMINATION<br />
MICHAELA STOUPALOVá, MILADA VáVROVá,<br />
HAnA PLESKAČOVá, LUDMILA MRAVCOVá and<br />
VLADIMíR VEČEREK<br />
University of Veterinary and Pharmaceutical Sciences Brno,<br />
Faculty of Veterinary Hygiene and Ecology<br />
Palackého 1–3, 612 42 Brno, Czech Republic<br />
stoupalovam@vfu.cz<br />
Introduction<br />
The SPME method can be used to extract analytes from<br />
different matrices. It has been employed in the isolation of<br />
analytes from the air, food, water, and other matrices 1 . The<br />
SPME method has a number of major advantages such as fast<br />
rate, high sensitivity and good accuracy; the detection limit<br />
regularly achieved for the above-mentioned matrices ranges<br />
in ng kg –1 . First published in 1989, the SPME method is now<br />
a well established extraction method whose application has<br />
been assessed and documented 2 .<br />
The analyses of organic, fragrant, and flavouring components<br />
as well as sample preparation are usually started<br />
with the concentration of an analyte. If one considers a time<br />
demand, the passive SPME sampling technique is the quickest,<br />
with sample preparation not exceeding 30 minutes 3 .<br />
The consistency of the results and the reliability of detection<br />
with SPME as well as repeatability and reproducibility<br />
are influenced by a number of factors, like polymer polarity<br />
and the thickness of a polymer layer (stationary phase) on<br />
the surface of a fibre, the sampling method, the pH, the ionic<br />
strength of a solution, sample temperature, agitation, etc.<br />
Experimental<br />
The objective of this paper was the optimization of solid<br />
phase microextraction (SPME) method, which is used for<br />
determination of the essential oils in spice. Analytes were<br />
analysed by GC/MS.<br />
S P M E<br />
The SPME method was investigated with different<br />
fibers (polydimethylsiloxane – 100 μm thickness and polydimethylksiloxayne-divinylbenzene<br />
– 65 μm), extraction time<br />
(1; 2; 5; 10; 15; 20; 30; 40 and 60 minutes), extraction temperature<br />
(30; 40 and 50 °C) and incubation of sample (0; 5;<br />
10; 15; 20 minutes).<br />
G C / M S<br />
The determination itself was performed using the<br />
GC 6890n (Agilent Technologies, USA) with a massspectrometric<br />
detector 5973n MSD (Agilent Technologies,<br />
USA); for separation HP-5MS capillary column was used<br />
(30 m × 0.25 mm × 0.25 μm). The injector temperature was<br />
270 °C, the ion source temperature was 230 °C and the<br />
Transfer Line temperature was 250 °C. The temperature<br />
s461<br />
programme was 45 °C for period of 2 minutes, 5 °C min –1<br />
to 200 °C, 200 °C for period of 2 minutes; the total analysis<br />
time was 35 minutes. The flow-rate of the carrier gas (He)<br />
was constant, 1 ml min –1 .<br />
Results<br />
The aim hereof was to optimise the SPME method for<br />
determination of the essential oils in spice. We monitored<br />
influence of the stationary phase on the sorption of monitored<br />
analytes. We carried out comparison of two PDMS fibres<br />
(100 μm) and PDMS-DVB (65 μm). The results obtained are<br />
stated in Fig. 1. From it follows that the PDMS-DVB fibre<br />
(65 μm) shows higher sorption effectivity for all the monitored<br />
pesticides.<br />
Fig. 1. Influence of the fibre type on response of detectors for<br />
the monitored analytes<br />
Also the influence of temperature on sorption of the target<br />
compounds was monitored. The following temperatures<br />
were tested: 30, 40 and 50 °C. Lower-molecular-weight terpenes<br />
were shown to have the best responses at a temperature<br />
of 30 °C while for the medium-molecular-weight terpenes<br />
(around 150 g mol –1 ), the effect of different temperature on<br />
the adsorption of analytes wasn’t so strong. Terpenes with the<br />
highest molecular weight (204 g mol –1 ) exhibited the highest<br />
response at a temperature of 50 °C. On the basis of the results<br />
and literature data, the sorption value at 30 °C was selected.<br />
Various sorption times were measured (1; 2; 5; 10; 15;<br />
20; 30; 40, and 60 minutes) at temperature of 30 °C. The time<br />
of 15 minutes seems to be suitable for both the sensitivity and<br />
a good repeatability.<br />
This study also investigated the effect of sample conditioning<br />
before analyte sorption. The conditions of analysis<br />
Fig. <strong>2.</strong> Influence of the incubation time on response of detectors<br />
for the monitored analytes
Chem. Listy, 102, s265–s1311 (2008) Environmental Chemistry & Technology<br />
Table I<br />
RSD in determination of analytes<br />
Analyte RSD Analyte RSD<br />
α-pinene 13 menthone 32<br />
camphene 11 borneol 18<br />
sabinene 14 estragol 28<br />
β-pinene 9 α-cubebene 12<br />
β-myrcene 7 thymol acetáte 38<br />
α-phellandrene 10 ylangene 31<br />
3-carene 7 copaene 27<br />
α-terpinene 7 α-bourbonene 34<br />
2-nitro-p-cymene 3 isocaryophyllene 35<br />
limonene 23 β-caryophyllen 26<br />
eucalyptol 8 humulene 31<br />
γ-terpinene 4 α-caryophyllen 36<br />
β-terpineol, cis- 15 isoledene 32<br />
linalool 13 α-muurolene 36<br />
thujone 22 epizonarene 36<br />
camphor 12 karyophyllene oxide 34<br />
were as follows: the duration of sorption was 15 minutes at<br />
a temperature of 30 °C. This temperature was also used for<br />
sample conditioning. Fig. <strong>2.</strong> shows the comparison between<br />
the different durations of sample conditioning (0; 5; 10; 15;<br />
20 minutes) and it is seen that the 5-minute conditioning is<br />
the most suitable as it gives the highest response for the majority<br />
of target analytes.<br />
The repeatability of the method was determined based<br />
on 5 repetitions and is expressed as a relative standard devi-<br />
s462<br />
ation (Table I). Terpenes are listed in the table according to<br />
their increasing molecular weight. It follows from the results<br />
that lower-molecular-weight terpenes have better repeatability<br />
than more volatile terpenes with higher molecular weight.<br />
Standard deviations vary in a rather wide range of 28–38 %<br />
for substances with higher molecular weight which may be<br />
attributed to the optimization of the SPME method where<br />
some parameters (particularly the duration and temperature<br />
of sorption) were chosen at such levels to match for the whole<br />
group of 32 monitored substances.<br />
Conclusions<br />
SPME conditions used for optimalization of head-space<br />
method were follows: 15 min exposition of PDMS-DVB<br />
(65 µm) fiber at 30 °C in head-space above 0.5 g of spice<br />
sample in vial. The incubation of sample was 5 minutes at<br />
extraction temperature 30 °C.<br />
This work has been supported by by the grants given by<br />
Ministry of Education, Youth and Sports of the Czech Republic<br />
no. 621571240<strong>2.</strong><br />
REFEREnCES<br />
1. Shao Y. et al.: Flavour and Fragrance Journal 18, 5<br />
(2003).<br />
<strong>2.</strong> López P., et al.: Analytica Chimica Acta 559, 97 (2006).<br />
3. Holadová K., Prokůpková G., Hajšlová J., et al.: Analytica<br />
Chimica Acta 582, 24 (2007).
Chem. Listy, 102, s265–s1311 (2008) Environmental Chemistry & Technology<br />
P65 DTA AND FLuORESCENCE SPECTRA OF<br />
huMIC ACIDS AS INDICATORS OF huMAN<br />
INFLuENCE ON SOIL<br />
nORA SZOMBATHOVá a , JÖRG LUSTER b , BOŽEnA<br />
DEBSKA c , AnTOn ZAUJEC a , MILAn MACáK a ,<br />
VLADIMíR ŠIMAnSKý a , ERIKA TOBIAŠOVá a and<br />
JURAJ CHLPíK a<br />
a Department of pedology and geology, Slovak University of<br />
Agriculture, Tr. A. Hlinku 2, 949 76 Nitra, Slovakia,<br />
b Swiss Federal Research Institute WSL, Zürcherstrasse 111,<br />
CH-8903 Birmensdorf, Switzerland,<br />
c Department of Environmental Chemistry, University of<br />
Technology and Agriculture, Bernardynska 6, 85-225 Bydgoszcz,<br />
Poland,<br />
nora.szombathova@uniag.sk<br />
Introduction<br />
Humic substances (HS) are the most abundant and stable<br />
organic C forms found in soil. Based on their solubility in<br />
alkaline and acid solutions they can be divided into humic<br />
acids (HA), fulvic acids (FA) and humin. Spectroscopic measurements<br />
provide valuable information on the nature of soil<br />
HS, they are nondestructive, require only small amounts of<br />
sample, and are experimentally simple as referred by Stevenson<br />
6 . Thermal analysis curves, heat fluxes, absorption and<br />
fluorescence properties can provide useful information on<br />
nature, origin, chemistry and structure of HS Blaser et al. 2 ;<br />
Gonet et al. 3 , Senesi et al. 5 .<br />
In this study we investigated differences in absorptive,<br />
fluorescence and thermal characteristics between humic acids<br />
isolated from humus horizons of soils with different land use<br />
(agroecosystem and forest ecosystem).<br />
Experimental<br />
Samples were collected from A-horizons of soil pits<br />
dug on cultivated and nearby oak-hornbeam forest soils from<br />
locality Báb (south-western Slovakia). The parent material<br />
was calcareous loess. Samples were compared in two pairs:<br />
• Profiles 1 and 2 – located at an upland position, 80 m<br />
apart: 1 – forest soil, Luvic Phaeozem, 2 – cultivated<br />
soil, Haplic Chernozem<br />
• Profiles 3 and 4 – located at a colluvial foot slope, 60 m<br />
apart: 3 – forest soil, 4 – cultivated soil, both on Orthic<br />
Luvisol<br />
Humic acids (HA) were isolated by Orlov 4 method.<br />
Total luminescence spectra (TLS) of HA were recorded on a<br />
Shimadzu RF5000 spectrometer, and absorption spectra on a<br />
Shimadzu UV 240. For measuring, the stock solutions were<br />
diluted to organic C concentration 10 mg dm –3 , and adjusted<br />
to pH 7. TLS excitation slit width was set to 5 nm, emission<br />
to 3 nm. TLS were recorded as a series of 10 synchronous<br />
scan spectra with differences between excitation and emission<br />
wavelength (λ ex /λ em ) of 25 nm.<br />
s463<br />
Thermal properties were recorded on Derivatograph C<br />
– MOM Hungary. Detailed information concerning differential<br />
thermal analysis (DTA) was presented by Gonet et al. 3 .<br />
Based on the results, value “Z”, proportional to “aliphaticity”<br />
of HA was calculated. It expresses the ratio of weight loss in<br />
low temperature (endo + exo1) to weight loss in high temperature<br />
range (exo2).<br />
Results and Discussion<br />
The absorbance ratios of UV-VIS spectra are listed in<br />
Table I. Stevenson 6 stated that UV-VIS spectra of HA are<br />
broad, featureless and monotonously decreasing with increasing<br />
wavelength, thus absorbance ratios were used in determining<br />
their chemical structure. A 280/465 ratio reflects the<br />
proportion between the lignin structures more resistant to<br />
humification and materials at the initial stage of transformation,<br />
A 280/665 – ratio between groups resistant to humification<br />
and strongly humified ones, A 465/665 decreases with increasing<br />
molecular weight and condensation. In our study, higher<br />
values of absorbance ratios indicated that HA from forest soil<br />
content more lignin type compounds and had lower degree of<br />
aromatic structures condensation than that from the cropped<br />
soil.<br />
Table I<br />
Ratios of humic acid absorbances, fluorescence peak positions<br />
and intensities<br />
λ ex /λ em λ ex /λ em<br />
Profile A 280/665 A 280/465 A 465/665 455/515 310/480<br />
peak intensities [a.u]<br />
forest,<br />
upland<br />
5.25 28.33 5.40 280 245<br />
cultivated,<br />
upland<br />
4.53 2<strong>2.</strong>46 4.96 > 350 < 350<br />
forest,<br />
slope<br />
5.06 28.00 5.53 315 280<br />
cultivated,<br />
slope<br />
4.67 21.54 4.62 > 350 315<br />
Table II<br />
Thermal properties of humic acids<br />
Area under DTA effects<br />
Profile [% of total] Z<br />
endo exo1 exo2<br />
forest, upland 4.1 57.6 38.3 1.61<br />
cultivated, upland <strong>2.</strong>6 35.6 61.8 0.62<br />
forest, slope 4.4 51.6 44.0 1.27<br />
cultivated, slope 5.7 31.3 63.0 0.59<br />
Three-dimensional total luminescence spectra (TLS)<br />
enable detailed view with more complete information than<br />
simple excitation, emission, or synchronous scan spectra<br />
Blaser et al. 2 . TLS of studied HA (Table I) performed two
Chem. Listy, 102, s265–s1311 (2008) Environmental Chemistry & Technology<br />
major peaks, a first at λ ex /λ em = 455/515 indicating highly<br />
conjugated aromatic compounds, like disubstituted<br />
coumarins, xanthones and quinones and a second peak at<br />
λ ex /λ em = 310/480 nm indicating simple phenolics like hydroxysubstituted<br />
benzoic and cinnamic acid derivatives<br />
Senesi et al. 5 . Peaks occured at the same positions, and differed<br />
only in fluorescence intensity, which was the highest at<br />
λ ex /λ em = 455/515 nm. This is evidence that HA from cultivated<br />
soils were more humified and polycondensed. Alberts<br />
et al. 1 reported, that the peak with similar λ ex /λ em = 455.7/<br />
510.6 nm was observed in HA form Hungarian soils.<br />
Thermal properties, mainly the degree of aliphaticity<br />
“Z” (Table II) was lower in HA isolated from cultivated soil<br />
(0.62 and 0.59) than HA from forest soil (1.61 and 1.27),<br />
what confirmed higher condensation of aromatic structures<br />
or humification degree of HA from cultivated soil.<br />
Conclusions<br />
Results of the present study confirmed that absorbance,<br />
fluorescence and thermal characteristics of HA can be a sensitive<br />
index of structural changes between cultivated and<br />
s464<br />
natural soils, thus, they can be used as an indicator of anthropogenic<br />
influence on soil.<br />
This work has been supported by grant VEGA 1/4432/07<br />
and VEGA 1/0092/08.<br />
REFEREnCES<br />
1. Alberts J. J., Takács M.: Org. Geochem. 35, 243 (2004).<br />
<strong>2.</strong> Blaser P., Heim A., Luster J.: Environ. Int. 25, 285<br />
(1999).<br />
3. Gonet S. S., Cieslewicz, J.: Environ. Int. 24, 629<br />
(1998).<br />
4. Orlov D. S., Grischina L. A.: Praktikum po chimii<br />
gumusa. MGU, Moskva, 1981.<br />
5. Senesi n., Miano T., Provenzano M. R., in: Humic Substances<br />
in the Aquatic and Terrestrial Environment.<br />
(Allard B., Borén H., Grimvall A., ed.), chapter V, p. 63.<br />
Springer, Berlin 1991.<br />
6. Stevenson F. J.: Humus chemistry. Genesis, composition,<br />
reactions. Wiley, new York 1994.
Chem. Listy, 102, s265–s1311 (2008) Environmental Chemistry & Technology<br />
P66 EVALuATION OF hEAVy METALS MObILITy<br />
IN SEDIMENTS FROM ThE hNILEC RIVER,<br />
SLOVAKIA<br />
OľGA ŠESTInOVá, Ján BREHUV, JOZEF<br />
HAnČUľáK, TOMISLAV ŠPALDOn and ERIKA<br />
FEDOROVá<br />
Institute of Geotechnics, Slovak Academy of Sciences, Watsonova<br />
45, 043 53 Košice, Slovak Republic,<br />
sestinova@saske.sk<br />
Introduction<br />
The contribution deals with the content and mobility of<br />
heavy metals: copper, nickel and lead in the samples of sediment<br />
load from drainage basin of the Hnilec River.<br />
The former mining activities with the following treatment<br />
of iron and copper ores have had negative effect on the<br />
region of Middle Spiš. The main anthropogenic sources of<br />
the contamination of environment come from the localities<br />
Krompachy, Rudňany and the surroundings of Spišská nová<br />
Ves, and also the river-basin of the Hnilec, the Ružín no. 1,<br />
the Palcmanská Maša reservoirs and an old environmental<br />
loads after mining activities in Smolník area. The flooded<br />
deposit in Smolník produces heavily mineralized acid waters<br />
that contaminate water and sediments of Smolník stream,<br />
Hnilec River and even Ružín reservoir. The deposit is not<br />
stable and negatively influences the surroundings 1 .<br />
Many sequential extraction methods were employed for<br />
the determination of particular forms of heavy metals contained<br />
in the sediments, differing in the number of the extraction<br />
steps, extraction solvents used extraction procedures.<br />
Leachate contains a group of elementary forms with similar<br />
physical and chemical properties. The extraction process evaluates<br />
the strength of bonding of the metal forms to different<br />
soil phases, to ion-renewable, carbonated, reducible, oxidable<br />
and finally to resistant residue 2 . The best known is the fivestep<br />
sequential extraction of soil published by Mc Laren and<br />
Crawford and Tessier 3 . This method can differentiate heavy<br />
metals held in the sediments in five steps. It can be applied to<br />
provide a quick indication of changed element mobility in the<br />
monitored locality 4 .<br />
Experimental<br />
C h a r a c t e r i s t i c o f t h e S e d i m e n t s<br />
The one-shot sequential extraction procedures were<br />
applied on eight sediment samples collected from the industrially<br />
polluted region of Central Spiš, Slovakia, localities of<br />
the Ružin no. 1 reservoir, the Palcmanská Maša reservoir and<br />
stream Smolník situated on the Hnilec River. The reference<br />
material of sediment from river Labe was also used for analysis.<br />
Sampling was realized in the year 2007 and total content<br />
of copper, nickel and lead were determined. Finally, the samples<br />
were dried, quartered, sieved under 1 mm and mineralised<br />
in a microwave pressure digestion system MWS-3.<br />
s465<br />
S e q u e n t i a l E x t r a c t i o n<br />
The sequential extraction was conducted under the following<br />
procedures: Fraction: A – released forms were determined<br />
in the extract of extraction solvent – 2M HnO 3 . The<br />
supernatant was filled up to 100 ml. The rest was used in the<br />
second step. This fraction contains metals bonded to sulphide<br />
and phosphate. Fraction: b – potentially mobile forms<br />
were determined in the extract of extraction solvent – 0.05M<br />
EDTA. This fraction contains metals in ion-changing form<br />
and bonded to carbonates. Fraction: C – mobile forms were<br />
determined in the extract of extraction solvent 0.1M CaCl <strong>2.</strong><br />
This fraction contains metals in ion-changing form. Fraction:<br />
D – residual forms presents extracted phase e. g. metals<br />
bonded to silicate structure and to a crystal lattice of primary<br />
minerals. The residuals were dried at room temperature.<br />
After drying and homogenization, the single extracts were<br />
measured by the absorption spectrometry method. Copper<br />
was determined by flame atomization and nickel and lead by<br />
graphite furnace atomic absorption spectrometry (VARIAn,<br />
Australia).<br />
Results<br />
Active soil reaction (pH) and oxidation-reduction potential<br />
is presented in Table I. It has shown that only sample SP<br />
(stream Smolník – mine Pech) was an acid sediment and the<br />
rest are slightly alkaline sediments. The increase of pH causes<br />
the growth of copper adsorption by colloid, clayey and<br />
organic material and thereby the mobility of copper in soil<br />
decreases 5 .<br />
Table I<br />
The description of sampling places and chemical composition<br />
of sediments taken in area of the Hnilec Rriver in 2007<br />
Locality pH<br />
Redox Organic Dry<br />
potential [mV] portion [%] basis [%]<br />
Ruzin VDR1 7.55 259 10.02 36.40<br />
Ruzin VDR2 7.25 254 10.18 54.52<br />
Ruzin VDR3 7.52 257 4.50 4<strong>2.</strong>40<br />
Pal. Masa PM1 7.52 257 18.85 29.54<br />
Pal. Masa PM2 7.60 259 13.78 34.86<br />
Pal. Masa PM3 7.73 262 15.89 31.25<br />
Pal. Masa PM4 8.06 265 18.20 39.9<br />
Smolník SP 3.3 355 26.01 53.7<br />
The results of copper, zinc, nickel and cadmium content<br />
determined in extraction solvents after extraction of sediments<br />
using sequential extraction are given in Table II.<br />
The results of sequential extraction are presented as the<br />
percentage yield of metal from sequential extraction, where<br />
100 % is total concentration of metal in sediment.<br />
The results in cumulation histogram (Fig. 1.) show that<br />
the highest concentrations of copper were determined in the<br />
fraction A in released forms and the highest percentage yield<br />
in sample VDR1, 2 with values 65.7 and 60.3 % respectively.<br />
The yields in the potentially mobile and mobile forms were
Chem. Listy, 102, s265–s1311 (2008) Environmental Chemistry & Technology<br />
Fig. 1. Cumulation histogram of the copper yields in fractions<br />
A–D of the sequential extracts of the sediments, RM – Reference<br />
Material-sediment, VDR1 – 3 Ružin No. 1 reservoir, PM1–4 Palcmanska<br />
Masa reservoir, SP – stream Smolník, mine Pech<br />
Fig. <strong>2.</strong> Cumulation histogram of the nickel yields in fractions<br />
A–D of the sequential extracts of the sediments, RM – Reference<br />
Material-sediment, VDR1 – 3 Ružin No. 1 reservoir, PM1–4 Palcmanska<br />
Masa reservoir, SP – stream Smolník, mine Pech<br />
s466<br />
Fig. 3. Cumulation histogram of the lead yields in fractions<br />
A–D of the sequential extracts of the sediments, RM – Reference<br />
Material-sediment, VDR1 – 3 Ružin No. 1 reservoir, PM1–4<br />
Palcmanska Masa reservoir, SP – stream Smolník, mine Pech<br />
low. In fraction D the highest values of yield were confirmed<br />
in samples PM2 64.1 % and SM 55.2 %.<br />
The Fig. <strong>2.</strong> presents the distribution of nickel in fractions.<br />
The highest concentration of nickel was determined in<br />
fraction D, where the highest yield was in sample PM4 80 %<br />
and the least in sample SP 16 %. In the other forms, the nickel<br />
content in yield was very low.<br />
According to Fig. 3., the highest concentrations of lead<br />
were found in fraction A, where the highest values of yield<br />
were in samples PM 3 64.2 % and PM 2 – 1 (54.4–51.6 %).<br />
In fraction B–C, the content of was in low percentage yield<br />
and the yield was higher in fraction D.<br />
The results of yield are given in Table III, where the total<br />
content of particular heavy metals Cu, ni, Pb in sediments<br />
were compared with the sum of metal concentrations in fraction<br />
A–D from sequential extraction. In sample PM2, 100 %<br />
yield of copper was determined.<br />
Table II<br />
Copper, nickel and lead content determined in extraction solvents after extraction of sediments using sequential extraction<br />
method, RM – Reference Material-sediment, VDR1 – 3 Ružin no. 1 reservoir, PM1–4 Palcmanska Masa reservoir, SP – stream<br />
Smolník, mine Pech<br />
Fraction Element Sediment contents [mg kg –1 ]<br />
RM VDR1 VDR2 VDR3 PM1 PM2 PM3 PM4 SP<br />
Cu 33.5 160.0 178.2 166.0 14.6 10.0 19.6 18.4 216.0<br />
A ni 3.3 9.6 4.6 5.7 7.0 5.1 7.4 4.5 0.3<br />
Pb 33.9 34.7 40.4 35.3 26.3 55.5 18.0 17.1 34.9<br />
Cu 6.0 13.4 2<strong>2.</strong>6 29.4 4.0 1.8 5.0 4.0 35.0<br />
B ni <strong>2.</strong>0 0.6 07 1.3 <strong>2.</strong>4 1.4 5.4 5.0 0.1<br />
Pb 4.1 <strong>2.</strong>9 4.2 6.4 3.7 6.7 <strong>2.</strong>7 <strong>2.</strong>1 4.4<br />
Cu <strong>2.</strong>0 5.2 6.8 <strong>2.</strong>8 0.8 0.5 1.0 1.2 6.2<br />
C ni 1.3 1.2 1.6 0.6 0.6 0.4 1.1 1.4 0.3<br />
Pb 1.7 1.6 <strong>2.</strong>3 0.8 0.8 1.1 0.8 0.6 1.2<br />
Cu 23.7 45.2 64.2 11.2 18.9 2<strong>2.</strong>0 0.3 20.8 306<br />
D ni 26.7 38.5 27.3 27.4 47.2 4<strong>2.</strong>6 51.3 47.4 7.1<br />
Pb 15.6 5.4 7.3 9.8 4.4 <strong>2.</strong>7 2 <strong>2.</strong>4 8.7
Chem. Listy, 102, s265–s1311 (2008) Environmental Chemistry & Technology<br />
Table III<br />
Analysis comparison of total dissociation and the sum of metal concentrations in the sequential extraction procedure of the<br />
sediment samples<br />
element<br />
Sediment [mg kg–1 RM VDR1 VDR2<br />
]<br />
VDR3 PM1 PM2 PM3 PM4 SP<br />
Sum of ex.st. 65.2 223.8 271.8 309.4 38.3 34.3 48.6 44.4 563.2<br />
Cu Total cont. 79.9 243.5 295.5 353.9 45.8 34.3 49.5 47.9 57<strong>2.</strong>0<br />
Yield % 81.6 91.9 9<strong>2.</strong>0 87.4 83.6 100 98.2 9<strong>2.</strong>7 98.5<br />
Sum of ex.st. 33.3 49.9 34.2 35.0 57.2 49.5 65.2 58.7 7.8<br />
ni Total cont. 35.5 66.0 8<strong>2.</strong>3 67.4 79.6 60.1 80.0 59.2 44.2<br />
Yield % 93.8 75.6 41.5 51.9 71.8 8<strong>2.</strong>4 81.5 98.5 17.6<br />
Sum of ex.st. 55.3 44.6 54.2 5<strong>2.</strong>3 35.2 66 23.5 2<strong>2.</strong>2 49.2<br />
Pb Total cont. 77.6 108 121 80 51 102 28 37 92<br />
Yield % 71.3 41.3 44.8 65.4 69 64.7 83.9 60 53.5<br />
The comparison of the sum of metal concentrations in<br />
the sequential extraction procedure with of total dissociation<br />
verified the suitability of the used method. Moreover,<br />
the RM LGC River Sediment was applied, where metal contents<br />
are copper – 83. 6 mg kg –1 , zinc – 439 mg kg –1 , nickel<br />
– 34.7 mg kg –1 and cadmium – <strong>2.</strong>7 mg kg –1 .<br />
Conclusions<br />
The one-shot sequential extraction, which characterise<br />
the individual forms of heavy metals bonds in the sediments,<br />
was used for the determination of heavy metals mobility in<br />
the contaminated sediments from the Hnilec River (Slovakia)<br />
area. 2M HnO 3 was used to define the released content<br />
including different fractions of elements according to their<br />
solubility. Potentially mobile and mobile forms represent the<br />
sum of risk element forms for the evaluation of sediment biotoxicity.<br />
In this connection, the sediments had low content<br />
of copper, nickel and lead in potentially mobile and mobile<br />
forms (fractions B–C). This fraction contains metals in ionchanging<br />
form and bond to carbonates.<br />
Lead and copper reached higher values and nickel was<br />
in the least concentration in fraction A (realised forms) in<br />
s467<br />
order Pb > Cu > ni. This fraction contains metals bonded to<br />
sulphide and phosphate.<br />
This work was supported by the Slovak Research and<br />
Development Agency, No 20-027705 and by the Slovak Grant<br />
Agency for Science VEGA.<br />
REFEREnCES<br />
1. Luptakova A.,: Flowed deposit Smolnik – the source of<br />
acid mining waters, 3rd Conference on Environment<br />
engineering, 81-85, 2006.<br />
<strong>2.</strong> Zavadska M., Zemberyova M., Farkasovska I.: Chem.<br />
papers 93, 391 (1999).<br />
3. Tessier A., Campbell P. G. C., Bisson M.: Anal. Chem.<br />
57, 844 (1979).<br />
4. Vojtekova V., Krakovska E.: Chem. papers 100,1096<br />
(2006).<br />
5. Takac P., Kozakova L., Valkova M., Zelenak F.: Acta<br />
Montanistica Slovaca 13(1), 82 (2008).
Chem. Listy, 102, s265–s1311 (2008) Environmental Chemistry & Technology<br />
P67 ELIMINATION OF SuLPhATES FROM wASTE<br />
wATER OF OLD MINING LOADS<br />
TOMISLAV ŠPALDOn, Ján BREHUV, JOZEF<br />
HAnČUľáK, OLGA ŠESTInOVá and ERIKA<br />
FEDOROVá<br />
Institute of Geotechnic of the Slovak academy of science,<br />
Watsonova 45, 043 53 Košice, Slovak republic,<br />
spaldon@saske.sk<br />
Introduction<br />
Heavy industry and the impact of mining, although being<br />
in decay, significantly facilitate the deterioration of quality<br />
of surface waters. Besides the technological water from the<br />
existing plants, there is a huge amount of secondarily polluted<br />
mining waters due to the rainfall. The rainfall water in the<br />
underground areas in old mining works gradually chemically<br />
and chemically and biologically reacts with the surrounding<br />
rock environment and brings amounts of harmful substances<br />
to the surface that pollute the surface waters. They include<br />
mainly heavy metals, sulphates, chlorides, phosphates and<br />
other substances.<br />
From the point of view of quality of surface waters the<br />
area in the vicinity of the municipality of Smolník has been<br />
known as one of the worst in Slovakia for a longer period of<br />
time and the brook of Smolník is ranked in the worst – the<br />
fifth degree of quality as a highly polluted brook.<br />
This work aims at the following: study the possibility<br />
of reduction of the concentration of the content of sulphates<br />
and other heavy metals set by the EU directives in the mining<br />
waters flowing from the old mining load of the deposit of<br />
Smolník.<br />
Table I<br />
Trend of mine water quality from Smolník in period from<br />
1986 to 2004 2<br />
Year SO 4 2– Fe Cu Mn<br />
[mg dm –3 ] [mg dm –3 ] [mg dm –3 ] [mg dm –3 ]<br />
1986 6,004 7<strong>2.</strong>0 37.2 43.3<br />
1987 4,634 51.2 39.4 65.8<br />
1991 1,155 7.0 11.1 1<strong>2.</strong>3<br />
1992 1,233 19.9 10.7 13.5<br />
1993 1,481 61.3 5.3 1<strong>2.</strong>8<br />
19941 1,350 57.8 7.2 11.3<br />
19942 4,000 155.0 11.8 11.0<br />
19943 9,512 914.7 51.3 104.7<br />
1995 5,825 77<strong>2.</strong>4 7.4 136.2<br />
1997 4,133 421.4 3.9 37.2<br />
2000 4,170 137.6 4.3 41.3<br />
2001 3,461 556.0 <strong>2.</strong>8 37.9<br />
2002 2,296 620.0 1.7 38.4<br />
2003 2,680 501.0 1.5 33.4<br />
2004 2,723 425.0 1.5 27.9<br />
s468<br />
Physical and Chemical Characteristics of the Mining<br />
water from the Deposit of Smolník<br />
Qualitative parameters of the running mining water<br />
were monitored systematically. The values often move significantly.<br />
They depend on the amount of rainfall, rainfall intensity,<br />
period of being held in the mining areas, place (depth),<br />
etc. A large number of floods and mainly fires in the mine<br />
caused huge increases of presence of Fe and Cu in the mining<br />
water. The mining fire by spontaneous combustion of pyrite<br />
in 1896–97 caused the increase of the Cu concentration up<br />
to 150 g dm –3 , in 1910 the Cu concentration increased even<br />
to 180 g dm–3 due to the fire! In 1923 57.6 tonnes of copper<br />
flew into the recepient. 1<br />
Table I evidently shows the gradual increase, culmination<br />
and finally the decrease of value of almost all indicators.<br />
Those changes were caused due to flooding and its completion.<br />
After almost four-year exposition of mining waters in<br />
the rock environment a strong mineralisation occurred and<br />
concentration of all components exceeded all permissible<br />
concentrations (they are exceeded today as well).<br />
E l i m i n a t i o n o f S u l p h a t e s u s i n g<br />
P r e c i p i t a t i o n a n d A l - I o n s .<br />
The concentration of sulphate ions in the tested water was<br />
2,984 mg dm –3 and pH 3.34. When making experiments with<br />
the mining water a HACH spectrophotometer, type DR 2000<br />
and a digital pH-meter WTW 330i were at our disposal.<br />
P r e c i p i t a t i o n o f S O 4 2 – I o n s O n l y<br />
a t P r e s e n c e o f C a ( O H ) 2 W i t h o u t<br />
A l 3 + I o n s<br />
•<br />
•<br />
•<br />
Methodological procedure of precipitation:<br />
Ca(OH) 2 – 15 minutes of mixing at 200 rpm,<br />
suspension filtering,<br />
determination of the content of sulphates and the pH<br />
value (see in Table II).<br />
Table II<br />
Results of mine water desulphatation by Ca(OH) 2 , Pech pit<br />
Ca(OH)<br />
Sample no. 2 pH SO4 2- effect<br />
[mg dm –3 ] [mg dm –3 ] des. [%]<br />
1 6 1<strong>2.</strong>59 2,400 19.6<br />
2 8 1<strong>2.</strong>60 2,362 20.8<br />
3 10 1<strong>2.</strong>61 2,385 20.1<br />
untreated<br />
water<br />
0 3.34 2,984 –<br />
As the required pH value is 1<strong>2.</strong>4 and more, Table II<br />
shows that the sufficient amount of Ca(OH) 2 is 5–6 g dm –3 .<br />
Higher amounts do not impact the pH values any longer.<br />
At the same time, one can observe that adding of lime itself<br />
has no significant impact on the reduction of the content of<br />
sulphates either. Out of the original approximate amount of<br />
2,984 g only 600 g were precipitated and that constitutes the<br />
efficiency of only about 20 %.
Chem. Listy, 102, s265–s1311 (2008) Environmental Chemistry & Technology<br />
P r e c i p i t a t i o n o f S O 4 2 – I o n s a t<br />
P r e s e n c e o f C a ( O H ) 2 a n d S o d i u m<br />
A l u m i n a t e ( A L R - F )<br />
Methodological procedure of precipitation is based on<br />
long range experiments of the scientific group from Technical<br />
university in Ostrava 3 : Best results of sulphates precipitation<br />
were obtained at pH value close to 1<strong>2.</strong>5.<br />
•<br />
•<br />
•<br />
•<br />
Ca(OH) 2 – 15 minutes of mixing at 200 rpm<br />
ALR-F –30 minutes of mixing at 200 rpm<br />
suspension filtering<br />
determination of the content of sulphates and the pH<br />
value<br />
Al ions changes to form hydrated calcium aluminates<br />
and part of arisen mineral ettringite, Fe ions change from<br />
bivalent to trivalent ferrous hydroxide and also remain in the<br />
mud.<br />
The results of those experiments are shown in<br />
Table III 5 .<br />
Table III<br />
Results of mine water desulphatation from Pech pit at optimal<br />
reagents dosing 4<br />
Sample Ca(OH) 2 ALR-F<br />
pH SO4 2– effect<br />
no.: [g dm –3 ] [ml dm –3 ] [mg dm –3 ] desul. [%]<br />
1 5.2 3.2 1<strong>2.</strong>56 118.28 96.03<br />
2 5.2 3.4 1<strong>2.</strong>56 199.60 93.31<br />
3 5.2 3.6 1<strong>2.</strong>56 49.92 98.32<br />
4 5.2 3.8 1<strong>2.</strong>56 45.28 98.48<br />
5 5.4 3.2 1<strong>2.</strong>56 64.40 97.84<br />
6 5.4 3.4 1<strong>2.</strong>56 123.28 95.87<br />
7 5.4 3.6 1<strong>2.</strong>55 65.00 97.82<br />
8 5.4 3.8 1<strong>2.</strong>55 49.64 98.33<br />
9 5.6 3.2 1<strong>2.</strong>58 114.40 96.17<br />
10 5.6 3.4 1<strong>2.</strong>58 4<strong>2.</strong>96 98.56<br />
11 5.6 3.6 1<strong>2.</strong>58 0.48 99.98<br />
12 5.6 3.8 1<strong>2.</strong>58 0.97 99.97<br />
E l i m i n a t i o n o f S u l p h a t e s U s i n g<br />
S o r b e n t s a n d I o n E x c h a n g e r s<br />
As opposed to the static regime when a sorbent or precipitation<br />
reagents are added to the water container when<br />
they are slowly mixed for a certain optimal time, in case of<br />
a dynamic regime the treated water continuously flows through<br />
the column the bed of which consists of a sorbent,<br />
a ion exchanger or a mixture with the sorbent. Experiments<br />
with the mining water from the shaft of Pech – Smolník<br />
were performed. The water was stabilised in the ratio of 5 ml<br />
HnO 3 (2M) per 1 litre. Elimination of sulphates can be reali-<br />
sed using the following methods:<br />
•<br />
•<br />
•<br />
•<br />
raw stabilised mining water,<br />
sorbent – active coal,<br />
ion exchanger – mixture 50 : 50 catex and anex,<br />
sorbent – zeolite (nižný Hrabovec) mineral form –clinoptilolite,<br />
structure - tectosilicate, empiric formula<br />
– (Ca,K 2 ,na 2 ,Mg) 4 Al 8 Si 40 O 96 . 24H 2 O,<br />
s469<br />
•<br />
•<br />
•<br />
•<br />
•<br />
mixture of 80 % of zeolite, 20 % cent of A–C,<br />
mixture 80 %of zeolite, 20 % of C–A,<br />
ion exchanger – cation exchanger – catex-strog acid<br />
Ostion,<br />
ion exchanger – anion exchanger – anex – light basic<br />
annex with styrene-DVB skeleton – Amberlite IRA-96,<br />
sorbent – slovakite (inorganic composite sorbent) – it<br />
is sorbent based on advantages of various minerals properties.<br />
Fig. 1. Graphic presentation of the desulphurisation effect at<br />
individual procedures<br />
Discussion to the Measured Results.<br />
Sulphates reduction is possible by various methods, like<br />
reversing osmosis, electrodialysis, ultrafiltration, diaphragm<br />
processes, but these methods are too expensive. Biological<br />
methods are long-lasting, that is why we used chemical processes,<br />
i.e. sorption by active coal, various sorbents and ion<br />
exchangers and precipitation by Al and Ca ions.<br />
Based on the results shown in Fig. 1. the success rate<br />
of individual reagents can be definitely set. The inorganic<br />
component sorbent slovakite may be considered as relatively<br />
successful. It was tested in the static regime as well and it was<br />
rather unsuccessful there. The result was surprising in case of<br />
the dynamic sorption. The efficiency of elimination of sulphates<br />
reached approximately 60 %. The efficiency of 43 %<br />
in case of the mixture of zeolite and the cation exchanger and<br />
the anion exchanger was caused only due to the small amount<br />
of the anion exchanger in the reagent. There was no practical<br />
effect of zeolite itself. Almost 100% efficiency was achieved<br />
by means of the anion exchanger what is in case of anion<br />
elimination logical 6 .<br />
Conclusion<br />
As the strict limits for waters discharged to the surface<br />
flows set by the European Union begin to come into force<br />
also in the recently acceded EU countries the issue of waters<br />
discharged from the old mining load of Smolník will have to<br />
be dealt with seriously very soon. Several options are offered.<br />
The use of ion exchangers would be probably very costly<br />
although a very efficient solution. The most probable solu-
Chem. Listy, 102, s265–s1311 (2008) Environmental Chemistry & Technology<br />
tion will be the use of physical and chemical methods, and<br />
namely their different combinations, such as neutralisation,<br />
precipitation by means of Al ions or sorption by means of<br />
composite sorbents.<br />
This paper was made under support of the Slovak grant<br />
agency VEGA within the project 2/7045/27 and the Agency<br />
for support of Research and Development based on Contract<br />
No. APVV-51-027705)<br />
REFEREnCES<br />
1. Jaško V.: Smolník: Komplexné hydrogeologické a hydrochemické<br />
posúdenie ložiska Cu – Fe rúd, Štúdia, Bratislava<br />
1966.<br />
<strong>2.</strong> Šlesárová A.: Doktorandská dizertačná práca. Košice<br />
2007.<br />
s470<br />
3. Vidlář J., Schejbal C. : Důlní vody s nadlimitním obsahem<br />
síranů a možnosti jejich čištění, Sborník vědeckých<br />
prací Vysoké školy báňské-Technické univerzity<br />
Ostrava, 1999.<br />
4. Heviánková S., Vidlář J., Špaldon T.: Tests of precipitation<br />
of sulphates from mining water, kwartalnik Górnictwo<br />
i Geoinžynieria, zeszit 3/2, Krakow 2005.<br />
5. Luptáková A., Špaldon T., Bálintová M.: Remedation of<br />
acid mine drainage by means of biological and chemical<br />
methods, IBS 2007, Frankfurt am Main, Biohydrometallurgy:<br />
From the single cell to the environment, p. 285,<br />
ttp Trans Tech publications Switzerland, 2007.<br />
6. Špaldon T.: Doktorandská dizertačná práca, Vysoká<br />
škola báňská, Ostrava 2007.
Chem. Listy, 102, s265–s1311 (2008) Environmental Chemistry & Technology<br />
P68 ARSENIC REMOVAL FROM wATER by<br />
SyNThETIC AKAGANEITE<br />
MIROSLAVA VáCLAVíKOVá a,c , KATARínA<br />
ŠTEFUSOVá a , GEORGE P. GALLIOS b and ŠTEFAn<br />
JAKABSKý a<br />
a Institute of Geotechnics, Slovak Academy of Sciences, Watsonova<br />
45, 043 53 Košice, Slovakia,<br />
b Laboratory of General. & Inorganic Chemical Technology,<br />
School of Chemistry, Aristotle University, 540 06 Thessaloniki,<br />
Greece,<br />
c School of Chemistry, Royal Military Academy, Renaissancelaan<br />
30, 1000 Brussels, Belgium,<br />
vaclavik@saske.sk<br />
Introduction<br />
Arsenic is considered one of the most toxic contaminants<br />
found in water-streams. It poses serious health risks<br />
to humans (e.g. cancer, cardiovascular and neurological effects).<br />
There are two main groups of arsenic pollution sources;<br />
natural (dissolution of As containing mineral ores) and<br />
anthropogenic sources (e.g. arsenic-based insecticides and<br />
pesticides, fertilizers, coal combustion, mining, semiconductor<br />
industies). The maximum contaminant level of arsenic in<br />
drinking water (both in EU and USA) is 10 μg dm –3 .<br />
Arsenic has several oxidation states (–3, 0, + 3, + 5) but<br />
the most common forms in natural waters are trivalent arsenite<br />
[As (III)] and pentavalent arsenate [As (V)]. The pH and<br />
the redox potential (Eh) of the aqueous system determine the<br />
predominant form of As; As (III) is dominant in reducing<br />
conditions while As (V) in oxidizing conditions. Generally,<br />
As (III) is considered to be more toxic than As (V) 1 .<br />
There are various methods for arsenic removal from<br />
water streams, such as sorption, ion-exchange, precipitation,<br />
coagulation and flocculation, reverse osmosis, membrane<br />
technologies, electrodialysis, biological processes as well as<br />
lime softening. A good overview 2 and a critical review 3 of the<br />
available methods are given recently. An effective and commonly<br />
used method for water treatment is sorption of arsenic<br />
on natural or synthetic sorbents. The most commonly used<br />
sorbents can be classified in two main groups: (i) sorbents<br />
based on iron compounds, which are the most frequently used<br />
(e.g. several iron (III) oxides/hydroxides, materials based on<br />
iron oxides/hydroxides, natural iron ores and waste materials<br />
containing iron particles) and (ii) sorbents based on aluminium<br />
compounds (e.g. activated alumina or gibbsite). Several<br />
other sorbents (clays, manganese dioxide, activated carbon,<br />
ion-exchange resins, biosorbents, etc.) have also been studied<br />
for As removal 2 .<br />
Experimental<br />
R e a g e n t s<br />
Analytical grade chemicals were used in all experiments.<br />
Model solutions were prepared by dissolving<br />
AsHna 2 O 4 . 7H2 O in deionized water, 0.01 M nanO 3 and<br />
s471<br />
0.1 M nanO 3 . The pH of the solutions was adjusted with suitable<br />
concentrations of naOH and HnO 3 .<br />
P r e p a r a t i o n a n d C h a r a c t e r i z a t i o n<br />
o f S o r b e n t<br />
Synthetic akaganeite was prepared by hydrolysis of partially<br />
neutralized FeCl 3 by addition of naOH. The precipitate<br />
thus obtained was centrifuged and it was subsequently submitted<br />
to dialysis to remove Cl – ions. The material was dried and<br />
used for arsenic sorption. XRD analysis 4 confirmed that the<br />
material produced was akaganeite. The specific surface area<br />
(measured by BET) was 151.3 m 2 g –1 .<br />
S o r p t i o n E x p e r i m e n t s<br />
The effect of pH, initial arsenic concentration, sorbent<br />
dose and temperature as well as ionic strength effect at arsenic<br />
sorption were studied in batch type experiments. The<br />
experiments were performed in a rotary shaker set at 30 rpm<br />
and equilibrium time 24 hours. Preliminary experiments have<br />
shown that equilibrium was established. The arsenic quantity<br />
in solutions was determined by AAS and spectrophotometry<br />
before and after the sorption experiments. The sorption capacity<br />
(Q) of akaganeite was calculated using the equation:<br />
C − C<br />
Q =<br />
C<br />
0 eq<br />
s<br />
where C 0 and C eq are the initial and equilibrium arsenic concentration,<br />
respectively and C s is the sorbent concentration<br />
in solution.<br />
Results<br />
E f f e c t o f S o l u t i o n p H<br />
It is well known that the solution pH plays an important<br />
role in all sorption experiments in aqueous systems. It determines<br />
the aquatic chemistry of the system under study (in this<br />
case As speciation) and also the charge density of the solid<br />
surface (sorbent). It is related to the sorption mechanisms and<br />
reflects the nature of the physicochemical interactions of the<br />
species in solution and the active sites on the sorbent 5 .<br />
The effect of solution pH on As (V) sorption on akaganeite<br />
was examinated at pH values <strong>2.</strong>0–9.0 at ambient temperature.<br />
Sorbent concentration in solution was 2 g dm –3 and<br />
initial arsenic concentration was 100 mg dm –3 . The results are<br />
given in Fig. 1. for various electrolyte (nanO 3 ) concentrations.<br />
The best sorption is observed at pH <strong>2.</strong>0. However, in<br />
this case, akaganeite is dissolved and iron was determined in<br />
filtrates. For this reason, all sorption experiments were carried<br />
out at pH 3.5, where no iron was found in solution. At<br />
this pH, the sorption capacity was a bit smaller than at pH <strong>2.</strong>0<br />
and around 40 mg As (V) g –1 of sorbent. This is considered<br />
quite good compared to the average value reported in the literature<br />
3 . The effect of the ionic strength was also studied by<br />
adding 0.01 and 0.1 M nanO 3 . It is shown that (Fig. 1.) the<br />
(1)
Chem. Listy, 102, s265–s1311 (2008) Environmental Chemistry & Technology<br />
effect can be considered as negligible. In a previous study 4<br />
the zeta potential of akaganeite was studied and the point of<br />
zero charge was found at pH 7.5. At pH 3.5, the zeta potential<br />
was around +20 mV and the predominant As (V) species<br />
is H 2 AsO 4 – . So, attractive electrostatic forces favour<br />
sorption. However, at pH 8.0, the zeta potential is negative<br />
and the predominant species is HAsO 4 –2 . electrostatic forces<br />
are repulsive but still sorption is achieved due to the existence<br />
of specific forces. Calculations with Geochemist Workbench<br />
(data not shown here) show that in the presence of<br />
iron mineral As (V) can form scorodite (iron arsenate) on the<br />
mineral surface and the maximum is obtained at pH <strong>2.</strong>0, This<br />
coincides very well with the maximum sorption at pH <strong>2.</strong>0 in<br />
our experiments (Fig. 1.). The existence of scorodite on akaganeite<br />
surface was also proved by FTIR spectra 6 . The chemical<br />
nature of the sorption can also explain the sorption of<br />
As (V) at pH 8.0. In our results, the effect of ionic strength<br />
was negligible. However, in the literature 6 a significant effect<br />
was observed, but with KnO 3 and in smaller sorbent<br />
concentrations (< 2 g dm –3 ). The effect was decreasing with<br />
increasing sorbent concentrations. This was attributed to<br />
the elimination of the negative charge of akaganeite by the<br />
potassium cations and the easier approach of As (V) species<br />
to the surface of the sorbent. It is well known that the increase<br />
of the ionic strength decreases the effective radius of the<br />
electric double layer. The arsenate species can come closer to<br />
the surface so that the attractive chemical forces overcome<br />
the electrostatic repulsion forces and sorption is achieved.<br />
Fig. 1. Effect of solution ph on As (V) sorption<br />
E f f e c t o f I n i t i a l A r s e n i c<br />
C o n c e n t r a t i o n<br />
The effect of initial arsenic concentration (20–<br />
200 mg dm –3 ) was studied with 2 g dm –3 sorbent concentration,<br />
ambient temperature and pH values 3.5 and 7.0. The<br />
results are given in Fig. <strong>2.</strong> (data points: experimental data,<br />
lines: isotherms). Sorption isotherms were evaluated (from<br />
experimental data) using the Freundlich model:<br />
Q KC<br />
= (2)<br />
b<br />
eq<br />
s472<br />
where Q is amount sorbed per unit mass of sorbent, K and b<br />
are constants and C eq is the equilibrium concentration. Freundlich<br />
sorption parameters (K, b, R 2 ) were calculated and are<br />
given in Table I. The maximum sorption capacity was around<br />
53 and 37 mg g –1 for pH values 3.5 and 7.0 respectively. The<br />
R 2 values show a good agreement of the model to the experimental<br />
data. As is expected, the K value (which shows the<br />
affinity of akaganeite to As (V) ) decreases with the increase<br />
of the pH.<br />
Fig. <strong>2.</strong> Sorption isotherms<br />
Table I<br />
Freundlich adsorption parameters<br />
pH Freundlich parameters<br />
K b R 2<br />
3.0 3<strong>2.</strong>26 0.10 0.98<br />
7.5 1<strong>2.</strong>84 0.23 0.97<br />
E f f e c t o f t e m p e r a t u r e<br />
The effect of temperature on arsenic sorption was investigated<br />
at initial arsenic concentration 100 mg dm –3 , sorbent<br />
concentration 2 g dm –3 and 4 different temperatures (ambient,<br />
30, 40 and 50 °C). The experimental results are presented<br />
in Table III. The maximum sorption capacity increased with<br />
increasing temperatures indicating an endothermic reaction<br />
6 . The maximum sorption capacity (at 50 °C) was around<br />
43 mg g –1 .<br />
Table II<br />
The effect of temperature<br />
T [°C] Q [mg g –1 ]<br />
ambient temperature 37<br />
30 38<br />
40 40<br />
50 43<br />
E f f e c t o f S o r b e n t D o s e<br />
The effect of sorbent dose was studied at ambient temperature,<br />
initial arsenic concentration 100 mg dm –3 and sorbent
Chem. Listy, 102, s265–s1311 (2008) Environmental Chemistry & Technology<br />
concentration range 0.5–10 g dm –3 . The results are presented<br />
in Table II. Increase of the sorbent dose in solution caused<br />
a decrease of akaganeite sorption capacity. However, this is<br />
not a good indicator of sorption ability, because with bigger<br />
sorbent concentrations all the available active sorption sites<br />
are not occupied. It is important to see what is the remaining<br />
As (V) concentration after treatment. In a real system this is<br />
the important factor; the remaining concentration should be<br />
below the limits. In the last column of Table III the remaining<br />
concentrations are given. It is observed a significant decrease<br />
of the remaining As (V) conc. with increase of the sorbent<br />
dose. It seems that a good dose is 5 g dm –3 , which gives a<br />
96 % removal and a satisfactory final As concentration of<br />
4 mg dm –3 .<br />
Table III<br />
The effect of sorbent dose<br />
C S [g dm–3 ] Q [mg g –1 ] C eq [mg dm –3 ]<br />
0.5 43.0 78.5<br />
1.0 41.4 58.6<br />
<strong>2.</strong>0 36.3 27.4<br />
5.0 19.2 4.0<br />
10.0 9.6 4.0<br />
Conclusions<br />
Synthetic akaganeite is a suitable sorbent for arsenic<br />
removal, especially at acidic environment. It is a low cost<br />
sorbent, as it is prepared from easily available cheap inorganic<br />
materials and has a good efficiency (above the average<br />
s473<br />
reported in the literature). It removes arsenic by chemical<br />
sorption favored by an increase of temperature and the best<br />
results are obtained at pH 3.5. However, at pH 7.0, gives<br />
also satisfactory results. This is important for the treatment<br />
of drinking water. The capacity of the material was not affected<br />
significantly with increased ionic strength (up to 0.1 M<br />
nanO 3 ). The experimental data follow (with good agreement)<br />
the Freundlich isotherm.<br />
Acknowledgement (This work has been supported by<br />
Slovak Research and Development Agency project No APVT-<br />
51-017104 and Scientific Grant Agency VEGA, project no.<br />
2/0087/08)<br />
REFEREnCES<br />
1. Smedley P. L., Kinniburgh D. G.: Appl. Geochem. 17,<br />
517 (2002).<br />
<strong>2.</strong> Vaclavikova M., Gallios G. P., Hredzak S., Jakabsky S.:<br />
Clean. Techn. Environ. Policy. 10, 89 (2007).<br />
3. Deliyanni, E. A., Peleka, E. n., Gallios, G. P., Matis, K.<br />
A.: Int J Envir & Waste Manag, (in press).<br />
4. Štefušová K., Václavíková M., Gallios G. P., Jakabský<br />
Š., Kozáková I., Ivaničová L., Gešperová D.: Proceedings<br />
of the 11th International Conference on Environment<br />
and Mineral Processing, Ostrava, 31 May –2 June<br />
2007, (Fečko P., Čablík V., ed.), Part II, p. 71 (Lecture).<br />
5. Aksu Z., Gönen F.: Process Biochem 39, 599 (2004).<br />
6. Deliyanni, E. A., Bakoyannakis, D. n., Zouboulis, A. I.,<br />
Matis, K. A.: Chemosphere 50, 155 (2003).
Chem. Listy, 102, s265–s1311 (2008) Environmental Chemistry & Technology<br />
P69 ThE EPR STuDy OF PARTICuLATE MATTER<br />
nADEŽDA ŠTEVULOVá, ADRIAnA EŠTOKOVá and<br />
PAVeL STOPKA<br />
Technical University of Košice, Civil Engineering Faculty,<br />
Institute of Building and Environmental Engineering, Vysokoškolská<br />
4, 042 00 Košice, Slovak Republic,<br />
Nadezda.Stevulova@tuke.sk<br />
Introduction<br />
In recent years the role of particulate matter in environmental<br />
and health areas has come under increased attention<br />
of experts and public. The PM 10 and PM <strong>2.</strong>5 (particle fractions<br />
related to their size) concentrations show higher correlation to<br />
the negative health effects in comparison to the total suspended<br />
particulate matter 1 . Building constructions and materials<br />
play an important role in indoor particulate matter contamination<br />
due to particles infiltration through joint construction<br />
leakages and material distribution and deposition processes 2 .<br />
The dust particles are dangerous not only because of<br />
their high concentrations in dependence on their particle size<br />
but also because of their nature 3 . The surface of the inhaled<br />
particles which determines the biological response is large.<br />
The surface reactivity of particles depends on the number of<br />
reactive spots on the dust particles surface and on the distribution<br />
of various sites (free radicals and paramagnetic species)<br />
at the surface 4 . It determines the pathogenic potential of<br />
inhaled particles.<br />
This work is concerned with the particulate matter reactivity<br />
investigation by concentration of surface active centres.<br />
Experimental<br />
Both total suspended particles (TSP) and PM 10 measurement<br />
includes integral sampling onto a collection material<br />
(membrane filter Synpor 0.8 µm pore size, 35 mm in diameter)<br />
by sampling equipment VPS 2000 (Envitech, Trenčín) at<br />
flow rate of 960 dm 3 h –1 during sampling period of approximately<br />
24 hours.<br />
The surface reactive spots concentrations of suspended<br />
particulate matter were detected on the spectrometer ERS<br />
220 (GAS, Berlin) with a resonator RSX 216 at room temperature<br />
under following conditions: the microwave power<br />
10 mW, modulation amplitude 0.02 mT, time constant 0.5 s.<br />
The relative intensity of the signals measured for investigated<br />
dust samples was determined by comparing them with those<br />
of Mn(II)/ZnS a Cr(III)/MgO as standard samples. The EPR<br />
spectrum was recorded as the first derivation of the absorption<br />
spectrum at the speed record 14.3 mT min –1 .<br />
The quantitative and qualitative interpretation of obtained<br />
spectra was performed by computer software Origin.<br />
Results<br />
Typical EPR spectra of investigated total suspended particulate<br />
mater and PM 10 samples are illustrated in Figs. 1.–3.<br />
s474<br />
Fig. 1. EPR spectra of total suspended particulates<br />
Fig. <strong>2.</strong> EPR spectrum of PM 10<br />
Fig. 3. Detail of PM 10 EPR spectrum<br />
Wide singlet peak centered at g factor value was identified<br />
in EPR spectra of particulates. The g factors range from<br />
<strong>2.</strong>010 to <strong>2.</strong>093 for measured particle samples as the Table I<br />
shows.<br />
Singlet peak superponed by triplet peak with factor<br />
values g 1 = <strong>2.</strong>1162, g 2 = <strong>2.</strong>0700, g 3 = <strong>2.</strong>0191 was identified<br />
in EPR spectrum of total particulate matter in Fig. 1. It<br />
could be an isotropic triplet (g = <strong>2.</strong>07) with splitting constant<br />
a = 7.6375 +/ 0.5495 mT.
Chem. Listy, 102, s265–s1311 (2008) Environmental Chemistry & Technology<br />
Table I<br />
G-factor values, ΔH pp and spin concentrations<br />
Sample g-factor ΔHpp [mT]<br />
Spin concentration<br />
[spin mg –1 ]<br />
TSP <strong>2.</strong>070 34.6 3.84 × 10 18<br />
TSP <strong>2.</strong>015 40.0 3.68 × 10 17<br />
TSP <strong>2.</strong>020 40.0 1.64 × 10 18<br />
TSP <strong>2.</strong>010 40.0 <strong>2.</strong>22 × 10 18<br />
PM10 <strong>2.</strong>093 472 <strong>2.</strong>01 × 10 18<br />
PM10 <strong>2.</strong>080 554.9 <strong>2.</strong>02 × 10 17<br />
PM10 <strong>2.</strong>055 410.8 <strong>2.</strong>06 × 10 17<br />
PM10 <strong>2.</strong>070 345.65 1.09 × 10 19<br />
The signals on EPR spectra recorded on the particulate<br />
samples were identified as a superposition of signals arising<br />
from various paramagnetic species. It is mainly the presence<br />
of transition metal ions in a low oxidation state, typically<br />
iron, which have to be regard as a possible cause of toxicity.<br />
In accordance with results obtained in paper 4 , the appearance<br />
of Fe 2+ on the surface of the dust particles and its subsequent<br />
oxidation to Fe 3+ in octaedric configuration leads to production<br />
of free radicals at solid-liquid interphase by direct<br />
reduction of atmospheric molecular oxygen. These sites may<br />
be implicated in the formation of dangerous active oxygen<br />
species in vivo.<br />
The total surface spin concentrations of particulate samples<br />
were determined in range from 3.68 × 10 17 to 3.84 ×10 18<br />
spin.g -1 for total suspended particulate matter and from<br />
<strong>2.</strong>02 ×10 17 to 1.09 ×10 19 spin g –1 for PM 10 . The significant<br />
difference between spin concentrations values of total<br />
s475<br />
suspended particulate matter and PM 10 was not found. The<br />
determined spin concentrations values are approximately 10 2<br />
times higher than spin concentrations values of mechanically<br />
activated quartz and silicon powders 5 .<br />
Conclusions<br />
The determined surface spin concentrations obtained<br />
from EPR spectra were high. But based on these experimental<br />
results of paramagnetic centres occurrence study explicitly,<br />
it cannot be expressily considered particulate matter to have<br />
toxic properties. The paramagnetic ions testing in special<br />
chemical reactions 6 used for this purpose may more accurately<br />
indicate potential risk of particulate matter toxicity.<br />
Acknowledgement: This work has been supported by<br />
Grant Agency of Slovak Republic (project No. 1/3342/06).<br />
REFEREnCES<br />
1. Marconi A.: Proceeding of Conference Healthy Buildings,<br />
p. 531. Helsinky, 2000.<br />
<strong>2.</strong> Sverak T.: Int. J. Mineral. Proces. 74, S379 (2004).<br />
3. Seinfeld J. H.: Atmospheric Chemistry and Physics of<br />
Air Pollution. Wiley, new York 1985.<br />
4. Volante M., Giamello E. et al: Proceeding of the 1 st<br />
International Conference on Mechanochemistry, p.125.<br />
Cambridge Interscience Publishing, Cambridge, 1994.<br />
5. Tkáčová K., Števulová n.: J. Mater. Res. 10, 2728<br />
(1995).<br />
6. Fenoglio I., et al: J. Mater. Synth. Proces. 8, 145<br />
(2000).
Chem. Listy, 102, s265–s1311 (2008) Environmental Chemistry & Technology<br />
P70 SELECTION OF PACKING MATERIALS FOR<br />
bIOFILTER DEVELOPMENT<br />
IVETA ŠTYRIAKOVá and ALEXAnDRA VAŠKOVá<br />
Institute of Geotechnics of the Slovac Academy of Sciences,<br />
Watsonova 45, 043 53 Košice, Slovakia,<br />
bacil@saske.sk<br />
Introduction<br />
natural materials that are available in large quantities<br />
may have potential as inexpensive sorbents. Cost effective<br />
alternative technologies or sorbents for treatment of metals<br />
contaminated waste streams are needed. A study 1 reported<br />
that zeolites, clinoptilolite in particular, demonstrate strong<br />
affinity for Pb and other heavy metals. Adsorbing Cd and<br />
Zn examined by both modifications with natural bentonite 2 .<br />
Results showed that the acid-treatment decreased the adsorption<br />
capacity, while the heat treatment did improve capacity.<br />
Retention of Pb and Zn on pure calcite was the subject of a<br />
number of investigations 3,4 . On the contrary, the number of<br />
sorption studies of both ions on magnesite is very limited.<br />
Investigations on the biosorption mechanism of heavy<br />
metals show that the metal ions are deposited by adsorption<br />
to the functional groups present on the cell wall. Dead as well<br />
as living cells are used in the removal of metal ions 5,6 . The<br />
batch adsorption experiments demonstrate that the surface<br />
complexation approach can be used successfully to quantify<br />
the adsorption of Cd in a mixed B. subtilis – quartz system as<br />
functions of both pH and solute/sorbent ratios 7 .<br />
We are interested in the surface complexation approach<br />
of zeolite, bentonite, calcite, magnezite and also these materials<br />
with bacteria in the behavior various heavy metals in the<br />
batch experiments. The objectives of this work were to determine<br />
the differences of mineral/water and mineral-bacteria/<br />
water interface in sorption capacities of metals.<br />
Experimental<br />
The biosorption experiments were carried out in Erlenmeyer<br />
flasks which contained 10 g samples and 100 ml<br />
medium. The medium contained (per liter) 0.5 g naH 2 PO 4 ,<br />
1.0 g (nH 4 ) 2 SO 4 , 0. g naCl, and 2 g glucose. The flasks were<br />
inoculated with a mixture of Bacillus cereus and B. megaterium<br />
(0.1 g wet bacteria dm –3 ) that had been previously isolated<br />
from Horná Prievrana. The two strains were purified by<br />
heat treatment at 80 °C for 15 min followed by streak plating<br />
on nutrient agar cultures. The isolates were identified with<br />
the BBL Crystal Identification System (Becton, Dickinson<br />
and Co., Franklin Lakes, nJ). For identification, the isolates<br />
were cultivated on Columbia agar plates per manufacturer’s<br />
instructions.<br />
The flasks were incubated under dynamic conditions<br />
(150 rev min –1 ) for 3 hours at 25 °C. The liquid phase was<br />
contained individual metals in 0.5mM concentration in the<br />
forms ZnSO 4 , CuSO 4 , PbCO 3 . The spent media (leachates)<br />
were sampled for metal analysis. The chemical controls<br />
s476<br />
did not receive an inoculum but were incubated under otherwise<br />
similar conditions.<br />
Solid residues were analyzed by X-ray diffraction using<br />
a Philips X’Pert SW–binary diffractometer with CuKα radia tion (40 kV, 50 mA), equipped with an automatic divergence<br />
slit, sample spinner, and a graphite secondary monochromator.<br />
Data were collected for 2–60 °2Θ with a step width of<br />
0.05 ° and a counting time of 30 s per 0.05 °. The mineralogy<br />
has been evaluated in quantitative terms from X-ray powder<br />
diffraction patterns using a Rietveld-based data processing<br />
technique.<br />
Quantitative changes in the liquid phase were measured<br />
with a Model 30 Varian atomic absorption spectrometer<br />
(Varian, Inc., Melbourne, Vic., Australia).<br />
Batch experiments were conducted to measure:<br />
• Zn, Cu, Pb and zeolite adsorption in a mixed singly<br />
metals – zeolite – Bacillus system<br />
• Zn, Cu, Pb and bentonite adsorption in a mixed singly<br />
metals – bentonite – Bacillus system second<br />
• Zn, Cu, Pb and quartz sands adsorption in a mixed singly<br />
metals – quartz sands – Bacillus system<br />
• Zn, Cu, Pb and calcite adsorption in a mixed singly<br />
metals – calcite – Bacillus system<br />
• Zn, Cu, Pb and magnezite adsorption in a mixed singly<br />
metals – magnezite – Bacillus system<br />
Z e o l i t e<br />
The natural materials, zeolite was obtained from nižný<br />
Hrabovec location in Slovakia. The mineralogical composition<br />
of zeolite was clinoptilolite 51–68 %, quartz + cristobalite<br />
9–20 %, feldspars 8–13 %, mica 13 % and iron minerals<br />
0.3 %.<br />
Table I<br />
Chemical composition of zeolite<br />
Components SiO 2 Al 2 O 3 Fe 2 O 3 MgO na 2 O<br />
% wt. 67.0 1<strong>2.</strong>3 1.3 0.7 0.7<br />
B e n t o n i t e<br />
The natural materials, zeolite was obtained from Lastovce<br />
location in Slovakia. The mineralogical composition<br />
of bentonite was smectite 63%, quartz 21%, kaolinite 11%,<br />
feldspars 4-6% and calcite 2%.<br />
Table II<br />
Chemical composition of bentonite<br />
Components SiO 2 Al 2 O 3 Fe 2 O 3 MgO na 2 O<br />
% wt. 59.2 18.6 <strong>2.</strong>8 4.2 0.7<br />
Q u a r t z S a n d s<br />
The natural materials, zeolite was obtained from nižný<br />
Hrabovec location in Slovakia. The mineralogical composi
Chem. Listy, 102, s265–s1311 (2008) Environmental Chemistry & Technology<br />
tion of zeolite was quartz 85 %, kaolinite 8 %, mica 6 % and<br />
iron minerals 3–5 %.<br />
Table III<br />
Chemical composition of quartz sands<br />
Components SiO 2 Al 2 O 3 Fe 2 O 3 MgO na 2 O<br />
% wt. 96.1 1.7 0.4 0.05 0.03<br />
C a l c i t e<br />
The natural materials, calcite was obtained from Horné<br />
Srnie location in Slovakia. The mineralogical composition of<br />
rock was calcite 80 %, quartz 5 %, kaolinite 2 %, plagioclase<br />
0.5 %, and iron minerals 0.7 %.<br />
Table IV<br />
Chemical composition of calcite<br />
Components SiO 2 Al 2 O 3 Fe 2 O 3 MgO na 2 O<br />
% wt. 11.8 3.9 1.2 0.8 0.05<br />
M a g n e z i t e<br />
The fired material of magnezite was obtained from Jelšava<br />
location in Slovakia. The mineralogical composition of<br />
sample was periclase 98 %.<br />
Table V<br />
Chemical composition of fired magnezite<br />
Components SiO 2 CaO Fe 2 O 3 MgO K 2 O<br />
% wt. 0.02 0.11 0.01 97.3 0.06<br />
Results<br />
The individual mineral phases of silicates (zeolite, bentonite,<br />
quartz sands) and carbonates (magnezite, calcite) can<br />
control the efficiency of biofiltration when sorption and precipitation<br />
of metals occurs. Moreover, in both cases, Zn, Cu,<br />
Pb were accumulated at the mineral and cell surface as precipitates.<br />
An important parameter for packing material is the<br />
removal capacity of the minerals.<br />
Removal of Zn from solution by silicate was of lower<br />
efficiency, 20 % Zn by zeolite, 46 % by bentonite, 21 % by<br />
quartz sands was removed, while up to 55 % by calcite and<br />
88 % by magnezite (Fig. 1.).<br />
Removal of Cu was similar approximately 24 % by<br />
these minerals (Fig. <strong>2.</strong>).<br />
Pb was very effective removed 93 % by bentonite and<br />
magnezite and 74 % by zeolite and calcite (Fig. 3.).<br />
The experimental results of the selected natural mineral<br />
materials showed that bentonite has higher adsorption capacities<br />
than zeolite for Pb and Zn. However, magnezite appear<br />
to be more effective than calcite in precipitation of Pb and<br />
Zn.<br />
The affinity series for bacterial removal of these metals<br />
decrease in the order Pb > Zn > Cu with the low sorption<br />
capacity only approximately 0.06 mM dm –3 . At 0.1 g bacte-<br />
s477<br />
ria dm –3 is a small amount of cells for adsorption metals onto<br />
the bacterial surface.<br />
Fig. 1. Time dependence of Zn biosorption and precipitation<br />
by minerals and bacterial cells<br />
Fig. <strong>2.</strong> Time dependence of Cu biosorption and precipitation<br />
by minerals and bacterial cells<br />
Fig. 3. Time dependence of Pb biosorption and precipitation<br />
by minerals and bacterial cells
Chem. Listy, 102, s265–s1311 (2008) Environmental Chemistry & Technology<br />
This biosorption batch experiment represents a mineralsdominated<br />
regime in which the bacterial concentration is low,<br />
and therefore the difference of mineral and cell adsorption<br />
is big in the biological processes of pH change from 7 to 4<br />
during silicate biofiltration and of pH change from 7 to 9<br />
during carbonate biofiltration.<br />
The result dominantly involves decreasing metal concentration<br />
in solution in dependence of time and kind of<br />
minerals. This indicates that the contact time between the<br />
metal solution and the mineral kind and also the bacterial<br />
amount is of crucial importance.<br />
Conclusions<br />
The batch adsorption experiment in ternary and binary<br />
systems with individual sorbents, ternary metal-mineralbacteria<br />
and binary metal-bacteria interaction can be used to<br />
ascertain the effect of bacteria and selected of minerals like<br />
packing materials in development of biofilters. The results<br />
suggest that the adsorption observed in the 0.1 g dm –3 bacterial<br />
dm –3 system dominantly involves the mineral surface<br />
s478<br />
that is why biofiltration need to increase bacterial amount in<br />
packing filter.<br />
This work has been supported by the Slovak Academy of<br />
Sciences (VEGA 2/0049/08).<br />
REFEREnCES<br />
1. Leppert D.: Mining. Eng. 42, 604 (1990).<br />
<strong>2.</strong> Pradas E. G., Sánchez M. V., Cruz F. C., Viciana M. S.,<br />
Pérez M. F.: J.Chem. Tech. Biotechnol. 59, 289 (1994).<br />
3. Elzinga E. J., Reeder R. J.: Geochimica et Cosmochimica<br />
Acta 66, 3943 (2002).<br />
4. Godelitsas A., Astilleros J. M., Hallam K., Harissopoulos<br />
S., Putnis A.: Environ. Sci. Technol. 37, 335 (2003).<br />
5. Panchanodikar V. V., Das R. P.: Int. J. Environ. Stud. 44,<br />
251 (1993).<br />
6. Kuyucak n., Volesky B.: Biotechnol. Lett. 10, 137<br />
(1988)<br />
7. Yee n., Fein J. B.: Chem. Geol. 185, 303 (2002).
Chem. Listy, 102, s265–s1311 (2008) Environmental Chemistry & Technology<br />
P71 ANTIbIOTIC EFFECTS OF ThE<br />
NAPhTOQuINONIC DERIVATIVE ON GRAM-<br />
POSITIVE AND GRAM-NEGATIVE GERMS<br />
RADU TAMAIAn a , nADIA PăUn a , VIOLETA<br />
nICULESCU a , AnDREEA IORDACHE a , RALUCA<br />
VREMERă a and şTEFAnIA BROSCăŢEAn b<br />
a Research and Development Department, National Research<br />
and Development Institute for Cryogenics and Isotopic Technologies<br />
– ICIT Râmnicu Vâlcea, Uzinei Street No. 4 240050,<br />
Râmnicu Vâlcea, Romania,<br />
b S.C. IMOFARM S.R.L., Piscului Street No. 15 040403, Bucu-<br />
reşti, Romania,<br />
tradu@icsi.ro<br />
Introduction<br />
Intestinal motile bacteria Enterobacter aerogenes and<br />
nonmotile coccus Enterococcus faecalis are known as being<br />
contaminating pathogenetic agents of aliments 1–3 and drinking<br />
water 4 . Pathological agents: coccus and bacteria have a<br />
significant multiple-antibiotic resistance at natural drugs and<br />
also at chemically obtained drugs. 5–10<br />
The naphthoquinones are a wide class of plants’ metabolites,<br />
which are currently used for manufacturing cosmetics,<br />
foods or for medicinal purposes 11,12 . Also the natural<br />
naphthoquinones were tested for antitumoral 13 , antiinflamatory<br />
14 and antimicrobial 15,16 activity. For antibiotic activity<br />
is being responsible the compound structure, therefore the<br />
aim of any structure-activity relationship should be to find<br />
the most potent and least toxic compound. In this respect,<br />
we studied the antibiotic effect of dichlor derivative of 1,4naphthoquinone:<br />
2,3-dichloro-1,4 naphthoquinone (dichlone<br />
– Fig. 1.) on Gram-positive nonmotile coccus Enterococcus<br />
faecalis, and Gram-negative motile bacteria Enterobacter<br />
aerogenes.<br />
Fig. 1. Dichlone structure<br />
In order to identify dichlone’s grade of remanence, in the<br />
inoculated culture mediums, it was used HPLC technique.<br />
Experimental<br />
M a t e r i a l s a n d E q u i p m e n t s<br />
Dehydrated culture media: primary culture media TSA<br />
(tryptic soy agar) from Fluka (Buchs, Switzerland) and M-H<br />
broth (Müeller-Hinton broth) from Fluka (Buchs, Switzerland)<br />
for antibiotic susceptibility testing.<br />
s479<br />
Both culture media were rehydrated with ultrapure<br />
water made with water ultra-purifier TKA Smart2Pure UV6<br />
from TKA Wasseraufbereitungssysteme GmbH (niederelbert,<br />
Germany).<br />
Used microbial strains were made by MicroBioLogics<br />
Inc. (Saint Cloud, USA), as following:<br />
•<br />
•<br />
•<br />
KWIK-STIK: Enterococcus faecalis (ATCC 29212);<br />
KWIK-STIK: Enterococcus faecalis (ATCC 19433);<br />
KWIK-STIK: Enterobacter aerogenes (ATCC<br />
13048).<br />
Culture media were sterilised with a Raypa AES-75<br />
autoclave from R.ESPInAR, S.L. (Barcelona, Spain).<br />
All cultures were incubated in a Raypa Incuterm ID-50<br />
incubator from R.ESPInAR, S.L. (Barcelona, Spain).<br />
Barium chloride from Utchim S.R.L. (Râmnicu Vâlcea,<br />
Romania) and sulfuric acid from Utchim S.R.L. (Râmnicu<br />
Vâlcea, Romania) were used for preparation of McFarland<br />
turbidity standards.<br />
Odyssey DR/2500 spectrophotometer from Hach Company<br />
(Loveland, USA) was used for inoculums’ and prepared<br />
McFarland turbidity standards’ OD (optical density) determination.<br />
For antimicrobial susceptibility testing it was used dichlone<br />
from Merck (Darmstadt, Germany).<br />
Dichlone’s grade of remanence was detected with HPLC<br />
equipment: Thermo Finnigan Surveyor system from Thermo<br />
Fisher Scientific Inc. (Waltham, USA). PDA detector set to<br />
254 nm. Hypersil GOLD Column 100 × 4.6 mm.<br />
Dichlone standard for HPLC: dichlone standard from<br />
Supelco (Bellefonte, USA).<br />
•<br />
•<br />
Other reagents for HPLC technique:<br />
Acetonitrile from Merck (Darmstadt, Germany);<br />
Water Chromasolv from Honeywell International Inc.,<br />
Riedel-de Haën (Seelze, Germany).<br />
M e t h o d s<br />
Primary and secondary cultures: the KWIK-STIK<br />
lyophilized microorganisms’ strains (Enterococcus faecalis<br />
ATCC 29212 and ATCC 19433; Enterobacter aerogenes<br />
ATCC 13048) were transferred on Petri dishes with sterile<br />
TSA and incubated at 35 °C for 24 hours (primary cultures);<br />
then, subcultures were made from primary cultures and incubated<br />
also on sterile TSA for 24 hours at 35 °C.<br />
Antimicrobial susceptibility testing by broth microdilution<br />
technique: dichlone’s MIC (minimal inhibitory concentration<br />
– defined as drug concentration at which no growth is<br />
visible) was determined by broth microdilution technique. A<br />
sterile culture tube with M-H broth was inoculated with an<br />
aliquot from the three types of secondary growth. Inoculated<br />
broth’s OD was adjusted at 0.5 McFarland standard with prepared<br />
turbidity standards – aproximatively 1 × 10 8 CFU ml –1 .<br />
Standardised inoculums’ aliquots from all three types of<br />
secondary culture were transferred on culture tubes with sterile<br />
liquid medium: M-H broth. Dichlone’s MIC was tested<br />
on those standardised inoculums, on M-H broth.
Chem. Listy, 102, s265–s1311 (2008) Environmental Chemistry & Technology<br />
Table I<br />
Concentration of dichlone used in MIC testing<br />
Dilution 1 Dilutions 2 Dilutions 3<br />
0.001 μg ml –1 0.125 μg ml –1 16.0 μg ml –1<br />
0.002 μg ml –1 0.25 μg ml –1 3<strong>2.</strong>0 μg ml –1<br />
0.004 μg ml –1 0.5 μg ml –1 64.0 μg ml –1<br />
0.008 μg ml –1 1.0 μg ml –1 128.0 μg ml –1<br />
0.016 μg ml –1 <strong>2.</strong>0 μg ml –1 256.0 μg ml –1<br />
0.032 μg ml –1 4.0 μg ml –1<br />
0.064 μg ml –1 8.0 μg ml –1<br />
HPLC technique: for the identification of 2,3-dichloronaphtoquinone<br />
in the samples a 1 mg ml –1 solution was prepared<br />
in acetonitrile and 10 μl injected into the HPLC system.<br />
The sample was injected three times.<br />
Mobile phase was 60 % acetonitrile with 40 % water.<br />
Chromatograms were registered at 254 nm.<br />
Results<br />
Antimicrobial susceptibility testing results show that the<br />
dichlone have no antimicrobial activity on Gram-negative<br />
bacteria Enterobacter aerogenes; in the same time the growth<br />
of Gram-positive coccus Enterococcus faecalis (both strains)<br />
was completly inhibited, as in Table II.<br />
Table II<br />
Dichlone’s MIC on Enterococcus faecalis strains<br />
Strain MIC [μg ml –1 ]<br />
E. faecalis – ATCC 29212 0.5<br />
E. faecalis – ATCC 19433 0.5<br />
As we mentioned in introduction, dichlone’s grade of<br />
remanence, in the inoculated culture mediums for MIC was<br />
determined by HPLC. The chromatograms of the mentioned<br />
naphtoquinone obtained at the most effective chromatographic<br />
conditions are shown in Figs. <strong>2.</strong> and 3.<br />
The height and area of PDA signal (254 nm) for this<br />
naphtoquinone confirmed the calculated value for MIC.<br />
Fig. <strong>2.</strong> hPLC chromatogram for dichlone’s MIC (e. faecalis<br />
– ATCC 29212)<br />
s480<br />
Fig. 3. hPLC chromatogram for dichlone’s MIC (E. faecalis<br />
– ATCC 19433)<br />
Conclusions<br />
The results of this study show that dichlone has no antimicrobial<br />
activity on Gram-negative germs (Enterobacter<br />
aerogenes). In the mean time, dichlone’s MIC on Gram-positive<br />
germs (Enterococcus faecalis – both strains) it was at<br />
0.5 μg ml –1 in liquid culture media (M-H broth). This concentration<br />
was confirmed by HPLC determination.<br />
This work has been supported by Romanian Ministry<br />
of Education and Research, National Authority for Scientific<br />
Research, National Centre for Programmes Management<br />
on Project No. 1885 NANOQMED: “Obtaining and characterization<br />
of new targeted-nanodrugs with naphtoquinonic<br />
active substance”.<br />
REFEREnCES<br />
1. Clark J. A., Burger C. A., Sabatinos L. E.: Can. J. Microbiol.,<br />
28, 1002 (1982).<br />
<strong>2.</strong> Baudart J., Coallier J., Laurent P., Prévost M.: Appl.<br />
Environ. Microbiol., 68, 5057 (2002).<br />
3. Filipkowska Z.: Acta Microbiol. Pol., 52, 57 (2003).<br />
4. Delbés C., Ali-Mandjee L., Montel M. C.: Appl. Environ.<br />
Microbiol., 73, 1882 (2007).<br />
5. Johnston L. M., Jaykus L. A.: Appl. Environ. Microbiol.,<br />
70, 3133 (2004).<br />
6. Hayes J. R. English L. L. Carr L. E., Wagner D. D.,<br />
Joseph S. W.: Appl. Environ. Microbiol., 70, 6005<br />
(2004).<br />
7. Morosini M. I., Garciá-Castillo M., Coque T. M., Valverde<br />
A., novais A., Loza E., Baquero, Cantón R.: Antimicrob.<br />
Ag. Chemoth., 50, 2695 (2006).<br />
8. Sawant A. A., Hegde n. V., Straley B. A., Donaldson<br />
S. C., Love B. C., Knabel S. J., Jayarao B. M.: Appl.<br />
Environ. Microbiol., 73, 156 (2007).<br />
9. Macovei L., Zurek L.: Appl. Environ. Microbiol., 72,<br />
4028 (2006).<br />
10. Macovei L., Zurek L.: Appl. Environ. Microbiol., 73,<br />
6740 (2007).<br />
11. Masuda K., Funayama S., Komiyama K., Umezawa, I.,<br />
Ito K.: J. nat. Prod., 50, 418 (1987).
Chem. Listy, 102, s265–s1311 (2008) Environmental Chemistry & Technology<br />
1<strong>2.</strong> Papageorgiou V. P., Assimopoulou, A. n., Couladouros<br />
E. A., Hepworth D.; nicolaou K. C.: Angewdte Chem.<br />
Int., 38, 270 (1999).<br />
13. Gokhale1 n., Padhye S., newton C., Pritchard R.:<br />
Metal-Based Drugs, 7, 121 (2000).<br />
14. Steihberg F. M., Gershwin M. E., Rucker R. B.: Jour.<br />
nutr., 1994, 744.<br />
s481<br />
15. de Paiva S. R., Figueiredo M. R., Aragão T. V., Coelho<br />
Kaplan M. A.: Mem. Inst. Oswaldo Cruz, 98, 959<br />
(2003).<br />
16. Brandelli A., Bizanim D., Martinelli M., Stefani V.,<br />
Gerbase A. E.: Braz. Jour. Pharm. Sci., 40, 247 (2004).
Chem. Listy, 102, s265–s1311 (2008) Environmental Chemistry & Technology<br />
P72 PRACTICAL APPLICATION IN AGRICuLTuRE<br />
OF ThE MAGNESIuM PRODuCTS INDuSTRy<br />
wASTE<br />
LIDIA TAUBERT, HORTEnSIA RADULESCU, SánDOR<br />
A. KISS, RUDOLF KASTORI, ECATERInA PRInCZ and<br />
éVA STEFAnOVITS-BánYAI<br />
Chemistry Institute – Timisoara of the Romanian Academy,<br />
Bv. Mihai Viteazu No.24, 300223 – Timisoara, Romania.<br />
lidiat@acad-icht.tm.edu.ro<br />
Introduction<br />
The industrial processes of manufacturing magnesium<br />
compounds – oxide and carbonates mainly, from dolomites,<br />
by carbon dioxide leaching, generate important amounts of<br />
waste 1,2 . The composition of this waste includes calcium carbonate<br />
and precipitated magnesium carbonates (in ratio of<br />
3:1 till 4:1) together with other impurities, presents in the raw<br />
material such as iron, manganese, copper and zinc 3,4 .<br />
The alkaline reaction and the important mineral content<br />
– essential and trace elements – of this waste can be valuated<br />
in agriculture as soil amendment and fertilizer for acid soils<br />
with low fertility 5–7 .<br />
The main objective of this study is to present the influence<br />
of waste types and doses on the fertility characteristics<br />
of an acid soil. The improve of the soil fertility was established<br />
by studying some vegetation characteristics and the protein<br />
content of green oat plants. The paper reports the effects<br />
of several waste doses and types on luvosoil with and without<br />
nitrogen contribution. Two types of waste were experimented,<br />
one from the industrial process (A) and the second resulted as<br />
crusts deposed on the equipment walls (B).<br />
Experimental Part<br />
Luvosoil, having a pH H2O of 6.94 and pH KCl of 5.76 and<br />
a rather low soil fertility, was collected, air-dried, crushed,<br />
mixed and put into pots, each containing 1 kilogram soil. The<br />
soil was treated with two types of waste in different amounts,<br />
having each the composition presented in Table I.<br />
Table I<br />
Composition of the two experimented industrial waste<br />
Specification Waste A Crusts B<br />
Ca, % 28 19<br />
Mg, % 7 14<br />
Fe, mg kg –1 1850 880<br />
Cu, mg kg –1 1.9 51<br />
Mn, mg kg –1 136 51<br />
Zn, mg kg –1 <strong>2.</strong>6 50<br />
The experimental alternatives pursued by this research<br />
consist of four different doses for each waste (A, B), namely<br />
A 1 , A 2 , A 3 , A 4 and B 1 , B 2 , B 3 , B 4 and also a control alternative<br />
(C 0 ), represented by untreated soil. All the experimental<br />
s482<br />
alternatives took place in three replicates (R 1 , R 2 , R 3 ). At the<br />
replicates R 2 and R 3 , 134 mg nitrogen kg –1 soil as ammonium<br />
nitrate was added in each pot. The description of the experimental<br />
alternatives is shown in Table II, in which R represent<br />
the replicate without nitrogen treatment (R 1 ) and R n – the<br />
average of replicates R 2 and R 3 , treated with nitrogen.<br />
All the pots were sown with thirty oat grains. The vegetation<br />
period was that of green plant, pursued for 8 weeks.<br />
The pots were placed in laboratory near the window and<br />
watered every second day by 100 ml water. Along the vegetation<br />
period, some morphological parameters, like number<br />
of risen plants, plant size, fresh and dry weight were pursued.<br />
Some composition features like dry matter and protein content<br />
were determined too. At harvest time, soil samples were<br />
collected in order to establish the impact of waste treatment<br />
on soil fertility. Soil characteristics like pH, essential and<br />
trace elements were analysed.<br />
Soil pH in watery and salin extracts was determined by<br />
a pH-meter. The metal element content in soil at harvest time<br />
was established by AAS-ICP method. The protein content in<br />
oat plants was analysed by using the Kjeldahl method.<br />
Results and Discussion<br />
The impact of waste treatment on soil reaction and macroelements<br />
content is shown in Table III.<br />
Soil reaction was analysed using two analytical methods,<br />
in watery and salt extract. The extraction in KCl solution<br />
hinders salts hydrolysis in soil and therefore the obtained pH<br />
values are more stable but lower by 1.7 pH units in comparison<br />
with those of the watery extract. For both methods, a<br />
buffer process of the soil reaction was established, turning<br />
the low acid soil reaction to an alkaline reaction, proportional<br />
with the increase of the waste dose. The increase of the<br />
pH value took place slowly by adding waste A and suddenly<br />
in case of waste B, which composition contains more magnesium<br />
than that of waste A. The highest pH values were<br />
established for A 4 (pH = 8.354) and B 4 (pH = 8.290). The<br />
nitrogen contribution decreases the pH-values because of the<br />
acid reaction of ammonium nitrate.<br />
Analysing the soil calcium content, a proportional increase<br />
was established once with the growth of the waste dose.<br />
The increase of the calcium content took place suddenly<br />
for waste of type A and slowly for the waste B, remarking<br />
a suddenly growth only for the highest B dose. The highest<br />
waste doses for type A and B generate a calcium content of<br />
<strong>2.</strong>674 g kg –1 (A 4 ) and <strong>2.</strong>717 g kg –1 (B 4 ) respectively.<br />
A growth of the magnesium soil content was established<br />
once with the increase of the waste dose (A, B). Higher<br />
values were determined for waste type B. Alike as for the<br />
calcium content in soil, a nitrogen contribution decreases the<br />
magnesium content values for the alternatives with waste of<br />
type A.
Chem. Listy, 102, s265–s1311 (2008) Environmental Chemistry & Technology<br />
Table II<br />
Description of the experimental alternatives<br />
Experimental Waste nitrogen Mineral Suplimentation<br />
alternative dose, contrib., Ca, Mg, Fe, Cu, Mn, Zn,<br />
mg kg –1 mg kg –1 mg kg –1 mg kg –1 mg kg –1 µg kg –1 µg kg –1 µg kg –1<br />
A1<br />
R<br />
Rn<br />
179<br />
179<br />
-<br />
134<br />
50<br />
50<br />
13<br />
13<br />
0.33<br />
0.33<br />
0.34<br />
0.34<br />
24.3<br />
24.3<br />
0.47<br />
0.47<br />
A2<br />
R<br />
Rn<br />
357<br />
357<br />
-<br />
134<br />
100<br />
100<br />
25<br />
25<br />
0.66<br />
0.66<br />
0.68<br />
0.68<br />
48.7<br />
48.7<br />
0.93<br />
0.93<br />
A3<br />
R<br />
Rn<br />
714<br />
714<br />
-<br />
134<br />
200<br />
200<br />
50<br />
50<br />
1.32<br />
1.32<br />
1.36<br />
1.36<br />
97.4<br />
97.4<br />
1.86<br />
1.86<br />
A4<br />
R<br />
Rn<br />
1429<br />
1429<br />
-<br />
134<br />
400<br />
400<br />
100<br />
100<br />
<strong>2.</strong>64<br />
<strong>2.</strong>64<br />
<strong>2.</strong>72<br />
<strong>2.</strong>72<br />
194.7<br />
194.7<br />
3.72<br />
3.72<br />
B1<br />
R<br />
Rn<br />
263<br />
263<br />
-<br />
134<br />
50<br />
50<br />
37<br />
37<br />
0.23<br />
0.23<br />
13.40<br />
13.40<br />
13.4<br />
13.4<br />
13.20<br />
13.20<br />
B2<br />
R<br />
Rn<br />
526<br />
526<br />
-<br />
134<br />
100<br />
100<br />
74<br />
74<br />
0.46<br />
0.46<br />
26.80<br />
26.80<br />
26.8<br />
26.8<br />
26.40<br />
26.40<br />
B3<br />
R<br />
Rn<br />
1053<br />
1053<br />
-<br />
134<br />
200<br />
200<br />
147<br />
147<br />
0.93<br />
0.93<br />
53.60<br />
53.60<br />
53.6<br />
53.6<br />
5<strong>2.</strong>60<br />
5<strong>2.</strong>60<br />
B4<br />
R<br />
Rn<br />
2105<br />
2105<br />
-<br />
134<br />
400<br />
400<br />
295<br />
295<br />
1.85<br />
1.85<br />
107.30<br />
107.30<br />
107.3<br />
107.3<br />
105.20<br />
105.20<br />
Table III<br />
Impact of waste treatment on soil reaction and macroelements content<br />
Experimental<br />
alternative<br />
pHH2O pH unit<br />
Soil reaction<br />
pHKCl ,<br />
D pH unit D<br />
Ca content<br />
g kg<br />
Mg content<br />
–1 % g kg –1 %<br />
C0 R 6.939 - 5.763 - <strong>2.</strong>136 100.0 0.327 100.0<br />
A1<br />
R<br />
Rn<br />
6.887<br />
7.054<br />
–0.052<br />
0.115<br />
6.093<br />
5.934<br />
0.330<br />
0.171<br />
<strong>2.</strong>267<br />
<strong>2.</strong>222<br />
106.1<br />
104.0<br />
0.348<br />
0.343<br />
106.4<br />
104.9<br />
A2<br />
R<br />
Rn<br />
7.718<br />
7.229<br />
0.779<br />
0.290<br />
6.565<br />
6.174<br />
0.802<br />
0.411<br />
<strong>2.</strong>261<br />
<strong>2.</strong>168<br />
105.8<br />
101.5<br />
0.352<br />
0.337<br />
107.6<br />
103.1<br />
A3 R<br />
Rn<br />
8.178<br />
8.291<br />
1.239<br />
1.352<br />
6.468<br />
6.983<br />
0.705<br />
1.220<br />
<strong>2.</strong>440<br />
<strong>2.</strong>280<br />
114.2<br />
106.7<br />
0.400<br />
0.371<br />
12<strong>2.</strong>3<br />
113.5<br />
A4<br />
R<br />
Rn<br />
8.354<br />
8.435<br />
1.415<br />
1.496<br />
7.307<br />
7.257<br />
1.544<br />
1.494<br />
<strong>2.</strong>674<br />
<strong>2.</strong>607<br />
125.2<br />
12<strong>2.</strong>0<br />
0.464<br />
0.449<br />
14<strong>2.</strong>2<br />
137.3<br />
B1<br />
R<br />
Rn<br />
7.771<br />
7.386<br />
0.832<br />
0.447<br />
6.216<br />
5.908<br />
0.453<br />
0.145<br />
<strong>2.</strong>122<br />
<strong>2.</strong>151<br />
99.3<br />
100.7<br />
0.343<br />
0.330<br />
104.9<br />
100.9<br />
B2<br />
R<br />
Rn<br />
7.734<br />
7.677<br />
0.795<br />
0.738<br />
6.556<br />
6.536<br />
0.793<br />
0.773<br />
<strong>2.</strong>164<br />
<strong>2.</strong>270<br />
101.3<br />
106.3<br />
0.361<br />
0.380<br />
110.4<br />
116.2<br />
B3<br />
R<br />
Rn<br />
8.016<br />
8.215<br />
1.077<br />
1.276<br />
6.881<br />
6.944<br />
1.118<br />
1.181<br />
<strong>2.</strong>254<br />
<strong>2.</strong>390<br />
105.5<br />
111.9<br />
0.412<br />
0.427<br />
126.0<br />
130.6<br />
B4<br />
R<br />
Rn<br />
8.290<br />
8.222<br />
1.351<br />
1.281<br />
7.082<br />
7.360<br />
1.319<br />
1.597<br />
<strong>2.</strong>717<br />
<strong>2.</strong>547<br />
127.2<br />
119.2<br />
0.566<br />
0.480<br />
173.1<br />
146.8<br />
s483
Chem. Listy, 102, s265–s1311 (2008) Environmental Chemistry & Technology<br />
Table IV<br />
Influence of waste type and doses on the soil trace elements content<br />
Experimental alternative<br />
Fe content<br />
µg kg<br />
Mn content Zn content Cu content<br />
–1 % µg kg –1 % g kg –1 % g kg –1 %<br />
C0 R 234.7 100.0 87.84 100 11.400 100.0 3.402 100.0<br />
A1<br />
R<br />
Rn<br />
249.6<br />
251.4<br />
106.3<br />
107.1<br />
84.20<br />
84.30<br />
95.9<br />
96.0<br />
33.100<br />
25.080<br />
290.4<br />
220.0<br />
3.491<br />
3.639<br />
10<strong>2.</strong>6<br />
107.0<br />
A2<br />
R<br />
Rn<br />
244.6<br />
245.1<br />
104.2<br />
104.4<br />
80.06<br />
95.00<br />
91.1<br />
108.2<br />
31.200<br />
11.900<br />
273.7<br />
104.4<br />
3.669<br />
3.669<br />
107.8<br />
107.8<br />
A3<br />
R<br />
Rn<br />
260.3<br />
253.6<br />
110.9<br />
108.1<br />
86.97<br />
85.44<br />
99.0<br />
97.3<br />
13.960<br />
11.910<br />
12<strong>2.</strong>5<br />
104.5<br />
3.462<br />
3.609<br />
101.8<br />
106.1<br />
A4<br />
R<br />
Rn<br />
257.0<br />
264.5<br />
109.5<br />
11<strong>2.</strong>7<br />
73.42<br />
88.00<br />
83.6<br />
100.1<br />
1<strong>2.</strong>920<br />
6.721<br />
113.3<br />
59.0<br />
3.669<br />
3.821<br />
107.8<br />
11<strong>2.</strong>3<br />
B1<br />
R<br />
Rn<br />
23<strong>2.</strong>5<br />
251.1<br />
99.1<br />
107.0<br />
75.56<br />
95.77<br />
86.0<br />
109.0<br />
4.418<br />
4.407<br />
38.8<br />
38.7<br />
3.462<br />
3.609<br />
101.8<br />
106.1<br />
B2<br />
R<br />
Rn<br />
24<strong>2.</strong>5<br />
236.6<br />
103.3<br />
100.8<br />
70.53<br />
81.62<br />
80.3<br />
9<strong>2.</strong>9<br />
4.832<br />
4.821<br />
4<strong>2.</strong>3<br />
4<strong>2.</strong>3<br />
3.358<br />
3.462<br />
98.7<br />
101.8<br />
R 235.0 100.1 94.39 107.5 4.567 40.1 3.787 111.3<br />
B3<br />
B4<br />
Rn 237.8 101.3 73.76 84.0 19.300 169.3 3.506 103.1<br />
R 253.8 108.1 9<strong>2.</strong>62 105.4 4.425 38.8 3.728 109.6<br />
Rn 237.8 101.3 76.49 87.1 10.210 89.6 3.402 100.0<br />
Table V<br />
Influence of waste and nitrogen contribution on some vegetation characteristics of green oat<br />
Experimental alternative<br />
Risen plants<br />
number %<br />
Size of green plants<br />
cm %<br />
Fresh weight<br />
mg piece –1 %<br />
C0 A1<br />
R<br />
R<br />
Rn<br />
21<br />
22<br />
23<br />
70<br />
73<br />
77<br />
51<br />
54<br />
73<br />
100<br />
106<br />
143<br />
362<br />
327<br />
591<br />
100<br />
90<br />
163<br />
A2<br />
R<br />
Rn<br />
27<br />
22<br />
90<br />
73<br />
53<br />
72<br />
104<br />
141<br />
352<br />
623<br />
97<br />
172<br />
A3<br />
R<br />
Rn<br />
28<br />
22<br />
93<br />
73<br />
56<br />
75<br />
109<br />
147<br />
332<br />
650<br />
92<br />
180<br />
A4<br />
R<br />
Rn<br />
23<br />
19<br />
77<br />
63<br />
59<br />
77<br />
116<br />
151<br />
387<br />
737<br />
107<br />
204<br />
B1<br />
R<br />
Rn<br />
22<br />
27<br />
73<br />
90<br />
53<br />
70<br />
104<br />
137<br />
300<br />
537<br />
83<br />
148<br />
B2<br />
R<br />
Rn<br />
24<br />
22<br />
80<br />
73<br />
60<br />
78<br />
118<br />
153<br />
350<br />
600<br />
97<br />
166<br />
R 25 83 52 102 404 112<br />
B3<br />
B4<br />
Rn 28 93 70 137 464 128<br />
R 30 100 53 104 370 102<br />
Rn 22 73 58 114 582 161<br />
s484
Chem. Listy, 102, s265–s1311 (2008) Environmental Chemistry & Technology<br />
Table VI<br />
Impact of waste treatment on some composition features of green oat plants<br />
Experimental alternative<br />
Dry weight<br />
mg piece<br />
Dry matter Protein content<br />
–1 % D.M. % P % %<br />
C0 A1<br />
R<br />
R<br />
Rn<br />
162<br />
159<br />
248<br />
100<br />
98<br />
153<br />
44.8<br />
48.1<br />
41.9<br />
10.08<br />
5.42<br />
1<strong>2.</strong>56<br />
100<br />
53.8<br />
124.6<br />
A2<br />
R<br />
Rn<br />
167<br />
255<br />
103<br />
157<br />
46.9<br />
41.0<br />
4.75<br />
1<strong>2.</strong>65<br />
47.1<br />
125.5<br />
A3<br />
R<br />
Rn<br />
161<br />
255<br />
99<br />
157<br />
47.9<br />
39.2<br />
5.01<br />
13.68<br />
49.7<br />
135.7<br />
A4<br />
R<br />
Rn<br />
183<br />
300<br />
113<br />
185<br />
47.3<br />
41.0<br />
5.03<br />
1<strong>2.</strong>78<br />
49.9<br />
126.8<br />
B1<br />
R<br />
Rn<br />
155<br />
233<br />
96<br />
144<br />
51.3<br />
43.0<br />
5.41<br />
1<strong>2.</strong>31<br />
53.6<br />
12<strong>2.</strong>1<br />
B2<br />
R<br />
Rn<br />
158<br />
273<br />
98<br />
169<br />
45.6<br />
46.0<br />
4.98<br />
11.89<br />
49.4<br />
118.0<br />
R 184 114 46.5 4.63 45.9<br />
B3<br />
B4<br />
Rn 200 123 43.4 1<strong>2.</strong>59 124.9<br />
R 150 93 40.8 5.83 57.8<br />
Rn 250 154 4<strong>2.</strong>9 1<strong>2.</strong>99 128.9<br />
Because of their trace elements content, the soil treatment<br />
with waste of type A and B generates in soil a different<br />
trace element level in comparison to the control alternative,<br />
presented in Table IV.<br />
Analysing the iron content of the experimental alternatives,<br />
it was established that unimportant increases of the iron<br />
content took place once with the growth of both waste type<br />
doses. The highest iron concentrations were found in alternative<br />
A 4 and B 4 representing the highest waste doses and<br />
having an increase of 1<strong>2.</strong>7 % (A) and 8.1 % (B).<br />
The manganese content in soil has lower values for all<br />
the experimental alternatives than that of the control alternative.<br />
An exception is represented by A 2 registering an increase<br />
of 8.2 % and B 1 of 9.0 %, both with nitrogen contribution.<br />
The zinc content in soil decreases once with the increase<br />
of the waste dose. The highest value was registered for A 1<br />
and the increase was of 190.4 %. By addition of waste B, the<br />
zinc content in soil decreases having lower values than the<br />
control alternative.<br />
The copper content in soil remains almost constant after<br />
waste addition. The highest increase was registered for A 4<br />
representing 1<strong>2.</strong>3 %. Treating soil with waste B, the highest<br />
registered increase was 11.3 % for B 3 .<br />
The effects of soil treatment with waste A and B show<br />
an important influence on the development and nutrition of<br />
green oat plants. The results are presented in Table V and<br />
Table VI.<br />
The enhance of the waste A amounts in soil treatment<br />
had a beneficial effect on the grain germination praised by<br />
a higher number of risen plants. Adding nitrogen to soil, the<br />
number of risen plants remained low. The effects are similar<br />
for soil treatment with waste B, except for B 1 and B 3 ,<br />
where the nitrogen contribution increases the number of risen<br />
s485<br />
plants. The highest number of risen plants was established for<br />
B 4 , 30 representing 100 % of the sown oat grains.<br />
Green oat plants grew taller once with the increase of the<br />
waste dose in both cases (waste A and waste B). Adding nitrogen,<br />
an obvious increase of the plant size was established.<br />
The tallest plants were find for alternatives A 4 (highest waste<br />
A dose + nitrogen contribution), namely 77 cm and 78 cm for<br />
B 2 (second waste B dose + nitrogen contribution).<br />
At harvest time, green oat plants for all alternatives were<br />
thinner, having a reduced fresh weight in comparison with the<br />
control alternative for those without nitrogen contribution.<br />
The nitrogen supplement makes the plants more vigorous<br />
having a higher fresh weight and dry weight for all the experimental<br />
alternatives. The fresh weight increase was more<br />
evident for soil treatment with waste A; for the highest waste<br />
dose (A 4 ), the increase was of 104 % in comparison with the<br />
control alternative. Similar to the fresh weight increase, took<br />
place the dry weight increase. The most evident results were<br />
established for the alternatives treated with waste A. The<br />
increase of the dry weight was the highest of 85 % for the<br />
alternative A 4 .<br />
The altering of dry matter was increasing for the alternatives<br />
without nitrogen treatment and decreasing for those<br />
with nitrogen treatment. The highest dry matter value was of<br />
51.3 % for B 1 (lowest waste B dose) and the lowest value was<br />
39.2 % for A 3 (waste A + nitrogen contribution).<br />
The protein content of green oat plants shows, at harvest<br />
time, two different aspects comparative with the control alternative.<br />
For the alternatives in which no nitrogen was added,<br />
the protein content represents half of the control alternative<br />
content. Adding nitrogen, the protein content has increased<br />
and became double given to the alternatives without nitrogen<br />
contribution. The highest protein level was found for
Chem. Listy, 102, s265–s1311 (2008) Environmental Chemistry & Technology<br />
A 3 , namely 13.68 % and 1<strong>2.</strong>99 % for B 4 . The increase of the<br />
waste dose and nitrogen contribution generates an enhance of<br />
the plant protein content.<br />
Conclusions<br />
Considering the obtained results, the two experimented<br />
industrial waste can be used in certain doses as soil<br />
amendment for low fertile acid soil, with or without nitrogen<br />
addition.<br />
Treating soil with different doses of waste, a buffering<br />
effect was established, which rises the pH values from low<br />
acid to low alkaline.<br />
The presence of magnesium and calcium in the waste<br />
composition increases the soil content, proportional with the<br />
growth of the waste dose.<br />
The enhance of the trace elements content in soil is<br />
representative for iron, copper and zinc (waste A).<br />
The experimental waste doses (waste A, waste B) had a<br />
beneficial effect on grain germination improving the number<br />
of risen oat plants by 23 % (waste A) and 30 % (waste B).<br />
At harvest time, the size of green oat plants was taller by<br />
8 cm (waste A) and 9 cm (waste B) comparative to the control<br />
alternative with untreated soil. nitrogen additions increased<br />
their size by 51 % (waste A) and by 53 % (waste B).<br />
The fresh weights of the plants show a decrease proportional<br />
with the increase of the waste doses (A, B) only for the<br />
alternatives without nitrogen addition.<br />
The dry matter values are increasing once with enhance<br />
of dose for both waste in all alternatives without nitrogen<br />
contribution. The addition of nitrogen decreases the dry matter<br />
value at harvest time for all the alternatives comparative<br />
to the control. The decrease of dry matter is more severe for<br />
the alternatives treated with waste A.<br />
Adding nitrogen, the protein content has increased and<br />
became double given to the alternatives without nitrogen<br />
contribution.<br />
s486<br />
This work has been partial supported by a CNCSIS<br />
Grant-Type A of Romania.<br />
REFEREnCES<br />
1. Kohn D., Taubert L., Policec S.: Filtrieren und Separieren<br />
F&S 12, 161 (1998).<br />
<strong>2.</strong> Taubert L., Policec S., Kohn D.: Proceedings of International<br />
Symposium “Regional Multidisciplinary<br />
Research” (Mirton, ed.), p.521 Timisoara, Romania<br />
1998.<br />
3. Taubert L.: Proceedings of the 12th Romanian International<br />
Conference on Chemistry and Chemical Engineering:<br />
Inorganic Chemical Technology (Printech, ed.), p.<br />
201Bucharest, Romania 2001<br />
4. Taubert L.: Proceedings of 9th Symposium on Analytical<br />
and Environmental Problems (SZAB, ed.), p. 41,<br />
Szeged, Hungary 200<strong>2.</strong>.<br />
5. Radulescu H, Kiss A. S., Taubert L., Princz E.: Proceedings<br />
of 12th Symposium on Analytical and Environmental<br />
Problems (SZAB, ed.), p. 467, Szeged, Hungary<br />
2005.<br />
6. Taubert L., Kiss A. S., Radulescu H., Princz E.: Proceedings<br />
of 13th Symposium on Analytical and Environmental<br />
Problems (SZAB, ed.), p.261, Szeged, Hungary<br />
2006.<br />
7. Taubert L., Princz E., Radulescu H., Kiss A. S., Stefanovits-Bányai<br />
é.: 5th International Conference of the Chemical<br />
Societies of the South-East European Countries:<br />
Chemical Sciences at the European Crossroads, Ohrid-<br />
Macedonia, 10–14 Sept. 2006, p. 203, Book of Abstracts<br />
(Grafotissok, ed.),
Chem. Listy, 102, s265–s1311 (2008) Environmental Chemistry & Technology<br />
P73 POSSIbILITy OF ObjECTIVE CONTROL OF<br />
NATuRAL GAS ODORISATION<br />
DAnIEL TEnKRáT, OnDřEJ PROKEŠ and JAn<br />
BERánEK<br />
Institute of Chemical Technology Prague, Department of<br />
Gas, Coke and Air Protection, Technická 5, 166 28 Prague,<br />
Daniel.Tenkrat@vscht.cz<br />
Introduction<br />
natural gas is one of the most important energy carriers<br />
in Europe (in the Czech Republic as well). Total consumption<br />
of natural gas (nG) in the Czech Republic in 2006 was<br />
9,269 × 10 6 m 3 . Within the distribution to end users and also<br />
during natural gas utilization the most important requirement<br />
is the safety of customers.<br />
natural gas odorisation means operations involving the<br />
addition of odorant to gas to ensure characteristic odour of<br />
nG so that a person can judge the odour to be distinctive and<br />
unpleasant so that the presence of gas in air (in concentrations<br />
below lower explosive limit – LEL) is readily detectable.<br />
By the odorant addition any physical or chemical property<br />
(except the smell) of nG cannot be changed. As odorants<br />
organic sulfur compounds are often use (mercaptans and sulfides).<br />
nowadays a new type of sulfur free odorant is being<br />
introduced to the nG market.<br />
The nG odorisation in fact does not have any technological<br />
purpose; its main sense consist in evoking psychological<br />
effect, because the odour of nG must be alarming and<br />
incommutable with any common smell.<br />
In the Czech Republic the odorisation process is specified<br />
by the technical regulation TPG 918 01. This regulation<br />
lists as odorants just organic sulfur compounds. However, it<br />
does not mean that sulfur-free odorants can not be used.<br />
Experimental<br />
The main task of natural gas odorisation is to ensure<br />
such operating condition when natural gas in every part of<br />
the distribution grid fulfils the requirement of a “warning<br />
odour level”. In case of a gas leakage the warning odour level<br />
(see Table I.) must be reached until the 20 % of lower explosive<br />
limit (LEL; Ld ) is reached. Odorisation level can be<br />
verified by:<br />
• The odorisation level control – which can be done by<br />
olfactometry in selected points on distribution grid or by<br />
means of questionnaires at selected representative sample<br />
of customers. In both cases indirect indicators are<br />
taken into account so that both forms are considered to<br />
be subjective methods.<br />
• Odorant concentration measurement – in natural gas can<br />
be estimated continuously or discontinuously in selected<br />
points on grid. In this case particular concentration of<br />
odorant in nG is measured. This is so called objective<br />
method.<br />
s487<br />
The aim of this work was a critical comparison of the<br />
subjective odorisation control (according to TPG 91801)<br />
with the objective odorisation control. It means direct measurement<br />
of an odorant concentration in nG using modern analytical<br />
techniques and comparison with results from olfactometry<br />
measurement.<br />
A n a l y t i c a l E q u i p m e n t<br />
The accurate odorant concentration in nG was estimated<br />
by gas chromatograph HP 6890 equipped with mass<br />
detector MSD 7393 (Hewlett-Packard). For the analysis Supelco<br />
24158 SPB-1 Sulfur (30 m × 320 μm × 4 μm) column<br />
was used. Starting temperature was 30 °C with heating rate<br />
15 °C min –1 . The analysis terminated at 110 °C.<br />
The odorisation level control was estimated by dynamic<br />
olfactometry using olfactometer Ecoma TO 8-8. The procedure<br />
is based on step-by-step evaluation of olfactory perception<br />
of at least four (max. eight) observers. A sample of odorised<br />
natural gas is diluted by synthetic air in ratios between<br />
1 : 131,072 and 1 : 8 (nG:air). As soon as the observer indicates<br />
olfactory perception to be odour treshold (or warning<br />
odour level) the actual dilution of the sample is recorded.<br />
T e r m i n o l o g y<br />
Minimal odorant concentration represents the odorant<br />
content in nG [mg m –3 ] which fulfill the requirement for creating<br />
warning odour level – grade 3 (see Table I).<br />
Estimation of the minimal odorant concentration is<br />
determined by:<br />
K value [mg m –3 •<br />
] which represents the minimal concentration<br />
of an odorant in natural gas-air mixture which<br />
reliably ensures the warning odour level,<br />
• lower explosive limit (Ld ) –expressed by % vol. of natural<br />
gas in air,<br />
•<br />
and from the requirement to evoke the warning odour<br />
level before one fifth (i.e. 20 %) of LEL of natural gas<br />
in air is reached.<br />
Minimal odorant concentration c n can estimated according<br />
to the following formula:<br />
c<br />
n<br />
100 ⋅ K<br />
= [mg m<br />
0.<br />
2 ⋅ L<br />
–3 ]. (1)<br />
d<br />
Typical K values of commonly used odorants are<br />
0.08 for tetrahydrothiophene, 0.03 for mercaptans and<br />
0.07 mg m –3 for the GASODOR S-free odorant.<br />
Odour intensity is the extent of odour perception which<br />
is by the odour evoked. Commonly the odour intensity is evaluated<br />
as an odorisation level. List of odorisation levels can<br />
be found in the Table I.<br />
Results<br />
Two samples of a real odorised “Russian” natural gas<br />
sampled directly from natural gas pipeline into tedlar sam-
Chem. Listy, 102, s265–s1311 (2008) Environmental Chemistry & Technology<br />
ple bags were used for all experiments. Both samples were<br />
analyzed by GC-MS and an overview of obtained odorant<br />
concentrations is given in Table II.<br />
Table I<br />
Odorisation Levels according to TPG 918 01(ref. 2 )<br />
Odorisation<br />
level Olfactory perception Comment<br />
(grade)<br />
0 Odour not detected –<br />
1 Very low intensity Odour threshold<br />
2 Weak odour –<br />
3 Mean odour Warning odour level<br />
4 Strong odour –<br />
5 Very strong odour –<br />
6 Extremely strong Upper limit of intensity<br />
odour<br />
Table II<br />
Samples overview<br />
DMS TBM Total<br />
[mg m –3 ]<br />
Sample 1 <strong>2.</strong>71 3.31 6.02<br />
Sample 2 3.32 4.35 7.67<br />
For the estimation of odorisation level shortened examination<br />
described in technical norm ČSn 38 5550 1 was<br />
applied. In this test the odour threshold (grade 1) is estimated<br />
as a first point and the warning odour level (grade 3)<br />
as a second point. From obtained data (mean value from all<br />
observers mean values) the dependence of odorisation level<br />
on odorant concentration in natural gas was created.<br />
The measurement was carried out by two different<br />
groups of observers.<br />
The first one (GROUP 1), consisted of professional<br />
observers who satisfied the conditions listed in ČSn En<br />
13725 3 for performing the olfactometry measurement.<br />
The second one (GROUP 2), consisted of observers who<br />
are performing the subjective odorisation control in gas distribution<br />
companies.<br />
Obtained data are given in Figs. 1. and <strong>2.</strong> Each of them<br />
represents the dependence of odorisation level on the odorant<br />
concentration in natural gas – air mixture.<br />
Conclusions<br />
Performed measurement shows considerable subjectivity<br />
of an olfactometry measurement of the odorisation<br />
level. While observers from Group 1 respond accurately with<br />
minimal deviations, observers from Group 2 respond in wide<br />
range of dilution with considerably scattered results. This<br />
result is connected with the sensitivity threshold across population<br />
and to some extent with professional deformation of<br />
s488<br />
Fig. 1. Dependence of odorisation level on the odorant concentration<br />
for Sample 1<br />
Fig. <strong>2.</strong> Dependence of odorisation level on the odorant concentration<br />
for Sample 2<br />
employees carrying out the on-site olfactometry odorisation<br />
control of nG at selected points on natural gas grid.<br />
From the data obtained from Group 1, the K value for<br />
the odorant used in samples can be estimated. This value<br />
is considerably lower than the K value, which is currently<br />
used in the Czech Republic (the obtained K value lies under<br />
0.003 mg m –3 comparing to published 0.07 mg m –3 in the<br />
national technical regulation 2 ).<br />
As a main result of accomplished experiments it can be<br />
strictly recommended to prefer objective method for periodic<br />
odorisation control. nowadays gas distribution companies<br />
slowly change the way of odorisation control considering the<br />
objective control as the guarantee of safe gas distribution and<br />
utilization up to end customers.<br />
This work has been partly supported by MSM 604 613<br />
73 04.<br />
REFEREnCES<br />
1. ČSn 38 5550; Odorizace topných plynů, 1986.<br />
<strong>2.</strong> TPG 918 01; Odorizace zemního plynu, 200<strong>2.</strong><br />
3. ČSn En 13 725; Kvalita ovzduší. Stanovení koncentrace<br />
pachových. látek dynamickou olfaktometrií, 2003.
Chem. Listy, 102, s265–s1311 (2008) Environmental Chemistry & Technology<br />
P74 CONTAMINATION OF SOIL AND<br />
ALIMENTARy whEAT IN ZEMPLíNSKA<br />
POLLuTED AREA<br />
Ján TOMáŠ, JURAJ ČéRY, LADISLAV LAHUČKý and<br />
JAnETTE MUSILOVá<br />
Departmentt of Chemistry, Faculty of Biotechnology and<br />
Food Sciences, Slovak University of Agriculture, Tr. A. Hlinku<br />
2, 949 01 Nitra, Slovak Republic,<br />
jan.tomas@uniag.sk<br />
Introduction<br />
Soil is a determining component of environment by<br />
its range and function that belongs to the basic technologic<br />
instruments and it is not an only revealing resource. Agrocosystems<br />
and mainly soil of these actively react on entries<br />
of polluted substances, which cause its biological degradation.<br />
Inorganic contaminants belong to main factors of biological<br />
degradation, heavy metals and metalloids are cummulated<br />
in soil environment. Our soils situated in key area<br />
(Strednozemplínska area) are exposed to an emissions effect<br />
from many sources for a long time period. It is proved mainly<br />
by acidification of soil horizons, exceeded content of heavy<br />
metals in soil and consequently in above-ground mass in this<br />
contaminated were found.<br />
Experimental<br />
We have collected the soil samples from exactly given<br />
places by the GPS system. Then we have processed information<br />
in the OziExplorer program, where the gained points<br />
were also evaluated. We have gained the soil samples from<br />
two depths 0–0.1 m (A horizon) 0.2–0.35 (B horizon). The<br />
soil samples have been taken by geological probe GeoSampler.<br />
The contents of the risky elements has been elevated on<br />
areas with active agricultural activity in Humenné location<br />
where we could assume that the observed area is contaminated<br />
by the reason of widespread industrial activity in this<br />
region. The contents of risky elements were determinated<br />
in aqua regia as a pseudototal content in 2M HnO 3 as the<br />
potential mobilized forms.<br />
Results<br />
The total content of the risky elements in soils includes<br />
all forms of the occurrence of exact element in soil. In our soil<br />
samples we have determined the contents of these chosen risky<br />
elements Cd, Pb, ni, Zn, Cu, Cr, Co. We have evaluated the<br />
measured results by law no. 220/2004 about protection and<br />
exploitation of agricultural soil and resolution no. 531/1994.<br />
The evaluated area has exceeded the limit values in aqua regia<br />
solution in A horizon in the case of four following risky elements<br />
Cd, ni, Zn and Co. Content of Cd was increased in all<br />
gained points in the observed horizon. The interval of values<br />
has been in range of 1.10 to 1.90 mg Cd kg –1 soil. The highest<br />
value presented was exceeding 171 % to the limit value. The<br />
content of ni moved in wide interval of 40.4–70.4 mg ni kg –1<br />
of soil. At the highest content the limit value has exceeded by<br />
s489<br />
40.8 %. The limit value of Zn enhanced in one gained point<br />
where the value presented 153.2 mg kg –1 that means exceeding<br />
at <strong>2.</strong>1 %. The content of Co moved in wide interval from<br />
19.6–29.6 mg kg –1 . The limit value for Co exceeded in all<br />
gained points. Limit value was at the highest concentration<br />
enhanced by 97.3 %.<br />
In B horizon in digestion of aqua regia the limit values<br />
of all metals also exceeded. The content of Cd was increased<br />
in the observed horizon by all gained points. The interval of<br />
the value moved from 1.30 to <strong>2.</strong>0 mg Cd kg –1 of soil. The content<br />
of Pb moved in wider range 39.6–114.8 mg Pb kg –1<br />
of the soil and it was measured in two gained points. The<br />
highest content means increase at 64 %. The content of ni<br />
exceeded in six gained points. The highest content presented<br />
the value 5<strong>2.</strong>8 %. The increased content of Cu and Cr at the<br />
present area has a detailed character; the highest value of<br />
Cu exceeded the limit value at 1<strong>2.</strong>6 %. The highest measured<br />
value of Cr, 86.8 mg kg –1 soil means increasing by 24 %.<br />
Measured values of Co we have found were in a range from<br />
19.2–40.0 mg kg –1 . The limit value for Co was exceeded in<br />
all gained points. The content of heavy metals in 2M HnO 3<br />
solution represented the potential mobilized content which<br />
includes different fraction of elements from the view of their<br />
solubility. The content of Cd in A horizon in Humenné area<br />
has moved in the range of interval 1.9–3.2 mg kg –1 . The value<br />
3.2 mg kg –1 presented 10.6 fold increasing towards the reference<br />
value. The contamination by Cd has a broad character<br />
and affects all the gained points. The measured value of Pb was<br />
in the range 13.1–185.0 mg kg –1 . Other values of the heavy<br />
metals which were measured in A horizon doesn’t express the<br />
enhanced potential mobility and their contents were under the<br />
limit value. The content of Cd in B horizon was in the range<br />
1.9–3.5 mg kg –1 . Its highest value is increased at 11.6 fold<br />
to the reference value. The content of Pb in potential available<br />
form was in the range 100.4–253.6 mg kg –1 in B horizon.<br />
Risky elements have ability to get from the foodstuffs<br />
from soil, water and air as contaminants, some of them could<br />
be natural compounds of foodstuffs. By evaluation of grinding<br />
fractions from the standpoint of heavy metals we have<br />
found out that the limit value of Co has been exceeding. The<br />
value of Co was in the range 0.047–0.287 mg kg –1 the area of<br />
Humenné. The highest acceptable amounts exceeded in the I.<br />
and IV. milling fractions. The limit value has been enhanced<br />
at 218.5 %. The content of Pb was <strong>2.</strong>5 fold higher than the<br />
limit value in the analyzed wheat grain. The cultivated winter<br />
wheat is not suitable for food processing from the point of<br />
Foodstuff Codex.<br />
Conclusions<br />
The contamination in the monitored area has an anthropogenic<br />
character which is caused by the industrial emissions<br />
produced by chemical factories situated in the surroundings<br />
Strážske and Humenné. With the observation of pseudototal<br />
(total) and potentially mobile contents of the risky and trace<br />
elements in area of Humenné, we can state that the contents<br />
of risky elements in A horizon exceeded in the case of Cd,
Chem. Listy, 102, s265–s1311 (2008) Environmental Chemistry & Technology<br />
ni, Co and Zn. The pseudototal contents of the determined<br />
elements show the local enhancement of all heavy metals in<br />
B horizon. The potentially mobilized forms of the risky elements<br />
were assessed in 2M HnO 3 these limit values exceeded<br />
in horizons A and B in the case of Cd and Pb. The highest<br />
acceptable amounts were increased in the I. and IV. milling<br />
fractions.<br />
This work has been supported by project VEGA No.<br />
1/0339/08.<br />
s490<br />
REFEREnCES<br />
1. Linkes V.: Monitoring of soils of the Slovak Republic.<br />
The Research Institute of Soil Fertility, Bratislava,<br />
1997.<br />
<strong>2.</strong> Vollmannová A., Tóth T., Lazor P., Stanovic R., Trebichalský<br />
P.: Input of risk metals into the agricultural<br />
crops cultivated near of old environmental burdens. 12th<br />
Inter. Sci. conf. nitra, 2008.<br />
3. Toth T., Lazor P., Melichacova Arvay J., Harangozo L.:<br />
Risk of application of sludge on soil hygiene. Science of<br />
younger researchers. MZLU, Brno, 2006.
Chem. Listy, 102, s265–s1311 (2008) Environmental Chemistry & Technology<br />
P75 DETERMINATION OF ChANGES IN SOIL<br />
ORGANIC MATTER CONTENT ThROuGh<br />
CARbON AND NITROGEN LAbILE<br />
FRACTIONS<br />
e. TOBIAŠOVá, T. TóTH, and V. ŠIMAnSKý<br />
Slovak Agricultural University in Nitra, Tr. A. Hlinku 2, 949<br />
76 Nitra, Slovak Republic,<br />
Erika.Tobiasova@uniag.sk<br />
Introduction<br />
The quantity and quality of soil organic matter (SOM)<br />
are the most important characteristics, which influence the<br />
sustainable development. Much more sensitive indicators of<br />
dynamic changes of C and n are their fractions, labile carbon<br />
or potentially mineralizable nitrogen 1 . Techniques for<br />
isolating individual carbon fractions are different. Usually<br />
there is acid hydrolysis by H 2 SO 4 with different concentrations<br />
2 or HCl 3 . Other developed method was a fractionating<br />
method of SOM and fractions or substrates of SOM based on<br />
the susceptibility to oxidation by permanganate 4 . Modification<br />
and standardization of KMnO 4 oxidation technique 5 has<br />
increased the precision and simplified the technique, using<br />
only one concentration of KMnO 4, thereby dividing soil carbon<br />
into labile (C L ) and non-labile (C nL ) carbon. Research<br />
focuses on possibilities of SOM changes evaluation through<br />
the C T – total organic carbon, C L – labile carbon, C nL – nonlabile<br />
carbon, L C – lability of soil organic carbon, LI C – lability<br />
index of carbon, CPI – carbon pool index, CMI – carbon<br />
management index, n T – total nitrogen, n L – potentially mine-<br />
Table I<br />
Mean values of parameters of SOM quality<br />
Farming system Plot<br />
ESa ISb 5 7<br />
LC 0.216 ac 0.229 a 0.224 a 0.222 a<br />
LIC 1.045 a 1.170 a 1.100 a 1.117 a<br />
CPI 1.076 a 1.182 a 1.162 a 1.095 a<br />
CMI 1.126 a 1.380 b 1.274 a 1.232 a<br />
Ln 0.109 a 0.078 a 0.103 a 0.085 a<br />
LIn <strong>2.</strong>304 a 1.167 a <strong>2.</strong>079 a 1.392 a<br />
nPI 1.090 a 0.997 a 1.132 a 0.955 a<br />
nMI <strong>2.</strong>542 a 1.123 a <strong>2.</strong>359 a 1.306 a<br />
[g kg –1 ]<br />
CT 1<strong>2.</strong>885 bc 11.422 a 1<strong>2.</strong>205 a 1<strong>2.</strong>102 a<br />
CL <strong>2.</strong>289 a <strong>2.</strong>122 a <strong>2.</strong>220 a <strong>2.</strong>191 a<br />
CnL 8.963 a 9.299 a 8.352 a 9.910 a<br />
[mg kg –1 ]<br />
nT 1338.2 a 1168.3 a 1341.7 a 1164.8 a<br />
nL 129.2 b 100.2 a 12<strong>2.</strong>5 a 106.8 a<br />
nnL 1209.0 a 1068.2 a 1219.2 a 1058.0 a<br />
a Ecological farming system,<br />
b Integrated farming system,<br />
c Values followed by the same letter within each column are<br />
not significantly different at P < 0.05<br />
s491<br />
ralizable nitrogen, n nL –non-labile nitrogen, L n – lability of<br />
soil nitrogen, LI n – lability index of nitrogen, nPI – nitrogen<br />
pool index, nMI – nitrogen management index and selection<br />
of suitable parameters for sensitive reaction on SOM changes<br />
also in agro-ecosystems.<br />
Experimental<br />
The studied territory of Malanta (lat. 18°08’n and long.<br />
18°08’E) is located in the lower part of Selenec creek basin<br />
and its tributaries which belong to the central part of nitra<br />
river basin. The geological substratum is created of few<br />
existing rocks with high quantities of fine materials. The soil<br />
is Orthic Luvisol. The average annual temperature of air was<br />
9.6 °C and mean annual precipitation was 633 mm. The project<br />
with ecological (ES) and integrated (IS) farming systems<br />
was established in 1990. We collected the soil samples in the<br />
period 2005–2007. We determined C T 6 , CL 4 , nT 7 and nL 8 in<br />
soil samples. We calculated C nL , L C , LI C , CPI and CMI 5 . We<br />
used this procedure for evaluating changes of soil nitrogen,<br />
as well. Data were analyzed using analysis of variance and<br />
differences were determined using the Duncan test. We used<br />
correlation to determine the relationships between studied<br />
parameters.<br />
Results<br />
Statistically significant higher average contents of C L<br />
were determined in ES than IS. Higher content of C L was<br />
in fertilized variants than in variants without fertilization<br />
(Table I).<br />
In our study contents of phosphorus (r = 0.599, P < 0.01)<br />
and potassium (r = 0.488, P < 0.05) had statistically significant<br />
influence on C L . L C was higher in fertilized variants (0.223)<br />
than in variants without fertilization (0.202). L C was in negative<br />
correlation with pH KCl (r = –0.452, P < 0.05). Values of<br />
LI C were in correlation with pH KCl (r = –0.471, P < 0.05). On<br />
average, statistically significant higher average CMI value<br />
was in IS (1.38) than in ES (1.13), which showed on higher<br />
changes in organic carbon sources in ES. CMI values showed<br />
whether dominant processes are carbon losses or processes of<br />
new organic substances production. Statistically significant<br />
differences of n L contents were also found between farming<br />
systems. On average higher n L content was in ES 129 mg kg –<br />
1 than in IS 100 mg kg– 1 . Values of nL were in negative correlation<br />
with base exchangeable cations (r = –0.416, P < 0.05)<br />
and degree of saturation (r = –0.404, P < 0.05). Content of<br />
n nL was in positive correlation with content of phosphorus<br />
(r = 0.564, P < 0.01) and potassium (r = 0.664, P < 0.01).<br />
Conclusions<br />
The results focused on the necessity of application,<br />
predominantly of carbon and nitrogen fractions on the evaluation<br />
of quality changes and losses of SOM. According to<br />
statistical assesment suitable parameters for sensitive reaction<br />
on SOM changes in agro-ecosystems seems to be mainly<br />
parameters C L , L C , CMI and n L .
Chem. Listy, 102, s265–s1311 (2008) Environmental Chemistry & Technology<br />
Project supported by the Scientific Grant Agency of Education<br />
Ministry of Slovak Republic and Slovak Academy of<br />
Sciences (No. 1/0092/08 and No. 1/0457/08).<br />
REFEREnCES<br />
1. Schjonning P., Munkholm L., Elmholt S., Olesen J. E.:<br />
Agric. Ecosyst. Environ. 122, 157 (2007).<br />
<strong>2.</strong> Rovira P., Vallejo V. R.: Geoderma 107, 109 (2002).<br />
3. Silveira M. L., Comerford n. B., Reddy K. R., Cooper<br />
W. T., El-Rifai H.: Geoderma 144, 405 (2008).<br />
s492<br />
4. Loginov W., Wisniewski W., Gonet S. S., Ciescinska B.:<br />
Pol. J. Soil Sci. 20, 47 (1987).<br />
5. Blair G. J., Lefroy R. D. B., Lisle L.: Austr. J. Agric.<br />
Res. 46, 1459 (1995).<br />
6. nelson D. W., Sommers L. E., in: Total carbon, organic<br />
carbon and organic matter. (Sparks, D. L., ed.), chapter<br />
III, p. 961. ASA & SSSA, Madison 1996.<br />
7. Bremmer J. M. Nitrogen-total. (Sparks D. L., ed.), chapter<br />
III, p. 1085. ASA & SSSA, Madison, 1996.<br />
8. Standford G., Smith S. J.: Soil Sci. 126, 210 (1978).
Chem. Listy, 102, s265–s1311 (2008) Environmental Chemistry & Technology<br />
P76 DISTRIbuTION OF hEAVy METALS IN SOILS<br />
TOMአTóTH, JURAJ ČéRY, Ján TOMáŠ, ALEnA<br />
VOLLMAnnOVá and PETER LAZOR<br />
Department of Chemistry, Faculty of Biotechnology and Food<br />
Sciences, Slovak Univeristy of Agriculture, Tr. A. Hlinku 2,<br />
949 01 Nitra, Slovak Republic,<br />
tomas.toth@uniag.sk<br />
Introduction<br />
The soil quality is derived from its loading by hazardous<br />
substances. The loading of soil occurs when the soil is not<br />
able to lower the negative influences of the heavy metals. The<br />
reference value, which represents natural content of heavy<br />
metals in soil, forms the basis for evaluation of the content of<br />
heavy metals in soil. The important parameters for the input<br />
of heavy metals from soil into plants are: the soil reaction,<br />
the content and the quality of organic matter, the nutrition<br />
of plants, cation exchange and sorption capacity, the microbiological<br />
activity, the oxidation and reduction potential, the<br />
amount and the quality of the clay fraction of soil and the<br />
methods of soil cultivation, etc.<br />
Experimental<br />
The hazardous heavy metals were determined in eight<br />
soil subtypes. Their choice was concentrated on the lowland<br />
regions (Trnovec n/V. – haplic chernozems, Imeľ – eutric<br />
fluvisols, Čičarovce – luvic stagnosols, Dolný Štál – mollic<br />
fluvisols, Veľké Leváre – haplic arenosols, Malanta – haplic<br />
luvisols). We took four parallel soil samples to be able to examine<br />
the soil homogenity of the monitored area. The samples<br />
from the pedological probe were taken from the depth<br />
of 0–0.1 m; 0.20–0.30 m; 0.35–0.45 m. The state of the soil<br />
hygiene was examined by evaluation of the total contents of<br />
Cd, Pb, Cr, Cu and Zn. The total contents were determined after<br />
the mineralization by wet way H 2 SO 4 , HnO 3 and HClO 4<br />
using the method of atomic absorption spectrometry. We also<br />
determined the heavy metals in the pedological probe to be<br />
able to estimate the anthropogenical and geochemical origin<br />
of the heavy metals. The above mentioned heavy metals<br />
were determined in the extract of 2M HnO 3 and in cold. The<br />
mobilizable forms of heavy metals were determined in the<br />
extract with 0.05M EDTA. The mobile heavy metal forms<br />
were determined in extract of 0.01M CaCl 2 .<br />
Results<br />
The valid legislation was used for the evaluation of soil<br />
hygiene. The evaluation is influenced by determination of the<br />
total contents of heavy metals and by the determination of<br />
heavy metals in 2M HnO 3 leach. Contents of heavy metals<br />
in 2M HnO 3 ; 0.05M EDTA and 0.01M CaCl 2 and the percentage<br />
abundance of Zn, Cu, Cr, Pb and Cd in individual<br />
extractants. The following order of extractability for individual<br />
extractants is evident. The results of determination<br />
of actual mobilizable forms are considered to be the most<br />
acceptable. The percentage contents of individual heavy<br />
s493<br />
metals and the total content of heavy metals in highly contaminated<br />
soil are as follows: Zn 1.7–13.9 %; Cu 14.1–6<strong>2.</strong>6 %;<br />
Cr 0.1–1.3 %; Pb 14.6–24.1 %; Cd 1<strong>2.</strong>9–2<strong>2.</strong>8 %. EDTA and<br />
natrium and ammonium of EDTA are able to form stable<br />
and defined complexes with heavy metal cations and they<br />
cause the solubility of carbonates and oxides Fe and Al. The<br />
exctracted contents of heavy metals were measurable during<br />
the use of flame AAS. The mutual interactions of Zn, Cu, Cr,<br />
Pb and Cd with the soil components influence the pH value,<br />
content and quality of organic substances. Apart from the<br />
above mentioned soil properties, there are many other variable<br />
soil properties. The lowest Zn solubility was determined<br />
in subtypes of luvic stagnosols and eutric cambisols with pH<br />
values in the acid part and the quality of mould expressed<br />
by the ratio of humic acids to fluvic acid was the lowest but<br />
on the other hand the percentage of mould has one of the highest<br />
values. The solubility of Cu in 2M HnO 3 and in 0.05M<br />
EDTA was in all soil subtypes the highest and it is especially<br />
valid for haplic arenosols, haplic chernozems, mollic fluvisols<br />
(FL m ). The order of solubility for the determined elements<br />
and and extractants was as follows: 2M HnO 3 > 0.05M<br />
EDTA > 0.01M CaCl 2 .<br />
The lowest amount of Cd and Pb from haplic arenosols<br />
(RM g ) were extracted by extraction with 2M HnO 3 and<br />
0.05M EDTA and the highest amounts of Cd were obtained<br />
from mollic fluvisols, haplic chernozems. The evaluation of<br />
heavy metal contents extracted from individual extractants<br />
at different pH values, the content of mould and its qualitative<br />
composition is not unequivocal and dependence between<br />
variable soil properties and conditions of environment<br />
disappear.<br />
The solubility of Cu in 2M HnO 3 and in 0.05M EDTA<br />
was in all soil subtypes the highest and it is especially valid<br />
for haplic arenosols, haplic chernozems, mollic fluvisols.<br />
The order of solubility for the determined elements and and<br />
extractants was as follows: 2M HnO 3 > 0.05M EDTA > 0.01M<br />
CaCl 2 . We think that the best extractant is 0.05M EDTA with<br />
restriction to Cd, Pb, Cu and partially for Zn. It is not possible<br />
to find an universal extractant for evaulation of heavy metals<br />
mobility in soil.<br />
Conclusions<br />
(i)The extractability for individual ectractans is evident:<br />
2 mol dm –3 HnO 3 : Cu > Cd > Pb > Zn > Cr; 0.05 mol dm –3<br />
EDTA: Cu > Cd > Pb > Zb > Cr; 0,01 moldm –3 CaCl 2 :<br />
Cd > Cu > Pb > Zn > Cr. (ii) It is necessary to emphasize the<br />
differences in solubility between the highly contaminated<br />
eutric cambisols of Stredný Spiš and other analyzed soils.<br />
The different solubility is in all extractants and heavy metals<br />
except the solubility of chromium in 0.05M EDTA and<br />
0.01M CaCl 2 . It is probably connected with the high portion<br />
of heavy metals of immissional origin. The other analyzed<br />
soil subtypes have a low solubility of Zn in HnO 3 and EDTA<br />
in luvic stagnosols.
Chem. Listy, 102, s265–s1311 (2008) Environmental Chemistry & Technology<br />
This work has been supported by projects KEGA No.<br />
3/4282/08 and VEGA No. 1/0339/08<br />
REFEREnCES<br />
1. Arvay J., Melichacova S., Lahucky L., Musilova J., Bystricka<br />
J.: Food safety and control: The crops quality cultivated<br />
on heavy metals contaminated soil from Region<br />
Hont, Nitra, March 28–29, 2008, Book of Works, nitra,<br />
2007.<br />
<strong>2.</strong> Bajcan D., Lahucky L., Stanovic R., Arvay J.: IX Banskostiavnicke<br />
Days: Agricultural plants hygiene growed<br />
on metalic loaded aluvial soils. Zvolen 2007.<br />
s494<br />
3. Bujnovsky R., Jurani B.: Plant and soil: Quality of soil<br />
its determination and evaluation. The Research Institute<br />
of Pedology and Soil, Bratislava, 1998, 150 p.<br />
4. Linkes V.: Monitoring of soils of the Slovak Republic.<br />
The Research Institute of Soil Fertility, Bratislava,<br />
1997.<br />
5. Makovnikova, J.: Dissertation. The Research Institute of<br />
Soil Fertility, Bratislava, 1998<br />
6. Stanovic R., Harangozo L., Arvay J.: 59 th Chemical<br />
Congress: Influence of sulphur to arsen toxicity in agricultural<br />
plants, ChemZi 1/3 2007.
Chem. Listy, 102, s265–s1311 (2008) Environmental Chemistry & Technology<br />
P77 MuLTICOMPONENT<br />
MICRODETERMINATION OF ARSENIC,<br />
ANTIMONy, TELLuRIuM, SELENIuM<br />
bESIDES OF ThALLIuM by ICP-MS IN<br />
wATERS<br />
KRISTýnA URBánKOVá, JIří MACHáT and LUMíR<br />
SOMMER<br />
Brno University of Technology, Chemistry and Technology of<br />
Environmental Protection, Purkyňova 118, 612 00 Brno,<br />
urbankova@fch.vutbr.cz<br />
Introduction<br />
The concentration of As and Tl in the environment is<br />
controlled by strict guidelines. Since considerable affection<br />
of the human organism is described for As and Tl 1,2 . Te is<br />
more toxic than Se but little is known about its requirements.<br />
Se is longely known for its ambivalency and particular essentiality<br />
for the human and animal organism and its implication<br />
in various enzymes on trace levels. Arsenic compounds are<br />
an important dopant for the semiconductor silicon production<br />
and a modifier of mechanical properties in lead and copper<br />
alloys. Complicated hydrolytic equilibria can be present in<br />
dilute aqueous solutions in dependence on pH 3 .In fact, these<br />
equilibria in aqueous solutions have little influence on the<br />
results of ICP-MS only. The multicomponent microdetermination<br />
of inorganic As, Sb, Se, Te and Tl with ICP-MS is<br />
remarkable selective and sensitive and has not been studied<br />
in detail 4 .<br />
Experimental<br />
C h e m i c a l s<br />
Standard solutions of Se, Te, As, Sb and Tl with<br />
100 μg dm –3 were prepared by dilution from original solutions<br />
containing 1.000 ± 0.002 g dm –3 metals which were<br />
purchased from Analytica s.r.o., Prague.<br />
A multicomponent standard containing<br />
1.000 ± 0.002 g dm –3 Al, Ba, Ca, Cd, Co, Cr, Cu, Fe, Mg, Mn,<br />
na, ni, Pb, Ti, Zn was also from Analytica s.r.o. Prague.<br />
The tuning solutions for ICP-MS were 1 mg dm –3 of<br />
Ce 3+ , Li, Y, and Tl + in 2% HnO 3 . In such solution must be<br />
the ratio CeO + /Ce + ≤ 1.5 % and Ce 2+ /Ce + ≤ 3 % for bivalent<br />
ions. The solution containing 1 mg dm –3 of Co 2+ in 1% HCl<br />
was used for tuning with the Helium collision cell.<br />
I n s t r u m e n t a t i o n<br />
An ICP-MS spectrometer Agilent 7500ce Japan was<br />
used with a plasma generator of 27.12 MHz and the power<br />
output 1,500 W. The sample nebulized by a concentric silica<br />
nebulizer MicroMist with a cooled Scott chamber entered<br />
by an injector of <strong>2.</strong>5 diameters into the plasma.<br />
The flow of the carrier argon trough the nebulizer was<br />
1 dm 3 min –1 and contained the make up argon 0.33 dm 3 min –1 .<br />
A constant temperature 2 °C of the nebulising chamber was<br />
maintained.<br />
s495<br />
Results<br />
no polyatomic interferences were observed for selected<br />
isotopes 75 As, 82 Se, 121 Sb, 125 Te and 205 Tl such as Ar 2+ , ArH + ,<br />
ArO + and Arn + . Six-points calibration plots for selected element<br />
isotopes were strictly linear for concentrations less than<br />
1,000 μg dm –3 in solutions containing 0.5% HnO 3 . The signal<br />
intensity considerably decreases with the increasing concentration<br />
of acids. For the hydrochloric acid the decrease is<br />
6 % for 205 Tl and 11% for 75 As with 5% HCl, With HnO 3 ,<br />
the decrease is 30% for 82 Se and 125 Te but for 75 As and 205 Tl<br />
15%. The medium of 0.5% HnO 3 is optimal and recommended<br />
for the measurement.<br />
I n t e r f e r e n c e s<br />
The effect of 1–250 mg dm –3 of na, K, Ca, Mg, Al,<br />
Fe(III), on the signal intensity was evaluated for 100 μg dm –3<br />
in 0.5 % HnO 3 . For 1–10 mg dm –3 of the matrix element the<br />
error for the microelement signal does not exceed 5 %. For<br />
50 mg dm –3 of the matrix element, the error for the microelements<br />
increased to 15–20 % in the presence to Ca, Mg,<br />
Al and Fe(III). On the other hand, 250 mg dm –3 of na and K<br />
cause less than 10% error for 100 μg dm –3 As, Se, Sb, Te, Tl.<br />
In the presence of 1–100 μg dm –3 of multicomponent<br />
solution containing Al, Ba, Ca, Cd, Co, Cr, Cu, Fe, Mg, Mn,<br />
na, ni, Pb, Ti, Zn with 100 μg dm –3 of 75 As, 82 Se, 121 Sb, 125 Te<br />
and 205 Tl a considerable interference was observed and the<br />
signal decreased up to 70 %. The error can be decreased in<br />
the presence of 100 μg dm –3 of internal standard. 72 Ge was<br />
suitable for 75 As in the He mode and 82 Se in the normal mode<br />
and 209 Bi was suitable for the remaining elements measured<br />
in normal mode (Fig. 1.).<br />
A p p l i c a t i o n o f W a t e r S a m p l e s<br />
Five-point strictly linear calibration plots with spiked<br />
microelements were carried out for all kinds of waters. The<br />
slopes of the regression lines were compared with that of ultra<br />
pure water to evaluate the influence of the matrix which cause<br />
some signal decrease by 5 %. This error can be diminished by<br />
using internal standards especially for sea and mine waters.<br />
Fig. 1. The influence of multicomponent standard on the intensity<br />
of signal of 100 μg dm –3 of 75 As, 82 Se, 121 Sb, 125 Te and 205 Tl in<br />
the presence or absence of internal standard ( 72 Ge and 209 bi)
Chem. Listy, 102, s265–s1311 (2008) Environmental Chemistry & Technology<br />
The detection limits were expressed according to UPAC 5 .<br />
For 75 As was the limit of detection 0.05–0.08 μg dm –3 ,<br />
for 82 Se 0.04–0.03 μg dm –3 , 121 Sb 0.03–0.01 μg dm –3 ,<br />
125 Te 0.3–0.02 μg dm –3 and for 205 Tl 0.005–0.2 μg dm –3 .<br />
The evaluation of the contents of microelements resulted<br />
form spikes 1, 3 and 5 μg dm –3 in solutions containing 0.5%<br />
HnO 3 . The proper contents of the microelements in the sea<br />
and mine waters resulted from the corrected calibration plot<br />
by the standard addition method since their contents is higher<br />
than the detection limit of these elements.<br />
For the drinking, surface and mineral waters, the evaluation<br />
was realized directly from the spikes, comparing the<br />
corrected regression equation of the calibration plot. This<br />
was because the amounts of microelements were below their<br />
detection limit.<br />
Selected internal standards 72 Ge for 75 As in the He mode<br />
and 82 Se in the normal mode and 209 Bi for the remaining elements,<br />
measured in normal mode were always used during<br />
evaluation. The confidence intervals according to Dean and<br />
Dixon statistics 6 for triplicate analyses were used.<br />
Table I<br />
Evaluation of results from 1, 3 and 5 μg dm –3 spikes used<br />
Drinking water Surface water Mineral water<br />
205 Tl 1.004 ± 0.005 3.006 ± 0.010 5.004 ± 0.009<br />
125 Te 1.003 ± 0.004 3.004 ± 0.009 5.005 ± 0.012<br />
121 Sb 1.003 ± 0.004 3.003 ± 0.008 5.003 ± 0.009<br />
82 Se 1.003 ± 0.002 3.004 ± 0.006 5.004 ± 0.007<br />
75 As 1.001 ± 0.003 3.001 ± 0.005 5.001 ± 0.004<br />
Conclusions<br />
75 As, 82 Se, 121 Sb, 125 Te and 205 Tl were determined in the<br />
concentration range ≤ 1,000 μg dm –3 in solution with 0.5%<br />
HnO 3 in the absence and presence of internal standards 72 Ge<br />
for 75 As in the Helium mode, 72 Ge for 82 Se in the normal<br />
mode and 209 Bi for 121 Sb, 125 Te and 205 Tl when the normal<br />
mode was used. 100 μg dm –3 of the microelement can<br />
s496<br />
Table II<br />
Evaluation of results by the method of standard deviation in<br />
the sea and mine water a<br />
Sea water Mine water<br />
205 Tl 0.017 ± 0.025 0.811 ± 0.036<br />
125 Te 0.022 ± 0.019 0.421 ± 0.032<br />
121 Sb 0.020 ± 0.013 0.229 ± 0.029<br />
82 Se 0.054 ± 0.015 1.012 ± 0.014<br />
75 As 0.020 ± 0.033 0.537 ± 0.041<br />
a Five-points calibration plots used<br />
be determined in the presence of 50 mg dm –3 of Ca, Mg, Al,<br />
Fe(III) with 15–20% error but in the presence of 200 mg dm –3<br />
of na, K with 10% error only. In the presence of 250 mg<br />
of a multicomponent sample with 100 μg dm –3 of studied<br />
elements the signal decrease. The error was decreased in the<br />
presence of 100 μg dm –3 of internal standard.<br />
For water samples the standard addition method was<br />
used for sea and mine water only to evaluate the microelements<br />
because the concentration of microelements exceeds<br />
the practical detection limits from the IUPAC recommendation.<br />
For surface and potable waters with the amounts<br />
of microelements below the detection limit three spikes were<br />
directly evaluated in triplicate according to Dean and Dixon<br />
statistics in the presence of internal standards.<br />
REFEREnCES<br />
1. Vercruysse A (ed.): Hazardous Metals in Human Toxikology<br />
Part B, Techniques and Instrumentatiton in analytical<br />
Chemistry, Elsevier Press, Amsterdam 1984.<br />
<strong>2.</strong> Das A. K., Chakraborty R., Cervera M. L., De la Guardia<br />
M., Anal.Bioanal.Chem. 385, 665 (2006).<br />
3. Bayes Ch. F., Messner R. E.: The Hydrolysis of Cations,<br />
Wiley, n. York 1976.<br />
4. Balaram V.: Atom. Spectroscopy 14, 174 (1993).<br />
5. Currie L. A.: Pure Appl. Chem 67, 1699 (1995).<br />
6. Dean R. B., Dixon W. J.: Anal. Chem 23, 636 (1951).
Chem. Listy, 102, s265–s1311 (2008) Environmental Chemistry & Technology<br />
P78 SEPARATION AND PRECONCENTRATION<br />
OF ARSENIC, ANTIMONy, SELENIuM AND<br />
TELLuRIuM ON MODIFIED SILICAGELS<br />
FOR ThEIR DETERMINATION by ICP-AES<br />
KRISTýnA URBánKOVá, LUMíR SOMMER and<br />
MARTIn MOOS<br />
Brno University of Technology, Chemistry and Technology of<br />
Environmental Protection,Purkyňova 118, 612 00 Brno,<br />
urbankova@fch.vutbr.cz<br />
Introduction<br />
The determination of toxic or ambivalent microelements<br />
arsenic, antimony, selenium and tellurium in water samples<br />
requires inevitably a preconcentration prior to the determination<br />
by ICP-AES. The separation and preconcentration by<br />
various solid phase extractions were earlier studied and such<br />
technique widely used for water samples. The complexation<br />
of these elements with organic reagents is of particular<br />
interest when interacting with various kinds of silica sorbent<br />
used. 1–5 The combination of organic reagent with cationic<br />
surfactant was examined for sorption in this paper.<br />
Experimental<br />
C h e m i c a l s<br />
All chemicals and solvents used were of analytical grade<br />
quality.<br />
Astasol standards for arsenic, antimony, selenium and<br />
tellurium containing 1.000 ± 0.002 g dm –3 of element were<br />
from Analytica Prague, Czech Republic.<br />
The cationic surfactant 1-ethoxycarbonylpentadecyltrimethylammonium<br />
bromide (Septonex ® ) from Aventa, Czech<br />
Republic and organic reagents 4-(2-Pyridylazo)resorcinol<br />
(PAR), Pyrrollidincarbodithioate (APDC), thiourea (THU)<br />
and 1,2-dihydroxybenzene (PYR) from Lachema, Czech<br />
Republic, diethyldithiocarbamidate (DTC) from Fluka,<br />
Switzerland and 8-hydroxyquinoline-5-sulphonic acid (8-<br />
HQS) from Aldrich, Germany were used.<br />
Modified sorbents were Separon SGX C18, C8, SGX<br />
nH 2 , SGX Cn, SGX RPS and SGX Phenyl with particle size<br />
60 μm, from Tessek Prague, Czech Republic.<br />
I n s t r u m e n t a t i o n<br />
An echelle based ICP-spectrometer with a prism-predisperser<br />
IRIS AP, (Thermo Jarell Ash) and CID detector with<br />
512 × 512 pixels for 195–900 nm, axial plasma discharge of<br />
1.35 kW and echelle grating with 54.4 lines were used.<br />
The following spectral lines [nm] As 228.8, Sb 231.1,<br />
Se 190.6 and Te 214.2 were suitable for final evaluation<br />
only because of their high intensity, selectivity and low background<br />
influences.<br />
s497<br />
Results<br />
S o r p t i o n o f E l e m e n t s o n t h e<br />
S i l i c a S o r b e n t i n t h e P r e s e n c e o f<br />
S u r f a c t a n t<br />
Prior to the sorption, the column was conditioned<br />
successively with 10 ml of distilled water and 10 ml of<br />
5 × 10 –4 – × 10 –2 mol dm –3 aqueous solution of surfactant.<br />
50 ml of solution containing 1 mg dm –3 of As, Sb, Se and<br />
Te (each of them) was always sorbed by a flow rate 1.0–<br />
3.0 ml min –1 at pH 7. The column was then rinsed with 10 ml<br />
of distilled water and the elements eluted with 10 ml of acetone-ethanol<br />
(1 : 1) mixture in the presence of 0.1 mol dm –3<br />
HCl which showed the highest elution efficiency. The organic<br />
eluent was always removed by evaporation under an infra-red<br />
lamp to 1 ml in a suitable Teflon dish.<br />
5 × 10 –3 mol dm –3 Septonex ® is optimal for the retention<br />
of inorganic form of As, Sb, Se and Te. The recovery values<br />
decrease from concentration larger than 1 × 10 –2 mol dm –3<br />
Septonex ® because of the competing influence of micelles<br />
formed under these conditions in solutions. The recovery was<br />
nearly 100 % on SGX C18 (C8) for Sb, Se and Te but for As<br />
it reaches 60 % only. On the other sorbents, the sorption efficiency<br />
decreased. As was retained from 4 % on SGX Phenyl<br />
to 15 % on SGX Cn. 70 % retention of Sb was on SGX nH 2 .<br />
The recoveries for Se were about 90 % for SGX nH 2 , RPS<br />
and Phenyl. On the other hand, more than 40 % of Te was<br />
retained on sorbent SGX RPS and nH 2 .<br />
E f f e c t o f O r g a n i c R e a g e n t s<br />
The retention of monitored microelements was carried<br />
out from 50 ml of solutions containing 1 mg dm –3 of each<br />
metal with organic reagents when the column was previously<br />
conditioned by 5 × 10 –3 mol dm –3 Septonex ® only.<br />
The sorption from solution containing 0.85 × 10 –4 –<br />
3.35 × 10 –4 mol dm –3 PAR was quantitative for Separon<br />
SGX C18, SGX C8, SGX Cn for Sb, Se and Te. On SGX<br />
C18 and C8 the retention of complexes was nearly 100 % for<br />
<strong>2.</strong>77 × 10 –4 –1.1 × 10 –3 mol dm –3 8-HQS and also 6.25 × 10 –4<br />
–8.33 × 10 –3 mol dm –3 PYR. The recoveries about 90 %<br />
were observed for 4.86 × 10 –4 –7.29 × 10 –4 mol dm –3 APDC<br />
and about 80 % for 4.90 × 10 –4 –1.50 × 10 –3 mol dm –3 DTC<br />
or 1.05 × 10 –3 –4.20 × 10 –3 mol dm –3 THU for Sb, Se and<br />
Te. The sorption of As was far from being quantitative.<br />
1.70 × 10 –4 mol dm –3 PAR can be used for the retention of As,<br />
Sb, Te on SGX nH 2 and SGX RPS for As, Sb, Se. On the<br />
other hand, <strong>2.</strong>77 × 10 –4 mol dm –3 8-HQS is optimal for Se on<br />
SGX nH 2 and SGX Phenyl and <strong>2.</strong>43 × 10 –4 mol dm –3 DTC<br />
was suitable for the retention of Te on SGX RPS, SGX Phenyl<br />
and for As on SGX Phenyl.<br />
E f f e c t o f S a m p l e V o l u m e<br />
The influence of sample volume was tested for the retention<br />
from 50–1,000 ml solution containing 0.2–0.01 mg dm –3<br />
each of element in the presence of the particular organic reagents<br />
after conditioning. This corresponds to a 5–100-fold
Chem. Listy, 102, s265–s1311 (2008) Environmental Chemistry & Technology<br />
enrichment of As, Sb, Se and Te which enables the final use<br />
of ICP-AES.<br />
Volumes of up to 1,000 ml have no effect on the retention<br />
efficiency on Separon SGX C18, C8 and SGX RPS.<br />
The sorption is however quantitative from 500 ml only on<br />
SGX nH 2 , SGX Cn and SGX Phenyl. The weakening of the<br />
retention forces of ionic associate or complexes on the surface<br />
of sorbent may supports the subsequent washing out of<br />
the element species from the column.<br />
A p p l i c a t i o n f o r W a t e r S a m p l e s o n<br />
S e p a r o n S G X C 1 8<br />
Standards of folowing elements were spiked to equilibrated<br />
drinking, mineral and river water samples containing<br />
no detectable amounts of these elements. The Separon SGX<br />
C18 was previously conditioned by 10 ml of distilled water<br />
and 10 ml of 5 × 10 –3 mol dm –3 Septonex ® . The sorption was<br />
provided from 250 ml of sample solutions in the presence of<br />
1.68 × 10 –4 mol dm –3 PAR. Conclusions<br />
Table I<br />
The recovery (%) of arsenic and antimony in water samples a<br />
Spikes<br />
[mg dm<br />
c b<br />
element Arsenic Antimony<br />
–3 ] [mg dm –3 ]<br />
Mineral water<br />
0.25 0.01 58.30 ± <strong>2.</strong>44 98.74 ± <strong>2.</strong>70<br />
0.50 0.02 60.02 ± <strong>2.</strong>60 101.3 ± 3.40<br />
1.00 0.04 60.23 ± 3.36<br />
River water<br />
99.54 ± <strong>2.</strong>87<br />
0.25 0.01 59.71 ± 3.14 100.9 ± <strong>2.</strong>39<br />
0.50 0.02 60.90 ± <strong>2.</strong>69 97.26 ± 3.53<br />
1.00 0.04 6<strong>2.</strong>34 ± <strong>2.</strong>43 100.9 ± 3.09<br />
aThe analysis was carried out in triplicate and evaluated<br />
according Dean and Dixon6 bConcentration in 250 ml of water sample<br />
s498<br />
Table II<br />
The recovery (%) of selenium and tellurium in water samples<br />
a<br />
Spikes c element b<br />
Selenium Tellurium<br />
[mg dm –3 ] [mg dm –3 ]<br />
Mineral water<br />
0.25 0.01 100.5 ± <strong>2.</strong>57 100.5 ± 3.06<br />
0.50 0.02 98.60 ± 3.00 99.50 ± 3.07<br />
1.00 0.04 99.23 ± <strong>2.</strong>66 99.78 ± <strong>2.</strong>33<br />
River water<br />
0.25 0.01 99.78 ± <strong>2.</strong>71 100.8 ± <strong>2.</strong>35<br />
0.50 0.02 98.90 ± <strong>2.</strong>80 99.64 ± <strong>2.</strong>47<br />
1.00 0.04 101.7 ± <strong>2.</strong>11 100.2 ± 1.73<br />
a The analysis was carried out in triplicate and evaluated according<br />
Dean and Dixon 6<br />
b Concentration in 250 ml of water sample<br />
The separation and preconcentration of arsenic,<br />
antimony, selenium and tellurium in the presence of<br />
1.68 × 10 –4 mol dm –3 4-(2-Pyridylazo) resorcinol after previous<br />
conditioning with 5 × 10 –3 mol dm –3 Septonex ® was<br />
described in this paper. This procedure was successfully used<br />
for determination of these elements by ICP-AES in real water<br />
samples.<br />
REFEREnCES<br />
1. Sturgeon R. E., Willie S. n., Berman S. S.: Anal. Chem.<br />
57, 6 (1985).<br />
<strong>2.</strong> Jitmanee K., Oshima M., Motomizu S.: Talanta 66, 529<br />
(2005).<br />
3. Gabros S., Rzepecka M., Bulska E., Hulanicki A.:<br />
Spectrochim. Acta Part B 54, 873 (1999).<br />
4. Zhang L., Merita Y., Sakuragawa A., Isozaki A.: Talanta<br />
72, 723 (2007).<br />
5. Dressler V. L., Pozebon D., Curtius A. J.: Spectrochim.<br />
Acta Part B, 1527 (1998).<br />
6. Dean R. B., Dixon W. J.: Anal. Chem. 23, 636 (1951).
Chem. Listy, 102, s265–s1311 (2008) Environmental Chemistry & Technology<br />
P79 TREATING wASTEwATER by uSING OF<br />
bIOCERAMIC FILTERS<br />
A. VAŠKOVá, I. ŠTYRIAKOVá and V. SnOPKOVá<br />
Department of Biotechnology, Insitute of Geotechnics of the<br />
Slovac Academy of Sciences , Watsonova 45, 043 53 Košice,<br />
Slovakia,<br />
avaskova@saske.sk<br />
Introduction<br />
nowadays, the control and treatment of industrial effluents<br />
has become one of the most important steps of the productive<br />
process, since the regulatory offices have been very<br />
rigorous about this subject 1 .<br />
Heavy metals are a group of contaminants that are high<br />
toxic to humans, animals, and aquatic lives and are commonly<br />
found in many munic pal and industrial wastes 4 . The<br />
toxicity of copper released into the environment has triggered<br />
a number of studies aimed at its removal from aqueous<br />
solutions. As a treatment approach, sorption in columns has<br />
widely been used in water treatment 2 . The using of bioceramic<br />
filters based on iron oxides, quartz sand, clay minerals,<br />
and bacteria could be an alternative way to remove heavy<br />
metals from industrial effluents. Iron oxides, a common constituent<br />
of soils, sediments, and aquifers, have high surface<br />
areas and are capable of adsorbing a significant quantity of<br />
metals. They are dominant adsorbents in many environments<br />
because of their capability to be finely dispersed and act as<br />
coatings on other particles 3 . A number of studies on metal<br />
uptake using quartz sands and clay minerals, have been conducted<br />
and results have shown good adsorption properties<br />
due to its metal-binding capacity and high surface area. Bacteria,<br />
in particular, are effiecient sorbents of heavy metals,<br />
although subtle differences can be seen between species and<br />
under various physicochemical conditions. Previous studies<br />
showed that the gram-positive bacteria Bacillus sp. was<br />
able to retain several heavy metals as silicate minerals or as<br />
oxyhydroxides at 20 and 4 °C under laboratory simulations<br />
of natural conditions.<br />
The concentration of some of the toxic metals are higher<br />
than permissible discharge levels in effluents. It, therefore,<br />
becomes necessary to remove these heavy metals from these<br />
wastewaters by an appropriate treatment before releasing<br />
them into the enviroment.<br />
Experimental<br />
The adsorption of copper by bioceramic filters was studied<br />
by column technique. In this study two types of filters<br />
were used and compared in sorption efficiency.<br />
M a g n e t i t e P r e p a r a t i o n<br />
Iron oxides can be easily synthetize in laboratory conditions.<br />
Synthetic magnetite (Fe 3 O 4 ) used in this work was<br />
prepared by partial oxidation of Fe 2+ solution at temperature<br />
90 °C under anoxic conditions in the presence of nitrogen ions<br />
-oxidizing agent. The surface area was 13 m 2 g –1 and particle<br />
s499<br />
size range from 0.05–0.2 µm. The main mineral phase was<br />
confirmed by RTG diffraction, IR spectroscopy and Mössbauer<br />
spectroscopy method.<br />
Fig. 1. xRD-pattern of synthetic magnetite<br />
C h a r a c t e r i z a t i o n o f Q u a r t z S a n d<br />
a n d C l a y M i n e r a l s<br />
Quartz sand used in this work was obtained from Šaštín<br />
Stráže deposit (Slovakia) and composed of quartz (88–90 %),<br />
feldspar (8–10 %), heavy minerals (1 %) and clay minerals<br />
(1 %) of grain size 0–1 mm. The clay mineral used in this<br />
study was bentonit composed of montmorillonite (60–80 %)<br />
obtained from Jelšový potok deposit.<br />
Table I<br />
Chemical composition of quartz sand<br />
Element [%] QS<br />
SiO 2 9<strong>2.</strong>7<br />
Al 2 O 3 3.95<br />
Fe 2 O 3 0.32<br />
TiO 2 0.06<br />
CaO 0.16<br />
MgO 0.15<br />
na 2 O 0.93<br />
K 2 O 1.32<br />
Cr 2 O 3 0.004<br />
MnO 0.02<br />
B a c t e r i a<br />
In this study two bacterial strains were isolated from<br />
the copper pollluted waste water of industry plant: Bacillus<br />
megaterium and Pseudomonas diminuta. The resistance of<br />
bacterial strains to copper was tested. The bacterial isolate<br />
Bacillus megaterium could grow at a concentration ranging<br />
from 52–260 mg Cu dm –3 and Pseudomonas diminuta at<br />
a concentration max 52 mg Cu dm –3 , at temperature 25 °C.<br />
Therefore Bacillus sp. isolate was used for this study. The<br />
bacterial isolate Bacillus sp. was inoculated into flask containing<br />
nutrient broth (Merck) and aerobically cultivated
Chem. Listy, 102, s265–s1311 (2008) Environmental Chemistry & Technology<br />
at 25 °C by the agitating at the speed of 150 rpm. The cells<br />
were harvested from the growth medium by membrane filtration<br />
(pore size 0.85 µm). Bacteria suspension was prepared<br />
with concentration of bacteria 1.2 × 10 9 ml –1 in accordance to<br />
MacFarland standards.<br />
P r e p a r a t i o n o f C o p p e r M o d e l<br />
S o l u t i o n s<br />
The model solution of Cu (II) was prepared by dissolving<br />
of CuSO 4 . 5H2 O in deionized water in various concentrations<br />
ranging from 0.01; 0.02; 0.04; 0.06; 0.1; 0.5; 1; 1.5; 2; <strong>2.</strong>5;<br />
3 to 5 mM. Previous studies showed that at pH 5 is the most<br />
effective copper sorption. The initial pH of the solutions was<br />
adjusted to 5 by adding 0.1M HnO 3 or 0.1M naOH for the<br />
biosorption experiments. Various Cu(II) concentrations and<br />
concentration after sorption process were measured by atomic<br />
absorption spectrofotometer (Varian AA240 Z, AA240<br />
FS, Australia).<br />
C o l u m n S t u d i e s<br />
In this study glass columns were used for experiments.<br />
The filtration column was 130 mm high with an inner diameter<br />
of 40 mm. Column was packed with appropriate amounts<br />
of each sorbent in layers (100 g of quartz sand, 0.5 g of bentonite<br />
and 0.1 g of synthetic magnetite). 50 ml of bacteria suspension<br />
was passed through the column to adjusted the adhesion<br />
of bacteria cells. Two types of filtration columns were<br />
prepared. In both types there was 45 mm depth of ceramic<br />
medium, one reached with bacteria (biotic filter) and another<br />
filter without bacteria medium (abiotic filter). Then 50 ml of<br />
Cu(II) model solution was passed through the column at a<br />
constant flow rate of 1.5 ml min –1 .<br />
Fig. 3. Sorption columns<br />
Results<br />
Bioceramic filters composed of quartz sand + bentonite<br />
+ synthetic magnetite + bacteria were used for the sorption<br />
of copper. These two types of filters were compared in<br />
sorption efficiency. The effect of initial concentration on the<br />
percentage removal of copper by biotic and abiotic filters is<br />
s500<br />
shown in Fig. <strong>2.</strong> Fig. <strong>2.</strong> demonstrates that sorption was more<br />
effective in case of biotic filters. The work was carried out at<br />
the pH (5) of model solution because this pH value is for copper<br />
sorption optimum. The maximum removal of Cu(II) was<br />
attained at a concentration 63.5 mg dm –3 Cu. High removal<br />
efficiency (> 95 %) was obtained over the copper (II) concentration<br />
range 1–100 mg dm –3 . However the removal percentage<br />
decreased with increasing the copper (II) concentration<br />
( > 100 mg dm –3 ). Therefore this method seems to be suitable<br />
for the removal of relatively lower concentration of copper.<br />
Fig. <strong>2.</strong> Effect of initial copper concentration on percent removal<br />
of copper by biotic and abiotic filter<br />
Conclusions<br />
The present study showed that the bioceramic filters<br />
based on quartz sand, bentonite, synthetic magnetite and bacteria<br />
can be used as an effective adsorbent of copper. The<br />
results of experiments showed high removal of copper by<br />
both types of model filters at concentrations ranging from<br />
0.01 to 1.5 mM Cu(II). At higher concentrations removal<br />
of copper decreased. The percentage removal was more effective<br />
in biotic filters with baceria medium; however the<br />
difference compared with abiotic filter was not so marked.<br />
Therefore in further experiments bacteria medium with higher<br />
concentration of bacteria cells is needed. In the further<br />
study various iron oxides (hematite, goethit) and clay minerals<br />
(zeolite, kaolinite) will be used in experiments and their<br />
sorption efficiency will be compare.<br />
This work has been supported by the Slovak Academy of<br />
Sciences (VEGA 2/0049/08).<br />
REFEREnCES<br />
1. Cassela R. J.: Microchem. J. 72, 17 (2002).<br />
<strong>2.</strong> Meena A. K., Mishra G. K., Rai P. K., Rajagopal Ch.,<br />
nagar I.: J. Hazard. Mater. B122, 161 (2005).<br />
3. Kooner Z. S.: Environ. Geol. 21, 242 (1993).<br />
4. Wu. G., Li L. Y.: J. Contam. Hydrol. 33, 313 (1998).
Chem. Listy, 102, s265–s1311 (2008) Environmental Chemistry & Technology<br />
P81 DETERMINATION OF SuRFACTANTS<br />
INCLuDED IN SEwAGE wATER<br />
MILADA VáVROVá a,b , LEnKA LAnGOVá a ,<br />
KRISTýnA KUBíČKOVá b , HELEnA ZLáMALOVá<br />
GARGOŠOVá a , MICHAELA STOUPALOVá b and<br />
VLADIMíR VEČEREK b<br />
a Brno University of Technology, Faculty of Chemistry,<br />
Purkyňova 118, 612 00 Brno,<br />
b University of Veterinary and Pharmaceutical Sciences Brno,<br />
Faculty of Veterinary Hygiene and Ecology,<br />
vavrova@fch.vutbr.cz<br />
Introduction<br />
Surfactants or detergents belong to a group of organic<br />
substances that adsorb at a low concentration in the interface,<br />
thereby decreasing interfacial or surface energy. Detergents<br />
therefore show surface activity which manifests itself by the<br />
formation of foam in aqueous solutions 1 . Such properties<br />
facilitate the wetting of surfaces and the removal of impurities<br />
2 .<br />
Detergents can be divided according to their dissociation<br />
properties into the following groups: anionic detergents, cationic<br />
detergents, ampholytic detergents, and non-ionogenic<br />
detergents 2 . There are many kinds of individual detergents.<br />
During wastewater treatment, detergents account for<br />
a high percentage of chemical oxygen demand. Detergents<br />
are also able to increase the solubility of other toxic organic<br />
components in water and soil. When adsorbed in sludge, they<br />
may impair sludge dewatering. Generally, the concentration<br />
of detergents at the outflow from a wastewater treatment<br />
plant depends on the efficiency and technological parameters<br />
of the facility.<br />
Wastewater usually contains different kinds of detergents.<br />
For biological treatment, the level of detergents in<br />
wastewater should not exceed 1,000 mg dm –3 (ref. 4 ). In countries<br />
where the consumption of washing powders and cleaning<br />
agents is high, the concentration of anion-active detergents<br />
in municipal wastewater varies in a range of 10–20 mg dm –3 .<br />
Increased concentrations of detergents can be detected in<br />
wastewater from textile industry, the production of washing<br />
and cleaning agents and cosmetic production plants, and<br />
may exceed 100 mg dm –3 . High levels of detergents are also<br />
present in wastewater originating from laundries and car<br />
washes 5 . The limit concentration of anion-active detergents<br />
in drinking water is 0.2 mg dm –3 . This parameter is used to<br />
indicate the level of pollution in underground water or treated<br />
surface water with sewage 2 .<br />
Experimental<br />
The samples of wastewater to be analysed were collected<br />
at both the inflow and outflow of the wastewater treatment<br />
plant of the University of Veterinary and Pharmaceutical<br />
Sciences (VFU Brno). The samples of wastewater taken at<br />
the outflow were collected before chlorination to prevent the<br />
distortion of the results. The sample of water was measured<br />
s501<br />
immediately after collection; the transfer of the sample took<br />
approximately 10 minutes.<br />
Detergents were determined using Merck spectrophotometric<br />
cuvette tests. The method for the determination of<br />
anion-active detergents can be used for concentrations ranging<br />
from 0.05 to <strong>2.</strong>0 mg dm –3 . This method is similar to<br />
EPA 425.1, US Standard Methods 5540 and En 903. Cationactive<br />
detergents are determined using a spectrophotometric<br />
method in a concentration range of 0.05–1.5 mg dm –3 . The<br />
determination of non-ionogenic detergents was carried out in<br />
a range of 0.1–7.5 mg dm –3 .<br />
Results<br />
The levels of anion-active, cation-active and non-ionogenic<br />
detergents were measured at both the inflow and outflow<br />
of the wastewater treatment plant during one week. It<br />
follows from the overview of the results provided in Table I<br />
that the samples of wastewater contain mainly anion detergents<br />
whose level is three orders higher than that of other<br />
detergents. The results in the table also demonstrate that the<br />
level of detergents in water – particularly anion-active detergents<br />
– decreased significantly as a result of wastewater treatment;<br />
the highest level detected was 0.97 mg dm –3 and was<br />
determined on Friday while the lowest level (0.29 mg dm –3 )<br />
was found on Tuesday. The highest concentration of cationic<br />
detergents (0.24 mg dm –3 ) was detected on Monday and<br />
decreased markedly on other days (0.025 mg dm –3 ). The presence<br />
of highly toxic cationic detergents is alarming.<br />
Table I<br />
Comparison of the levels of anion-active detergents in the<br />
inflow and outflow [mg dm –3 ]<br />
Inflow Outflow<br />
1 20.00 0.40<br />
2 1<strong>2.</strong>90 0.29<br />
3 18.30 0.49<br />
4 13.90 0.49<br />
5 14.00 0.97<br />
Table II<br />
Comparison of the levels of cation-active detergents in the<br />
inflow and outflow [mg dm –3 ]<br />
Inflow Outflow<br />
1 0.400 0.240<br />
2 0.020 0.025<br />
3 0.690 0.025<br />
4 0.025 0.025<br />
5 0.025 0.025<br />
The levels of non-ionogenic detergents in wastewater<br />
collected at the outflow were the same in all cases<br />
– 0.05 mg dm –3 . The differences between individual findings<br />
(the highest and the lowest levels) are difficult to explain; it is
Chem. Listy, 102, s265–s1311 (2008) Environmental Chemistry & Technology<br />
possible that other biologically active compounds such as<br />
pharmaceuticals may also be present in wastewater affecting<br />
the biological stage of wastewater treatment in the respective<br />
wastewater treatment plant.<br />
Table III<br />
Comparison of the levels of non-ionogenic detergents in the<br />
inflow and outflow [mg dm –3 ]<br />
Inflow Outflow<br />
1 0.69 0.05<br />
2 0.89 0.05<br />
3 <strong>2.</strong>40 0.05<br />
4 1.40 0.05<br />
5 <strong>2.</strong>61 0.05<br />
Conclusions<br />
Detergents are closely related to the environment. From<br />
an environmental point of view, the impact of detergents on<br />
water resources management, their biodegradability, toxicity<br />
and eutrophication caused by detergents is very significant.<br />
Since a large number of synthetic detergents exhibits insufficient<br />
biodegradability, water courses are becoming polluted<br />
with these substances. Even low concentrations of surfactants<br />
were shown to endanger the organisms in the environment.<br />
s502<br />
In order to minimize their concentrations in the environment,<br />
generally valid rules should be implemented to help protect<br />
our environment.<br />
Financial support from Ministry of Education, Youth<br />
and Sports under MSM 6215712402 and grant COST, action<br />
636, project No. OC – 183.<br />
REFEREnCES<br />
1. Kizlink, J.: Technologie chemických látek II. Zpracování<br />
ropy, paliva a petrochemie, chemické speciality, pesticidy,<br />
dezinfekční látky, tenzidy, plasty a kaučuk, aditiva<br />
a pomocné chemikálie, výbušniny, biotechnologie, organizace<br />
pro chemii. VUT Brno, Brno, 2001.<br />
<strong>2.</strong> Pitter, P.: Hydrochemie. VŠCHT, Praha, 1999.<br />
3. Venhuis S. H., Mehrvar M.: Int. J. Photoenergy 6, 115<br />
(2004).<br />
4. Dhouib, Hamad, Hassaı¨ri, Sayadi. Process Biochem.<br />
38, 1245 (2003).<br />
5. nařízení vlády č. 61/2003, o ukazatelích a hodnotách<br />
přípustného znečištění povrchových vod a odpadních<br />
vod, náležitostech povolení k vypouštění odpadních vod<br />
do vod povrchových a do kanalizací a o citlivých oblastech.<br />
Sbírka zákonů, no. 24, p. 898, 2003.
Chem. Listy, 102, s265–s1311 (2008) Environmental Chemistry & Technology<br />
P82 ExAMINATION OF ThE MuTuAL<br />
INTERACTION OF hEAVy METALS IN<br />
COuRSE OF ADSORPTION FROM MODEL<br />
SOLuTIONS<br />
Ján VEREŠ a , TOMአBAKALáR b , MILAn BÚGEL b<br />
and MARTIn SISOL b<br />
a Institute of Geotechnics, Slovak Academy of Science, Watsonova<br />
45, 043 53 Kosice, Slovakia,<br />
b Technical University of Kosice, Faculty of Mining, Ecology,<br />
Process Control and Geotechnology, Letna 9, 042 00 Kosice,<br />
Slovakia,<br />
veres@saske.sk<br />
Introduction<br />
Heavy metals contamination occures in aqeous waste<br />
streams of many industries, such as metal plating facilities,<br />
mining operations, tanneries etc. Heavy metals are not biodegradable<br />
and tend to accumulate in living organisms, causing<br />
various diseases and disorders and environmental problems.<br />
Treatment processes for metals contaminated waste streams<br />
include chemical precipitation, ion exchange, membrane<br />
separations (ultrafiltration, reverse osmosis, electrodialysis)<br />
and adsorption. natural materials that are available in large<br />
quantities, or certain waste products from industrial or agricultural<br />
operations, may have potential as inexpensive sorbents.<br />
Due to their low cost, after these materials have been<br />
expended, they can be disposed of without expensive regeneration.<br />
Cost is an important parameter for comparing the<br />
sorbent materials. Adsorption is considered to be the simplest<br />
and most cost-effective technique. The removal of heavy<br />
metal ions from industrial wastewaters using different adsorbents<br />
is currently of great interest 1 .<br />
Zeolites are naturally occuring hydrated aluminosilicate<br />
minerals. They belong to the class of minerals known<br />
as “tectosilicates”. The structures of zeolies consist of threedimensional<br />
frameworks os SiO 4 and AlO 4 tetrahedron. This<br />
structure causes zeolite to have negatively charged surface.<br />
The negative charge is balanced by the exchangable cation<br />
(calcium, sodium or potassium). The fact that zeolite exchangeable<br />
ions are relatively harmless makes them particularly<br />
suitable for removing undesirable heavy metal ions from<br />
industrial effluent waters. 2–4<br />
The zeolite samples from different regions show different<br />
behaviour in ion-exchange processes 5 . The ion exchange<br />
process in zeolites is influenced by several factors such as<br />
concentration and nature of cations and anions, pH value and<br />
crystal structure of the zeolite. In this study, the adsorption<br />
properties of the natural zeolite and synthetic zeolite Slovakite<br />
® with respect to some heavy metal cations in solution<br />
were investigated 6 .<br />
Experimental<br />
M a t e r i a l s a n d C h e m i c a l s<br />
A natural zeolite was obtained from Slovakia (nizny<br />
Hrabovec). The main phase is clinoptilolite and the chemi-<br />
s503<br />
cal compositions are SiO 2 (73.42 %), Al 2 O 3 (1<strong>2.</strong>43 %), CaO<br />
(<strong>2.</strong>94 %), K 2 O (<strong>2.</strong>61 %) and Fe 2 O 3 (1.05 %). The synthetic<br />
zeolite Slovakite ® is patented product and the chemical composition<br />
is unrevealed by the producent.<br />
Inorganic chemicals were supplied as analytical reagents<br />
and deionized water was used. The studied metal ions were<br />
Pb 2+ , ni 2+ , Cu 2+ and Zn 2+ . Solution of lead and nickel was prepared<br />
by using their nitrate salts, Pb(nO 3 ) 2 , ni(nO 3 ) 2 .6H 2 O.<br />
The solution of copper and zinc was prepared from their sulphate<br />
salts, CuSO 4 . 5H2 O, ZnSO 4 . 7H2 O.<br />
A d s o r p t i o n T e s t s<br />
The ion exchange of heavy metals on natural zeolite and<br />
on synthetic zeolite Slovakite ® were carried out using the<br />
batch metod. Batch adsorption experiments were conducted<br />
using 2 g of adsorbent with 200 ml of solutions in flasks containing<br />
heavy metal ions of desired concentrations at constant<br />
temperature (25 °C). The initial concentration of heavy<br />
metals in stock solutions was in the range at 5–1,000 mg dm –3 .<br />
Sorption experiments were carried out at pH 5.5. The flasks<br />
were then agitated in an orbital shaker at a speed of 200 rpm<br />
for a period of 2 h. The quantity of elements in solution has<br />
been determined both before the introduction of sorbent and<br />
after the equilibrium time of 24 hours by AAS.<br />
The amount of adsorbed metal was calculated using the<br />
equation:<br />
q<br />
eq<br />
c 0 –ceq<br />
= (1)<br />
c<br />
s<br />
where c 0 and c eq [mg dm –3 ] are the concentrations of the metal<br />
ion in initial and final solutions and c s [g dm –3 ] is the sorbent<br />
concentration.<br />
Results and Discussion<br />
A d s o r p t i o n o f M e t a l s o n n a t u r a l<br />
Z e o l i t e<br />
The adsorption of Pb 2+ , ni 2+ , Cu 2+ , and Zn 2+ onto<br />
natural zeolite as a function of their concentrations was<br />
studied at 25 °C by varying the metal concentration from<br />
5 to 1,000 mg dm –3 while keeping all other parameters constant.<br />
The experimental data were modeled with Langmuir,<br />
Freundlich and Redlich-Peterson isotherms. The adsorption<br />
isotherms which are the most suitable to fitting the adsorption<br />
processes on natural zeolite in single system are shown<br />
in Figs. 1. and <strong>2.</strong> The isotherm analyses showed different<br />
adsorption behaviour for Pb 2+ , ni 2+ , Cu 2+ and Zn 2+ . Metal<br />
adsorption increased in the following order: Pb 2+ > ni 2+ ><br />
Cu 2+ > Zn 2+ (Figs. 1. and <strong>2.</strong>). Fig. 1. illustrates the dynamic<br />
adsorption process of Cu 2+ and Zn 2+ on natural zeolite. As<br />
shown Fig. 1., the maximum sorption capacity of natural<br />
zeolite was already exhausted (the equilibrium capacity was<br />
achieved) when the metal concentration in solution was in<br />
low range. Fig. <strong>2.</strong> presents that the sorption capacity of sorbent<br />
was not expended even by the highest initial concentration<br />
of Pb 2+ and ni 2+ in solution.
Chem. Listy, 102, s265–s1311 (2008) Environmental Chemistry & Technology<br />
Fig. 1. Adsorption isotherms of Cu 2+ and Zn 2+ on natural zeolite<br />
Fig. <strong>2.</strong> Adsorption isotherms of Pb 2+ and Ni 2+ on natural zeolite<br />
The Langmuir and Freundlich models effectively<br />
described the sorption data with all R 2 values > 0.95.<br />
A d s o r p t i o n o f M e t a l s o n S y n t h e t i c<br />
Z e o l i t e S l o v a k i t e ®<br />
The adsorption of Pb 2+ , ni 2+ , Cu 2+ , and Zn 2+ onto synthetic<br />
zeolite Slovakite ® as a function of their concentrations<br />
was studied in the same conditions as on natural zeolite.<br />
Figs. 3. and 4. illustrate the adsorption isotherms of selected<br />
heavy metals on Slovakite® in single component system.<br />
Comparing the two isotherms on Fig. 3., Cu 2+ adsorption is<br />
usually higher than Zn 2+ . For Zn 2+ , equilibrium adsorption<br />
approaches the value of 42 mg g –1 while for Cu 2+ equilibrium<br />
adsorption still shows higher value than 130 mg g –1 . Fig. 4.<br />
shows a comparison of Pb 2+ and ni 2+ adsorption. For both<br />
metals, equilibrium adsorption still shows an increasing trend<br />
at higher equilibrium concentrations. The cations sorbed from<br />
the solutions followed the same order as on natural zeolite<br />
but the sorption capacity of Slovakite ® was much higher.<br />
The Langmuir and Freundlich models effectively<br />
described the sorption data with all R 2 values > 0.98.<br />
Conclusions<br />
These results show that natural zeolite from nizny Hrabovec<br />
and Slovakite ® can be used effectively for the removal<br />
s504<br />
Fig. 3. Adsorption isotherms of Cu 2+ and Zn 2+ on synthetic<br />
zeolite Slovakite ®<br />
Fig. 4. Adsorption isotherms of Pb 2+ and Ni 2+ on synthetic zeolite<br />
Slovakite ®<br />
of heavy metal cations from solutions. Best sorption capacity<br />
was obtained on synthetic zeolite Slovakite ® , decrease in this<br />
order Pb 2+ > ni 2+ > Cu 2+ > Zn 2+ .The selectivity sequence of<br />
cations is the same on both sorbents, but the sorption capacity<br />
of synthetic zeolite is much higher. The main disadvantage of<br />
synthetic zeolite Slovakite ® its higher cost.<br />
This work has been supported by Scientific Grant Agency<br />
VEGA, project no. 1/4184/07.<br />
REFEREnCES<br />
1. Bailey S. E., et al.: Wat. Res. 33(11), 2469 (1999).<br />
<strong>2.</strong> Barer R. M.: Zeolites and Clay Minerals as Sorbent and<br />
Molecular Sieves, Academic Press, new York, 1987.<br />
3. Breck D. W.: J. Chem. Edu. 41, 678 (1964).<br />
4. Hafez M. B., nazmy A. F., Salem F., Eldesoki M.: J.<br />
Radioanal. Chem. 47, 115 (1978).<br />
5. Matik M., Václavíková M., Gallios G., Hredzák S., Ivanicova<br />
L.: Chem.listy 99, 49 (2005).<br />
6. Vereš J.: Diploma thesis. Technical University in Košice,<br />
Slovakia, Košice 2007.
Chem. Listy, 102, s265–s1311 (2008) Environmental Chemistry & Technology<br />
P83 FuNGICIDAL EFFECT OF PRINTED<br />
TITANIuM DIOxIDE LAyERS<br />
MáRIA VESELá, MICHAL VESELý, PETR DZIK,<br />
JAnA CHOMOUCKá and LEnKA ŠUPInOVá<br />
Brno University of Technology, Faculty of Chemistry, Purkyňova<br />
118, 612 00 Brno, Czech republic,<br />
vesela@fch.vutbr.cz<br />
Introduction<br />
Microorganisms are crucial and inevitable part of life on<br />
Earth. They are found basially everywhere – in air, soil, in<br />
animal and human bodies, even in places with extreme conditions.<br />
Microbial contamination is a serious issue which has<br />
to be dealt with in numerous cases of everyday life. Various<br />
sterilization and dissinfecting methods have therefore been<br />
developed so far.<br />
Photocatalytic processes on thin layers of titanium dioxide<br />
represent a new approach to the everlasting struggle<br />
against microbial contamination. Reactive oxygen species<br />
generated on the surface of irradiated TiO 2 inactivate most<br />
type of microbes 1 . Apparently, titanium dioxide coated surfaces<br />
self-reducing the population of microbes to minimal level<br />
and preventing their growth would be of a great importance.<br />
Most photodegradation reactions on organic substrates<br />
are based on the oxidative power of photoinduced electronic<br />
holes or are mediated by HO • radicals. Such reaction usually<br />
lead to a complete mineralization of organic substrate to carbon<br />
dioxide and water. However, it is necessary to provide a<br />
reducible reactant (i.e. electron acceptors) which would react<br />
with photogenerated electrones. In most cases of photocatalytic<br />
degradation reactions, oxygen is present and it acts<br />
as primary electron acceptor. Oxygen is thus transformed to<br />
superoxide radical (O 2 •– ) and in this way a hydroxyl radical<br />
can be produced:<br />
TiO (h ) + H O → TiO + HO + H<br />
+ • +<br />
2 vb 2 ads 2 ads<br />
TiO (e ) + O + H → TiO + HO ↔ O + H<br />
– + • • – +<br />
2 cb 2ads 2 2 2<br />
(1)<br />
Experimental<br />
M a t e r i a l a n d M e t h o d s<br />
Sol and substrate preparation. Sol-gel technique<br />
was applied to titanium dioxide thin films preparation using<br />
titanium(IV) propoxide as titanium precursors. A mixture<br />
of absolute ethanol and acetylacetone (ACAC) was added<br />
to titanium(IV) propoxide (TTP) under continuous stirring.<br />
Then a small amount of water in ethanol was dropped at<br />
last to the previously mixed solution. Soda lime glass plates<br />
with sizes of 50 × 50 × 1.5 mm were chosen as a substrate for<br />
immobilization of TiO 2 thin films. Soda lime glasses were<br />
treated in boiling 9M sulphuric acid. Before the preparation<br />
of the thin films, each glass was pre-treated in order to eli-<br />
(2)<br />
(3)<br />
s505<br />
minate the dust, grease and other residues using liquid surfactants<br />
and dried under air flow.<br />
Sol application was performed in a novel innovative<br />
way utilizing a modified office inkjet printer. Ink cartridges<br />
were removed from the printer and the ink tubing and printhead<br />
were flushed and purged with anhydrous propanol.<br />
“Virgin empty” spongeless carts were supplied by MIS Associates,<br />
USA. Sol was filtered through 0.2 μm mesh size<br />
syringe filter and loaded into one “virgin empty” cart. This<br />
cart was installed into the printer in the black position and after<br />
a series of head cleaning cycles a perfect nozzle check pattern<br />
was obtained. Cleaned glass plates were then mounted<br />
into a modified CD holder, fed into the printer and printed<br />
with “black only” driver setting. The colour of the printed<br />
pattern was varied in different shades of grey (100 %, 95 %,<br />
90 %, 80 %, 70 %, 60 %) and thus glasses with varying sol<br />
loading were printed. The resolution, print speed and media<br />
settings were also varied and their influence on the resulting<br />
TiO 2 layer properties was evaluated. Two way of printer setting<br />
were chosen for thin layer of TiO 2 preparation – slow (S)<br />
and rapid (R). The sample marked as 100 R corresponds to<br />
100 % of sol loadings printed by rapid way.<br />
Layer treatment. After this procedure, the coated glass<br />
plates were dried in the oven at 110 °C for 30 min. Finally,<br />
the deposited layers were thermally treated in a calcination<br />
furnace at 450 °C for 4 hours.<br />
P h o t o c a t a l y t i c I n a c t i v a t i o n o f<br />
Y e a s t s<br />
A 24-hour culture of yeast Candida vini CCY 29-39-3<br />
(provided by Slovak Yeast Collection, Bratislava) was prepared<br />
at 25 °C. After the cultivation, 10 ml of culture medium<br />
was sampled into a plastic test tube, rinsed twice and centrifuged<br />
at 4,000 rpm for 6 minutes. The supernatant was discarted<br />
and the yeast sediment was diluted with 1 ml of distilled<br />
water an throroughly mixed.<br />
A titanum dioxide coated glass plate was irradiated by<br />
UV lamp for 30 minutes in order to obtain a superhydrophilic<br />
surface. 25 μl of diluted yeast suspension was pipetted onto<br />
the glass plate and evenly spread across its surface. Then the<br />
glass plate with yeast suspension was placed in a sreaction<br />
chamber. The chamber consisted of a Petri dish with reflective<br />
aluminum foil bottom and quartz glass cover. A few<br />
drops of water were aplse placed into the reaction chamber in<br />
order to maintain the humidity.<br />
The reaction chamber was irradiated by 4 fluorescent<br />
lamps Sylvania Lynx-S 11 W with emission maximum at<br />
350 nm. The irradiation intensity was 1 mW cm –2 within<br />
290–390 nm spectral region. Irradiated samples were dyed<br />
and observed by fluorescent microscopy.<br />
S u r v i v a l R a t i o C a l c u l a t i o n<br />
The exposed yeast suspension was mixed with 25 μl acridine<br />
orange solution (1 × 10 –4 mol dm –3 ) in phosphate buffer<br />
of pH = 6. After thorough mixing, the sample was observed<br />
with epi-fluorescent microscope nikon Eclipse E200.
Chem. Listy, 102, s265–s1311 (2008) Environmental Chemistry & Technology<br />
20 digital images of randomly chosen different places ocross<br />
the glass plate were recorded using CCD camera PixeLInK<br />
PL-A662 mounted on the nikon microscope. At every recorded<br />
image, the number of living cells N L (green flurescence)<br />
and dead cells N D (orange fluorescence) was counted. Then,<br />
the survival ratio SR was calculated:<br />
NL<br />
SR =<br />
N +<br />
L D<br />
Results<br />
After irradiating Candida vini suspension deposited on<br />
the 100 R glass plate a significant inactivation was observed<br />
– the SR dropped to 0.032 ± 0.023 within 70 minutes. On the<br />
other hand, the non-irradiated sample showed no inactivation<br />
within 70 minutes. These observations are in a good compliance<br />
with the results of Seven et al. 4 , who also observed<br />
no inactivation of microbes on titanium dioxide in darkness.<br />
Only very small inactivation was observed on an irradiated<br />
bare glass without the catalyst layer. (Figs. 1., <strong>2.</strong>).<br />
These results are in agreemnet with the observations<br />
made by Kühna et al. 3 , who irradiated bacteria Pseudomonas<br />
aeruginosa on a glass plate covered with titanium dioxide.<br />
They found out that bacreial cell inactivation takes place.<br />
This phenomenon was explained to be caused by the oxidative<br />
stress of oxygen radicals inside cells during the exposure<br />
by UV-A radiation. Once the stress rises over a certain<br />
threshold, the cell dies.<br />
Fig. 1. SR comparison for Candida vini at different conditions<br />
on R substrates<br />
A constant decrease of SR in a certain time from the<br />
reaction start was observed by Benabbou et al. 2 in the case of<br />
Escherichia coli. Cell mebrane damage resulting from photocatalytical<br />
processes leads to an increase in membrane permaebility<br />
and eventually to free outflow of cell fluids. Therefore<br />
both bacterial cells as well as molecules of intracellural<br />
organels can become the substrate of reactive oxygen species<br />
(ROS) attack. ROS react simultaneously with the cytoplasmatic<br />
membrane of living cells and with the remains of dead<br />
(4)<br />
s506<br />
Fig. <strong>2.</strong> SR comparison for Candida vini at different conditions<br />
on S substrate<br />
cells (polysycharides, lipids) at the same time. Our results<br />
also confirm this hypothesis.<br />
When we compare the inactivation rates for Candida vini<br />
on R and S substrates (Fig. <strong>2.</strong> and Fig. 1.) it becomes clear<br />
that the inactivation rate of Candida vini does not depent on<br />
the structure and topology of the catalyst layer, as long as the<br />
glass surface is well couted by titanium dioxide.<br />
Conclusions<br />
When comparing the photocatylic inactivation rate of<br />
Candida vini on two types of immobilised catalyst (rapidly<br />
printed and slowly printed titanium dioxide layers) it is<br />
possible to conclude that significant inactivation was observed<br />
on glass plates with very high sol loading, i.e. with very<br />
well covered surface (samples 100 R, 95 R, 95 S). We also<br />
observe a certain decrease in the inactivation rate after reachicg<br />
the SR value of appr. 50 %. This might be caused by the<br />
simultaneous consuption of ROS both by the still living cells<br />
membrane as well as the organic remains of already killed<br />
cells. Almost constant SR value between 25 and 35 minutes<br />
suggest a competitive reaction pathway.<br />
Authors thank to Ministry of Education, Youth and Sports<br />
of Czech Republic for support by project MSM0021630501.<br />
REFEREnCES<br />
1. Huang n., Xiao Z., Huang D., Yuan Ch.: Supramol. Sci.<br />
5, 559 (1998).<br />
<strong>2.</strong> Benabbou A. K., Derriche Z., Felix C., Lejeune P., Guillard<br />
C.: Appl. Catal. B Environ. 76, 257 (2007).<br />
3. Kühn K. P., Chaberny I. F., Massholder K., Stickler M.,<br />
Benz V. W., Sonntag H-G., Erdinger L.: Chemosphere<br />
53, 71 (2003).<br />
4. Seven O., Dindar B., Aydemir S., Metin D., Ozinel M.<br />
A., Icli S.: J. Photochem. Photobiol. Chem. 165, 103<br />
(2004).
Chem. Listy, 102, s265–s1311 (2008) Environmental Chemistry & Technology<br />
P84 PhOTOCATALyTIC DISINFECTION OF<br />
wATER uSING Ag/TiO 2<br />
MáRIA VESELá, MICHAL VESELý, JAnA<br />
CHOMOUCKá and MICHAELA LIPEnSKá<br />
Brno University of Technology, Faculty of Chemistry, Purkyňova<br />
118, 612 00 Brno,<br />
vesela@fch.vutbr.cz<br />
Introduction<br />
Photocatalytic oxidation of organic compounds represents<br />
a major potential to be applied in environmental technologies.<br />
The photocatalytic process is capable to decompose<br />
most organic matter to water and carbon dioxide. Conventional<br />
cleaning technologies such as ozonization or chlorination<br />
have their limits. For example, ozone decomposes readily<br />
and chlorine, which is used widely for the dissinfection of<br />
drinking water, can react with organic compounds to form<br />
toxic byproducts 1. Methods utilizing ozone a UV radiation<br />
are expensive and often technically challenging.<br />
Reactive oxygen radicals are are produced in the presence<br />
of adsorbed oxygen and electron donor. These radical<br />
can cause rapid microbe cell death and at the same time<br />
decompose organic compounds.<br />
The fungicidal effect of TiO 2 can be mediated by the<br />
presence of a noble metal, such as silver, at the catalyst surface<br />
1 . Therefore, the deposition of silver nanoislets on the catalyst<br />
surface can lead to the production of a highly effective<br />
dissinfecting agent.<br />
Experimental<br />
M u l t i - T u b e F l o w R e a c t o r<br />
Suspension of yeast was colected in 3-neck flask and<br />
was circulated with peristaltic pump through tubes irradiated<br />
by 4 Sylvania LYnX lamps with total power output 44<br />
W (Fig. 1.). A flow rate was 50 ml min –1 . A transmitance of<br />
glass wall of tubes was 93 % at maximum light output of Sylvania<br />
LYnX lamp at 350 nm. Irradiance was maintaned at<br />
1.0 mW cm –2 by lamp distance adjustment.<br />
The inner walls of reactor were covered by titanium dioxide<br />
layer using sol-gel process based on tetraisopropoxide<br />
solution stabilized with acetoecetone. The inner glass walls<br />
were coated by dip-coating method. For experiment with Ag/<br />
TiO 2 the metallic silver was deposited on TiO 2 layer by photocatalytic<br />
process from silver nitrate solution wih ethanol.<br />
Tubes with 1.2 % mol. and <strong>2.</strong>4 % mol. of silver were<br />
prepared.<br />
Y e a s t S u s p e n s i o n a n d C F U<br />
E v a l u a t i o n<br />
The yeast Hansenula anomala CCY 38-1-30, supplied<br />
by Slovak Collection of Yeasts, Bratislava, was cultivated<br />
in malt extract at 28 °C. After 24 hours a 10 ml was taken<br />
into test-tube for centrifugation. The pelets were washed<br />
with sterile distilled water and centrifugated. This process<br />
was repeated twice. The pelets were resuspended in 10 ml of<br />
s507<br />
Fig. 1. Multi-tube flow reactor: 1 – Sylvania LYNX lamps<br />
(4 × 11 W), 2 – tubes, 3 – multi-neck flask with yeast suspension<br />
(250 ml), 4 – peristaltic pump<br />
water and number of cells was calculated using Bürker chamber.<br />
This suspension was used for preparation of suspnesions<br />
with various cell concentration.<br />
From the multi-tube flow reactor were taken samples in<br />
regular intervals. number of colony forming units (CFU) was<br />
evaluated by indirect way: 100 μl of sample was spread on<br />
malt extract agar in 3 Petri dishes. After 48 hours of cultivation<br />
a number of colonies were enumerated and an average<br />
value was expresed as CFU ml –1 .<br />
Results<br />
We conducted experiments with photocatalytic inactivation<br />
of yeast cells in a multi-tube flow reactor with varying<br />
concentrations of cells (500 to 5,000 CFU ml –1 ). We showed<br />
that during the experiment, the number of viable yeast cells<br />
decreases. The cell wall of Hansenula anomala is quite thick<br />
with a rigid structure, therefore we can expect it to be very<br />
resistant against ROS attact. nevertheless, a total cell inactivation<br />
was achieved within 160 minutes.<br />
We also observed the photocatalytic inactivation of<br />
Hansenula anomala (Fig. <strong>2.</strong>) on TiO 2 photocatalyst layer<br />
overcoated with a very small amount of metallic silver. We<br />
also observed a decrease in the size of colonies grown from<br />
survivng cells. This phenomenon was noted also by Erkan et<br />
al. 6 , who described diminishing colonies of Saccharomyces<br />
cerevisiae after irradiation in TiO 2 . In this case, however,<br />
the titanium dioxide was overcoated with paladium and the<br />
diminishment is believed to be caused by the weakening of<br />
surviving cells.<br />
It is well known that pure silver, copper, zinc and their<br />
ions pose antimicrobial properties. If these metals are deposited<br />
onto TiO 2 thin films, their antimicrobial effect will act<br />
together with the antimicrobial effect of bare TiO 2 . We can<br />
expect the metallic silver to prevent elcetron-hole recombination<br />
on the surface of the photocatalyst and thus improve the<br />
efficiency of the photocatalytic process. In this case the pho-
Chem. Listy, 102, s265–s1311 (2008) Environmental Chemistry & Technology<br />
tocatalyst would ensure the surface sterility upon the irradiation<br />
by UV and metal ions will do their job in the darkness 7 .<br />
According to Semikin a Skulachev, the interaciton of Ag + a<br />
SH groups of respiratory enzymes can lead to cell membrane<br />
permeability changes, resulting into major disorders in the<br />
whole cell. Apart from the membrane permaebility change, a<br />
cell-membrane separation is possible as well. Eventually, the<br />
possibility of Ag + addition to the bacterial genetic material<br />
was reported, too 4 .<br />
Fig. <strong>2.</strong> Photocatalytic inactivation of Hansenula anomala cells<br />
on TiO 2 and Ag/TiO 2 layers in multi-tube flow reactor<br />
We showed that yeast cells of Hansenula anomala are<br />
not capapble of regeneration, which is otherwise usual, especially<br />
in the case of bacteria. The cells are probably damaged<br />
in such extend that they loose their reproduction ability. Identical<br />
effect was observed on combined surface of Ag/TiO 2<br />
(Fig. 3.).<br />
Conclusions<br />
The collected result indicate that it is possible to photocatalytically<br />
inactivate cells even with a very rigid cell wall<br />
(Hansenula anomala). In this way, a complete photocatalytic<br />
dissinfection of water can be performed. A very small amount<br />
of metallinc silver deposited on the surface of titanium dioxide<br />
photocatalyst enhanced the inactivation rate.<br />
s508<br />
Fig. 3. Photocatalytic inactivation of Hansenula anomala cells<br />
on Ag/TiO 2 layer in multi-tube flow reactor. The lamp was powered<br />
off after 120 minutes<br />
We also showed that in the case of Hansenula anomala,<br />
the surviving cells are not able to reproduce after the irradiation<br />
is terminated. The cells lose their reproduction ability.<br />
Similarly, the cells lose their reproduction ability after their<br />
irradiation on TiO 2 surface doped with silver islets (1.2 a<br />
<strong>2.</strong>4 % mol. silver).<br />
Authors thank to Ministry of Education, Youth and Sports<br />
of Czech Republic for support by project MSM0021630501.<br />
REFEREnCES<br />
1. Kubacka A., Ferrer M., Martínez-Arias A., Fernández-<br />
Garciá M.: Appl. Catal. B Environ. 2007, in press<br />
<strong>2.</strong> Yip H. Y., Yu J. C. M., Chan S. C., Zhang L. Z., Wong P.<br />
K.: J. Water Environ. Tech. 3, 47 (2005).<br />
3. Keleher J., Bashant J., Heldt n., Johnson L., LI Y.: World<br />
J. Microbiol. Biotechnol. 18, 133 (2002).<br />
4. Semeykina A. L., Skulachev V. P.: FEBS Lett. 269, 69<br />
(1990).<br />
5. Pratap Reddy M., Venugopal A., Subrahmanyam M.:<br />
Water res. 41, 379 (2007).<br />
6. Erkan A., Bakir U., Karakas G.: J. Photochem. Photobiol.<br />
Chem. 184, 313 (2006).
Chem. Listy, 102, s265–s1311 (2008) Environmental Chemistry & Technology<br />
P85 LAbORATORy STuDy OF ARSENIC<br />
MObILITy IN STREAM SEDIMENTS AND<br />
IMPOuNDMENT MATERIAL uSING COLuMN<br />
ExPERIMENTS<br />
VEROnIKA VESELSKá and EDGAR HILLER<br />
Comenius University in Bratislava, Faculty of Natural<br />
Sciences, Department of Geochemistry, Mlynská dolina,<br />
842 15 Bratislava, Slovak Republic,<br />
veselska@fns.uniba.sk<br />
Introduction<br />
High arsenic contents in the impoundment situated near<br />
the village of Poša in the upper part of the catchment of the<br />
Kyjov brook in eastern Slovakia, represent an environmental<br />
problem because of As mobilization and transport from<br />
the impoundment material and significant contamination<br />
of surface water of the Kyjov brook (the mean As values<br />
of 11,385 μg As dm –3 , 1,778 μg As dm –3 and 295 μg As dm –3<br />
measured in the Kyjov brook during 2000, 2005 and 2007<br />
respectively) 1 . Decreasing concentrations of As in surface<br />
water are involved in delimited using of impoundment in last<br />
few years.<br />
Arsenic distribution in different stream sediment constituents<br />
and its mobilization determine As concentration in<br />
aquatic environment and affect its bioavailability and toxicity<br />
to the biosphere 2,3 .<br />
The major processes controlling As leaching from sediments<br />
to natural waters include mineral (co)precipitation/<br />
dissolution, adsorption/desorption, chemical and biological<br />
transformations. The conditions present such as pH, redox<br />
potential, solution composition, the sediment properties and<br />
mineralogical composition of the sediment determine the<br />
dominant processes affecting the environmental fate of As in<br />
the stream sediments and ist leaching behaviour 4,5 .<br />
The main objective of this study was to investigate leaching<br />
behaviour of As from the heterogeneous impoundment<br />
material and the three stream sediments and the evaluation of<br />
the total As mobility.<br />
Experimental<br />
The samples used in this work are either the stream<br />
sediments of the Kyjov brook taken at the distance of 100,<br />
1,000 and 2,000 m from the impoundment (denoted as KY-<br />
100, KY-1000 and KY-2000) or the impoundment material<br />
(denoted as KY-0).<br />
Continuous column leaching experiments were conducted<br />
under standard conditions (25 ± 3°C, 101,325 Pa) to<br />
provide information about As release, its binding and desorption<br />
kinetic. The experiments were run in duplicates. Each of<br />
the two glass columns per one sample was filled with 50 g of<br />
a dry sample (a < 1 mm fraction) and columns were during<br />
five days flushed with 1.3 dm 3 of 0.0125M solution, that was<br />
prepared to resemble the composition of surface waters of the<br />
Kyjov brook and contained by 2 × 10 –5 M PO 4 3– , <strong>2.</strong>8 × 10 –3 M<br />
Cl – and 3.2 × 10 –3 M SO 4 2– . The upward flow was regulated at<br />
s509<br />
a rate of 0.2 ml min –1 . During the experiment, 14 samples of<br />
leachates were collected from each of the columns, pH values<br />
were measured and the concentrations of As were determined<br />
by graphite furnace atomic absorption spectrometry (Perkin-<br />
Elmer 4110 ZL).<br />
Results<br />
The results of the column experiments showed that<br />
theAs release from the solid samples was likely controlled<br />
by Fe and Mn oxohydroxides, pH values of the geosorbents<br />
and leachates and also organic carbon content. It was also<br />
observed that the time was an important factor influencing<br />
the As release.<br />
Significant correlations of the amounts of As released<br />
from the solid samples with its total contents (r = 0.975,<br />
P < 0.05) (Fig. 1.) as well as with total organic carbon contents<br />
(r = 0.942; P < 0.05) were found. The total organic carbon<br />
content was measured using a Leco RC-412 multiphase<br />
determinator at 550 °C.<br />
The impoundment material (KY-0) has the highest total<br />
organic carbon content (37 %), which is likely attributed to<br />
the fact that stored sludge consists of fly ashes derived from<br />
coal and chemical waste combustion. Alkaline character of<br />
the KY-0 (pH = 8.55) as well as high leachate pH (pH ~ 9.0)<br />
enhance release of As and its transport to the liquid phase.<br />
The results of various studies showed that the amounts of As<br />
oxyanions released from different solid geosorbents increase<br />
in alkaline conditions, mainly when pH > 8(ref. 6 ) The maximum<br />
As concentration in column leachates from KY-0 was<br />
determinated after 25 hours, when the easily soluble fraction<br />
of As weakly bound on the solid surface was released. The<br />
late hindered As release from KY-0 could be caused by the<br />
presence of mullites and vitreous phases. It is suggested here<br />
that some fraction of As may be only hardly available to be<br />
released because of its strong binding within the heterogenous<br />
components.<br />
Fig. 1. Relationships between the amounts of As released and<br />
total contents of As, Fe as a ammonium-oxalateextractable Alox,<br />
Feox in the log-log form
Chem. Listy, 102, s265–s1311 (2008) Environmental Chemistry & Technology<br />
notably high accumulation of trace elements including<br />
As in the most contaminated sample KY-100 (3,208 mg As kg –1 )<br />
with the lowest relative mobility, is likely due to high contents<br />
of the Fe, Al, Mn oxohydroxides. The relative mobility<br />
of As was inversely related to the oxalate-extractable<br />
Mn content (r = –0.960, P < 0.05) and not significantly to the<br />
oxalate-extractable Fe content such that diffusion in hydrated<br />
micropores of amorphous Fe and Mn oxides might be the rate<br />
limiting mechanism of the As release (Fig. <strong>2.</strong>).<br />
Fig. <strong>2.</strong> Relationship between the relative mobility of As and the<br />
ammonium oxalate-extractable Mn, Fe contents in the log-log<br />
form<br />
The amount of As released from samples KY-1000 and<br />
KY-2000 increased rapidly within short extraction times, reaching<br />
the apparent equilibrium after 174 min. The relative<br />
mobility of As in KY-1000 and KY-2000 was approximately<br />
s510<br />
the same as in impoundment material although the total Fe,<br />
Mn contents in KY-1000, 2000 are 2-times lower as compared<br />
with KY-0. The total contents of elements Cd, Cr, Fe, Hg,<br />
Mn, Pb, Zn, Al, As and Sb were determined after digestion<br />
with acid mixture.<br />
Conclusions<br />
The fractions of As released in column experiments were<br />
generally less than 10 % (5.32–7.83 %) of its total contents,<br />
but they represented high absolute amounts of readily available<br />
and water-soluble As (83 mg kg –1 ). The fraction released<br />
from the source impoundment material (132 mg kg –1 ) represented<br />
high As concentration in its leachates, reaching up to<br />
8,000 μg dm –3 . As concentrations in the leachates from all<br />
the samples exceed maximum permissible level in drinking<br />
water (10 μg dm –3 ; Decision of the Slovak Health Ministry<br />
no. 151/2004).<br />
This work has been supported by the Slovak Grant<br />
Agency under VEGA project No.1/2037/05.<br />
REFEREnCES<br />
1. Jurkovič ľ., Kordík J., Slaninka I.: Slovak Geol. Mag.<br />
12, 31 (2006).<br />
<strong>2.</strong> Tao Y., Zhang S., Jian W., Yuan CH., Shan X.: Chemosphere<br />
65, 1281 (2006).<br />
3. Williams L. E., Barnett M. O., Kramer T. A., Melville<br />
J. G.: J. Environ. Qual. 32, 841 (2003).<br />
4. Gao S., Fujii R., Chalmers A. T., Tanji K. K.: Soil Sci.<br />
Soc. Am. J. 68, 89 (2004).<br />
5. Smith E., naidu R., Alston A.M.: J. Environ. Qual. 31,<br />
557 (2002).<br />
6. Ganne P., Cappuyns V., Vervoort A., Buvé L., Swennen<br />
R.: Sci. Total Environ. 356, 69 (2006).
Chem. Listy, 102, s265–s1311 (2008) Environmental Chemistry & Technology<br />
P86 ANTIbIOTICS IN ThE ENVIRONMENT<br />
H. VíTEČKOVá, L. VYDROVá, D. VELEBOVá, M.<br />
VáVROVá and L. MRAVCOVá<br />
Brno University of Technology, Faculty of Chemistry, Purkyňova<br />
118, Brno 612 00, Czech Republic,<br />
viteckova@fch.vutbr.cz<br />
Introduction<br />
Tetracyclines (TC) present a class of antibacterial<br />
drugs. Due to their broad antibacterial spectrum and economic<br />
advantages, tetracyclines have been commonly used in<br />
veterinary medicine and in human medicine for the purpose<br />
of prevention and treatment of disease. However, their widespread<br />
utilization could lead to TC residues in animal-originated<br />
food and in the environment. The antibiotics in food<br />
and water consumed for long periods can also cause problems<br />
regarding the spread of drug-resistant microorganisms 1 .<br />
It is well known that the principal pathway of antibiotics<br />
into the aquatic environment is via wastewater systems following<br />
consumption and excretion by humans, and via effluents<br />
from landfills and farms 2 . Presently conventional wastewater<br />
treatment plants (WWTPs) were designed without<br />
consideration of antibiotics removal from wastewater. Many<br />
previous studies have shown that, while some antibiotics<br />
may be eliminated in the WWTPs, some other may be hardly<br />
removed in the process, therefore they can reach the aquatic<br />
environment 3,4 . Due to irremovable antibiotics, wastewater<br />
treatment plants become an important point source of emissions<br />
into the environmen 1,2,3 .<br />
Experimental<br />
To monitor the tetracycline residues a reliable method is<br />
needed. SPE for purification and preconcentration of analytes<br />
was used. Spectrophotometric method for antibiotic determination<br />
was used.<br />
S a m p l i n g<br />
Waste water samples have been taken from the waste<br />
water treatment plant (WWTP) in the University of Veterinary<br />
and Pharmaceutical Sciences Brno campus in one-day<br />
intervals into amber glass sampling bottles. In this WWTP,<br />
we decided to deal with the antibiotics in particular because<br />
these drugs samples were taken from the WWTP inlet and<br />
compared with the samples taken from WWTP outlet.<br />
The samples were processed immediately or stored<br />
in a refrigerator till the following day.<br />
R e a g e n t s<br />
During the process, the following chemicals have been<br />
used: oxalic acid, p.a. sulfuric acid p.a., dinatrium phosphate<br />
dodecahydrate p.a., all from Lachema, CZ; acetonitrile for<br />
HPLC, methanol for HPLC, from Riedel-de-Haen, SRn; citric<br />
acid, p.a. Onex, CZ; Chelaton III, p.a. Penta,CZ;<br />
Tetracycline, Chlorotetracycline and Oxytetracycline,<br />
standards for HPLC, were from Sigma Aldrich, CZ.<br />
s511<br />
McIlvain buffer: citric acid (1<strong>2.</strong>9 g dm –3 ), natrium salt of<br />
ethylenediaminetetraacetate (37.2 g dm –3 ), dodecahydrate of<br />
dinatrium phosphate (30.2 g dm –3 ) in deionized water<br />
Elution mixture: 20 mmol dm –3 oxalic acid in methanol.<br />
S a m p l e T r e a t m e n t<br />
Samples were filtered using paper filters to remove particles.<br />
Volume of 200 ml samples were extracted 20 minutes<br />
with McIlvain buffer in an ultrasonic bath.<br />
A Phenomenex Strata C18-E SPE column (55 μm,<br />
500 mg 6 ml –1 ) was conditioned with 4 ml of methanol followed<br />
by 3 ml of McIlvain buffer. After sample loading, the<br />
column was washed with 3 ml deionized water. The column<br />
was dried using the vacuum of the SPE manifold. Then the<br />
tetracyclines were eluted with 10 ml of elution mixture.<br />
S p e c t r o p h o t o m e t r i c A n a l y s i s<br />
The analyses were carried out on UV-VIS spectrophotometer<br />
Spectronic Helios (UK). Deuterium and wolfram lamp<br />
was used for determination.<br />
At first the absorption spectrum was measured in the<br />
range 230–450 nm step by step 2 nm. Tetracyclines have two<br />
absorption maximas as resulting from absorption spectrum<br />
and with accordance to published data: 246 nm and 360 nm 4 .<br />
Spectrophotometer was adjusted to zero value through the use<br />
of elution reagent. Subsequently, real samples were measured<br />
to determine the absorbance value at absorption maximum.<br />
Quartz cuvette with optical path 1 cm was used.<br />
Fig. 1. Absorption spectrum of tetracycline in various concentrations<br />
[mg ml –1 ]<br />
Fig. <strong>2.</strong> Concentration of tetracycline in real samples
Chem. Listy, 102, s265–s1311 (2008) Environmental Chemistry & Technology<br />
Results<br />
All tetracyclines have typical absorption spectrum. They<br />
have two characteristical absorption maximas, 264 nm and<br />
360 nm. Due to their characteristic we could determinate<br />
tetracyclines and their metabolites together by spectrophotometry.<br />
Inlet concentrations of analytes were always higher than<br />
outlet concentrations. This indicates that these pharmaceuticals<br />
are removed partially in the wastewater treatment plant.<br />
The change of tetracycline concentration may be caused by<br />
photodegradation.<br />
Conclusions<br />
As the use of pharmaceuticals is increasing, fast sample<br />
preparation and determination method is required.<br />
Samples were taken from wastewater treatment plant<br />
placed in Veterinary and Pharmaceutical university Brno<br />
campus, from inlet and outlet.<br />
s512<br />
Samples were filtered before extraction.<br />
SPE was optimized for preparation and preconcentration<br />
of wastewater samples.<br />
An efficient method for determination of tetracyclines in<br />
wastewater, using spectrophotometry, was developed.<br />
Spectrophotometry was used because this is commonly<br />
used in laboratories and machine operation is cheap.<br />
This work has been supported by grant COST, action<br />
636, project no. OC-183.<br />
REFEREnCES<br />
1. Pavlović D. M. et al.: Trends Anal. Chem. 26, 1062<br />
(2007).<br />
<strong>2.</strong> Hirsch R. et al.: Sci. Tot. Env. 225, 109 (1999).<br />
3. Hernando M. D. et al.: Talanta 69, 334 (2006).<br />
4. Fritz J. W.: Food. Chem. 105, 1297 (2007).
Chem. Listy, 102, s265–s1311 (2008) Environmental Chemistry & Technology<br />
P87 ThE FLuORIMETRIC DETERMINATION OF<br />
ALuMINIuM, GALLIuM AND INDIuM wITh<br />
8-hyDROxyQuINOLINE-5-SuLPhONIC ACID<br />
IN AQuEOuS AND SubMICELLAR MEDIuM<br />
ŠIMOn VOJTA and LUMíR SOMMER<br />
Institute of Environmental Protection, Faculty of Chemistry,<br />
Brno University of Technology, Purkyňova 118, 612 00 Brno,<br />
Czech Republic,<br />
halapaloosa@email.cz<br />
Introduction<br />
The complexing and analytical properties of 8-Hydroxyquinoline-5-sulphonic<br />
acid (QSA) are similar to 8-Hydroxyquinoline<br />
but the solubility of complexes in aqueous solutions<br />
increases and no fluorescence of the reagent in the large<br />
pH interval has been observed. The QSA was formerly used<br />
as a fluorogenic reagent for a number of metal ions including<br />
Mg 2+ , Zn 2+ , Cd 2+ , Ce 3+ and Al 3+ (ref. 1 ). The fluorimetry<br />
of Gallium and Indium complexes in aqueous solutions was<br />
only briefly mentioned.<br />
The fluorescence of metal complexes with QSA can be<br />
considerably enhanced in the presence of surfactants in submicellar<br />
and micellar medium 2,3 . The fluorescence properties<br />
of the metal species with QSA were tested in the presence<br />
of surfactants and exploited chromatographically in very low<br />
concentrations.<br />
Thus the cationic surfactants were widely used for the<br />
enhancement of fluorescence of metal complexes with QSA 4 .<br />
The attention was also paid to the fluorimetric determination<br />
of Al with QSA also in mixtures with Zn using derivative<br />
synchronous scan in the presence of surfactant 5 . The Partial<br />
Least Square Method (PLS) in combination with pH gradient<br />
FIA was used in binary mixtures of ions in complexes with<br />
QSA whose fluorescence was enhanced by the surfactant 6 .<br />
In this paper the fluorescent Al 3+ , Ga 3+ and In 3+ complexes<br />
with QSA were studied in detail in the absence and<br />
presence of surfactants and optimal conditions were recommended<br />
for the determination of particular metals in the presence<br />
of Zephyramine. normal and first derivative spectra<br />
were evaluated.<br />
Experimental<br />
I n s t r u m e n t s<br />
Spectrofluorimeter Aminco Bowman, Series 2 with<br />
1 cm quartz cells, 4 nm exit slits, photomultiplier under 450–<br />
850 V. Sample cell was tempered to 20 °C.<br />
The calculation of the first derivative was made by using<br />
the instrument software using Golay-Savitzky 11-point convolution.<br />
C h e m i c a l s<br />
Standards used, Analytica s.r.o., Prague:<br />
Aluminium chloride 1.000 ± 0.002 g dm –3 containing 5 % HCl<br />
Gallium chloride 1.000 ± 0.002 g dm –3 containing 10 % HCl<br />
Indium chloride 1.000 ± 0.002 g dm –3 •<br />
containing 10 % HCl<br />
s513<br />
•<br />
•<br />
•<br />
•<br />
•<br />
•<br />
•<br />
•<br />
•<br />
8-Hydroxyquinoline-5-sulphonic acid hydrate (QSA),<br />
Sigma–Aldrich was used without purification<br />
0.1M Benzyldimethyltetradecylammonium chloride<br />
(Zephyramine ® ) – Sigma-Aldrich Co.<br />
0.1M 1-ethoxykarbonylpentadecyltrimethylammonium<br />
bromide (Septonex ® )–Sigma-Aldrich Co.<br />
0.1M Dodecylbenzyldimethylammonium bromide (Ajatin<br />
® ) – Sigma-Aldrich Co.<br />
1% Didodecyldimethylammonium bromide – Sigma-<br />
Aldrich Co.<br />
1% Polyoxyethylene(23) lauryl ether (Brij 35) – Sigma-<br />
Aldrich Co.<br />
1% Hexadecyltrimethylammonium chloride – Fluka.<br />
1% 4-(1,1,3,3-Tetramethylbutyl)phenyl-polyethylene<br />
glycol (Triton X-100) – Calbiochem Co.<br />
0.1 M Sodium dodecylsulphate (SDS) - BDH Chemicals,<br />
England.<br />
E v a l u a t i o n o f D a t a<br />
The limits of detection X D α and XD β calculated according<br />
to Graham 7 follow from the calibration plots and their<br />
confidence intervals were compared with those from multiple<br />
measurements of the background according to IUPAC 8 .<br />
The stoichiometry of complexes was evaluated by using<br />
the modified continuous variations method 9 in the absence<br />
and presence of cationic surfactant Zephyramine. The fluorescence<br />
was measured for several sums of equimolar solutions,<br />
where c o = c M + c L .<br />
Results<br />
The complexes of 8-Hydroxyquinoline-5-sulphonic acid<br />
with Al, Ga, and In produce an outstanding fluorescence for<br />
wavelengths over 430–600 nm with λ max at 495 nm for Al,<br />
λ max at 504 nm for Ga and λ max at 519 nm for In. The corresponding<br />
excitation λ max are 360 nm, 365 nm and 367 nm.<br />
The fluorescence shows considerable pH dependence which<br />
reaches the maximum in solution with c L = 7.4 × 10 –5 M<br />
Fig. 1. Excitation(a) and emission(b) spectra of Aluminium(III)<br />
in the presence of 7.4 × 10 –5 mol dm –3 QSA at 620 V in dependence<br />
on concentration of Al(III) at ph 4<br />
1 – 1.6 μg cm –3 , 2 – 0.8 μg cm –3 , 3 – 0.4 μg cm –3 , 4 – 0.2 μg cm –3 ,<br />
5 – 0.05 μg cm –3 , 6 – 0 μg cm –3
Chem. Listy, 102, s265–s1311 (2008) Environmental Chemistry & Technology<br />
at pH 4 for Al 3+ , c L = 1.5 × 10 –5 M at pH 3 for Ga 3+ and<br />
c L = 3.5 × 10 –5 M at pH 8 for In 3+ (Figs. 1. and <strong>2.</strong>).<br />
no fluorescence was observed for the sole reagent in this<br />
pH interval.<br />
Fig. <strong>2.</strong> Fluorescence intensity dependence on ph for each complex<br />
(0.3 μg cm –3 of each element) at optimal conditions<br />
The first derivations of the fluorescence and excitation<br />
spectra under the same conditions as the normal spectra with<br />
λ max(em) = 460 nm (AlQSA), λ max(em) = 472 nm (GaQSA)<br />
and λ max(em) = 478 nm (InQSA)are given in Fig. 3. Higher<br />
derivations could not be used because of a big noise of the<br />
instrument.<br />
The calibration plots are stricly linear in solution with<br />
c L = 7.4 × 10 –5 M for Al 3+ at pH 4 or c L = 5.8 × 10 –5 M QSA<br />
for Ga 3+ at pH 3 and c L = 1.78 × 10 –5 M and pH 8 for In 3+ .<br />
Although the calibration plots are strictly linear till<br />
2 μg cm –3 , the meaningful metal concentration range was<br />
0.04–1 μg cm –3 . The decrease of QSA concentration in solution<br />
negatively influence the extent of the linear part of the<br />
calibration plot, the increase of QSA concentration causes<br />
quenching.<br />
There is no considerable difference in the values of detection<br />
limits for normal spectra, derivative spectra and values<br />
in the presence of 0.0012 M cationic surfactant Zephyramine<br />
Fig. 3. The first derivative excitation(a) and emission(b) spectra<br />
of Aluminium(III) in the presence of 7.4 × 10 –5 mol dm –3 QSA<br />
at 620 V in dependence on concentration of Al(III).<br />
1 – 1.6 μg cm –3 , 2 – 0.8 μg cm –3 , 3 – 0.4 μg cm –3 , 4 – 0.2 μg cm –3 ,<br />
5 – 0.05 μg cm –3 , 6 – 0 μg cm –3<br />
s514<br />
when values according to Graham and IUPAC recommendation<br />
are compared.<br />
Cationic surfactants increase considerably the intensity<br />
of fluorescence with no λ max shift, but some little bathochromic<br />
shift (lesser than 20 nm) of excitation maximum is observed.<br />
The fluorescence increase is time dependent and takes<br />
1 hour either during radiation or when the sample is left in<br />
darkness. Since the largest effect of the cationic surfactant is<br />
often observed for the CMC the formation of a fluorescent<br />
ion associate is assumed with the anionic metal complexes.<br />
The fluorescence, however, slowly decreases after reaching<br />
the micellar concentration of the surfactant.<br />
The largest positive effect was found for 0.0012 M<br />
Zephyramine but for the subsequent increase of concentration<br />
a considerable decrease of fluorescence is observed for<br />
all cationic surfactants.<br />
The anionic surfactants such as dodecylsulphate have<br />
a negative influence with the increasing concentration. no<br />
effect is observed for selected non ionic surfactants such as<br />
Triton X 100 and Brij 35, and β-cyclodextrine.<br />
The effect of various surfactants follows from the Fig. 4.<br />
which shows relative fluorescence intensity dependence<br />
on surfactant concentration for GaQSA. The influence of<br />
surfactants for the AlQSA and InQSA is similar to that of<br />
GaQSA complex.<br />
Fig. 4. Surfactants influence on the GaQSA complex at pH 3.<br />
Septonex, Zephyramine, Ajatine, SDS – mol dm –3 , CTAC (hexadecyl<br />
trimethyl ammonium chloride – c/4 [mol dm –3 ], DDAb<br />
(Didodecyldimethyl ammonium bromide), β-Cyklodextrine –<br />
c/5 [mol dm –3 ], Triton x 100 – c/4 × 10 –5 [ppm], brij –<br />
c/15 [mol dm –3 ].<br />
Critical micellar concentrations are highlighted by the fulfilled<br />
marks<br />
The fluorimetric method of continuous variations for at<br />
least two concentrations c o gives unambiguously the simple<br />
mole ratio M : L = 1 : 1 in the Al 3+ , Ga 3+ and In 3+ complexes<br />
at pH 3–4. For the increasing pH 8 and In 3+ a higher complex<br />
is also indicated (Fig. 5.).<br />
In the presence of constant concentration 0.0012 M of<br />
cationic surfactant Zephyramine a ratio M : L = 1 : 3 appears<br />
which may indicate the formation of a ternary species, ML 3 3–<br />
.3 T + .
Chem. Listy, 102, s265–s1311 (2008) Environmental Chemistry & Technology<br />
Fig. 5. Continuous variations of AlQSA complex at ph 4.<br />
1 – c 0 = 1.1 × 10 –4 M, 635 V, 2 – c 0 = 5.6 × 10 –5 M, 705 V,<br />
3 – 5.6 × 10 –5 M, 0.0012 M Zephyramine, 660 V<br />
There are no interferences observed for na + and K + at<br />
1,000 : 1 molar ratio. The effects of some other ions at optimalized<br />
conditions are summarized in Fig. 6. no considerable<br />
difference in the interferences is observed for the absence or<br />
presence of cationic surfactant Zephyramine (Fig. 6.).<br />
Fig. 6. Interferences for 0.3 μg cm –3 of each element at optimal<br />
conditions in the presence of 0.0012 M Zephyramine<br />
For the application, 0.04–1 μg cm –3 of Al 3+ , Ga 3+ and<br />
In 3+ are determined in the excess of QSA in the presence of<br />
0.0012 M Zephyramine and 0.05 M hexamethylentetramine<br />
at pH 4 for Al, pH 3 for Ga and in the presence of 0.05 M<br />
tetraborate at pH 8. In the presence of 0.05 M hexamethylentetramine<br />
or sodium tetraborate 10% lower fluorescence<br />
intensity is observed. 0.05 M MES is not suitable because of<br />
larger fluorescence intensity decrease about 15 %.<br />
s515<br />
Conclusions<br />
The collinear fluorescence spectra of complexes with<br />
8-Hydroxyquinoline-5-sulphonic acid were used for the<br />
study of Al, Ga, In complexes and determination of these<br />
elements at pH 4, 3 or 8. Strictly linear calibration plots for<br />
0.04 – 1 μg cm –3 of the metal ion are observed under optimized<br />
conditions for the normal and first derivative spectra or in<br />
the presence of cationic surfactant.<br />
The efficiency of fluorescence intensity increases in<br />
the presence of submicellar concentrations of cationic surfactants,<br />
especially Zephyramine. The detection limits from<br />
normal or first derivative spectra and in the submicellar media<br />
are practically identical (0.03–0.05 μg cm –3 ), but sensitivity is<br />
significantly increased in the presence of Zephyramine. Fatal<br />
interferences are observed from Fe 3+ and PO 4 3– only.<br />
For the individual determination of Al, Ga and In with<br />
QSA hexamethylentetramine or sodium tetraborite buffers<br />
are suitable. The multicomponent determination of these ions<br />
can be carried out by approaching the PLS method 10 .<br />
REFEREnCES<br />
1. Bishop J. A.: Anal. Chim. Acta 29, 172 (1963).<br />
<strong>2.</strong> Alonso J. I. G., Garcia M. E. D., Medel A. S.: Talanta<br />
31, 361 (1984).<br />
3. Prat M. D., Compañó R., Beltrán J. L., Codony R.: Journal<br />
of Fluorescence 4, 279 (1994).<br />
4. Soroka K., Vithanage R. S., Phillips D. A., Walker B.,<br />
Dasgupta P. K.: Anal. Chem. 59, 629 (1987).<br />
5. Salinas F., Delapena A. M., Duran M. S.: Anal. Letters<br />
21, 1457 (1988).<br />
6. Porter n., Hart B. T., Morrison R., Hamilton I. C.: Anal.<br />
Chim. Acta 308, 313 (1995).<br />
7. Graham R. C.: Data Analysis for the Chemical Sciences.<br />
A Guide to Statistical Techniques. VCH Publishers<br />
(1993).<br />
8. Currie L. A.: Pure and Applied Chemistry 67, 1699<br />
(1995).<br />
9. Vosburgh W. C., Cooper G. R.: J. Am. Chem. Soc 63,<br />
437 (1941).<br />
10. Vojta S., Jančář L., Sommer L.:, Journal of Fluorescence<br />
18, 339 (2007).
Chem. Listy, 102, s265–s1311 (2008) Environmental Chemistry & Technology<br />
P88 SuRGICAL POLyESTER FAbRIC<br />
IMPREGNATED by CROSS-LINKED<br />
COLLAGEN<br />
PAVeL FILKA, LUCY VOJTOVá and JOSEF JAnČář<br />
Brno University of Technology, Faculty of Chemistry,<br />
Institute of Materials Chemistry, Purkyňova 464/118, 612 00<br />
Brno, Czech Republic,<br />
xcfilka@fch.vutbr.cz<br />
Introduction<br />
Collagen is a widely applicable protein in medical applications.<br />
The main advantage of this biomaterial is its ability<br />
to create fibers with a high strength and stability by using different<br />
cross-linking agents or physical methods. Collagen’s<br />
significant properties are biocompatibility and resorbability in<br />
organism, which might be particularly used at surface modification<br />
of surgical fabrics based on polyester silk (PES). The<br />
collagen modified PES nets used in surgery for longtime fixation<br />
or reinforcing different organs may accelerate healing<br />
injury as well as reduce inflammation of a tissue surrounding<br />
the implanted fabrics 1 .<br />
natural crosslinking gives collagen special properties,<br />
namely higher rigidity and endurance against proteolytical<br />
cleavage. However, during processing and utilization the<br />
collagen loses those particular properties. That is why the<br />
collagenous material is additionally cross-linked by chemical<br />
or physical methods in order to regenerate original net<br />
behaviours.<br />
Chemical methods employ bifunctional compounds<br />
(e.g. aldehydes, epoxides, isocyanides, carbodimides, acrylic<br />
acid etc.) which can react with amino groups of collagen<br />
in two different places resulting in generation of a new<br />
strengthing bond. Their main disadvantage is toxicity of<br />
used chemicals 2 . Instead of toxic aldehydes it might be used<br />
nontoxic 1-ethyl-3-(-dimethylaminopropyl) carbodiimide<br />
(EDC), which is soluble in water. For reaction acceleration<br />
the n-hydroxysuccinimide (nHS) as catalyst can be added to<br />
the system with EDC 3 .<br />
In this work cross-linking agents based on melaminformaldehyde<br />
resin (named as LYOFIX and MH – 83) as<br />
well as carbodiimide (system EDC/nHS) were used for<br />
crosss-linking collagen impregnated on the polyester surgical<br />
net CHS 100. Swelling behaviours in the water and degradation<br />
at 37 °C in physiological solution with the purpose of<br />
increasing biocompatibility of commercial surgical net were<br />
examined.<br />
Experimental<br />
Modified derivative of alkylmelamineformaldehyde in<br />
aqueous solution (LYOFIX, Ciba, Hungary), hexamethylolmelamineformaldehyde<br />
resin (MH-83, Draslovka a.s. Kolin,<br />
CZ), 1-ethyl-3-3-dimethylaminopropyl)-carbodiimide hydrochloride<br />
(EDC, Sigma-Aldrich s.r.o.), n- hydroxysukcinimide<br />
(nHS 98 %, Sigma-Aldrich s.r.o.), na 2 HPO 4 . 12H2 O<br />
(Lach-ner a.s. CZ), collagen type I (8 %, VUP a.s., Brno),<br />
net for surgical purposes (CHS 100 – knitwork made from<br />
s516<br />
polyester silk, VUP a.s., Brno), ultra - clean demineralize and<br />
deionize MILIQ water (prepared in arrangement of Millipore<br />
S.A. at FCH BUT, CZ).<br />
P r e p a r a t i o n o f a C o l l a g e n F i l m s<br />
Polyester fabric CHS 100 was cut into same size square<br />
pieces of about 1 cm 2 which were diped layed on the 5 ml<br />
of 1% collagen solution (prepared from 100% freeze – dried<br />
collagen) embedded with extra 5 ml of 1% collagen solution.<br />
This sample was air-dried for approximately 48 h to the constant<br />
weight.<br />
C r o s s - L i n k i n g<br />
Collagenous films were cross-linked by 2% solution<br />
of LYOFIX and Mn-83 resins for a period of 12 mins.<br />
Subsequently the samples were five times washed by the<br />
distilled water for 5 mins and dryied by air to the constant<br />
weight.<br />
Collagenous films were cross-linked by the ethanol solution<br />
containing 50 mmol dm –3 of EDC and 25 mmol dm –3 of<br />
nHS. After 4 h of cross-linking the samples were washed out<br />
for 2 h in 0.1M solution of na 2 HPO 4 . 12H2 O and finally four<br />
times for half an hour in the distilled water followed by airdrying<br />
to the constant weight.<br />
S w e l l i n g<br />
Swelling characteristics were evaluated to compare the<br />
cross-linking effectivity by each agent. Swelling proceeded<br />
for a period of 40 min to 1 h in MILIQ water at a laboratory<br />
temperature. Quantity of absorbed water was weighted in five<br />
minute intervals. Both water content (OV) and swelling ratio<br />
(SB) of each sample were calculated according to equation<br />
(1) and (2), where mc is weight of swollen sample in a given<br />
time and ms is weight of dry sample prior the swelling 4 .<br />
m<br />
OV [%] =<br />
c −ms<br />
⋅ 100<br />
(1)<br />
mc SB [–] = m c<br />
m s<br />
D e g r a d a t i o n<br />
Each sample was placed in the physiological solution<br />
with addition of sodium azide (0.1% naCl + 0.02% na 3 n)<br />
and placed into the incubator set to 37 °C to determine the<br />
hydrolytic degradation. Prepared samples were every day<br />
taken out from the incubator, dried by the filtration paper,<br />
consequently weighted and immediately placed back with<br />
fresh physiological solution. Degradation was expressed as<br />
percentual decrease of collagen weight in certain time having<br />
the zero point at the maximum of swelling according to equations<br />
(3) and additionaly (4)–(6).<br />
(2)
Chem. Listy, 102, s265–s1311 (2008) Environmental Chemistry & Technology<br />
Degradation = 100 – ((Wk . 100)/Wb) (3)<br />
Wk = W – W sb<br />
Wsb = W ss + W ss . OV 13<br />
(4)<br />
(5)<br />
W<br />
OV13 =<br />
sb<br />
−Wss<br />
⋅ 100<br />
(6)<br />
W<br />
sb<br />
Wk represents weight of swollen collagenous sample<br />
without wet net, Wb is weight of swollen collagenous sample<br />
at maximum of swelling, Wsb is weight of wet net, Wss is<br />
weight of dry net, W is weight of swollen collagenous sample<br />
with net and OV 13 is water in net after 13 days of swelling<br />
(%).<br />
M o r p h o l o g y<br />
Morphology of samples was observed by the scanning<br />
electron microscope Philips Quanta 200. On the sample surface<br />
conductive lay of 3–4 nm were steamed by the sputter<br />
Polaron SC7640 prior the analysis.<br />
Result and Discussion<br />
S w e l l i n g R a t i o<br />
Swelling ratio (SB) of all prepared samples shows Fig. 1.<br />
It can be seen that the highest swelling ratio attained non<br />
cross-linked collagen (SB = 42 in 25 min), then non crosslinked<br />
collagen coated on the net (SB = 14 in 25 min). Crosslinked<br />
collagens have almost same swelling ratio (SB = 3–4<br />
in 25 min). The lower amount of water absorbed polyester<br />
net (SB = 1 in 25 mine).<br />
Fig. 1. Dependence of swelling ratio on time for samples crosslinked<br />
by the EDC – NhS (), LyOFIx (), Mh-83 (), non<br />
cross-linked collagen with net (), non cross-linked collagen<br />
without the net () and the net without collagen ().<br />
s517<br />
D e g r a d a t i o n<br />
From the degradation behavior dependence of collagen<br />
in the physiological solution at 37 °C on time (Fig. <strong>2.</strong>) it is<br />
assumed that the fastest degradation yielded non cross-linked<br />
collagen within 21 days of incubation. After 23 days degraded<br />
non cross-linked collagen coupled to the net resulting in<br />
net maintain. The slowest degradation in the physiological<br />
solution showed the collagen cross-linked by EDC-nHS<br />
which recorded 59 % of degradation in 78 days of incubation.<br />
The shortest degradation of cross-linked collagen embodied<br />
sample treated by LYOFIX resin (17 % of degradation<br />
in 24 days) followed by MH-83 resin (32 % of degradation<br />
in 35 days).<br />
Fig. <strong>2.</strong> Dependence of degradation on time of collagenous samples<br />
coss-linked by the EDC – NhS (), LyOFIx (), Mh 83<br />
(), non cross-linked collagen on the net (), non cross-linked<br />
collagen without the net ()<br />
M o r p h o l o g y<br />
Scanning electron microscope picture in Fig. 3.a (sight<br />
angle of 54 °) shows good adhesion between the non crosslinked<br />
collagen coated on the PES net as well as between the<br />
collagen cross-linked by the EDC-nHS and the PES fabric<br />
(Fig. 3.b).<br />
Cross-linked samples after the degradation were observed<br />
in environmental mode. From the Fig. 4. it is evident<br />
the separation of collagen from the polyester net in this case<br />
(a) (b)<br />
Fig. 3. Morphology of collagen built – up on the net ChS100<br />
non cross-linked (a) and cross-linked by the EDC – NhS (b)
Chem. Listy, 102, s265–s1311 (2008) Environmental Chemistry & Technology<br />
cross-linked by the EDC – nHS after the 78 days of incubation<br />
in the physiological solution.<br />
Fig. 4. Morphology of degraded collagen coated on the net and<br />
cross-linked by the EDC – NhS<br />
Conclusions<br />
The all cross-linked collagen samples embodied very<br />
good adhesion to the net when coated and did not show any<br />
separation until the total degradation. Samples cross-linked<br />
by the new system of EDC-nHS attained approximately the<br />
same swelling ratio like samples cross-linked by the resins of<br />
LYOFIX and MH-83. The biggest strength of polymeric net<br />
and hydrolytic degradation resistivity showed sample crosslinked<br />
by the EDC-nHS system, which were stable against<br />
s518<br />
the degradation for 78 days in physiological solution at 37 °C<br />
(confirmed by microscopy). Due to the obtained properties<br />
the new cross-linked collagen might enhance the biocompatibility<br />
of commercially used net CHS 100 since it is coated<br />
and implanted. Moreover, collagen itself might be modified<br />
(e.g. with hyaluronic acid) in order to speed up the wound<br />
healing process or reduce the tissue inflammation in the net<br />
surrounding environment.<br />
This work was supported by the Ministry of Education,<br />
Youth and Physical Training of the Czech Republic under the<br />
research project MSM 0021630501<br />
REFEREnCES<br />
1. Lee Chi H., Singla A., Lee Y.: Int. J. Pharm. 221, 1<br />
(2001).<br />
<strong>2.</strong> Dijkstra P. J., Damink L. H. H., Feijen J.: Cardiovasc.<br />
Path 01. 5, 286 (1996).<br />
3. Damink L. H. H., Dijkstra P. J., Van Luyn M. J. A., Van<br />
Wachem P. B., nieuwenhuis P., Feijen J.: Biomaterials<br />
17, 765 (1996).<br />
4. nam K., Kimura T., Kishida A.: Biomaterials 28, 1<br />
(2007).
Chem. Listy, 102, s265–s1311 (2008) Environmental Chemistry & Technology<br />
P89 SOIL hyGIENE IN OLD <strong>ENVIRONMENTAL</strong><br />
buRDEN AREAS<br />
ALEnA VOLLMAnnOVá a , Ján TOMአa , DAnIEL<br />
BAJČAn a and PETER KOVáČIK b<br />
a Department of Chemistry, Faculty of Biotechnology and<br />
Food Sciences,<br />
b Department of Agrochemistry and Plant Nutrition, Faculty<br />
of Agrobiology and Food Resources, Slovak University of Agriculture,<br />
Tr. A. Hlinku 2, 949 01 Nitra, Slovak Republic<br />
Alena.Vollmannova@uniag.sk<br />
Introduction<br />
The necessity of old environmental burden areas remedy<br />
is one of present environmental problems. The negative effect<br />
of the anthropogenic breach into the environment arised<br />
in the past still exists. It can be often a potential source of risk<br />
element input into the all components of the environment.<br />
The old scrap-heaps, mines, landfills, industrial, biological 1<br />
and chemical wastes, heavy metals 2 and oil products are<br />
important factors of the environment contamination.<br />
In our research work the soil hygiene of three various<br />
old environmental burden areas of Slovakia is evaluated.<br />
The first one is the wider surrounding of previous nickel<br />
smeltery in Sereď situated in the loaded region Dolný Váh,<br />
one of 12 regions of the Slovak Republic with the most contaminated<br />
soils by risk elements 3 . The second observed region<br />
is the alluvial area near of Štiavnica river running through the<br />
area long-time burden by intensive mine activity 4 . The third<br />
surveyed locality is the wider surrounding of Iron ore mines<br />
in Rudňany. This enterprise belonged in the past to the one<br />
of determining sources of the emission contamination of the<br />
environment in loaded area of Stredný Spiš.<br />
The risk of heavy metal input from residual metallic burden<br />
soil into the food plants as well as into the whole human<br />
food chain is in observed regions evident.<br />
Experimental<br />
The observation of risky elements in soils were realized<br />
on parcels in cadasters of villages: Zavar, Križovany, Vlčkovce,<br />
Hoste, Malá Mača and Veľká Mača in the distance<br />
of 5 to 9 km in northern and nort-western direction and in<br />
cadasters of villages Veľká Mača, Šintava and Vinohrady nad<br />
Váhom in the distance of 2 km south-western, <strong>2.</strong>8 km eastern<br />
and 3.5 km north-eastern from former emmission source of<br />
nickel smeltery Sereď.<br />
In longitudinal north-southern direction of river Štiavnica<br />
alluvium 11 soil samples from cadastres of villages Prenčov,<br />
Hontianske nemce, Hontianske Tesáre, Terany, Dudince,<br />
Hokovce, Horné Semerovce, Tupá, and Hrkovce were taken.<br />
The river length is 54.6 km. The distance between Prenčov<br />
and Hrkovce is about 36 km.<br />
In the Stredný Spiš region the soil samples were taken<br />
in cadaster of Markušovce in the distance of 10–1<strong>2.</strong>5 km<br />
north-western, Matejovce 7.6 km northern, Chrasť nad Hro<br />
s519<br />
nom 10 km north-eastern and Poráč 6 km eastern of former<br />
emmission source ŽB Rudňany.<br />
The samples with pedological probe from surface soil<br />
layer were taken from 33 experimental sites. Analyses were<br />
conducted in samples of soil ground on fine soil I. and from<br />
this fine soil the representative sample was taken and sieved<br />
through the sieve with average 0.2 mm (fine soil II). The total<br />
content of risky elements was determined by the AAS method<br />
in soil extract gained after total decomposition of soil by wet<br />
way with the mixture of acids HF + HnO 3 + HClO 4 .<br />
Results<br />
The soil hygiene was evaluated after Resolution of the<br />
Ministry of Agriculture of the Slovak Republic no. 531/1994-<br />
-540, which determines the hygienic limits for soil contents<br />
of 15 selected risk elements. The reference value A means<br />
that the soil is not contaminated if the substance concentration<br />
is below this value, the indicative value B means that soil<br />
contamination was analytically proven, the indicative value C<br />
means the necessity of the soil sanitation. The soils surround<br />
of previous nickel Smeltery Sereď could be considerated<br />
from the standpoint of risky metals contents as relatively<br />
„clean“, in spite of moderately enhanced contents of Cd, Cu,<br />
ni and Co. There was no content value meaning analytical<br />
proof of soil contamination. The Cd content was in the range<br />
from 1.6 to <strong>2.</strong>5-fold of background value A (0.8 mg Cd kg –1 )<br />
in all observed parcels. The ni content exceeded the value<br />
A (35 mg ni kg –1 ) in all parcels with the exception of Vinohrady<br />
nad Váhom locality, while it was enhanced from 1.1 to<br />
1.4-fold. The Cu content was increased in all localities with<br />
the exception of Zavar and Veľká Mača (1.03 to 1.93-fold of<br />
value A 36 mg Cu kg –1 ). The enhanced soil content of Co was<br />
observed in Zavar, Hoste, Veľká Mača and Šintava (1.06 to<br />
1.22-fold of value A 20 mg Co kg –1 ). All of the determined<br />
values were deeply under the hygienic limit for the soil contamination.<br />
In soils of the second observed region of alluvium Štiavnica<br />
river the soil contamination by high contents of Cu, Zn,<br />
Cd and Pb was confirmed. The determined Pb contents were<br />
extremely high in all of analysed soil samples and they even<br />
markedly exceeded the indicative limit value for soil sanitation<br />
C (600 mg Pb kg –1 ) given by valid legislative.The Cu<br />
and Pb contents in observed soils were the highest in Prenčov<br />
(<strong>2.</strong>6-fold of indicative value B 100 mg Cu kg –1 resp. 5.4-fold<br />
of indicative value C for Pb), the highest Zn and Cd contents<br />
were determined in soil of Hontianske nemce (5.52-fold<br />
resp. 4.24-fold of indicative values B 500 mg Zn kg –1 resp.<br />
5 mg Cd kg –1 ). The lowest Cu soil content was determined<br />
in Horné Semerovce (on the level of the indicative value<br />
B), the lowest Zn, Cd and Pb contents were determined in<br />
Hontianske Tesáre (Zn on the level of the limit value B, Cd<br />
30% under the limit and Pb 1.78-fold of the indicate value B<br />
150 mg Pb kg –1 ).<br />
The situation in the wider surrounding of the third<br />
surveyed site of the former emmission source was different.<br />
The enormly high content of Hg was found out in Markušovce
Chem. Listy, 102, s265–s1311 (2008) Environmental Chemistry & Technology<br />
in locality Olšanské pole, which was even exceeding the hygienic<br />
limit determining the soil sanitation (1.9 to 3.8-fold of<br />
value C 10 mg Hg kg –1 ). Similarly the extremely high content<br />
of Hg was determined in Poráč, where the 3.2-fold higher<br />
exceeding of this limit value was determined. The contamination<br />
of soil by Hg was obvious also in localities: Pod horky,<br />
Zemkovské (Markušovce) and na stráni (Matejovce because<br />
of the exceeding of limit value B (2 mg Hg kg –1 ) for the soil<br />
contamination at 4.65-fold. Similarly the soil contamination<br />
by As was proved in Markušovce (locality Olšanské pole),<br />
where the limit value B (30 mg As kg –1 ) was exceeded 1.45fold<br />
and Poráč (locality Pasienky) with 1.06-fold In Poráč the<br />
soil contamination by Cu was evident (1.15-fold of limit B).<br />
Conclusions<br />
The residual soil burden by heavy metals and potential<br />
follow contamination of the food chain in observed areas presents<br />
the potential risk for the human health. Therefore it is<br />
important to monitor the risk metal contents as in soils as in<br />
agricultural plants and in case that it is necessary to realise<br />
s520<br />
the remedy for the inhibition of the risk heavy metal input<br />
into the human food chain.<br />
This work has been supported by projects KEGA No.<br />
3/5081/07 and VEGA No. 1/3455/06<br />
REFEREnCES<br />
1. Toth, T.: Acta Envir. Univ. Comenianae 15(1), 66<br />
(2007).<br />
<strong>2.</strong> Hegedusova, A., Hegedus, O., Musilova, J.: Risks of soil<br />
contamination by cadmium. Monograph. CPU nitra,<br />
2006<br />
3. Bedrna, Z.: Environmental pedology. SAS Bratislava,<br />
2002<br />
4. Arvay, J., Melichacova, S., Lahucky, L., Musilova, J.,<br />
Bystricka, J.: Food safety and control : The crops quality<br />
cultivated on heavy metals contaminated soil from<br />
Region Hont, nitra, 28–29. 3. March 2008, Book of<br />
Works, SAU nitra, 2007.
Chem. Listy, 102, s265–s1311 (2008) Environmental Chemistry & Technology<br />
P90 EPR STuDy ON PhOTOINDuCED PROCESSES<br />
OF NOVEL QuINOLONE DERIVATIVES<br />
ZUZAnA VRECKOVá, VLASTA BREZOVá, MAROŠ<br />
BELLA, VIKTOR MILATA and SOňA JAnTOVá<br />
Institute of Physical Chemistry and Chemical Physics, Faculty<br />
of Chemical and Food Technology, Slovak University of<br />
Technology in Bratislava, Radlinského 9, 812 37 Bratislava,<br />
Slovak Republic,<br />
zuzana.vreckova@stuba.sk<br />
Introduction<br />
4-Oxo-1,4-dihydroquinoline derivatives (4-quinolones)<br />
represent one of the largest classes of antimicrobial agents<br />
used nowadays in the medical care 1 . Specific members of<br />
this drug family display also high activity against eukaryotic<br />
type II topoisomerases, as well as against cultured mammalian<br />
cells 2 . These antineoplastic quinolones represent a prospective<br />
source of new anticancer agents. The presence of<br />
extended π-electron system of quinolone derivatives results<br />
in their photosensitive properties; therefore UVA irradiation<br />
can induce their photosensitive reactions with phototoxic<br />
responses. Previously we demonstrated that excitation of nitrogen<br />
heterocycle molecules by UVA radiation may significantly<br />
enhance their biological activities 3 .<br />
novel 7-substituted 6-oxo-6,9-dihydro[1,2,5]selenadiaz<br />
o-lo[3,4-h]quinoline derivatives were synthesized as potential<br />
anticancer and antimicrobial agents and their ability to<br />
produce Reactive Oxygen Species (ROS) upon irradiation<br />
was tested using Electron Paramagnetic Resonance (EPR)<br />
spectroscopy. Additionally, their cytotoxic/phototoxic effects<br />
on human leukemia cells HL60 were characterized.<br />
Experimental<br />
The synthesis of 7-substituted 6-oxo-6,9-dihydro[1,2,5]selenadiazolo[3,4-h]quinoline<br />
derivatives was performed<br />
according to the reaction pathways published in ref. 4 .<br />
Table I summarizes the structure, substitution and abbreviation<br />
of the synthesized selenadiazoloquinolones.<br />
E P R P h o t o c h e m i c a l E x p e r i m e n t s<br />
EPR measurements at the X-band were performed with<br />
an EMX EPR spectrometer (Bruker, Germany) using a TE 102<br />
(ER 4102ST) resonator. Samples were irradiated at 295 K<br />
directly in the EPR spectrometer cavity using HPA 400/30S<br />
lamp (400 W, l max = 365 nm, Philips, UVA irradiance<br />
3 mW cm –2 ). A Pyrex glass filter was applied to eliminate<br />
the radiation wavelengths below 300 nm. The experimental<br />
EPR spectra acquisition and simulation was carried out using<br />
WIN EPR and SimFonia programs (Bruker).<br />
The photoinduced generation of free radicals was monitored<br />
by spin trapping technique with 5,5-dimethyl-1-pyrroline<br />
n-oxide (DMPO) and 5-(diisopropoxyphosphoryl)-5-methyl-<br />
1-pyrroline n-oxide (DIPPMPO) as the spin traps. The selective<br />
oxidation of 4-hydroxy-2,2,6,6-tetramethylpiperidine<br />
(TMP) via singlet oxygen to the paramagnetic nitroxyl radi-<br />
s521<br />
cal 4-hydroxy-2,2,6,6-tetramethylpiperidine n-oxyl (Tempol)<br />
was applied for 1 O 2 detection by EPR spectroscopy. The<br />
aerated solutions of 7-substituted [1,2,5]selenadiazolo[3,4h]quinolo-nes<br />
in dimethylsulphoxide (DMSO) mixed immediately<br />
before EPR experiments, were transferred into a flat<br />
cell (WG-808-Q, Wilmad) suitable for TE 102 cavity, and the<br />
EPR spectra were monitored in situ.<br />
UV/visible spectra were recorded in DMSO by means of<br />
a Shimadzu UV-3600 spectrophotometer.<br />
Table I<br />
Structure, substitution and abbreviation of investigated 7substituted6-oxo-6,9-dihydro[1,2,5]-selenadia-zolo[3,4h]quinoline<br />
derivatives<br />
Structure 7-Substitution Abbreviation<br />
H 7-H-SeQ<br />
COOC 2 H 5 7-COOEt-SeQ<br />
COOCH 3 7-COOMe-SeQ<br />
COOH 7-COOH-SeQ<br />
COCH 3 7-Ac-SeQ<br />
Cn 7-Cn-SeQ<br />
C y t o t o x i c / P h o t o t o x i c E f f e c t<br />
The murine leukemia cell line HL60 (obtained from<br />
American Type Culture Collection, Rockville, MD, USA)<br />
was used. These cells were grown in RPMI medium in 5 %<br />
CO 2 at 37 °C under conditions specified in ref. 4 . A starting<br />
inoculum <strong>2.</strong>6 × 10 5 HL60 cells ml –1 in the exponential phase<br />
of growth was used. 5 ml of the suspension were added<br />
into Petri dishes (diameter 60 mm), then 20 μl of derivative<br />
7-Ac-SeQ at various concentrations were added to the cells.<br />
One part of the dishes was irradiated with HPA 400/30S lamp<br />
upon UVA dose of 0.4 J cm –2 . After 24, 48 and 72 h cultivation,<br />
the number of cells per culture dishes was counted in a<br />
Bürker chamber and viability of treated and control irradiated/non<br />
irradiated cells were determined by 0.4 % trypan<br />
blue staining.<br />
Results<br />
7-Substituted 6-oxo-6,9-dihydro[1,2,5]selenadiazolo[<br />
3,4-h]quinoline derivatives absorb UV radiation with three<br />
absorption maxima about 400, 340 and 300 nm, which are<br />
only slightly influenced by the substituents properties, as is<br />
shown in Fig. 1. The presence of acetyl substituent in 7-Ac-<br />
SeQ derivative caused bathochromic shift of the low-energy<br />
band to 410 nm with a shoulder at 485 nm.<br />
Upon photoexcitation, all 7-substituted 6-oxo-6,9-dihy<br />
dro[1,2,5]selenadiazolo[3,4-h]quinoline derivatives demonstrated<br />
the ability to generate super-oxide anion radicals trapped<br />
as • DMPO-O 2 – or • DIPPMPO-O2 – spin adducts.<br />
Fig. <strong>2.</strong>a shows the time-course of 11 individual EPR<br />
spectra monitored upon continuous UVA irradiation of 7-<br />
COOEt-SeQ, indicating the efficient generation of twelveline<br />
EPR signal with spin Hamiltonian parameters corresponding<br />
to • DMPO-O 2 – (an = 1.275 mT; a H β = 1.032 mT;
Chem. Listy, 102, s265–s1311 (2008) Environmental Chemistry & Technology<br />
Absorbance<br />
0.8<br />
0.6<br />
0.4<br />
0.2<br />
0.0<br />
300 400 500 600 700<br />
Wavelength, nm<br />
7-COOEt-SeQ<br />
7-COOH-SeQ<br />
7-Ac-SeQ<br />
7-CN-SeQ<br />
Fig. 1. uV/VIS spectra of 7-substituted 6-oxo-6,9-dihydro[1,2,<br />
5]selenadiazolo[3,4-h]quinoline derivatives measured in DMSO<br />
(concentration 40 μM; cell length 1 cm)<br />
a H γ = 0.135 mT and g-value = <strong>2.</strong>0058). Additionally, Fig. <strong>2.</strong><br />
b illustrates the formation of typical three-line EPR signal of<br />
Tempol (a n = 1.575 mT; g = <strong>2.</strong>0060) produced from TMP via<br />
singlet oxygen. However, photogenerated paramagnetic Tempol<br />
is upon prolonged irradiation decomposed to diamagnetic<br />
products, most probably by the termination of its nitroxyl<br />
group with super-oxide anion radicals ( > nO • + O 2 •– ).<br />
a)<br />
b)<br />
0 44 88 132 176 220<br />
Irradiation time, s<br />
Fig. <strong>2.</strong> The time-course of EPR spectra monitored upon photoexcitation<br />
of aerated DMSO solutions of 7-COOEt-SeQ<br />
(c 0 = 3.2 mM) in the presence of: a) DMPO spin trap (magnetic<br />
field sweep, SW = 10 mT); b) TMP (SW = 6 mT)<br />
The EPR experiments confirmed that the photoexcitation<br />
of selenadiazoloquinolones in the presence of molecular<br />
oxygen resulted in the formation of O 2 •– and 1 O2 , and<br />
s522<br />
these processes perform simultaneously. The photoactivity<br />
of 7-sub-stituted 6-oxo-6,9-dihydro[1,2,5]selenadiazolo[3,<br />
4-h]quinoline derivatives upon irradiation of polychromatic<br />
UV source was evaluated using (i) quantum efficiency<br />
of spin-adduct formation of superoxide radical with DMPO<br />
spin trap ( • DMPO-O 2 – ), and (ii) quantum efficiency of Tempol<br />
generation from TMP by singlet oxygen. The values of<br />
quantum efficiencies reflect the donor/acceptor properties of<br />
substituents; the highest value of • DMPO-O 2 – quantum efficiency<br />
was found for 7-acetyl 6-oxo-6,9-dihydro[1,2,5]selen<br />
adiazolo[3,4-h]quinoline (7-Ac-SeQ).<br />
The in vitro cytotoxic effect of six 7-substituted 6-oxo-<br />
6,9-dihydro[1,2,5]selenadiazolo[3,4-h]quinoline derivatives<br />
was investigated on cell proliferation of human leukemia<br />
HL60 cells. Derivatives demonstrated different cytotoxic effects,<br />
which were time- and concentration- dependent, and<br />
the highest impact was found for 7-Ac-SeQ. The application<br />
of UVA irradiation caused an escalation of 7-Ac-SeQ effects<br />
on cell proliferation; the percentage of growth inhibition was<br />
increased in the range of 10–50 %.<br />
Conclusions<br />
EPR and UV/Vis experiments confirmed UVA-induced<br />
excitation of 7-substituted 6-oxo-6,9-dihydro[1,2,5]selenadiazolo[3,4-h]quinoline<br />
derivatives, which is coupled with electron<br />
or energy transfer to molecular oxygen via Type I and<br />
Type II photooxidation mechanisms producing super-oxide<br />
anion radical and singlet oxygen.<br />
Dedicated to Prof. Andrej Staško on the occasion of his<br />
70 th birthday.<br />
This study was financially supported by Scientific Grant<br />
Agency of the Ministry of Education of the Slovak Republic<br />
(Projects VEGA 1/4305/07, 1/0225/08 and VEGA 1/3579/06)<br />
and Research and Development Agency of the Slovak Republic<br />
(contract No. APVV 0055-07).<br />
REFEREnCES<br />
1. Oliphant C. M., Green G. M.: Am.. Family Physician<br />
65, 455 (2002).<br />
<strong>2.</strong> Robinson M. J., Martin B. A., Gootz T. D., Mc-Guirk<br />
P. R., Moynihan M., Sutcliffe J. A., Osheroff n.: J. Biol.<br />
Chem. 266, 14,585 (1991).<br />
3. Jantová S., Letašiová S., Brezová V., Čipák ľ., Lábaj J.:<br />
J. Photochem. Photobiol. B: Biol. 85, 163 (2006).<br />
4. Bella M., Jantová S., Brezová V., Kučerák J., Ondrušová<br />
ľ.: Industrial Toxicology 07, 27 th International Symposium<br />
Proceedings, p. 127. Bratislava, 2007.
Chem. Listy, 102, s265–s1311 (2008) Environmental Chemistry & Technology<br />
P91 ThE bORON IN KRAFT PuLP MILL AND<br />
INFLuENCE IN wASTE wATER<br />
eVA GEMZICKá and MILAn VRŠKA<br />
Department of Chemical Technology of Wood, Pulp and<br />
Paper, Slovak University of Technology, Radlinského 9,<br />
812 37 Bratislava, Slovak Republic,<br />
milan.vrska@stuba.sk<br />
Introduction<br />
The elemental boron almost is not occurred in nature<br />
and it usually is component only its different compounds.<br />
The boron forms boranes with hydrogen. It forms acids of<br />
these types: (HBO 2 ) n and H 3 BO 3 . The borides are boron compounds<br />
with metals (Me) and boron forms BX 3 with halides<br />
(X 3 ). The oxycompounds are formed with boron and oxygen,<br />
i.e. B 2 O 3 and (BO) n . B 2 O 3 (l) [molten] dissolves oxides of<br />
metals (borax pearls). Wide range of boron compounds exists<br />
with different stoichiometry and structure (see Fig. 1.). The<br />
boron more often exists as borax in nature. The molten borax<br />
covers molten other metal and so it is protective compound<br />
against oxidation. The mixture boron and na 2 CO 3 is used for<br />
dissociation of geological and hard dissolving samples 1,2 .<br />
Fig. 1. Chart for boron reaction<br />
Borax is used in recovery line for process improvement<br />
in kraft pulp mill too. The conventional recovery cycle<br />
with addition of borates; this produces 10 % of the formed<br />
naOH (partial autocaustification). The borates react in two<br />
places in the recovery cycle: the recovery boiler and the<br />
smelt dissolver. In the former sodium carbonate reacts with<br />
a sodium-lean borate, forming a sodium-rich borate formed:<br />
s523<br />
naBO 2 (l) + na 2 CO 3 (l) = na 3 BO 3 (l) + CO 2 (g). In this reaction,<br />
the borates and the sodium carbonates are in a smelt<br />
phase, which implies that the reaction rate is high. In the dissolver,<br />
na 3 BO 3 reacts with water: na 3 BO 3 (l) + H 2 O = 2naO<br />
H(aq) + naBO 2 (aq)(ref. 3 ).<br />
Fig. <strong>2.</strong> borax Na 2 b 4 O 7 . 10h2 O i.e. Sodium tetraborate. It is applied<br />
in different industry: metallurgy, glass industry, ceramic<br />
industry and in some pulp mill<br />
Boron compounds are occurred in fresh/salt water and<br />
in waste water too. Concentration of boron compounds is<br />
app. 5 mg dm –3 in salt water 4 . Boron occurs naturally in fresh<br />
water at an average of 1 mg dm –3 or less many times. High<br />
boron concentrations may be toxic to freshwater fish regarding<br />
concentration of 10–300 mg dm –3 (e.g. for Rainbow trout<br />
24-day LC50 is 88 mg dm –3 ) in flowing water. Mainly borate<br />
is hazardous for water plants (e.g. for Green algae 96-hr IC10<br />
is 24 mg dm –3 ). Any definitive ecotoxicological conclusions<br />
don’t exist about genotoxic, carcinogenic or mutagenic effects<br />
to water organisms, but still under investigation 5 .<br />
Experimental<br />
The autocaustification was realized in kraft pulp mill.<br />
Trial was started on December 1, 2007 till December 14, 2007<br />
and restarted again on January 4, 2008. This trial was finished<br />
on February 25, 2008. Waste water was monitored for<br />
boron concentrations in two different laboratories. The boron<br />
concentration was determined in the first laboratory (spectrophotometry<br />
with azomethin at 415 nm) as calculation from<br />
borates. The boron also was analyzed using OES ICP method<br />
(in 2 nd laboratory) the first time in different samples of waste<br />
water, which were from different pH and COD. Alkali waste<br />
water, acid waste water, waste water of sewage water treatment<br />
plant, water from river and output to river were analyzed<br />
for boron in two steps, i.e. during trial and after trial in<br />
2 nd laboratory with OES ICP.<br />
Borax was added into dissolvent tank for green liquor<br />
step by step. Boron concentration was increased in waste<br />
water in February, when borax was added more in recovery<br />
line.<br />
Results<br />
Boron analysis was difficult because of small particulates,<br />
which were filtrated from samples, but boron concentration<br />
was estimated from samples, which were not filtrated.
Chem. Listy, 102, s265–s1311 (2008) Environmental Chemistry & Technology<br />
Fig 3. Comparison of b analysis<br />
Note : w.w. = waste water, MWWT = mechanical waste water<br />
treatment, SWTP = sewage water treatment plant<br />
Fig. 4. boron concentrations<br />
The results are from these samples, because boron could be<br />
component in small particulates of waste water samples.<br />
Boron concentration is low in waster water which is cleaned<br />
in SWTP. The limits are not specified by low for boron concentration<br />
in waste water to the water recipient.<br />
In the Danube, water (Komárno – Bratislava) was<br />
determinate to have a natural concentration on the level of<br />
s524<br />
39 µg dm –3 (ref. 6 ) and for river is the level of 20 µg dm –3 in<br />
the river after the biological waste water treatment plant and<br />
20 µg dm –3 in recipient to pulp mill. Boron concentration was<br />
low in lime sludge too. Boron was accumulation in system<br />
and its output was waste water, but boron concentration was<br />
low.<br />
Conclusions<br />
In this work was studied effect of adding boron compound<br />
to recovery line on the water quality.<br />
• Boron is component in very small particulates in waste<br />
water, therefore boron concentration is better without<br />
filtration of samples for boron determination. Boron<br />
concentration is not total in waste water by filtration.<br />
• Boron concentration is low in output - waste water to<br />
river, what corresponding accumulation of boron compounds<br />
in system of pulp mill.<br />
• There was little decreasing of boron concentration after<br />
trial, but boron compounds were in system.<br />
Open question:<br />
• What about deposits in recovery line and pipeline of<br />
waste water?<br />
This work has been supported by Kraft pulp mill.<br />
REFEREnCES<br />
1. Internet: Referat – prvky p1 a p2<br />
<strong>2.</strong> www.chtf.stuba.sk/kach/support/ACh_prednaska06.pdf<br />
3. Richards T., nohlgren I., Warnqvist B., Theliander H.:<br />
nordic Pulp and Paper Research Journal 17(3), 213<br />
(2002).<br />
4. http://sk.wikipedia.org/wiki/B%C3%B3r<br />
5. Safety data sheet for commercial product [borax]<br />
6. www.gabcikovo.gov.sk/vvb/vr2004/priloha%20D/text.<br />
Chem. Listy, 102, s265–s1311 (2008) Environmental Chemistry & Technology<br />
P92 CONTENTS OF DIFFERENT FRACTIONS OF<br />
SuLPhuR IN SLOVAKIA SOILS<br />
AnTOn ZAUJEC a , LýDIA JEDLOVSKá a and MELánIA<br />
FESZTEROVá b<br />
a Faculty of Agrobiology and Food Resources, Slovak University<br />
of Agriculture, Tr. A. Hlinku 2, 949 76 Nitra, Slovakia,<br />
b Faculty of Natural Sciences, Constantine the Philosopher<br />
University, Tr. A. Hlinku 1, 949 74 Nitra,<br />
Anton.Zaujec@uniag.sk<br />
Introduction<br />
In the past there were high sulphur contents in the soil,<br />
mostly from the atmospheric inputs. nowadays, in some<br />
localities deficit of sulphur was observed. In the last time<br />
advanced quality of environment is required by society. The<br />
aim of this work was to identify the distribution of sulphur<br />
fractions in different soil types of Slovakia.<br />
Experimental<br />
Basic sulphur fractions that we assessed in soil samples<br />
were: chloride soluble sulphur (CISS), sulphate sulphur (SS),<br />
heat soluble sulphur (HSS) by Williams-Steinbergs. Soil<br />
samples were taken from similar depths from 52 localities<br />
including basic soil types: Haplic Chernozems (CHH), Haplic<br />
Luvisols (LVH), Phaeozems (PH), Eutric Cambisols (CME),<br />
Dystric Planosols (PLD), in 1999–2006 years. Analytical<br />
methods of sulphur fractions determination were described<br />
by Jedlovská, Feszterová 1 .<br />
Results and Discussion<br />
C h l o r i d e S o l u b l e S u l p h u r F r a c t i o n<br />
( C l S S )<br />
The chloride soluble sulphur values (ClSS) were determined<br />
as extremely hight in Phaeozems, in localita Maňa,<br />
Žitavský luh 2,744.5 mg kg –1 (depth: 0–0.1 m) and in locality<br />
Okoč 1,173.6 mg kg –1 (0–0.4 m). Generally, the contents<br />
of ClSS varied with depth, the highest values were observed<br />
in subsoil layers. The minimum values were determined in<br />
vineyard on Eutric Cambisols 3.2 mg kg –1 (0.3–0.6 m; Tokaj)<br />
and in textural light Haplic Luvisols 4.4 mg kg –1 (0.5–0.6 m;<br />
Rišňovce).<br />
S u l p h a t e S u l p h u r F r a c t i o n ( S S )<br />
The highest sulphate sulphur content was in Haplic Luvisols<br />
locality Golianovo (1,191.7 mg kg –1 ; depth: 0–0.2 m)<br />
and nové Sady (856.1 mg kg –1 ; 0.2–0.4 m). The content of<br />
sulphate sulphur varies by soil types and depth of soil profiles.<br />
The minimum values (from 1.2 mg kg –1 to 3.7 mg kg –1 )<br />
were observed in topsoil of Haplic Chernozems (locality Štefanovičova),<br />
Eutric Cambisols (locality Viničky) and Haplic<br />
Luvisols (Rišňovce).<br />
s525<br />
Table I<br />
Contents of chloride soluble sulphur (ClSS)<br />
Soil types/ Depth Mean Standard<br />
(numbers) [m] [mg kg –1 ] deviation<br />
0.0–0.2 19<strong>2.</strong>5 175.2<br />
Haplic 0.2–0.4 9<strong>2.</strong>8 61.2<br />
Chernoyems 0.4–0.6 151.0 13<strong>2.</strong>5<br />
(14) 0.6–0.8 98.7 71.8<br />
0.8–1.4 70.0 66.1<br />
0.0–0.2 234.0 151.4<br />
Phaeozems<br />
(6)<br />
0.2–0.4<br />
0.4–0.6<br />
0.6–0.8<br />
373.7<br />
358.0<br />
453.2<br />
271.5<br />
220.4<br />
303.0<br />
0.8–1.4 261.7 81.8<br />
0.0–0.2 305.3 274.3<br />
0.2–0.4 299.9 259.8<br />
Haplic 0.4–0.6 299.1 254.7<br />
Luvisols 0.6–0.8 375.3 333.6<br />
(17) 0.8–1.0 384.4 299.7<br />
1.0–1.2 395.5 275.0<br />
1.2–1.4 244.3 201.6<br />
0.0–0.2 8<strong>2.</strong>0 77.0<br />
Dystric 0.2–0.4 45.4 3<strong>2.</strong>5<br />
Planosols 0.4–0.6 63.7 20.3<br />
(5) 0.6–0.8 106.2 7<strong>2.</strong>4<br />
0.8–1.4 121.8 118.5<br />
0.0–0.2 130.0 125.9<br />
Eutric 0.2–0.4 157.4 157.3<br />
Cambisols 0.4–0.6 159.2 154.3<br />
(10) 0.6–0.8 171.8 156.4<br />
0.8–1.4 187.7 115.0<br />
H e a t S o l u b l e S u l p h u r F r a c t i o n<br />
( H S S )<br />
The lowest values of HSS fraction were determined<br />
in comparison to the mentioned sulphur fractions. The highest<br />
HSS content was in Phaeozems locality Žitavský luh<br />
(1,837.4 mg kg –1 ; depth: 0–0.1 m), in Haplic Luvisols locality<br />
Revúca (617.5 mg kg –1 ; 0–0.3 m) and in Haplic Chernozems<br />
locality Sládkovičovo- nový Dvor (433.8 mg kg –1 ;<br />
0.5–0.7 m). The minimum of HSS (from 0.28 mg kg –1 to<br />
1.2 mg kg –1 ) were observed in topsoil of Eutric Cambisols<br />
(Tokaj), of Haplic Luvisols (Tesárske Mlyňany) and in sandy<br />
loam Haplic Chernozems (Dulovce).<br />
Conclusions<br />
The contents of sulphur fractions (ClSS, SS, HSS) varied<br />
by depth of soil profiles and soil types. The maximumn values<br />
of ClSS fraction were observed in Phaeozems (336.1 mg kg –1 )<br />
and Haplic Luvisols (329.1 mg kg –1 ). The values under<br />
average values of ClSS (206.2 mg kg –1 ) were in Eutric Cambisols<br />
(161.2 mg kg –1 ), Haplic Chernozems (121.0 mg kg –1 )<br />
and Dystric Planosols (83.8 mg kg –1 ). The highest contents<br />
of SS fraction were determined in Haplic Chernozems
Chem. Listy, 102, s265–s1311 (2008) Environmental Chemistry & Technology<br />
Table II<br />
Contents of sulphate sulphur (SS)<br />
Soil types/ Depth Mean Standard<br />
(numbers) [m] [mg kg –1 ] deviation<br />
0.0–0.2 16<strong>2.</strong>1 134.2<br />
Haplic 0.2–0.4 184.2 144.9<br />
Chernozems 0.4–0.6 116.9 97.9<br />
(14) 0.6–0.8 149.7 108.7<br />
0.8–1.4 120.9 87.0<br />
0.0–0.2 213.2 125.7<br />
Phaeozems<br />
(6)<br />
0.2–0.4<br />
0.4–0.6<br />
0.6–0.8<br />
218.4<br />
263.2<br />
428.9<br />
5<strong>2.</strong>0<br />
140.7<br />
187.2<br />
0.8–1.4 377.3 145.5<br />
0.0–0.2 323.0 320.3<br />
0.2–0.4 389.5 234.6<br />
Haplic 0.4–0.6 234.2 117.7<br />
Luvisols 0.6–0.8 24<strong>2.</strong>0 124.3<br />
(17) 0.8–1.0 223.7 46.7<br />
1.0–1.2 281.4 64.6<br />
1.2–1.4 310.0 6<strong>2.</strong>2<br />
0.0–0.2 38.7 35.9<br />
Dystric 0.2–0.4 53.5 64.3<br />
Planosols 0.4–0.6 53.9 46.7<br />
(5) 0.6–0.8 50.3 36.8<br />
0.8–1.4 4<strong>2.</strong>2 30.5<br />
0.0–0.2 9<strong>2.</strong>4 79.0<br />
Eutric 0.2–0.4 103.1 91.6<br />
Cambisols 0.4–0.6 101.2 87.3<br />
(10) 0.6–0.8 154.3 59.9<br />
0.8–1.4 125.0 8<strong>2.</strong>8<br />
(300.2 mg kg –1 ) and in Haplic Luvisols (286.3 mg kg –1 ), while<br />
in Dystric Planosols the values were only 47.7 mg kg –1 .<br />
The differences between soil types were determined in<br />
HSS fraction, where the highest mean values observed in<br />
Phaeozems and Eutric Cambisols. The lowest value of HSS<br />
fraction was in Dystric Planosols.<br />
Decreasing contents of ClSS fraction, in monitoring of<br />
soils types where: PH > LVH > CH > CME > PLD, the decreasing<br />
contents of SS fraction was LVH > PH > CH > CME > P<br />
LD. Presented results show the possibilities how to evaluate<br />
s526<br />
Table III<br />
Contents of heat soluble sulphur (HSS)<br />
Soil types/ Depth Mean Standard<br />
(numbers) [m] [mg kg –1 ] deviation<br />
0.0–0.2 93.4 89.0<br />
Haplic 0.2–0.4 143.8 115.8<br />
Chernozems 0.4–0.6 13<strong>2.</strong>4 130.7<br />
(14) 0.6–0.8 110.4 89.1<br />
0.8–1.4 115.8 93.4<br />
0.0–0.2 207.4 109.5<br />
Phaeozems<br />
(6)<br />
0.2–0.4<br />
0.4–0.6<br />
0.6–0.8<br />
249.8<br />
227.7<br />
213.3<br />
9<strong>2.</strong>7<br />
96.1<br />
36.2<br />
0.8–1.4 214.7 31.2<br />
0.0–0.2 145.3 106.7<br />
0.2–0.4 161.5 84.8<br />
Haplic 0.4–0.6 15<strong>2.</strong>9 86.8<br />
Luvisols 0.6–0.8 163.5 127.2<br />
(17) 0.8–1.0 146.9 51.8<br />
1.0–1.2 131.3 71.2<br />
1.2–1.4 127.7 48.1<br />
0.0–0.2 53.5 5<strong>2.</strong>5<br />
Dystric 0.2–0.4 76.5 46.2<br />
Planosols 0.4–0.6 77.1 24.3<br />
(5) 0.6–0.8 89.1 31.2<br />
0.8–1.4 56.8 3<strong>2.</strong>0<br />
0.0–0.2 203.6 140.4<br />
Eutric 0.2–0.4 130.0 134.6<br />
Cambisols 0.4–0.6 166.1 144.7<br />
(10) 0.6–0.8 239.8 173.7<br />
0.8–1.4 131.0 83.2<br />
the different fractions of sulphur in different soils types in<br />
Slovakia.<br />
This work has been supported by grant VEGA<br />
1/4432/07.<br />
REFEREnCES<br />
1. Jedlovská, L., Feszterová, M.: Proceedings of 10th<br />
Intern. Scientific Workshop: Topical tasks solved in agrofood<br />
sector. (Vavrišinova K., ed.) p.16, nitra 2004.
Chem. Listy, 102, s265–s1311 (2008) Environmental Chemistry & Technology<br />
P93 FACTORS INFLuENCING ThE SORPTION<br />
bEhAVIOuR OF hERbICIDE ACETOChLOR<br />
IN SOILS AND SEDIMENTS<br />
LEnKA ZEMAnOVá, EDGAR HILLER and ZOLTán<br />
KRASCSEnITS<br />
Comenius University in Bratislava, Faculty of Natural<br />
Sciences, Department of Geochemistry, Mlynská dolina,<br />
842 15 Bratislava, Slovak Republic,<br />
zemanoval@fns.uniba.sk<br />
Introduction<br />
Acetochlor (2-chloro-N-(ethoxymethyl)-N-(2-ethyl-6methylfenyl)acetamide)<br />
is a selective systematic herbicide<br />
used in the production of maize, soybean and other crops 1 .<br />
Ability to predict its mobility in the environment is of major<br />
importance as US EPA has classified acetochlor as a probable<br />
human carcinogen 2 .<br />
The aim of this study was to investigate the sorption and<br />
desorption of acetochlor in various types of natural sorbents<br />
(soils, bottom and river sediments). The attention was paid to<br />
the effect of soil/sediment properties on acetochlor sorption<br />
and desorption.<br />
Experimental<br />
C h e m i c a l s a n d S o r b e n t s<br />
Experiments were conducted with analytical grade acetochlor<br />
(purchased from Sigma Aldrich Kft.), a relatively<br />
non-polar compound (logK ow = <strong>2.</strong>5) with water solubility<br />
223 mg dm –3 at 20 °C 1 .<br />
Eight surface soils (denoted as A1–8) were collected<br />
from cultivated sites in Slovakia. Moreover, one soil collected<br />
from C horizon at the depth of 2 m (SS), three bottom<br />
sediments (BS1–3), and two river sediments (RS1–2) were<br />
used. Basic properties of the soils and sediments studied are<br />
shown in Table I.<br />
S o r p t i o n / D e s o r p t i o n E x p e r i m e n t s<br />
Sorption experiments were conducted using a batch<br />
equilibration method, with two initial concentrations of acetochlor<br />
used (1 and 10 mg dm –3 ). The acetochlor concentration<br />
in supernatant solutions after equilibration was measured<br />
using high performance liquid chromatography with ultraviolet<br />
detection (HPLC-UV) in the national Water Reference<br />
Laboratory for Slovakia (Bratislava).<br />
Desorption experiments followed immediately after<br />
the sorption experiments with an initial concentration of<br />
10 mg dm –3 .<br />
Results<br />
Sorption coefficients for acetochlor are given in Table II.<br />
TOC was found to be the main soil/sediment property correlating<br />
with the extent of acetochlor sorption (r = 0.774;<br />
P < 0.01). Strong affinity of acetochlor to soil organic matter<br />
was reported also by other researchers 2,3 .<br />
s527<br />
Table I<br />
Properties of soils and sediments used in the study<br />
TOC [%] C HA /C FA Clay [%] pH (H 2 O) CaCO 3 [%]<br />
A1 4.59 1.09 11.13 6.93 1.40<br />
A2 1.92 1.12 15.32 7.99 <strong>2.</strong>00<br />
A3 0.89 0.72 2<strong>2.</strong>08 6.76 0.30<br />
A4 <strong>2.</strong>49 1.07 9.08 7.86 1<strong>2.</strong>2<br />
A5 1.21 1.16 5.75 6.32 n.D.<br />
A6 1.19 1.53 11.00 7.96 <strong>2.</strong>74<br />
A7 0.48 0.90 0.60 5.76 0.20<br />
A8 1.57 1.12 37.20 6.11 n.D.<br />
SS 0.60 0.95 4.05 8.20 4.10<br />
RS1 <strong>2.</strong>46 0.42 <strong>2.</strong>16 7.17 0.30<br />
RS2 3.46 0.87 1.89 7.22 3.60<br />
BS1 3.05 0.89 6.41 7.56 3.80<br />
BS2 1.64 1.62 7.85 7.46 <strong>2.</strong>20<br />
BS3 6.39 0.78 <strong>2.</strong>03 6.45 n.D.<br />
The relationship between K d and total organic carbon<br />
content was improved after excluding the soil A8 from the<br />
data set (r = 0.902; P < 0.001). This could be explained by the<br />
significantly higher clay mineral content (especially smectites)<br />
of this soil as compared with other sorbents. Previous<br />
studies of the sorption of organic pollutants in soils have<br />
shown that in soils with the high clay mineral/organic matter<br />
ratio, the mineral fraction can play an important role in binding<br />
organic compounds such as pesticides 4 .<br />
The humic/fulvic acid ratio (C HA /C FA ) is one of the<br />
characteristics of the soil organic matter quality 5 . The results<br />
of this study showed a positive correlation between the<br />
K oc and the C HA /C FA ratio (r = 0.578; P < 0.05). Its signifi-<br />
Table II<br />
Sorption coefficients of acetochlor (Kd and Koc) and percentage<br />
of acetochlor desorbed (P des )<br />
Initial concentration Initial concentration<br />
C 0 = 1 mg dm –3 C 0 = 10 mg dm –3<br />
K d K oc K d K oc P des<br />
[dm 3 kg –1 ] [dm 3 kg –1 ] [dm 3 kg –1 ] [dm 3 kg –1 ] [%]<br />
A1 7.108 155 5.871 128 1<strong>2.</strong>0<br />
A2 3.248 169 <strong>2.</strong>537 132 27.9<br />
A3 1.358 152 1.036 116 37.5<br />
A4 3.406 137 <strong>2.</strong>635 106 19.1<br />
A5 <strong>2.</strong>109 174 1.551 128 35.6<br />
A6 3.344 281 <strong>2.</strong>999 252 23.0<br />
A7 1.018 212 0.840 175 34.3<br />
A8 6.265 399 5.145 328 27.7<br />
SS 1.062 177 0.918 153 41.0<br />
RS1 3.463 141 <strong>2.</strong>579 105 27.0<br />
RS2 4.218 122 3.353 97 2<strong>2.</strong>5<br />
BS1 3.020 99 3.081 101 26.4<br />
BS2 3.854 235 3.378 206 26.2<br />
BS3 6.577 103 5.491 86 16.0
Chem. Listy, 102, s265–s1311 (2008) Environmental Chemistry & Technology<br />
cance increased after excluding the soil A8 from the data set<br />
(r = 0.766; P < 0.01).<br />
The method of step-down multiple regression analysis<br />
was used to determine the soil properties significantly<br />
contributing to the overall acetochlor sorption. The soil A8<br />
appeared to have specific sorption properties, thus it wasn’t<br />
included in the analysis. The analysis yielded the following<br />
equations:<br />
K d = 1.043(TOC %) + 1.725(C HA /C FA )–0.777 (1)<br />
R 2 = 0.888; n = 12; P < 0.001; SE = 0.67<br />
K d = 0.891(TOC %) + 1.723(C HA /C FA )–1.011 (2)<br />
R 2 = 0.914; n = 12; P < 0.001; SE = 0.497<br />
The equations (1) and (2) were acquired when the<br />
results obtained at initial acetochlor concentrations of 1 and<br />
10 mg dm –3 were used, respectively. The K d of acetochlor<br />
was found to depend significantly on the total organic carbon<br />
content of the soil/sediment. The distribution of humus components<br />
expressed as the C HA /C FA ratio is also a significant<br />
factor influencing the acetochlor affinity to the sorbents.<br />
Desorption of acetochlor from all soils and sediments<br />
was less than the amount initially sorbed (Table II). Desorption<br />
extent is significantly (r = –0.81; P < 0.01) influenced by<br />
total organic carbon content, with greater organic carbon contents<br />
reducing the desorption. Significant inverse correlations<br />
were also found between the humic components (C HA and<br />
s528<br />
C FA ) and P des , but no other significant correlations between<br />
P des and soil/sediment properties were observed.<br />
Conclusions<br />
Organic matter appears to be the main sorbent constituent<br />
responsible for acetochlor retention in soils/sediments,<br />
with both quantitative and qualitative parameters playing<br />
important role in its ability to bind acetochlor. The specific<br />
appearance of the clay-rich soil A8 in whole analysis implies<br />
that mineral surfaces can also significantly contribute to acetochlor<br />
immobilization under favourable conditions.<br />
This work has been supported by VEGA projects No.<br />
1/4036/07 and No 1/4047/07. We would like to acknowledge<br />
the Water Research Institute Bratislava.<br />
REFEREnCES<br />
1. Tomlin C. D. S.: The e-pesticide manual, 12 th ed. CD-<br />
ROM form, Version <strong>2.</strong>0. British Crop Protection Council<br />
2001.<br />
<strong>2.</strong> Ye C.: Bull. Environ. Contam. Toxicol. 71, 919 (2003).<br />
3. Ferri M. V. W., Gomes J., Dick D. P., de Souza R. F.,<br />
Vidal R. A.: Rev. Bras. Ci. Solo 29, 705 (2005).<br />
4. Sheng G., Johnston C. T., Teppen B. J., Boyd S. A.: J.<br />
Agric. Food Chem. 49, 2899 (2001).<br />
5. Dousset S., Mouvet C., Schiavon M.: Chemosphere 28,<br />
467 (1994).
Chem. Listy, 102, s265–s1311 (2008) Environmental Chemistry & Technology<br />
P94 ECOTOxICOLOGICAL EVALuATION OF<br />
ThE SLuDGES FROM wASTE wATER<br />
TREATMENT PLANTS<br />
HELEnA ZLáMALOVá GARGOŠOVá, LUCIE<br />
HELLInGEROVá and MILADA VáVROVá<br />
Institute of Chemistry and Technology of Environmental Protection,<br />
Faculty of Chemistry, Brno University of Technology,<br />
Purkyňova 118, 612 00 Brno, Czech Republic,<br />
zlamalova@fch.vutbr.cz<br />
Introduction<br />
The tendency to improve the water quality in the Czech<br />
Republic is linked with building up new waste water treatment<br />
plants (WWTP), what results in growing production of<br />
sewage sludges. Multi-purpose way for efficient utilization or<br />
sludge disposal hasn’t existed till now.<br />
Sewage sludges are very rich in nutrients and organic<br />
matter. This makes the spreading of this kind of waste on<br />
land as a fertilizer or an organic soil improver very suitable.<br />
Unfortunately, the sludge tends to concentrate heavy metals<br />
and organic compounds present in waste waters. The Sewage<br />
Sludge Directive (86/278/EEC) regulates sludge use in such<br />
way to prevent harmful effects on soil, vegetation, animals<br />
and man. In the Czech Republic almost one third of sewage<br />
sludges ends as a waste; this could be hazardeous. In Europe<br />
hazardous wastes are classified by 14 criteria including<br />
ecotoxicity (H 14). Environmental ecotoxicology deals with<br />
the potentially harmful effects of chemicals and wastes on<br />
organisms. For this purpose various testing organisms and<br />
various type of bioassays are used.<br />
The aim of our study was the ecotoxicological testing of<br />
sewage sludges from different waste water treatment plants<br />
by selected ecotoxicity tests with respect to their intended<br />
use. We used following organisms: crustacea Daphnia magna<br />
and Thamnocephalus platyurus and seeds of terrestrial plant<br />
Sinapis alba. The values of 24h-LC50 and 48h-LC50 obtained<br />
for Thamnocephalus platyurus and Daphnia magna and<br />
72h-IC50 values gained for Sinapis alba are the basic data for<br />
the ecotoxicological assessment of the sewage sludges and<br />
for their classification following the Czech legislation 1,2 .<br />
Experimental<br />
Samples of sewage sludges from high-capacity municipal<br />
WWTP, situated in Brno, Modřice and from small WWTP<br />
in Veterinary and Pharmaceutical University Brno were<br />
evaluated. From WWTP Brno, Modřice following sewage<br />
sludges were tested:<br />
•<br />
•<br />
•<br />
anaerobic stabilized sewage sludges (AS)<br />
dewatered anaerobic stabilized sewage sludges<br />
(DWAS)<br />
dessicated anaerobic stabilized sewage sludges (DSAS)<br />
From local WWTP in Veterinary and Pharmaceutical<br />
University Brno primary sludges were tested (PS).<br />
s529<br />
S a m p l e s P r e p a r a t i o n<br />
All samples were collected in pure plastic bottle and untill<br />
testing stored in the dark at 4 °C for less than four days prior<br />
the bioassay experiment. Samples were dried at temperature<br />
105 ± 5 °C and sludge dry residue was determinated gravimetrically.<br />
Two types of water leaches were prepared from<br />
studied sewage sludges. The first batch of samples was prepared<br />
in accordance with Czech legislation; the samples were<br />
mixed in ratio 1 : 10 (sludge dry residue: deionised water).<br />
The second one was diluted with deionised water to have<br />
the same dry matter content as anaerobic stabilized sewage<br />
sludges from WWTP Modřice (3.89 %). Sample tubes filled<br />
with defined quantity of sample and water were shaken at<br />
5–10 rpm (revolutions per minute) for 24 hour at temperature<br />
15–25 °C. After centrifugation the leaches supernatants were<br />
removed and filtered using paper filter (5 μm). To assure suitable<br />
surroundings for each testing organism the supernatants<br />
were enriched by adding specific amounts of salts following<br />
OECD Guidelines 3,4 .<br />
P r i n c i p l e o f E c o t o x i c o l o g i c a l<br />
T e s t s<br />
The general principle of ecotoxicological tests is the<br />
determination of effective concentration (EC50), eventually<br />
lethal concentration (LC50) or inhibition concentration<br />
(IC50). These concentrations of tested compound (substance,<br />
sewage water or leaches of sewage sludges) cause the mortality<br />
of 50 % of testing organisms or 50% inhibition of growth<br />
rate in relation to control tests. The organisms are exposed<br />
to the test substance for a period of 24, 48, and 72 hours in<br />
agreement with requirements of a given test. At least five<br />
test concentrations should be used. A stepwise procedure<br />
involves three steps: the preliminary test, the confirmatory<br />
test and the definitive test. The confirmatory test confirms or<br />
disconfirms results of limit test. In preliminary test undiluted<br />
sewage sludges leaches are used. If results of preliminary<br />
test indicate possible ecotoxicity the definitive test follows.<br />
The highest concentration in definitive test should preferably<br />
result in 100% immobilization (mortality or inhibition) and<br />
the lowest concentration tested should preferably give no<br />
observable effect.<br />
A p p l i c a t i o n o f E c o t o x i c i t y T e s t s<br />
f o r S e w a g e S l u d g e s E v a l u a t i o n<br />
Testing organisms (Daphnia magna, Thamnocephalus<br />
platyurus, Sinapis alba.) were used in preliminary test with<br />
raw water sewage leaches (WSL) and in definitive tests with<br />
various testing concentrations of WSL; 50, 100, 200, 500,<br />
700 ml dm –3 . Under the same conditions tests with control<br />
group of the same organisms in standard freshwater but<br />
without WSL were conducted.<br />
The Daphtoxkit FTM makes use of the dormant eggs<br />
of the crustaceans Daphnia magna, which are protected by<br />
chitinous capsule called ephippium. Ephipia can be stored<br />
for long time without losing their viability. When the testing<br />
organisms are needed it is necessary to put chitinous capsule
Chem. Listy, 102, s265–s1311 (2008) Environmental Chemistry & Technology<br />
into specific environmental conditions and during period of<br />
about 3 days testing organisms are ready for use. Daphnids<br />
aged less than 24 were exposed to the sewage leaching at<br />
a range of concentrations 50, 100, 200, 500, 700 ml dm –3 in<br />
definitive tests for a period of 24 and 48 hours at 20–22 °C<br />
and light intensity of 6,000 lux. Immobilization was recorded<br />
at 24 hours and 48 hours and compared with control values.<br />
The results were analyzed in order to calculate the EC50 at 24<br />
and 48 h. Determination of the EC50 at 24 h is optional.<br />
The Thamnotoxkit FTM uses the testing organism Thamnocephalus<br />
platyurus, aged less than 24 hours. The exposition<br />
was 24 h at a range of the same concentrations at 20–22 °C<br />
and 4,000 lux. The obtained results were analysed and the<br />
values LC50 at 24 h were calculated. Two above mentioned<br />
tests are alternative tests, whilst the test on Sinapis alba represents<br />
standard phytotoxicity test. This root growth inhibition<br />
toxicity test was used as a standard OECD test. The high quality<br />
seeds of Sinapis alba were exposed for 78 hours to tested<br />
solution, at temperature 20 ± 2 °C in the dark. After 78 hours<br />
the lengths of hypocotyls of seeds in tested and in control<br />
group were measured and values of IC50 were evaluated.<br />
For a validation of test it is necessary to apply the following<br />
performance criteria; Daphnotoxkit FTM and Thamnotoxkit<br />
FTM – number of dead and immobile organisms should not<br />
exceeded 10 % in control. In root growth inhibition toxicity<br />
test germinability should be more than 90 %.<br />
Results<br />
On the base of the analysis of obtained ecotoxicological<br />
data the values of EC50, LC50 and IC50 were evaluated<br />
for various samples of sewage sludges. These values made<br />
possible the evaluation of sludges ecotoxicity and also facilitated<br />
their categorization from the point of view of the leacha-<br />
Table I<br />
The ecotoxicity of sewage sludges and their classification<br />
24h-EC50 or<br />
Sewages<br />
sludges 24h-LC50<br />
[ml dm –3 ]<br />
Class of<br />
leachability<br />
AS 2<strong>2.</strong>81 III<br />
DWAS 39.57 II<br />
DSAS 139.64 III<br />
PS 38.17 III<br />
s530<br />
Fig. 1. Comparison of ecotoxicity of tested sewage sludges using<br />
testing organisms Thamnocephalus platyurus<br />
bility. Table I summarizes values of 24h-EC50 or 24h-LC50<br />
for the most sensitive testing organisms, which form the basis<br />
for evaluation and categorization of sewage sludges.<br />
Conclusions<br />
Different sewage sludges were tested in respect to their<br />
possible hazardous characteristic - ecotoxicity. On the bases<br />
of obtained results sewage sludges were classified in term<br />
of their leachability. no sample of sewage sludge exhibit<br />
ecotoxicity following the Czech legislation.<br />
This work has been supported by grant COST, action<br />
636, project No. OC-183.<br />
REFEREnCES<br />
1. Wilke, B. M., Riepert, F., Christiane Koch., Kühne, T.:<br />
Ecotoxicol. Environ. Saf., 70, 283 (2008).<br />
<strong>2.</strong> Kubík, V., Hofman, J., Holoubek, I.: Abstract Book<br />
of SETAC Europe the 16th Annual Meeting. Hague,<br />
netherlands: SETAC, 2006. p. 79. 7.5.2006, Hague, The<br />
netherlands., Issue 2, June 2008, pp 283<br />
3. OECD Environmnetal health and Safety Publications:<br />
OECD Guidelines for Testing Chemicals no. 202<br />
(2004).<br />
4. OECD Environmnetal health and Safety Publications:<br />
OECD Guidelines for Testing Chemicals no. 208<br />
(2006).
Chem. Listy, 102, s265–s1311 (2008) Environmental Chemistry & Technology<br />
P95 MICROwAVE DESuLPhuRIZATION OF COAL<br />
InGRID ZnAMEnáČKOVá, MICHAL LOVáS, SILVIA<br />
ČUVAnOVá and ŠTEFAn JAKABSKý<br />
Institute of Geotechnics, SAS, Watsonova 45, 043 53 Košice,<br />
Slovakia,<br />
znamenackova@saske.sk<br />
Introduction<br />
Microwave heating has been used in several studies of<br />
the coal desulfurization. Desulphurization by microwaves is<br />
closely related to the form of sulphur compound in the coal,<br />
the physical and chemical structure, as well as the chemical<br />
activity of the leachant. The ability of molten naOH to desulfurize<br />
the coal has been known for more than three decades.<br />
The process known as molten caustic leaching (MCL) was<br />
tested for the first time in the USA. The objective was the<br />
removing of the mineral components, pyritic and organic sulfur<br />
by the reaction of coal with a mixture of molten sodium<br />
and potassium hydroxides. The MCL process was effectively<br />
applied for the treatment of the Slovak brown coal 1 . Balaz<br />
et al. reported the use of simultaneous grinding and alkaline<br />
chemical leaching process (GACL) on brown coal and found<br />
that more than 41 % of total sulphur reduction was achieved.<br />
Magnetic methods of mineral removal from coal depend<br />
on the difference in the magnetic moment associated with<br />
mineral particles and coal. The microwave heating enhances<br />
the magnetic susceptibility of the iron mineral, thus rendering<br />
it more amenable to the magnetic separation. The effect of<br />
microwave heating on magnetic processing of the pyrite was<br />
investigated 2 , where different size fractions of the pyrite<br />
were heated in a microwave oven at <strong>2.</strong>45 GHz frequency<br />
and different power levels. Ability of coal desulfurization by<br />
magnetic separation following microwave heating was also<br />
investigated 3 . The microwaves were found as an effective<br />
method to selective heating of pyrite in the coal causing the<br />
formation of pyrrhotite. It was stated that pyrrhotite could be<br />
removed by low-intensity magnetic separation. 4–6<br />
Experimental<br />
C o a l S a m p l e C h a r a c t e r i z a t i o n<br />
In this study, five different coal samples were used. They<br />
were ground to less than 3 mm and the representative samples<br />
were prepared. The results of analyses of the total sulphur<br />
content are listed in Table I.<br />
M i c r o w a v e a n d C l a s s i c a l H e a t i n g<br />
The microwave heating of investigated coal samples<br />
was realized in the microwave oven Whirlpool AVM 434<br />
and Panasonic nn 5251 B with maximum power of 900 W,<br />
adjusted for the laboratory purposes for continuos temperature<br />
measuring of heated material. The temperature was measured<br />
using the contactless thermometer Raynger MX4 in the<br />
range 30–900 °C. The classical heating of coal in the mufle<br />
oven was realized as well.<br />
s531<br />
Table I<br />
Total sulphur content in the coal samples<br />
Locality Grain size [mm] S tot [%]<br />
Handlová (SR) –3 1.5<br />
nováky (SR) –3 3.0<br />
Cígeľ (SR) –3 <strong>2.</strong>27<br />
1–3 5.35<br />
Sokolov (CR) 0.07–0.5 6.85<br />
–0.07 7.52<br />
1–3 0.5<br />
0.5–1 0.5<br />
Donbas (R) 0.2–0.5 0.49<br />
0.07–0.2 0.53<br />
–0.07 0.52<br />
M a g n e t i c S e p a r a t i o n<br />
The magnetic separation of the coal samples was carried<br />
out by means of a roll-type electromagnetic separator Mechanobr,<br />
type 138 T-SEM, intended for dry separation.<br />
M i c r o w a v e R a d i a t i o n a n d M o l t e n<br />
C a u s t i c L e a c h i n g – R M C L<br />
A mixture of 15 g coal + 15 g naOH + 10 ml H 2 O was<br />
used as an input to microwave oven operating in nitrogen<br />
atmosphere. Microwave desulphurizastion of coal was realised<br />
according to the Scheme 1.<br />
Scheme 1<br />
The RMCL (Radiation and Molten Caustic Leaching)<br />
desulphurization of coal<br />
Results<br />
M a g n e t i c S e p a r a t i o n o f C o a l<br />
Coal sample of the grain size 0.05–0.2 mm was heated<br />
before magnetic separation in the microwave oven for<br />
10 minutes at the power 900 W and frequency <strong>2.</strong>45 GHz. The<br />
results of the magnetic separation after microwave radiation<br />
are listed in Table II.<br />
The magnetic separation of the coal sample was ineffective<br />
for our conditions.<br />
T h e M o l t e n C a u s t i c L e a c h i n g o f<br />
C o a l<br />
Effect of ratio of NaOh and coal<br />
The effect of ratio of naOH and coal from the Cígeľ<br />
locality after the microwave radiation (<strong>2.</strong>5 minutes) on reduction<br />
of the total sulphur content is displayed in Fig. 1.
Chem. Listy, 102, s265–s1311 (2008) Environmental Chemistry & Technology<br />
Table II<br />
The results of coal magnetic separation after the microwave<br />
radiation<br />
Grain Magnetic Mass yield of Recovery of<br />
size induction magnetic S pyr in mag.<br />
[mm] [T] product [%] prod. [%]<br />
0.13 4.32 39.6<br />
0.24 4.72 43.2<br />
0.05–0.2 0.42 10.80 44.7<br />
0.51 11.54 45.5<br />
Fig. 1. The influence of ratio of NaOH and coal on the total<br />
sulphur content in coal sample (Cígeľ) after RMCL process, Socontent<br />
of sulphur basic sample<br />
From the obtained results, it is possible to state, that<br />
80 % of the total sulphur content is possible to remove by<br />
ratio of naOH : coal = 3 : 1.<br />
Effect of reaction time<br />
The time dependence of microwave heating on decrease<br />
of the total sulphur content in coal from the Cígeľ locality<br />
by ratio of naOH : coal = 1 : 1 is displayed in Fig. <strong>2.</strong> The sulfur<br />
removal increased to 76 % within 5 minutes and reached<br />
85 % at 10 minutes, but after 10 minutes, the change was not<br />
significant.<br />
The total sulphur content decreased from <strong>2.</strong>27 % to 1.0 %<br />
(56 %) in the mufle oven at the temperature 380 °C (within<br />
reaction time 40 minutes). The main difference between the<br />
Fig. <strong>2.</strong> The change of total sulphur content of the coal samples<br />
with time<br />
s532<br />
thermal and microwave heating was the extremely short time<br />
for desulphurization in the case of microwave experiments.<br />
Effect of the coal deposits<br />
The dependence of sulphur content in the coal samples<br />
from the localities Cígeľ, Handlová, nováky in RMCL proces<br />
is displayed in Fig. 3. The conditions of the microwave<br />
heating were following: temperature 380–400 °C, time 3<br />
minutes, the ratio of naOH : coal = 1 : 1.<br />
It can be seen, that the effect of microwave pretreatment<br />
on reduction of the total sulfur content in samples from<br />
nováky and Cígeľ (52–56 %) is higher than in sample from<br />
Handlová (28 %).<br />
Fig. 3. RMCL for coal samples from Handlová, Nováky, Cígeľ<br />
Effect of the particle size<br />
The influence of particle size on chemical desulfurization<br />
process was also studied. The representative samples<br />
were divided in fractions of 1–3, 0.5–1, 0.07–0.5, < 0.07 mm<br />
and microwave heating of samples from Donbas (500 W and<br />
6 minutes) and Sokolov (750 W and 3 minutes) was realized.<br />
The results are given in Figs. 4. and 5.<br />
The decrease about 25 % of the total sulphur content<br />
was in the sample from Sokolov eminent. The influence of<br />
graine size was negligible.<br />
The decrease about 35 % of the total sulphur content in<br />
black coal from Donbas locality for graine size 1–3 mm was<br />
observed.<br />
Fig. 4. The decrease of the total sulphur content in sample from<br />
Sokolov versus different size fraction in RMCL process
Chem. Listy, 102, s265–s1311 (2008) Environmental Chemistry & Technology<br />
Fig. 5. The decrease of the total sulphur content in sample from<br />
Donbas versus different size fraction in RMCL process<br />
Conclusions<br />
Microwave heating of the coal is advantageous for the<br />
subsequent desulphurization. Conventional procedure of<br />
coal desulphurization requires heating period about 40 minutes<br />
and microwave procedures reduces this heating period<br />
s533<br />
for a few minutes. The use of microwave radiation for the<br />
desulphurisation of coal displays potential and may be soon a<br />
commercial reality. This would allow the use of high sulphur<br />
coals in an environmentally and economically sound way.<br />
This work was supported by the Slovak Research and<br />
Development Agency under the contract No. APVV-51-<br />
035505.<br />
REFEREnCES<br />
1. Balaz, P., LaCount, R. B., Kern, D. G., Turcaniova, L:<br />
Fuel 2001, 80.<br />
<strong>2.</strong> Uslu U, Atalay A. I. Arol A I: Colloids Surf. A, Physicochem.<br />
Eng. Asp. 225, 1 (2003).<br />
3. Uslu U, Atalay A: Fuel Process. Technol. 85, 1 (2004).<br />
4. Jorjani, E., Rezai, B., Vossoughi, M., Osanloo, M: Fuel<br />
83, 7 (2004).<br />
5. Kingman S. W., Rowson n. A.: Min. Eng. 11, 11<br />
(1998).<br />
6. Kingman S. W., Rowson n. A.: J. Microwave Power<br />
Electromagn. Energ. 35, 3 (2000).
Chem. Listy, 102, s265–s1311 (2008) Environmental Chemistry & Technology<br />
P96 ThE bIOLOGICAL ACTIVITy OF 16α(H)-<br />
PhyLLOCLADANE ISOLATED FROM<br />
SLOVAK bROwN COAL<br />
AnTOn ZUBRIK a , AnDREA LAUKOVá b , ALEnA<br />
GáBELOVá c , ZUZAnA VALOVIČOVá c , ľUDMILA<br />
TURČánIOVá a and JOSEF CVAČKA d<br />
a Institute of Geotechnics, Slovak Academy of Sciences, Watsonova<br />
45, 043 53 Košice, Slovakia,<br />
b Institute of Animal Physiology, Slovak Academy of Sciences,<br />
Šoltésovej 4–6, 040 01 Košice, Slovakia,<br />
c Cancer Research Institute, Slovak Academy of Sciences,<br />
Vlárska 7, 833 91, Bratislava, Slovakia,<br />
d Institute of Organic Chemistry and Biochemistry v.v.i., Academy<br />
of Sciences of the Czech Republic,<br />
Flemingovo nám. 2, 166 10 Prague 6, Czech Republic,<br />
zubant@saske.sk<br />
Introduction<br />
The coal research brings novel opportunities for nonfuel<br />
utilization. One of the promising ways is extraction and<br />
isolation of organic compounds (diterpenes, humic acids)<br />
with potential biological activity. The Slovak coals (nováky<br />
lignite and Handlová brown coal) contain high amounts of<br />
tetracyclic diterpene hydrocarbons 1,2 , which can be valuable<br />
precursors for pharmaceutical products. Kauranes and phyllocladanes<br />
are important diastereoisomeric tetracyclic diterpene<br />
biomarkers. Tetracyclic diterpene derivates isolated<br />
from plants show a strong biological activity and they are<br />
active components of many plant medicaments and extracts<br />
used in folk medicine. Kauranes exhibit an anti-microbial,<br />
anti-HIV, anti-inflamatory, anti-fertility, antiparasitic, insect<br />
anti-feedant, antifungal and cytotoxic activities 3 . Phyllocladanes<br />
are very rare in the nature; nevertheless, they were<br />
also identified and isolated from several plants. Orizaterpenol<br />
(phylloklad-15-en-6β,14βdiol) from the rice hull of Oryza<br />
sativa shows cytotoxicity against murine leukemia cells 4 .<br />
The use of phyllocladane diterpenoids for plant growth promotion<br />
and/or retardation is already patented 5 .<br />
The biological activity of tetracyclic diterpenoids isolated<br />
from the geological samples has not been studied yet,<br />
therefore the main goal of our work was to isolate tetracyclic<br />
diterpane from the coal and test its biological activity in<br />
vitro.<br />
Experimental<br />
I s o l a t i o n o f 1 6 α ( H ) - P h y l l o c l a d a n e<br />
f r o m S l o v a k B r o w n C o a l<br />
The brown coal (50 kg) was collected in several places<br />
of the Handlová mining area (Fig. 1.) and a representative<br />
sample was obtained by quartation.<br />
Before the extraction; the Slovak brown coal from Handlová<br />
was physically treated on hydrocyclone 7 to obtain<br />
quality carbon product with A d (ash content) = 7.70 % wt.,<br />
W a (moisture) = 1<strong>2.</strong>26 % wt., C d = 61.6 %, H d = 5.6 %,<br />
n d = 0.7 %, S d = 1.2 %, O d = 23.2 %. Further, the coal (20 g)<br />
s534<br />
Fig. 1. The situation map of Handlová-Nováky coal basin with<br />
Handlová mining area in central part of Slovakia (adapted from<br />
ref. 6 )<br />
was extracted with dichloromethane (250 ml) in microwave<br />
oven (Wirlpool AVM 434, 500 W, <strong>2.</strong>45 GHz) in distilling<br />
flask with reversing reflux system (20 min). After the extraction,<br />
the mixture was filtered and the solvent was evaporated.<br />
The crude extract (367 mg) was re-extracted on SPE column<br />
(Chromabond SiOH, Macharey – nagel GmbH + Co. KG)<br />
with n-hexane (100 ml). The solvent was evaporated and<br />
the purified SPE extract (112 mg) was further separated by<br />
column chromatography on silica gel (5 g of Kieselgel 60,<br />
granularity 0.06 – 0.2 mm, Carl Roth GmbH + Co. KG) with<br />
4 × 20 ml of hexane to four fractions denominated as F1–F4.<br />
All fractions were analyzed by TLC and GC/MS. 16α(H)phyllocladane<br />
was found in the F1 fraction. TLC analysis<br />
of F1 showed presence of a single spot with R F = 0.91, that<br />
contained three compounds: the most abundant component<br />
(81.6 %) was 16α(H)-phyllocladane; second one was isopimarane<br />
(11.2 %) and finally 18-norisopimarane (3.9 %).<br />
Unambiguous identification as 16α(H)-phyllocladane was<br />
achieved by coinjection of the sample and standards in the<br />
laboratory of Prof. Bernd Simoneit (Oregon State University,<br />
USA). The final isolate (36.7 mg) named as TD1 containing<br />
81.6 % of 16α(H)-phyllocladane was used for further biological<br />
tests.<br />
B a c t e r i a l S t r a i n s<br />
All tested Gram + and Gram – bacteria (Enterococcus spp.,<br />
β-hemolytic streptococci, Staphylococcus aureus CCM 3953,<br />
S. aureus SA5, Listeria innocua LMG 13568 Enterobacter<br />
cloacae 5139, 19259, 4417, Klebsiella pneumoniae 1962,<br />
12506, 5182, 1366, Serratia marcescens 19194, Salmonella<br />
enterica serovar Duesseldorf SA31, S. enterica ser. enteritidis<br />
PT4, Shewanella putrefaciens, E. coli K88, E. coli 6295,<br />
5765) were of human or veterinary origin (isolated from the<br />
various wounds, blood, sputum and faeces). The strains were<br />
maintained on the appropriate selective media according to<br />
ISO.
Chem. Listy, 102, s265–s1311 (2008) Environmental Chemistry & Technology<br />
S p o t T e s t<br />
The antimicrobial activity was determined by the diffusion<br />
agar spot test 8 . For the testing, TD1 was dissolved<br />
in n-hexane and the various concentration ranges of TD1<br />
(600 mg ml –1 ; 300 mg ml –1 ; 150 mg ml –1 ; 75 mg ml –1 ) and<br />
several volume doses were used; 5 μl is optimal dosage to<br />
test on solid agar containing the indicator strain. The solvent<br />
n-hexane was used as a control. After 24 hours of incubation<br />
at 37 °C, the inhibitory zones were evaluated. MICs (minimal<br />
inhibitory concentrations) were expressed as the lowest<br />
concentration of TD1 inhibiting the growth of the indicator<br />
bacteria (mg ml –1 ).<br />
C e l l L i n e<br />
The human hepatoma cell line HepG2 was generously<br />
provided by Prof. Andrew R. Collins (University of Oslo,<br />
norway). HepG2 cells were maintained in William´s modified<br />
medium supplemented with 10% fetal calf serum and<br />
antibiotics (penicillin 200 U ml –1 , streptomycin and kanamycin<br />
100 µg ml –1 ) at 37 ºC in humidified 5% CO 2 atmosphere.<br />
C e l l T r e a t m e n t<br />
Hep G2 cells were grown for 48 h until semi-confluency,<br />
prior to exposition to TD1 and positive control. TD1 was dissolved<br />
in ethanol at 40 ºC freshly before use and added to culture<br />
medium to reach the final concentrations ranging from<br />
0.045 to 0.5 mg ml –1 for 24 hours. The concentration of the<br />
solvent never exceeded 0.1 %. Control cells were exposed<br />
to 0.1% ethanol. Cells were exposed to hydrogen peroxide<br />
(150 µM), the positive control, on ice in dark for 5 minutes.<br />
S i n g l e C e l l G e l E l e c t r o p h o r e s i s<br />
( S C G E )<br />
The procedure of Singh et al. 9 , modified by Collins et<br />
al. 10 and Slameňová et al. 11 was followed. The data were evaluated<br />
statistically by the Student’s t-test.<br />
Results and Discussion<br />
The details of isolation and structure elucidation of<br />
16α(H)-phyllocladane (Fig. <strong>2.</strong>) was published previously 2,12 .<br />
Fig. <strong>2.</strong> The structure of 16α(H)-phyllocladane<br />
A n t i m i c r o b i a l A c t i v i t y<br />
TD1 inhibited the growth of 3 Gram – bacteria (Kl. pneumoniae<br />
5182, 1366; E. coli 5765) among 19 tested strains.<br />
MIC value for these strains is 300 mg ml –1 . Others tested bacteria<br />
were not sensitive to TD1. The antibacterial activity of<br />
s535<br />
tetracyclic diterpene (ent-kauren-19-oic acid) was detected<br />
particularly against Gram + bacteria 13 . In our case, this is the<br />
primary and first unique result associated with inhibitory activity<br />
of phyllocladane against Gram - , pathogenic bacteria such<br />
as Klebsiella spp. It is necessary to note that for the further<br />
practical usage, the selectivity of the potential pharmaceutical<br />
compound is one of the principal conditions.<br />
G e n o t o x i c i t y<br />
Based on previous cytotoxicity experiments (data not<br />
shown), the genotoxic activity of TD1 was evaluated at concentrations<br />
0.045–0.5 mg ml –1 (Fig. 3.). In general, only a<br />
weak cytotoxicity (~ 20%) was determined at these highest<br />
concentrations.<br />
A linear dose dependent increase of DnA migration was<br />
detected in TD1-exposed cells (r 2 = 0.8732). A mild but statistically<br />
significant increase of DnA damage was found at<br />
concentrations 0.25–0.5 mg ml –1 (p < 0.05–0.01). There are<br />
limited data concerning the toxicity of phyllocladane-type<br />
diterpenes. Recently, Chung et al. 4 reported a strong cytotoxicity<br />
of orizaterpenol in P388cells.<br />
Fig. 3. The level of DNA damage induced by TD1 in hepG2<br />
cells. Cells were exposed to various concentrations of TD1 for<br />
24 hours. ‡ – positive control – h 2 O 2 (0.15 mM). Significantly<br />
different from control cells determined by Student’s t-test, *<br />
p < 0.05, **p < 0.01 and ***p < 0.001<br />
Conclusions<br />
Biological activity of TD1 (containing 81.4 % of 16α(H)phyllocladane)<br />
from Handlová brown coal was assayed in<br />
vitro using pathogenic bacteria and the human hepatoma cell<br />
line HepG<strong>2.</strong> The selective antimicrobial effect against Gram -<br />
strains of Kl. pneumoniae 5182, 1366, E. coli 5765 was determined<br />
with MIC up to 300 mg ml –1 . In addition, TD1 induced<br />
DnA damage in human tumor cell line HepG2 without strong<br />
cytotoxicity. Further search for biological active compounds<br />
from Slovak coal and others biological tests will be carried<br />
out.<br />
This work was supported by the Slovak Research and<br />
Development Agency under the contracts APVV-51-035505;
Chem. Listy, 102, s265–s1311 (2008) Environmental Chemistry & Technology<br />
SK-CZ-0097-07, the Slovak Grant Agency for Science VEGA<br />
(2/7163/27), the Ministry of Education, Youth and Sports of<br />
the Czech Republic (MEB 080863) and Academy of Sciences<br />
of the Czech Republic (Research project Z40550506). Tested<br />
bacteria were isolated at IAP SAS, Laboratory of Animal<br />
Microbiology, Košice, Slovakia and kindly supplied by Dr.<br />
Vasilková (PI, SAS Košice, Slovakia), Dr. Líšková (Hospital<br />
in Nitra, Slovakia), Dr. Šišák, (IVM, Brno, Czech Republic),<br />
prof. De Vuyst (University Brussel, Belgium).<br />
REFEREnCES<br />
1. Streibl M., Kristín M., Krupčík J. Stránsky K.: An.<br />
Quim. 68, 879 (1972).<br />
<strong>2.</strong> Zubrik A.: Dissertation. Institute of Geotechnics of Slovak<br />
Academy of Sciences, Košice, Slovakia, 2007.<br />
3. Guisalberti E. L.: Fitoterapia 68, 303 (1997).<br />
4. Chung I. M., Ali M., Hahn S. J., Siddiqui n. A., Lim Y.<br />
H., Ahmad A.: Chem. nat. Compd. 41, 182 (2005).<br />
5. Singh A. K., Bagchi G. D., Singh S., Dwivedi P. D.,<br />
Gupta A. K., Khanuja S. P. S.: USP 6673749 (2004).<br />
s536<br />
6. Machájová Z., Verbich F., Sýkorová I.: Acta Montanistica<br />
Slovaca 5, 261 (2000).<br />
7. Hredzák S.: Gospodarka Surowcami Mineralnymi 15,<br />
221 (1999).<br />
8. De Vuyst L., Callewaert R., Pot B.: Syst. Appl. Microbiol.<br />
19, 9 (1996).<br />
9. Singh n. P., McCoy M. T., Tice R. R., Schneider E. L.:<br />
Exp. Cell Res. 175, 184 (1988).<br />
10. Collins A. R., Duthie S. J., Dobson V. L.: Carcinogenesis<br />
14, 1733 (1993).<br />
11. Slameňová D., Gábelová A., Ružeková L., Chalupa I.,<br />
Horváthová E., Farkašová T., Bozsakyová E., Stetina R.:<br />
Mutat. Res. 383, 243 (1997).<br />
1<strong>2.</strong> Zubrik A., Šaman D., Vašíčkova S., Simoneit B. R. T.,<br />
Turčániová ľ., Lovás M., Cvačka J.: Organic Geochemistry<br />
(submitted).<br />
13. Mendoza L., Wilkens M., Urzúa A.: J. Ethnopharmacol.<br />
58, 85 (1997).


