Part 3 - Metro Gold Line Foothill Extension
Part 3 - Metro Gold Line Foothill Extension
Part 3 - Metro Gold Line Foothill Extension

You also want an ePaper? Increase the reach of your titles
YUMPU automatically turns print PDFs into web optimized ePapers that Google loves.
Noise and Vibration Technical Report: <strong>Metro</strong> <strong>Gold</strong> <strong>Line</strong> <strong>Foothill</strong> <strong>Extension</strong>, Azusa to Montclair<br />
July 2012<br />
Page 80<br />
• Noise Barriers – This is a common approach to reduce noise impacts from surface transportation<br />
sources. The primary requirements for an effective noise barrier are (1) the barrier must be high<br />
enough and long enough to break the line-of-sight between the sound source and the receiver; (2) the<br />
barrier must be of an impervious material with a minimum surface density of 4 lb/sq. ft.; and (3) the<br />
barrier must not have any gaps or holes between the panels or at the bottom. Because numerous<br />
materials meet these requirements, the selection of materials for noise barriers is usually dictated by<br />
aesthetics, durability, cost, and maintenance considerations.<br />
• Building Sound Insulation – Sound insulation of residences and institutional buildings improve the<br />
outdoor-to-indoor noise reduction. Although this approach has no effect on noise in exterior areas, it<br />
may be the best choice for sites where noise barriers are not feasible or desirable, for buildings where<br />
indoor sensitivity is of most concern, or where the horn noise dominates the noise environment.<br />
Substantial improvements in building sound insulation (approximately 5 to 10 dBA) can often be<br />
achieved by adding an extra layer of glazing to the windows, by sealing any holes in exterior surfaces<br />
that act as sound leaks, and by providing forced ventilation and air-conditioning so windows do not<br />
need to be opened for ventilation.<br />
• Train Horns – The Federal Railroad Administration (FRA) regulations require all trains operating on<br />
the national rail system to sound horns as they approach an at-grade rail/roadway crossing. In 2005,<br />
the FRA finalized a horn rule that provides the opportunity to mitigate the effects of train horn noise<br />
by establishing “quiet zones.” The FRA may grant a quiet zone if the affected jurisdiction agrees to<br />
implement supplemental safety measures such as four quadrant gates. If the application is approved,<br />
freight trains are not required to sound their horns as they approach at-grade crossings.<br />
Impact predictions and proposed mitigation are based on October 2011 designs that are subject to further<br />
design refinement. During Final Design, data that affects the impact predictions may change, such as the<br />
precise locations and grade of rails, switch locations, and the placement of grade crossing warning<br />
devices. Accordingly, the impacts and mitigation measures are subject to refinement as well. In particular,<br />
the heights of the sound walls and locations where sound insulation is recommended will change if quiet<br />
zones are approved by the FRA for at-grade crossings.<br />
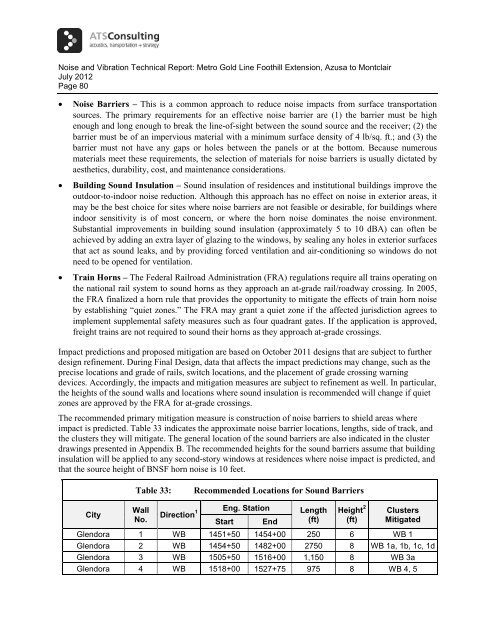
The recommended primary mitigation measure is construction of noise barriers to shield areas where<br />
impact is predicted. Table 33 indicates the approximate noise barrier locations, lengths, side of track, and<br />
the clusters they will mitigate. The general location of the sound barriers are also indicated in the cluster<br />
drawings presented in Appendix B. The recommended heights for the sound barriers assume that building<br />
insulation will be applied to any second-story windows at residences where noise impact is predicted, and<br />
that the source height of BNSF horn noise is 10 feet.<br />
Table 33: Recommended Locations for Sound Barriers<br />
City<br />
Wall<br />
No. Direction1 Eng. Station Length<br />
(ft)<br />
Height 2<br />
Start End<br />
(ft)<br />
Clusters<br />
Mitigated<br />
Glendora 1 WB 1451+50 1454+00 250 6 WB 1<br />
Glendora 2 WB 1454+50 1482+00 2750 8 WB 1a, 1b, 1c, 1d<br />
Glendora 3 WB 1505+50 1516+00 1,150 8 WB 3a<br />
Glendora 4 WB 1518+00 1527+75 975 8 WB 4, 5
Noise and Vibration Technical Report: <strong>Metro</strong> <strong>Gold</strong> <strong>Line</strong> <strong>Foothill</strong> <strong>Extension</strong>, Azusa to Montclair<br />
July 2012<br />
Page 81<br />
Glendora 5 WB 1528+00 1550+00 2,200 8 WB 6, 7, 8<br />
Glendora 6 WB 1550+50 1556+50 650 8 WB 9, 10<br />
Glendora 7 WB 1557+00 1569+50 1,250 10 WB 11, 12, 13<br />
Glendora 8 WB 1570+00 1579+00 900 6 WB 14, 15<br />
Glendora 9 WB 1583+00 1601+50 1,850 6 WB 16, 17, 18<br />
Glendora 10 WB 1611+00 1632+00 2,100 12 WB 19, 20<br />
Glendora 11 EB 1430+00 1448+00 1,800 6 EB 1, 2<br />
Glendora 12 EB 1449+50 1454+00 450 12 EB 3<br />
Glendora 13 EB 1454+75 1464+00 925 12 EB 4, 5<br />
Glendora 14 EB 1468+00 1482+00 1,400 12 EB 5a<br />
Glendora 15 EB 1502+50 1504+25 175 12 EB 6<br />
Glendora 16 EB 1536+25 1538+25 200 6 EB 7<br />
Glendora 17 EB 1540+00 1542+50 250 6 EB 8<br />
Glendora 18 EB 1586+00 1588+50 250 6 EB 9<br />
Glendora 19 EB 1603+50 1611+50 800 6 EB 10<br />
Glendora 20 EB 1623+50 1627+50 400 8 EB 11<br />
Total Length, Glendora (ft) 20,725<br />
San Dimas 1 WB 1667+00 1670+00 300 12 WB 1<br />
San Dimas 2 WB 1677+00 1685+00 500 6 WB 2, 3<br />
San Dimas 3 WB 1763+50 1772+00 850 6 WB 7, 8<br />
San Dimas 4 EB 1683+00 1689+00 600 6 EB 1<br />
San Dimas 5 EB 1703+00 1705+50 250 6 EB 3<br />
San Dimas 6 EB 1721+00 1725+00 400 6 EB 3a<br />
Total Length, San Dimas (ft) 2,900<br />
La Verne 1 WB 1815+00 1826+75 1,175 6 WB 1, 2, 3, 4<br />
La Verne 2 WB 1827+25 1833+50 625 6 WB 5, 6<br />
La Verne 3 WB 1446+50 1451+00 500 14 WB 7, F (Cat. 3)<br />
Total Length, La Verne (ft) 2,450<br />
Pomona 1 WB 1966+00 1970+00 400 8 WB 2<br />
Total Length, Pomona (ft) 400<br />
Claremont 1 WB 1975+00 1979+50 450 8 WB 3<br />
Claremont 2 WB 1980+25 1997+50 1,725 8 WB 4, 5<br />
Claremont 3 WB 2046+50 2049+50 300 8 WB 6<br />
Claremont 4 EB 1972+00 1979+50 850 12 EB 2, 3<br />
Claremont 5 EB 2005+50 2009+50 400 12 EB 4<br />
Claremont 6 EB 2033+50 2044+00 1,050 12 EB 5, 6<br />
Claremont 7 EB 2045+50 2049+00 350 12 EB 7<br />
Total Length, Claremont (ft) 5,125<br />
Total Length, All Cities (ft) 31,600
Noise and Vibration Technical Report: <strong>Metro</strong> <strong>Gold</strong> <strong>Line</strong> <strong>Foothill</strong> <strong>Extension</strong>, Azusa to Montclair<br />
July 2012<br />
Page 82<br />
Source: ATS Consulting, 2011<br />
Notes:<br />
Heights and lengths of the sound walls are subject to design refinements. Heights may be significantly altered if<br />
quiet zones waivers are granted for at-grade crossings.<br />
1<br />
EB = towards Montclair (south side of tracks); WB = towards Azusa (north side of tracks)<br />
2<br />
Height above the top-of-rail<br />
Sound walls must stop at intersections, reducing their effectiveness at grade crossings because of noise<br />
leaks around the ends of the walls. In addition, it is not feasible or cost effective for noise barriers to<br />
protect some second floors of noise-sensitive receivers. The recommended mitigation measure in these<br />
instances is sound insulation of the building. Table 34 indicates the locations where sound insulation for<br />
second stories is recommended. Sound insulation is recommended for all second-story windows facing<br />
the tracks within the cluster identified.<br />
Table 35 indicates the locations where sound insulation is recommended for sensitive receivers near atgrade<br />
crossings Improved sound insulation for windows and doors that would be affected by the “sound<br />
leak” around the ends of sound barriers at intersections is one mitigation approach. An alternative<br />
approach for noise mitigation at a grade-crossing is to use transparent panels for the sound wall. This<br />
approach has been used on Phase 1 of the Exposition Corridor project to mitigate noise impacts with a<br />
barrier while maintaining a visual line of sight.<br />
Policies for the implementation of residential sound insulation can be based on policies that have been<br />
used by other transit systems including TriMet in Portland, Oregon and Sound Transit in Seattle. The<br />
approach in Portland and Seattle is to consider sound insulation for residences where the interior noise<br />
levels exceed the US Department of Housing and Urban Development (HUD) maximum allowable<br />
interior noise level of 45 dBA Ldn and the improvements will result in at least 5 decibels of noise<br />
reduction. The implementation of the policy would include indoor noise testing and analysis to determine<br />
the appropriate improvements for each residence. However, implementation of sound insulation requires<br />
permission of property owners to allow access to the interior of their properties for both noise<br />
measurements and improvements.<br />
Table 34: Recommended Locations for Sound Insulation of<br />
Second Stories<br />
City<br />
Cluster<br />
Glendora WB 4<br />
Glendora WB 6<br />
Glendora WB 9<br />
Glendora WB 10<br />
Glendora WB 20<br />
Glendora EB 1<br />
Glendora EB 3<br />
Glendora EB 4<br />
Glendora EB 7
Noise and Vibration Technical Report: <strong>Metro</strong> <strong>Gold</strong> <strong>Line</strong> <strong>Foothill</strong> <strong>Extension</strong>, Azusa to Montclair<br />
July 2012<br />
Page 83<br />
Table 34: Recommended Locations for Sound Insulation of<br />
Second Stories<br />
City<br />
Cluster<br />
Claremont WB 5<br />
Claremont WB 6<br />
Claremont EB 4<br />
Claremont EB 6<br />
Claremont EB 7<br />
Source: ATS Consulting, 2011<br />
Notes: Sound insulation is recommended for all second story windows within<br />
the cluster.<br />
Table 35: Recommended Locations for Sound Insulation near Grade<br />
Crossings<br />
City<br />
Cluster Cross Street<br />
Glendora WB 5 Pasadena Avenue<br />
Glendora WB 6 Pasadena Avenue<br />
Glendora WB 8 Glenwood Avenue<br />
Glendora WB 9 Glenwood Avenue<br />
Glendora WB 10 Elwood Avenue<br />
Glendora WB 11 Elwood Avenue<br />
Glendora WB 13 Lorraine Avenue<br />
Glendora WB 14 Lorraine Avenue<br />
Glendora EB 3 Barranca Avenue<br />
Glendora EB 4 Barranca Avenue<br />
San Dimas WB 1 Gladstone Street<br />
La Verne WB 2 Wheeler Avenue<br />
La Verne WB 3 Wheeler Avenue<br />
La Verne WB 4 A Street<br />
La Verne F (Category 3) D Street<br />
Claremont WB 3 Cambridge Avenue<br />
Claremont WB 4 Cambridge Avenue<br />
Claremont EB 3 Cambridge Avenue<br />
Claremont EB 4 Indian Hill<br />
Source: ATS Consulting, 2011<br />
Notes: The engineering station identifies the cluster at the intersection, not the<br />
particular building where insulation should be applied.
Noise and Vibration Technical Report: <strong>Metro</strong> <strong>Gold</strong> <strong>Line</strong> <strong>Foothill</strong> <strong>Extension</strong>, Azusa to Montclair<br />
July 2012<br />
Page 84<br />
Implementing a quiet zone requires cooperation by all jurisdictions involved with the grade crossing and<br />
is contingent on approval by the FRA. Requirements for a quiet zone waiver include installation of<br />
supplemental safety measures such as four quadrant gates that may already be included as part of the<br />
project. If quiet zones were approved, it would eliminate the need for some of the sound walls listed in<br />
Table 33 and some of the sound insulation recommended Table 35. The at-grade crossings where petition<br />
for quiet zone status is recommended are presented in Table 36.<br />
Table 36: Recommended At-Grade Crossings to Petition for Quiet Zone<br />
City Cross Street<br />
Clusters Mitigated<br />
Glendora Barranca Avenue EB 3, 4<br />
Glendora Pasadena Avenue WB 5, 6<br />
Glendora Glenwood Avenue WB 8, 9<br />
Glendora Elwood Avenue WB 10, 11<br />
Glendora Lorraine Avenue WB 13, 14<br />
San Dimas Gladstone Street WB 1<br />
La Verne Wheeler Avenue WB 2, 3<br />
La Verne A Street WB 5<br />
La Verne D Street F (Category)<br />
Claremont Cambridge Avenue WB 3, WB 4, EB 3<br />
Claremont Indian Hill Boulevard EB 4<br />
Claremont<br />
Source: ATS Consulting, 2011<br />
Claremont Boulevard WB 6, EB 6, EB 7<br />
Notes: Freight trains begin sounding their horns 1/4 mile before an intersection; a quiet zone will improve the noise<br />
environment at all clusters within a 1/4 mile of an at-grade crossing<br />
A number of residential areas along the right-of-way have existing barriers or privacy walls that act as<br />
sound barriers. The noise impact analysis assumed that these existing walls would not provide any noise<br />
reduction because it is not possible to assess the effectiveness of each wall without individual site visits<br />
and surveys. Many of the walls may not be effective as noise barriers due to construction, height, or gaps<br />
in the wall. During the final design of the project, the effectiveness of the existing barriers/privacy walls<br />
can be assessed and incorporated into final mitigation measures. It may be determined that a number of<br />
the existing barriers are effective sound walls, or that some may need to be only repaired or raised slightly<br />
to provide the appropriate level of noise reduction.<br />
6.2 Operational Vibration<br />
The vibration analysis identified Category 2 (residential) land uses that exceed the FTA thresholds for<br />
vibration levels. Mitigation measures that may be implemented to reduce vibration levels to below the<br />
FTA thresholds are described below:
Noise and Vibration Technical Report: <strong>Metro</strong> <strong>Gold</strong> <strong>Line</strong> <strong>Foothill</strong> <strong>Extension</strong>, Azusa to Montclair<br />
July 2012<br />
Page 85<br />
• Ballast Mats – A ballast mat consists of a pad made of rubber or rubber-like material placed on the<br />
subballast with normal ballast, ties, and rail on top. The reduction in groundborne vibration provided<br />
by a ballast mat is strongly dependent on the frequency content of the vibration and the design and<br />
support of the mat. Depending on the soil properties, an asphalt or concrete layer under the ballast<br />
may be required.<br />
• Tire Derived Aggregate (TDA) – TDA consists of a resilient layer of shredded tires or recycled<br />
rubber chips placed beneath the sub-ballast layer of standard open ballast and tie track. This<br />
mitigation method provides results similar to ballast mats and would be strongly dependent on the<br />
frequency content of the vibration. This is a relatively new vibration mitigation approach that has<br />
been successfully implemented by Denver Regional Transit and the Santa Clara Valley<br />
Transportation Authority. In both Santa Clara Valley and Denver, 12-inch layers of TDA were<br />
installed.<br />
• Relocation of Crossovers or Special Trackwork – The special trackwork at crossover locations<br />
increase vibration by about 10 dB. Relocating crossovers away from residential areas will help to<br />
eliminate impacts. If crossovers cannot be relocated away from residential areas, another approach is<br />
to use specially designed ‘low-impact’ frogs in place of standard rigid frogs. Examples of low-impact<br />
frogs include flange-bearing, spring-rail, and moveable point frogs.<br />
• Floating-Slab Track – The track is constructed on a concrete slab that is supported by resilient<br />
elements (either pads 8 to 12 inches thick or a continuous resilient mat). This type of track<br />
construction is very expensive and is typically used only where substantial vibration mitigation is<br />
needed.<br />
Mitigation is considered for all clusters that exceed the vibration threshold for light-rail operations. Table<br />
37 presents the recommended vibration mitigation locations, types, and lengths for the Azusa to Montclair<br />
corridor. The majority of the vibration mitigation is in Glendora (15,900 feet). The residences along<br />
Lemon Avenue in Glendora (between Pasadena Avenue and the Dalton Wash) are located close to the<br />
LRT tracks (within 50 feet), and the estimated attenuation from TDA or ballast mat is insufficient to<br />
reduce the predicted vibration to below the FTA impact thresholds. Floating slab track is capable of<br />
providing the necessary attenuation.<br />
City<br />
Table 37: Recommended Locations for Vibration Mitigation<br />
Eng. Station Length<br />
Start End<br />
(ft)<br />
Mitigation Type<br />
Clusters Mitigated<br />
Glendora 1430+50 1464+00 3,350 Ballast Mat/TDA EB 1-5<br />
Glendora 1468+00 1482+00 1,400 Ballast Mat/TDA EB 5a<br />
Glendora 1492+50 1495+50 200 Ballast Mat/TDA WB 2<br />
Glendora 1518+00 1579+00 6,100 Floating Slab WB 4-15, EB 7<br />
Glendora 1583+00 1601+00 1,800 Ballast Mat/TDA WB 16-18, EB 9<br />
Glendora 1604+00 1632+00 2,800 Ballast Mat/TDA WB 19-20, EB 10-11<br />
Glendora 1663+00 1665+50 250 Ballast Mat/TDA EB 12<br />
Total Length Glendora (ft) 15,900<br />
San Dimas 1667+00 1670+00 300 Ballast Mat/TDA WB 1
Noise and Vibration Technical Report: <strong>Metro</strong> <strong>Gold</strong> <strong>Line</strong> <strong>Foothill</strong> <strong>Extension</strong>, Azusa to Montclair<br />
July 2012<br />
Page 86<br />
San Dimas 1683+00 1689+00 600 Floating Slab EB 1<br />
Total Length San Dimas (ft) 900<br />
Pomona 1965+50 1970+00 450 Ballast Mat/TDA WB 2<br />
Total Length Pomona (ft) 450<br />
Claremont 1975+00 1979+50 450 Ballast Mat/TDA WB 3<br />
Claremont 1986+00 1997+50 1,150 Ballast Mat/TDA WB 5<br />
Claremont 2046+50 2049+50 300 Ballast Mat/TDA WB 6<br />
Total Length Claremont (ft) 1,900<br />
Total Ballast Mat/TDA (all cities): 12,450<br />
Total Floating Slab (all cities): 6,700<br />
Source: ATS Consulting, 2011<br />
Notes:<br />
It is assumed that mitigation will be placed under both near and far tracks.<br />
In addition to the mitigation recommended in Table 37, low-impact frogs should be installed at the<br />
crossovers in Glendora. These crossovers are located adjacent to the single-family residences in Glendora<br />
(westbound clusters 14 and 15) between engineering stations 1570+00 and 1575+00. Low-impact frogs<br />
would provide vibration attenuation at these residences.<br />
Vibration impact was also identified from the relocation of the <strong>Metro</strong>link tracks at Claremont eastbound<br />
clusters 4 and 7. A potential mitigation measure is the installation of ballast mat or TDA under both<br />
<strong>Metro</strong>link tracks.<br />
Table 38: Recommended Locations for Vibration Mitigation, <strong>Metro</strong>link Tracks<br />
City<br />
Eng. Station Length<br />
Start End<br />
(ft)<br />
Mitigation Type<br />
Clusters Mitigated<br />
Claremont 2005+50 2009+50 400 Ballast Mat/TDA EB 4<br />
Claremont 2045+50 2049+00 350 Ballast Mat/TDA EB 7<br />
Source: ATS Consulting, 2011<br />
Notes:<br />
It is assumed that mitigation will be placed under both near and far SCRRA tracks.<br />
The mitigation recommendations in Table 37 and Table 38 will reduce the predicted vibration levels to<br />
below the FTA impact threshold at all but three of the sensitive receivers. Considering the conservative<br />
assumptions in both the operational vibration and mitigation predictions, it is likely that the vibration<br />
level with the recommended mitigation would be below the FTA impact threshold at those three<br />
locations. Further analysis during final design is recommended to confirm that the recommended<br />
mitigation is sufficient and reasonable. The three locations with residual impact are presented in Table 39.<br />
Two of the sensitive receivers with residual impact (Glendora WB6 and San Dimas EB1) are located<br />
within 15 feet of the proposed light-rail tracks. The closest vibration propagation data was collected at 25
Noise and Vibration Technical Report: <strong>Metro</strong> <strong>Gold</strong> <strong>Line</strong> <strong>Foothill</strong> <strong>Extension</strong>, Azusa to Montclair<br />
July 2012<br />
Page 87<br />
feet and was extrapolated to 15 feet to make the vibration predictions. The extrapolation may be overpredicting<br />
the vibration level at such a close distance.<br />
The predicted vibration levels at Glendora WB18 is equal to the FTA impact threshold of 72 VdB with<br />
mitigation from TDA or ballast mat. A floating slab would reduce the vibration levels to below the impact<br />
threshold. However, considering the expense for a floating slab compared to TDA or ballast mat and the<br />
conservative assumptions in the prediction process, it would be unreasonable to install a floating slab<br />
track design at that location where the impact threshold is exceeded by less than 1 dB.<br />
Table 39: Residual Vibration Impacts<br />
City Cluster<br />
Distance<br />
(ft) Mitigation Type Predicted Level with Mitigation<br />
Glendora WB6 12 Floating Slab 76 VdB at 50 Hz<br />
Glendora WB18 44 TDA/Ballast Mat 72 VdB at 31.5 Hz<br />
San Dimas EB1 14 Floating Slab 78 VdB at 31.5 Hz<br />
Source: ATS Consulting 2011<br />
There are several locations in the corridor where mitigation is recommended, but the predicted vibration<br />
level only slightly exceeds the FTA vibration impact threshold. During final design, the vibration<br />
predictions at these residences should be revisited to ensure that vibration mitigation is necessary. In<br />
addition, the vibration predictions at the institutional land use in La Verne and vibration impact from the<br />
<strong>Metro</strong>link tracks in Claremont should also be revisited to ensure the vibration mitigation is necessary. The<br />
analysis used the worst-case LSTM from the measurement results, and the actual LSTM at some of the<br />
clusters may be below values used in the predictions. The locations recommended for further study during<br />
final design are presented in Table 40.<br />
Table 40: Vibration Impacts Recommended for Further Study<br />
City Cluster<br />
Distance<br />
(ft) Mitigation Type Predicted Level without Mitigation<br />
Glendora EB5a 75 TDA/Ballast Mat 74 VdB at 31.5 Hz<br />
Glendora EB10, EB12 94 TDA/Ballast Mat 72 VdB at 31.5 Hz<br />
Glendora EB11 84 TDA/Ballast Mat 73 VdB at 31.5 Hz<br />
San Dimas WB1 50 TDA/Ballast Mat 73 VdB at 31.5 Hz<br />
La Verne F 34 TDA/Ballast Mat 78 VdB at 50 Hz<br />
Pomona WB2 64 TDA/Ballast Mat 72 VdB at 31.5 Hz<br />
Claremont EB4 60<br />
TDA/Ballast Mat<br />
for <strong>Metro</strong>link<br />
72 VdB at 50 Hz<br />
Claremont EB7 44<br />
TDA/Ballast Mat<br />
for <strong>Metro</strong>link<br />
75 VdB at 50 Hz<br />
Source: ATS Consulting 2011
Noise and Vibration Technical Report: <strong>Metro</strong> <strong>Gold</strong> <strong>Line</strong> <strong>Foothill</strong> <strong>Extension</strong>, Azusa to Montclair<br />
July 2012<br />
Page 88<br />
6.3 Construction Noise<br />
Without noise mitigation, construction of the project is expected to generate noise levels that exceed any<br />
thresholds imposed by the Construction Authority in areas near residences. Measures to reduce<br />
construction noise levels include:<br />
• Noise Control Plan: The contractor should be required to develop a Noise Control Plan that<br />
demonstrates how he will achieve the appropriate noise limits. The plan should include<br />
measurements of existing noise, a list of the major pieces of construction equipment that will be<br />
used, and predictions of the noise levels at the closest sensitive receivers (including residences,<br />
hotels, schools, churches, temples, and similar facilities). The noise control plan should be<br />
approved by the <strong>Metro</strong> <strong>Gold</strong> <strong>Line</strong> <strong>Foothill</strong> <strong>Extension</strong> Construction Authority prior to initiating<br />
construction.<br />
• Alternative Construction Procedures: Where the construction cannot be performed in accordance<br />
with the requirement of the noise limits, the contractor should be required to investigate<br />
alternative construction measures that would result in lower sound levels. Also, the contractor<br />
should be required to conduct noise monitoring to demonstrate compliance with contract noise<br />
limits.<br />
• Best Management Practices: The contractor should be required to use the following best<br />
management practices for noise abatement wherever practical:<br />
- Use specialty equipment with enclosed engines and/or high performance mufflers when<br />
feasible. The contractor shall locate equipment and staging areas as far from noise<br />
sensitive receivers as possible.<br />
- Limit unnecessary idling of equipment.<br />
- Install temporary noise barriers as needed and where feasible.<br />
- Reroute construction related truck traffic away from residential streets to the extent<br />
permitted by the relevant municipality.<br />
- Avoid impact pile driving where possible. Where geological conditions permit, use<br />
quieter alternatives such as drilled piles or a vibratory pile driver.<br />
Specific measures to be employed to mitigate construction noise impacts would be developed by the<br />
contractor. In addition, the Construction Authority should be available during construction to discuss and<br />
address noise complaints from residents and business owners.<br />
6.4 Construction Vibration<br />
It is unlikely that vibration from construction activities will exceed the thresholds for minor cosmetic<br />
damage to buildings. In the event that equipment producing high levels of vibration may approach those<br />
limits, the noise control plan should also include measures to minimize vibration impacts during<br />
construction. Also, representatives from the Construction Authority should be available to discuss
Noise and Vibration Technical Report: <strong>Metro</strong> <strong>Gold</strong> <strong>Line</strong> <strong>Foothill</strong> <strong>Extension</strong>, Azusa to Montclair<br />
July 2012<br />
Page 89<br />
vibration related complaints and take appropriate action to minimize the intrusion. Appropriate vibration<br />
mitigation measures include:<br />
• Minimizing the use of tracked vehicles,<br />
• Avoiding vibratory compaction, and<br />
• Vibration monitoring near residences to ensure thresholds are not exceeded.
Noise and Vibration Technical Report: <strong>Metro</strong> <strong>Gold</strong> <strong>Line</strong> <strong>Foothill</strong> <strong>Extension</strong>, Azusa to Montclair<br />
July 2012<br />
Page 90<br />
APPENDIX A. FUNDAMENTAL CONCEPTS OF NOISE AND VIBRATION<br />
Noise Fundamentals<br />
Sound is mechanical energy transmitted by pressure waves in a compressible medium such as air. Noise<br />
is generally defined as unwanted or excessive sound. Sound can vary in intensity by over one million<br />
times within the range of human hearing. Therefore, a logarithmic scale, known as the decibel scale (dB),<br />
is used to quantify sound intensity and compress the scale to a more convenient range.<br />
Sound is characterized by both its amplitude and frequency (or pitch). The human ear does not hear all<br />
frequencies equally. In particular, the ear deemphasizes low and very high frequencies. To better<br />
approximate the sensitivity of human hearing, the A-weighted decibel scale has been developed. Aweighted<br />
decibels are abbreviated as “dBA.” On this scale, the human range of hearing extends from<br />
approximately 3 dBA to around 140 dBA. As a point of reference, Figure 32 includes examples of Aweighted<br />
sound levels from common indoor and outdoor sounds.<br />
Figure 32: Typical Indoor and Outdoor Noise Levels<br />
Using the decibel scale, sound levels from two or more sources cannot be directly added together to<br />
determine the overall sound level. Rather, the combination of two sounds at the same level yields an<br />
increase of 3 dB. The smallest recognizable change in sound level is approximately 1 dB. A 3-dB increase<br />
in the A-Weighted sound level is generally considered perceptible, whereas a 5-dB increase is readily<br />
perceptible. A 10-dB increase is judged by most people as an approximate doubling of the perceived<br />
loudness.
Noise and Vibration Technical Report: <strong>Metro</strong> <strong>Gold</strong> <strong>Line</strong> <strong>Foothill</strong> <strong>Extension</strong>, Azusa to Montclair<br />
July 2012<br />
Page 91<br />
The two primary factors that reduce levels of environmental sounds are increasing the distance between<br />
the sound source and the receiver and having intervening obstacles such as walls, buildings, or terrain<br />
features that block the direct path between the sound source and the receiver. Factors that act to make<br />
environmental sounds louder include moving the sound source closer to the receiver, sound enhancements<br />
caused by reflections, and focusing caused by various meteorological conditions.<br />
Following are brief definitions of the measures of environmental noise used in this study:<br />
• Maximum Sound Level (Lmax): Lmax is the maximum sound level that occurs during an event such<br />
as a train passing. For this analysis Lmax is defined as the maximum sound level using the slow<br />
setting on a standard sound level meter.<br />
• Equivalent Sound Level (Leq): Environmental sound fluctuates constantly. The equivalent sound<br />
level (Leq) is the most common means of characterizing community noise. Leq represents a<br />
constant sound that, over a specified period of time, has the same sound energy as the timevarying<br />
sound. Leq is used by the FTA to evaluate noise effects at institutional land uses, such as<br />
schools, churches, and libraries, from proposed transit projects.<br />
• Day-Night Sound Level (Ldn): Ldn is basically a 24-hour Leq with an adjustment to reflect the<br />
greater sensitivity of most people to nighttime noise. The adjustment is a 10 dB penalty for all<br />
sound that occurs between the hours of 10:00 p.m. to 7:00 a.m. The effect of the penalty is that,<br />
when calculating Ldn, any event that occurs during the nighttime is equivalent to ten occurrences<br />
of the same event during the daytime. Ldn is the most common measure of total community noise<br />
over a 24-hour period and is used by the FTA to evaluate residential noise effects from proposed<br />
transit projects.<br />
• LXX: This is the percent of time a sound level is exceeded during the measurement period. For<br />
example, the L99 is the sound level exceeded during 99 percent of the measurement period. For a<br />
1-hour period, L99 is the sound level exceeded for all except 36 seconds of the hour. The tables of<br />
the hourly noise levels in Appendix B include L1, L33, L50, and L99, the sound levels exceeded<br />
1 percent, 33 percent, 50 percent and 99 percent of the hour. L1 represents typical maximum<br />
sound levels, L33 is approximately equal to Leq when free-flowing traffic is the dominant noise<br />
source, L50 is the median sound level, and L99 is close to the minimum sound level.<br />
• Sound Exposure Level (SEL): SEL is a measure of the acoustic energy of an event such as a train<br />
passing. In essence, the acoustic energy of the event is compressed into a 1-second period. SEL<br />
increases as the sound level of the event increases and as the duration of the event increases. It is<br />
often used as an intermediate value in calculating overall metrics such as Leq and Ldn.<br />
• Sound Transmission Class (STC): STC ratings are used to compare the sound insulating<br />
effectiveness of different types of noise barriers, including windows, walls, etc. Although the<br />
amount of attenuation varies with frequency, the STC rating provides a rough estimate of the<br />
transmission loss from a particular window or wall.<br />
Vibration Fundamentals<br />
One potential community effect from the proposed project is vibration that is transmitted from the tracks<br />
through the ground to adjacent houses. This is referred to as groundborne vibration. When evaluating<br />
human response, groundborne vibration is usually expressed in terms of decibels using the root mean
Noise and Vibration Technical Report: <strong>Metro</strong> <strong>Gold</strong> <strong>Line</strong> <strong>Foothill</strong> <strong>Extension</strong>, Azusa to Montclair<br />
July 2012<br />
Page 92<br />
square (RMS) vibration velocity. RMS is defined as the average of the squared amplitude of the vibration<br />
signal. To avoid confusion with sound decibels, the abbreviation VdB is used for vibration decibels. All<br />
vibration decibels in this report use a decibel reference of 1 micro-inch/second (µin/sec.). 6 The potential<br />
adverse effects of rail transit groundborne vibration are as follows:<br />
• Perceptible Building Vibration: This is when building occupants feel the vibration of the floor<br />
or other building surfaces. Experience has shown that the threshold of human perception is<br />
around 65 VdB and that vibration that exceeds 75 to 80 VdB may be intrusive and annoying to<br />
building occupants.<br />
• Rattle: The building vibration can cause rattling of items on shelves and hanging on walls, and<br />
various different rattle and buzzing noises from windows and doors.<br />
• Reradiated Noise: The vibration of room surfaces radiates sound waves that may be audible to<br />
humans. This is referred to as groundborne noise. When audible groundborne noise occurs, it<br />
sounds like a low-frequency rumble. For a surface rail system such as the proposed build<br />
alternatives, the groundborne noise is usually masked by the normal airborne noise radiated from<br />
the transit vehicle and the rails.<br />
• Damage to Building Structures: Although it is conceivable that vibration from a light-rail<br />
system could cause damage to fragile buildings, the vibration from light-rail transit systems is<br />
usually one to two orders of magnitude below the most restrictive thresholds for preventing<br />
building damage. Hence the vibration effect criteria focus on human annoyance, which occurs at<br />
much lower amplitudes than does building damage.<br />
Vibration is an oscillatory motion that can be described in terms of the displacement, velocity, or<br />
acceleration of the motion. The response of humans to vibration is very complex. However, the general<br />
consensus is that for the vibration frequencies generated by passenger trains, human response is best<br />
approximated by the vibration velocity level. Therefore, vibration velocity has been used in this study to<br />
describe train-generated vibration levels.<br />
When evaluating human response, groundborne vibration is usually expressed in terms of decibels using<br />
the root mean square (RMS) vibration velocity. RMS is defined as the average of the squared amplitude<br />
of the vibration signal. To avoid confusion with sound decibels, the abbreviation VdB is used for<br />
vibration decibels. All vibration decibels in this report use a decibel reference of 1 µin/sec.<br />
Figure 33 shows typical vibration levels from rail and non-rail sources as well as the human and structure<br />
response to such levels.<br />
6 One µin/sec= 10 -6 in/sec.
Noise and Vibration Technical Report: <strong>Metro</strong> <strong>Gold</strong> <strong>Line</strong> <strong>Foothill</strong> <strong>Extension</strong>, Azusa to Montclair<br />
July 2012<br />
Page 93<br />
Figure 33: Typical Vibration Levels<br />
Although there has been relatively little research into human and building response to groundborne<br />
vibration, there is substantial experience with vibration from rail systems. In general, the collective<br />
experience indicates that:<br />
• It is rare that groundborne vibration from transit systems results in building damage, even minor<br />
cosmetic damage. The primary consideration therefore is whether vibration will be intrusive to<br />
building occupants or will interfere with interior activities or machinery.<br />
• The threshold for human perception is approximately 65 VdB. Vibration levels in the range of 70<br />
to 75 VdB are often noticeable but acceptable. Beyond 80 VdB, vibration levels are often<br />
considered unacceptable.<br />
• For human annoyance, there is a relationship between the number of daily events and the degree<br />
of annoyance caused by groundborne vibration. The FTA Guidance Manual includes an 8 VdB<br />
higher impact threshold if there are fewer than 30 events per day and a 3 VdB higher threshold if<br />
there are fewer than 70 events per day.<br />
Often it is necessary to determine the contribution at different frequencies when evaluating vibration or<br />
noise signals. The 1/3-octave band spectrum is the most common procedure used to evaluate frequency<br />
components of acoustic signals. The term “octave” has been borrowed from music where it refers to a<br />
span of eight notes. The ratio of the highest frequency to the lowest frequency in an octave is 2:1. For a<br />
1/3-octave band spectrum, each octave is divided into three bands where the ratio of the lowest frequency<br />
to the highest frequency in each 1/3-octave band is 2 1/3 :1 (1.26:1). An octave consists of three 1/3 octaves.
Noise and Vibration Technical Report: <strong>Metro</strong> <strong>Gold</strong> <strong>Line</strong> <strong>Foothill</strong> <strong>Extension</strong>, Azusa to Montclair<br />
July 2012<br />
Page 94<br />
The 1/3-octave band spectrum of a signal is obtained by passing the signal through a bank of filters. Each<br />
filter excludes all components except those that are between the upper and lower range of one 1/3-octave<br />
band. The FTA Guidance Manual is a good reference for additional information on transit noise and<br />
vibration and the technical terms used in this section.
Noise and Vibration Technical Report: <strong>Metro</strong> <strong>Gold</strong> <strong>Line</strong> <strong>Foothill</strong> <strong>Extension</strong>, Azusa to Montclair<br />
July 2012<br />
Page 95<br />
APPENDIX B. CLUSTER DIAGRAMS
Noise and Vibration Technical Report: <strong>Metro</strong> <strong>Gold</strong> <strong>Line</strong> <strong>Foothill</strong> <strong>Extension</strong>, Azusa to Montclair<br />
July 2012<br />
Page 96
Noise and Vibration Technical Report: <strong>Metro</strong> <strong>Gold</strong> <strong>Line</strong> <strong>Foothill</strong> <strong>Extension</strong>, Azusa to Montclair<br />
July 2012<br />
Page 97
Noise and Vibration Technical Report: <strong>Metro</strong> <strong>Gold</strong> <strong>Line</strong> <strong>Foothill</strong> <strong>Extension</strong>, Azusa to Montclair<br />
July 2012<br />
Page 98
Noise and Vibration Technical Report: <strong>Metro</strong> <strong>Gold</strong> <strong>Line</strong> <strong>Foothill</strong> <strong>Extension</strong>, Azusa to Montclair<br />
July 2012<br />
Page 99
Noise and Vibration Technical Report: <strong>Metro</strong> <strong>Gold</strong> <strong>Line</strong> <strong>Foothill</strong> <strong>Extension</strong>, Azusa to Montclair<br />
July 2012<br />
Page 100
Noise and Vibration Technical Report: <strong>Metro</strong> <strong>Gold</strong> <strong>Line</strong> <strong>Foothill</strong> <strong>Extension</strong>, Azusa to Montclair<br />
July 2012<br />
Page 101
Noise and Vibration Technical Report: <strong>Metro</strong> <strong>Gold</strong> <strong>Line</strong> <strong>Foothill</strong> <strong>Extension</strong>, Azusa to Montclair<br />
July 2012<br />
Page 102
Noise and Vibration Technical Report: <strong>Metro</strong> <strong>Gold</strong> <strong>Line</strong> <strong>Foothill</strong> <strong>Extension</strong>, Azusa to Montclair<br />
July 2012<br />
Page 103
Noise and Vibration Technical Report: <strong>Metro</strong> <strong>Gold</strong> <strong>Line</strong> <strong>Foothill</strong> <strong>Extension</strong>, Azusa to Montclair<br />
July 2012<br />
Page 104
Noise and Vibration Technical Report: <strong>Metro</strong> <strong>Gold</strong> <strong>Line</strong> <strong>Foothill</strong> <strong>Extension</strong>, Azusa to Montclair<br />
July 2012<br />
Page 105
Noise and Vibration Technical Report: <strong>Metro</strong> <strong>Gold</strong> <strong>Line</strong> <strong>Foothill</strong> <strong>Extension</strong>, Azusa to Montclair<br />
July 2012<br />
Page 106
Noise and Vibration Technical Report: <strong>Metro</strong> <strong>Gold</strong> <strong>Line</strong> <strong>Foothill</strong> <strong>Extension</strong>, Azusa to Montclair<br />
July 2012<br />
Page 107<br />
APPENDIX C. SUPPLEMENTAL MEASUREMENT DATA<br />
Force Density Level (FDL)<br />
The Force Density Level (FDL) used in this vibration analysis for LRT vibration predictions is based on<br />
measurements made in the historic Cornfields State Park along the operational Phase 1 of the <strong>Metro</strong> <strong>Gold</strong><br />
<strong>Line</strong> in 2008 for the <strong>Metro</strong> Expo Phase 1 vibration analysis. Previous FDL measurements were made in<br />
2001 and 2004. Following is a description of each of the FDL tests:<br />
1. 2005 DEIR FDL (2001 measurements): Force density measurements were taken by Harris,<br />
Miller, Miller, and Hanson (HMMH) along Phase I of the <strong>Gold</strong> <strong>Line</strong> with the Siemens (P2000)<br />
vehicle. Further information about the measurements is available in the DEIR.<br />
2. 2007 FEIR FDL (2004 measurements): The FDL used in the 2007 FEIR vibration analysis was<br />
the log average of the measured 2005 DEIR FDL and an FDL measured from a prototype<br />
Siemens (P2000) vehicle along the Bixby Knolls section of the Long Beach Blue <strong>Line</strong> in 2001.<br />
3. Cornfield FDL (2008 measurements): Force density measurements were taken by ATS<br />
Consulting in 2008 at the Los Angeles State Historic Park (The Cornfield) just north of the<br />
Chinatown Station of the <strong>Gold</strong> <strong>Line</strong> Phase 1. The test included measurements of the Siemens<br />
(P2000) vehicle and the Ansaldobreda (P2550) vehicle. The two vehicle types showed similar<br />
vibration levels and were combined into one FDL. This test was conducted as part of a detailed<br />
vibration analysis for the Expo Phase 1 line in Los Angeles. Additional vibration measurements<br />
of both vehicle types were made at the same location in October 2010 to confirm there have been<br />
no significant changes to vibration levels since the 2008 test.<br />
The FDLs from the three different measurements are shown in Figure 34. The FDL used in this analysis,<br />
the Cornfield FDL, is shown bolded in blue. The Cornfield FDL from the October 2008 test was used for<br />
the vibration predictions presented in this analysis for the following reasons:<br />
• The 2005 DEIR FDL has a peak in the 63 Hz 1/3 octave band that is not in the 2007 FEIR or<br />
Cornfield FDLs. Because subsequent measurements have not corroborated the peak, it is unlikely<br />
to be representative of what will occur on the <strong>Gold</strong> <strong>Line</strong> <strong>Foothill</strong> <strong>Extension</strong>.<br />
• The 2007 FEIR FDL was based on measurements on the Blue <strong>Line</strong>. The FDL for the <strong>Foothill</strong><br />
<strong>Extension</strong> Azusa to Montclair will most likely be more similar to measurements taken along the<br />
existing <strong>Gold</strong> <strong>Line</strong> track.<br />
• The Cornfield FDL is greater than or similar to the 2007 FEIR FDL across the entire frequency<br />
spectrum. Vibration predictions made using the Cornfield FDL are conservative and minimize the<br />
chance of underestimating the vibration.<br />
• The Cornfield FDL is the most up-to date data. The 2007 FEIR and 2005 DEIR data are based on<br />
measurements made more than five years ago.<br />
The Cornfield FDL is based on measurements of trains traveling at an average speed of 53 mph. If the<br />
trains are travelling significantly slower (when they are entering or exiting stations), the FDL will be<br />
much lower. To account for the difference in FDL due to lower speeds an adjustment of<br />
20*log(speed/53mph) was used. This is the adjustment recommended in the FTA Guidance Manual to<br />
account for fluctuations in the operating speed.
Noise and Vibration Technical Report: <strong>Metro</strong> <strong>Gold</strong> <strong>Line</strong> <strong>Foothill</strong> <strong>Extension</strong>, Azusa to Montclair<br />
July 2012<br />
Page 108<br />
Figure 34: Comparison of Force Density Levels (FDLs)<br />
The FDL is derived by measuring the train vibration (Lv) along an existing section of operational track<br />
and subtracting the measured LSTM:<br />
FDL = Lv - LSTM.<br />
As mentioned above, the FDL for the Cornfields 2008 measurement was made along Phase 1 of the <strong>Metro</strong><br />
<strong>Gold</strong> <strong>Line</strong>. The <strong>Gold</strong> <strong>Line</strong> currently operates with two different vehicles: Siemans and Ansaldobreda.<br />
Vibration measurements from the two vehicles showed similar results and were combined into one FDL.<br />
The measured vibration levels used in the calculation of the FDL are shown in Figure 35 below. The<br />
LSTM measured at the same site and also used in the calculation of the FDL is shown in Figure 36.
Noise and Vibration Technical Report: <strong>Metro</strong> <strong>Gold</strong> <strong>Line</strong> <strong>Foothill</strong> <strong>Extension</strong>, Azusa to Montclair<br />
July 2012<br />
Page 109<br />
Figure 35: Measured <strong>Gold</strong> <strong>Line</strong> Train Vibration Levels<br />
Figure 36: LSTM at the Cornfields State Park
Noise and Vibration Technical Report: <strong>Metro</strong> <strong>Gold</strong> <strong>Line</strong> <strong>Foothill</strong> <strong>Extension</strong>, Azusa to Montclair<br />
July 2012<br />
Page 110<br />
The FDL used in the vibration analysis for <strong>Metro</strong>link vibration predictions is based on measurements<br />
made at vibration propagation test site V-20 in Claremont. Vibration from operating <strong>Metro</strong>link trains in<br />
the project right-of-way is shown in Figure 37. The FDL for <strong>Metro</strong>link trains was derived from those<br />
vibration measurements as well as the LSTM results from site V-20. The <strong>Metro</strong>link FDL is shown in<br />
Figure 38<br />
Figure 37: Measured Vibration Levels from <strong>Metro</strong>link Trains in Claremont on the Westbound<br />
(WB) and Eastbound (EB) Tracks
Noise and Vibration Technical Report: <strong>Metro</strong> <strong>Gold</strong> <strong>Line</strong> <strong>Foothill</strong> <strong>Extension</strong>, Azusa to Montclair<br />
July 2012<br />
Page 111<br />
LSTM Measurement Results<br />
Figure 38: The FDL for <strong>Metro</strong>link Trans<br />
The vibration propagation tests were performed at seventeen locations throughout the proposed project<br />
corridor. The locations of the tests and the measurement results, sorted by city, are presented in Section 2.<br />
This section presents the best-fit and worst-case curves derived from those measurements and applied in<br />
the prediction models.<br />
Best-fit curves were fit to the data of each 1/3 octave band of the different measurement sites. The best-fit<br />
curves were used to compare the results from all of the sites and develop worst-case curves that could be<br />
applied throughout the corridor. After inspection of the results, the LSTM results were separated into<br />
three groups: Glendora, San Dimas/La Verne, and Pomona/Claremont. The best fit results, presented by<br />
city, are shown in Figure 39 through Figure 41 below.<br />
A worst case curve was developed for each group by using the highest value in each 1/3 octave band for<br />
that group. The worst case curves for each group are shown in Figure 42 below. The worst case curves are<br />
used in the vibration prediction models to ensure that the vibration levels are not under predicted at the<br />
sensitive receivers.
Noise and Vibration Technical Report: <strong>Metro</strong> <strong>Gold</strong> <strong>Line</strong> <strong>Foothill</strong> <strong>Extension</strong>, Azusa to Montclair<br />
July 2012<br />
Page 112<br />
Figure 39: Glendora LSTM Best-Fit Results
Noise and Vibration Technical Report: <strong>Metro</strong> <strong>Gold</strong> <strong>Line</strong> <strong>Foothill</strong> <strong>Extension</strong>, Azusa to Montclair<br />
July 2012<br />
Page 113<br />
Figure 40: La Verne/San Dimas LSTM Best-Fit Results
Noise and Vibration Technical Report: <strong>Metro</strong> <strong>Gold</strong> <strong>Line</strong> <strong>Foothill</strong> <strong>Extension</strong>, Azusa to Montclair<br />
July 2012<br />
Page 114<br />
Figure 41: Pomona/Claremont LSTM Best-Fit Results
Noise and Vibration Technical Report: <strong>Metro</strong> <strong>Gold</strong> <strong>Line</strong> <strong>Foothill</strong> <strong>Extension</strong>, Azusa to Montclair<br />
July 2012<br />
Page 115<br />
Figure 42: Worst-Case LSTMs Used in Prediction Models
Noise and Vibration Technical Report: <strong>Metro</strong> <strong>Gold</strong> <strong>Line</strong> <strong>Foothill</strong> <strong>Extension</strong>, Azusa to Montclair<br />
July 2012<br />
Page 6.4-116<br />
Indoor Vibration Measurements<br />
LSTM measurements were taken indoors at eight residences to assist in estimating the difference between<br />
outdoor and indoor vibration levels including any amplification from floor resonances. The LSTM and<br />
coherence results from those indoor measurements and the nearest outdoor measurement are shown in<br />
Figure 43 through Figure 50. The addresses of the indoor measurements are:<br />
• 520 Cornell Drive, Arcadia (second story MFR)<br />
• 1614 Unit D Mayflower Avenue, Monrovia (second story MFR)<br />
• 1320 Three Ranch Road, Duarte (single story SFR)<br />
• 824 Unit 22 Pasadena Avenue, Azusa (second story MFR)<br />
• 412 East Lemon Avenue, Glendora (second floor, rear unit in MFR; vibration site V-13)<br />
• 444 North Amelia Avenue Unit 31F, San Dimas (second floor unit in MFR; vibration site V-15)<br />
• 949 Arrow Highway Unit 2, Claremont (first floor of unit in MFR; vibration site V-19)<br />
• 115 North Mountain Avenue, Claremont (second floor corner unit of MFR; vibration site V-20)
Noise and Vibration Technical Report: <strong>Metro</strong> <strong>Gold</strong> <strong>Line</strong> <strong>Foothill</strong> <strong>Extension</strong>, Azusa to Montclair<br />
July 2012<br />
Page 6.4-117<br />
Figure 43: Arcadia Indoor Measurement LSTM and Coherence<br />
Figure 44: Monrovia Indoor Measurement LSTM and Coherence
Noise and Vibration Technical Report: <strong>Metro</strong> <strong>Gold</strong> <strong>Line</strong> <strong>Foothill</strong> <strong>Extension</strong>, Azusa to Montclair<br />
July 2012<br />
Page 6.4-118<br />
Figure 45: Duarte Indoor Measurement LSTM and Coherence<br />
Figure 46: Azusa Indoor Measurement LSTM and Coherence
Noise and Vibration Technical Report: <strong>Metro</strong> <strong>Gold</strong> <strong>Line</strong> <strong>Foothill</strong> <strong>Extension</strong>, Azusa to Montclair<br />
July 2012<br />
Page 6.4-119<br />
Figure 47: Glendora Indoor Measurement LSTM and Coherence<br />
Figure 48: San Dimas Indoor Measurement LSTM and Coherence
Noise and Vibration Technical Report: <strong>Metro</strong> <strong>Gold</strong> <strong>Line</strong> <strong>Foothill</strong> <strong>Extension</strong>, Azusa to Montclair<br />
July 2012<br />
Page 6.4-120<br />
Figure 49: Claremont (V-19) Indoor Measurement LSTM and Coherence<br />
Figure 50: Claremont (V-20) Indoor Measurement LSTM and Coherence
Noise and Vibration Technical Report: <strong>Metro</strong> <strong>Gold</strong> <strong>Line</strong> <strong>Foothill</strong> <strong>Extension</strong>, Azusa to Montclair<br />
July 2012<br />
Page 121