A risk assessment of threats to Maui's dolphins - Department of ...
A risk assessment of threats to Maui's dolphins - Department of ...
A risk assessment of threats to Maui's dolphins - Department of ...

You also want an ePaper? Increase the reach of your titles
YUMPU automatically turns print PDFs into web optimized ePapers that Google loves.
A <strong>risk</strong> <strong>assessment</strong> <strong>of</strong> <strong>threats</strong><br />
<strong>to</strong> Maui’s <strong>dolphins</strong><br />
Rohan J.C. Currey, Laura J. Boren, Ben R. Sharp and<br />
Dean Peterson
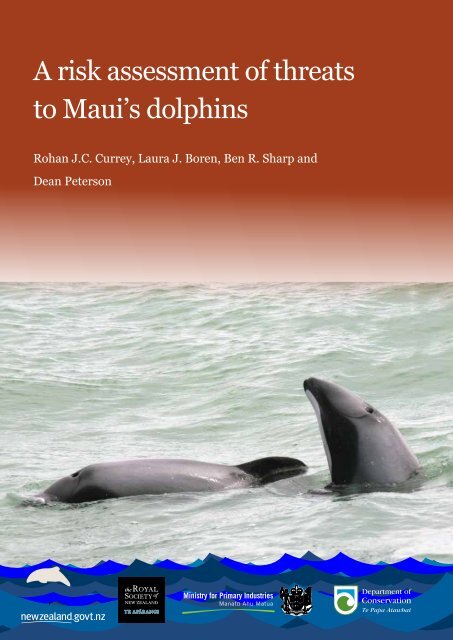
Cover: Maui’s <strong>dolphins</strong>, 2011. Pho<strong>to</strong>: R.M. Hamner, Oregon State University Marine Mammal Institute.<br />
© Copyright September 2012, New Zealand Ministry for Primary Industries and <strong>Department</strong> <strong>of</strong> Conservation.<br />
This report was prepared for publication by the Publishing Team, <strong>Department</strong> <strong>of</strong> Conservation, Welling<strong>to</strong>n, New Zealand. It may<br />
be cited as: Currey, R.J.C.; Boren, L.J.; Sharp, B.R.; Peterson, D. 2012: A <strong>risk</strong> <strong>assessment</strong> <strong>of</strong> <strong>threats</strong> <strong>to</strong> Maui’s <strong>dolphins</strong>. Ministry for<br />
Primary Industries and <strong>Department</strong> <strong>of</strong> Conservation, Welling<strong>to</strong>n. 51 p.<br />
In the interest <strong>of</strong> forest conservation, we support paperless electronic publishing.
CoNTeNTS<br />
Summary 1<br />
1. Introduction 2<br />
1.1 Purpose 2<br />
1.2 Background 2<br />
1.3 Threats 3<br />
1.4 Risk <strong>assessment</strong> 4<br />
1.5 A <strong>risk</strong> <strong>assessment</strong> for Maui’s <strong>dolphins</strong> 5<br />
2. Methods 6<br />
2.1 Risk <strong>assessment</strong> workshop 6<br />
2.2 Defining Maui’s dolphin spatial distribution 6<br />
2.3 Threat identification 8<br />
2.4 Threat characterisation 8<br />
2.5 Threat scoring 8<br />
2.6 Quantitative analysis 11<br />
3. Results 13<br />
3.1 estimated mortality 13<br />
3.2 Population level impact 15<br />
3.3 Spatial distribution 16<br />
4. Discussion 19<br />
4.1 Risk <strong>assessment</strong> for Maui’s <strong>dolphins</strong> 19<br />
4.2 Application <strong>of</strong> the semi-quantitative methodology 20<br />
4.3 Possible improvements for future <strong>risk</strong> <strong>assessment</strong>s 22<br />
4.4 Implications for the Maui’s dolphin population 23<br />
5. Conclusions 24<br />
6. Acknowledgements 25<br />
7. References 25<br />
Appendix 1<br />
Appendix 2<br />
Appendix 3<br />
The Potential Biological Removal (PBR) and probability <strong>of</strong> decline for Maui’s dolphin 28<br />
Maui’s dolphin distribution and fishing effort 33<br />
Maui’s dolphin threat scoring 50
A <strong>risk</strong> <strong>assessment</strong> <strong>of</strong> <strong>threats</strong> <strong>to</strong><br />
Maui’s <strong>dolphins</strong><br />
Rohan J.C. Currey 1 , Laura J. Boren 2 , Ben R. Sharp 1 and Dean Peterson 3<br />
1 Ministry for Primary Industries, Po Box 2526, Welling<strong>to</strong>n 6140, New Zealand<br />
email: rohan.currey@mpi.govt.nz<br />
2 <strong>Department</strong> <strong>of</strong> Conservation, Po Box 10420, Welling<strong>to</strong>n 6143, New Zealand<br />
email: lboren@doc.govt.nz<br />
3 The Royal Society <strong>of</strong> New Zealand, PO Box 598, Welling<strong>to</strong>n 6140, New Zealand, New Zealand<br />
Summary<br />
Maui’s dolphin (Cephalorhynchus hec<strong>to</strong>ri maui) is a subspecies <strong>of</strong> Hec<strong>to</strong>r’s and Maui’s dolphin<br />
(Cephalorhynchus hec<strong>to</strong>ri) and is endemic <strong>to</strong> New Zealand. Maui’s dolphin is listed as ‘critically<br />
endangered’ on the IUCN’s Red List <strong>of</strong> threatened species and ‘nationally critical’ in the<br />
New Zealand Threat Classification System. Current population estimates indicate that about<br />
55 Maui’s <strong>dolphins</strong> over 1 year <strong>of</strong> age remain, and the population is exposed <strong>to</strong> a range <strong>of</strong> human-<br />
and non-human-induced <strong>threats</strong>. A <strong>risk</strong> <strong>assessment</strong> workshop was held in June 2012 with the<br />
purpose <strong>of</strong> identifying, analysing and evaluating all <strong>threats</strong> <strong>to</strong> Maui’s <strong>dolphins</strong>. The <strong>risk</strong> <strong>assessment</strong><br />
scoring was conducted by an expert panel <strong>of</strong> domestic and international specialists in marine<br />
mammal science and ecological <strong>risk</strong> <strong>assessment</strong>. The method for the <strong>risk</strong> <strong>assessment</strong> involved<br />
five key steps: defining Maui’s dolphin distribution, threat identification, threat characterisation<br />
including the spatial distribution <strong>of</strong> the threat, threat scoring, and quantitative analysis.<br />
The panel’s scores combined for all identified <strong>threats</strong> suggested a broad range <strong>of</strong> plausible values<br />
for human-induced Maui’s dolphin mortalities over the next 5 years (a median <strong>of</strong> 5.27 <strong>dolphins</strong><br />
per annum with 95% <strong>of</strong> the distribution <strong>of</strong> scores being between 0.97 and 8.40 <strong>dolphins</strong> per<br />
annum). The panel attributed 95.5% <strong>of</strong> these mortalities <strong>to</strong> commercial, recreational, cus<strong>to</strong>mary<br />
or illegal fishing-related activities combined, and the remaining 4.5% <strong>to</strong> non-fishing-related<br />
<strong>threats</strong>.<br />
Despite this uncertainty, the panel’s scores indicate high confidence that <strong>to</strong>tal human-induced<br />
mortality is higher than the population can sustain. Population projections based on the panel’s<br />
estimated <strong>to</strong>tal mortalities indicate a 95.7% likelihood that the population will decline if <strong>threats</strong><br />
remain at current levels (i.e. as at the time <strong>of</strong> the workshop and prior <strong>to</strong> the introduction <strong>of</strong> interim<br />
measures). estimated <strong>to</strong>tal human-induced Maui’s dolphin mortalities equate <strong>to</strong> a level <strong>of</strong> impact<br />
that is many times higher than the estimated Potential Biological Removals (PBR; a median <strong>of</strong><br />
75.5 times PBR, with 95% <strong>of</strong> the distribution <strong>of</strong> estimates being between 12.4 and 150.7 times PBR).<br />
The <strong>risk</strong> <strong>assessment</strong> method assessed the cumulative impact and associated population <strong>risk</strong> posed<br />
by all <strong>threats</strong> combined and also disaggregated the impacts <strong>of</strong> the respective <strong>threats</strong>, <strong>to</strong> identify<br />
those <strong>threats</strong> that pose the greatest <strong>risk</strong> <strong>to</strong> the <strong>dolphins</strong>. It also identified several <strong>threats</strong> that may<br />
have a low likelihood, but which, given the small population size <strong>of</strong> Maui’s <strong>dolphins</strong>, nonetheless<br />
may have detrimental consequences for the population.<br />
Keywords: Maui’s dolphin, Cephalorhynchus hec<strong>to</strong>ri maui, <strong>risk</strong> <strong>assessment</strong>, potential biological<br />
removal, <strong>risk</strong> ratio, cumulative impacts<br />
© Copyright September 2012, Ministry for Primary Industries and <strong>Department</strong> <strong>of</strong> Conservation. This report may<br />
be cited as: Currey, R.J.C.; Boren, L.J.; Sharp, B.R.; Peterson, D. 2012: A <strong>risk</strong> <strong>assessment</strong> <strong>of</strong> <strong>threats</strong> <strong>to</strong> Maui’s<br />
<strong>dolphins</strong>. Ministry for Primary Industries and <strong>Department</strong> <strong>of</strong> Conservation, Welling<strong>to</strong>n. 51 p.<br />
Risk <strong>assessment</strong> <strong>of</strong> <strong>threats</strong> <strong>to</strong> Maui’s <strong>dolphins</strong><br />
1
1. Introduction<br />
1.1 Purpose<br />
In order <strong>to</strong> manage human-induced <strong>threats</strong> <strong>to</strong> Hec<strong>to</strong>r’s and Maui’s <strong>dolphins</strong> (Cephalorhynchus<br />
hec<strong>to</strong>ri), the <strong>Department</strong> <strong>of</strong> Conservation (DoC) and the then Ministry <strong>of</strong> Fisheries (MFish—now<br />
Ministry for Primary Industries, MPI) jointly developed and consulted on the Hec<strong>to</strong>r’s and Maui’s<br />
dolphin Threat Management Plan (TMP) (MFish & DoC 2007). DoC and MPI had agreed <strong>to</strong><br />
review the TMP in 2013; however, the Minister for Conservation and the Minister for Primary<br />
Industries agreed that, in light <strong>of</strong> new information, the review <strong>of</strong> the Maui’s portion <strong>of</strong> the TMP<br />
should be brought forward. This <strong>risk</strong> <strong>assessment</strong> provides an evaluation <strong>of</strong> the <strong>risk</strong>s posed <strong>to</strong><br />
Maui’s dolphin <strong>to</strong> support the review <strong>of</strong> the TMP.<br />
1.2 Background<br />
More than 50 species or subspecies <strong>of</strong> marine mammals are found in New Zealand’s eeZ (Perrin<br />
et al. 2008). Among these are the endemic Hec<strong>to</strong>r’s and Maui’s <strong>dolphins</strong>. Both are protected<br />
under the New Zealand Marine Mammals Protection Act (1978). The Hec<strong>to</strong>r’s subspecies is listed<br />
as ‘endangered’ on the International Union for the Conservation <strong>of</strong> Nature’s (IUCN’s) Red List<br />
<strong>of</strong> threatened species, and as ‘nationally endangered’ in the New Zealand Threat Classification<br />
System. The Maui’s subspecies is listed as ‘critically endangered’ by the IUCN and as ‘nationally<br />
critical’ in the New Zealand System (Reeves et al. 2000; Baker et al. 2010).<br />
Maui’s dolphin (Cephalorhynchus hec<strong>to</strong>ri maui) is a subspecies <strong>of</strong> Hec<strong>to</strong>r’s and Maui’s dolphin 1<br />
which is one <strong>of</strong> 93 species in the order that contains whales, <strong>dolphins</strong> and porpoises (cetaceans)<br />
(Jefferson et al. 1993). There are currently only 44 named subspecies in this group. only two<br />
species or subspecies <strong>of</strong> cetacean are listed as ‘critically endangered’ on the IUCN Red List (IUCN<br />
2009). These are the vaquita, or Gulf <strong>of</strong> California porpoise (Phocoena sinus), which is a full species<br />
<strong>of</strong> porpoise with just over 200 individuals remaining (Gerrodette et al. 2011), and Maui’s dolphin,<br />
which now has approximately 55 individuals over 1 year <strong>of</strong> age remaining (95% CI: 48–69;<br />
Hamner et al. 2012a). In the recent past, three species or subspecies were listed as critically<br />
endangered; however, the baiji, or Chinese river dolphin (Lipotes vexillifer), was recently declared<br />
extinct due <strong>to</strong> human-related mortality (Turvey et al. 2007). About 40 baiji were known <strong>to</strong> be<br />
alive in 1998, but none were found during an extensive survey in 2006 (Turvey et al. 2007).<br />
Their disappearance indicates that species with populations at low levels can become extinct over<br />
relatively short periods <strong>of</strong> time.<br />
Maui’s dolphin is a small coastal dolphin. Maui’s <strong>dolphins</strong> feed opportunistically, both at<br />
the bot<strong>to</strong>m and throughout the water column, and have been reported <strong>to</strong> feed on a variety <strong>of</strong><br />
species <strong>of</strong> fish (Miller et al. in press). Some diet variation has been observed between different<br />
populations <strong>of</strong> Hec<strong>to</strong>r’s <strong>dolphins</strong>, and the evidence from Maui’s <strong>dolphins</strong> is consistent with that<br />
<strong>of</strong> Hec<strong>to</strong>r’s <strong>dolphins</strong>; i.e. red cod (Pseudophycis bachus) and āhuru (Auchenoceros punctatus)<br />
are important in their diet, along with sole (Pel<strong>to</strong>rhamphus sp.) (Miller et al. in press). Maui’s<br />
<strong>dolphins</strong> are typically found in small groups (average group size 4.7; oremus et al. in press).<br />
Fewer <strong>dolphins</strong> are sighted in winter and the groups tend <strong>to</strong> be more dispersed than in summer<br />
(Rayment et al. 2006). The <strong>dolphins</strong> have relatively small ranges along the coastline (average<br />
distance approx. 35 km), although movements <strong>of</strong> up <strong>to</strong> 80 km have been recorded for some<br />
individuals (oremus et al. in press).<br />
1 In this document, ‘Hec<strong>to</strong>r’s dolphin(s)’ refers <strong>to</strong> the South Island subspecies (Cephalorhynchus hec<strong>to</strong>ri hec<strong>to</strong>ri), while ‘Maui’s dolphin(s)’<br />
refers <strong>to</strong> the North Island subspecies (C. hec<strong>to</strong>ri maui). ‘Hec<strong>to</strong>r’s and Maui’s <strong>dolphins</strong>’ refers <strong>to</strong> both subspecies collectively (C. hec<strong>to</strong>ri).<br />
This approach is taken <strong>to</strong> avoid confusion and enable distinction between the South Island subspecies and the species as a whole.<br />
2 Risk <strong>assessment</strong> <strong>of</strong> <strong>threats</strong> <strong>to</strong> Maui’s <strong>dolphins</strong>
The life his<strong>to</strong>ry <strong>of</strong> Maui’s <strong>dolphins</strong> makes them particularly susceptible <strong>to</strong> population decline<br />
arising from human impacts. Hec<strong>to</strong>r’s and Maui’s <strong>dolphins</strong> have a short lifespan for a cetacean,<br />
with the oldest recorded individual living <strong>to</strong> 22 years <strong>of</strong> age (Rayment et al. 2009). The <strong>dolphins</strong><br />
mature relatively late, with females becoming sexually mature at 7–9 years <strong>of</strong> age (Slooten 1991),<br />
and they are slow breeders, giving birth <strong>to</strong> a single calf every 2 <strong>to</strong> 4 years (Dawson 2008). The<br />
resulting low reproductive rate makes them less resilient <strong>to</strong> impacts arising from anthropogenic<br />
<strong>threats</strong>, and susceptible <strong>to</strong> population decline. Assuming that Maui’s <strong>dolphins</strong> survive and<br />
reproduce at rates similar <strong>to</strong> their South Island counterparts, a maximum growth <strong>of</strong> 1.8–4.9% per<br />
year can be expected, although 1.8% was deemed the most plausible ‘best case’ scenario (Slooten<br />
& Lad 1991). Thus, a population <strong>of</strong> 55 could be expected <strong>to</strong> add only about 1 individual each year<br />
on average. Recent capture recapture analysis indicates that the population is in decline, with a<br />
survival rate <strong>of</strong> 84% (95% Confidence Interval (CI): 75–90%) and a rate <strong>of</strong> population decline<br />
<strong>of</strong> 2.8% per year (95% CI: 10.5% decline <strong>to</strong> 5.6% increase; Hamner et al. 2012a). However, this<br />
growth rate reflects trends between 2001 and 2011 that may not fully reflect population-level<br />
effects <strong>of</strong> management measures put in place in 2008 2 . The confidence intervals reflect statistical<br />
uncertainty, but do not necessarily equate <strong>to</strong> plausible biological bounds.<br />
A revised estimate <strong>of</strong> potential biological removal (PBR) was calculated in 2012 for Maui’s<br />
<strong>dolphins</strong> (see Appendix 1). The PBR is the maximum human-induced mortality that can be<br />
sustained by a marine mammal population without preventing that population from reaching or<br />
maintaining a population level above their maximum net productivity level with high certainty<br />
(Wade 1998). One <strong>of</strong> the key parameters in the estimation <strong>of</strong> PBR is Rmax, which is defined<br />
as the maximum net productivity rate <strong>of</strong> the population at a small size (i.e. unconstrained by<br />
density-dependent fac<strong>to</strong>rs). The net productivity (or population growth rate) is the annual per<br />
capita rate <strong>of</strong> increase resulting from additions due <strong>to</strong> reproduction, minus losses due <strong>to</strong> natural<br />
mortality (Wade 1998). Depending on the value used for Rmax 3 , the estimated PBR for Maui’s<br />
<strong>dolphins</strong> ranges from one dolphin per 10 years <strong>to</strong> one dolphin per 23 years; this implies that<br />
Maui’s <strong>dolphins</strong> can sustain only one human-induced mortality every 10 <strong>to</strong> 23 years without<br />
compromising their ability <strong>to</strong> reach or maintain (with high certainty) a population level above<br />
their maximum net productivity level (see Appendix 1).<br />
1.3 Threats<br />
Threats are defined as any extrinsic fac<strong>to</strong>r or activity that may negatively affect the Maui’s<br />
dolphin population, either by killing individual <strong>dolphins</strong>, i.e. direct <strong>threats</strong>, or by changing their<br />
population characteristics (e.g. resulting in reduced reproductive output), i.e. indirect <strong>threats</strong>. The<br />
actual level <strong>of</strong> the effect arising from a threat is referred <strong>to</strong> as the impact; in this context, easily<br />
expressed in numbers <strong>of</strong> dolphin deaths (or equivalent dolphin deaths, for indirect <strong>threats</strong>) per<br />
annum. Population-level <strong>risk</strong> is a function <strong>of</strong> impact and depends on the inherent biological or<br />
population-level characteristics <strong>of</strong> that population.<br />
Maui’s <strong>dolphins</strong> are exposed <strong>to</strong> a range <strong>of</strong> potential <strong>threats</strong>, both human- and non-humaninduced.<br />
The non-human-induced <strong>threats</strong> include naturally occurring causes <strong>of</strong> mortality such as<br />
parasites, disease, predation, extreme weather events and small population effects (MFish & DoC<br />
2007). The intrinsic rate <strong>of</strong> population increase (Rmax) accounts for non-human-induced (natural)<br />
mortality such that, in the absence <strong>of</strong> other (human-induced) mortality, a population unaffected by<br />
density-dependent limits <strong>to</strong> growth could still be expected <strong>to</strong> increase at the estimated maximum<br />
population growth rate (Rmax). Therefore, when trying <strong>to</strong> determine causes <strong>of</strong> population decline,<br />
2 For more details on the his<strong>to</strong>ry <strong>of</strong> management measures refer <strong>to</strong> the Maui’s dolphin Threat Management Plan 2012: MPI & DoC 2012.<br />
3 PBR calculated with Rmax <strong>of</strong> 0.04 (the default value recommended for dolphin populations by Wade (1998)) results in an estimate <strong>of</strong> 1<br />
dolphin in 10 years. The PBR with Rmax <strong>of</strong> 0.018 (the value calculated for Hec<strong>to</strong>r’s <strong>dolphins</strong> by Slooten & Lad (1991)) results in an estimate<br />
<strong>of</strong> 1 dolphin in 23 years.<br />
Risk <strong>assessment</strong> <strong>of</strong> <strong>threats</strong> <strong>to</strong> Maui’s <strong>dolphins</strong><br />
3
the focus is on human-induced <strong>threats</strong> and their impact on population growth. In this context,<br />
the relative <strong>risk</strong> posed by specific <strong>threats</strong> is a function <strong>of</strong> the estimated level <strong>of</strong> impact, modified<br />
by inherent biological and population level considerations. Impact levels are estimated for each<br />
threat as a function <strong>of</strong> the spatial scale <strong>of</strong> the threatening activity, the intensity <strong>of</strong> the activity, and<br />
the vulnerability <strong>of</strong> Maui’s <strong>dolphins</strong> <strong>to</strong> that particular threat.<br />
Human-induced <strong>threats</strong> include fishing activities, <strong>to</strong>urism, petroleum and mineral exploration<br />
and mining, and coastal development. each <strong>of</strong> these activities has the ability <strong>to</strong> affect the<br />
population directly or indirectly (see Wade et al. 2012).<br />
Direct impacts are those that affect the survival <strong>of</strong> individuals directly from the activity itself<br />
(e.g. bycatch in fishing operations, physical trauma from use <strong>of</strong> seismic airguns, boat strike). These<br />
include direct mortality, but can also include physical trauma or injury that is a direct result <strong>of</strong> the<br />
activity.<br />
Indirect impacts are those that affect the longer-term survival or the reproductive ability <strong>of</strong> the<br />
population and which result indirectly from the activity (e.g. compromised health, poor nutrition<br />
from reduced food availability, masking <strong>of</strong> biologically important behaviours, or displacement<br />
from an area). Indirect effects can result in mortality, but not as a direct result <strong>of</strong> the activity;<br />
rather, the mortality may occur much later through reduced fitness or reduced prey availability, or<br />
displacement <strong>to</strong> suboptimal habitat.<br />
1.4 Risk <strong>assessment</strong><br />
When decisions need <strong>to</strong> be made about the management <strong>of</strong> natural resources, including<br />
populations <strong>of</strong> protected species, managers responsible for such decisions are generally forced <strong>to</strong><br />
rely upon sparse data subject <strong>to</strong> considerable uncertainty. ecological Risk Assessments (eRAs)<br />
provide a systematic framework for evaluating the potential implications <strong>of</strong> different management<br />
decisions when information is sparse, incomplete or uncertain (Burgman et al. 1993). Broadly<br />
speaking, the challenge <strong>of</strong> any <strong>risk</strong> <strong>assessment</strong> is <strong>to</strong> assemble whatever relevant knowledge is<br />
available—whether quantitative or qualitative, objective or subjective—and devise a means <strong>to</strong><br />
utilise that knowledge in the most rigorous and objective way possible <strong>to</strong> estimate the likely<br />
consequences <strong>of</strong> actual or potential actions, while maintaining transparency about the requisite<br />
assumptions and inputs, and associated uncertainty.<br />
Discussion <strong>of</strong> the <strong>risk</strong> <strong>assessment</strong> process is <strong>of</strong>ten fraught with confusion arising from vague and<br />
inconsistent use <strong>of</strong> language, and the term ‘<strong>risk</strong> <strong>assessment</strong>’ is commonly applied <strong>to</strong> a wide range<br />
<strong>of</strong> loosely related analytic approaches. It is important <strong>to</strong> distinguish clearly between different <strong>risk</strong><br />
<strong>assessment</strong> approaches and <strong>to</strong> select the most appropriate approach for a particular management<br />
problem, and <strong>to</strong> be clear about that selection and its implications, taking special care <strong>to</strong> define<br />
the operative terms. The scoring framework can be qualitative, semi-quantitative, quantitative or<br />
‘model-based’ (Hobday et al. 2007).<br />
In the most common <strong>risk</strong> <strong>assessment</strong> approach, <strong>risk</strong> is calculated as a product <strong>of</strong> the expected<br />
likelihood and expected consequence <strong>of</strong> an ‘event’ (i.e. occurrence <strong>of</strong> the threat or activity in<br />
question), combined and assigned a numerical score in a ‘likelihood-consequence matrix’.<br />
Commonly used qualitative models score various attributes, such as likelihood and consequence,<br />
as being low, medium or high. Another example is the SICA method, which scores Scale, Intensity<br />
and Consequence in a range from negligible <strong>to</strong> extreme (Hobday et al. 2007). However, with<br />
its emphasis on discrete low-frequency events, the likelihood-consequence approach is not<br />
ideally suited for the <strong>assessment</strong> <strong>of</strong> <strong>risk</strong>s arising from activities that are predictable, ongoing<br />
and cumulative, such as the environmental effects <strong>of</strong> fishing. In particular, both ‘likelihood’ and<br />
‘consequence’ are unavoidably scale-dependent in both time and space, and there is generally a<br />
mismatch between the scales at which individual fishing ‘events’ occur and the scales at which<br />
the ecological consequences become manifest in ways that are relevant for management. At these<br />
4 Risk <strong>assessment</strong> <strong>of</strong> <strong>threats</strong> <strong>to</strong> Maui’s <strong>dolphins</strong>
longer and larger scales, the assessed ‘events’ are certain and multiply, such that <strong>risk</strong> is a function<br />
not <strong>of</strong> their individual likelihood and consequence, but <strong>of</strong> their cumulative impact, for which an<br />
alternate ‘exposure-effects’ eRA approach is more suited (e.g. Sharp et al. 2009).<br />
The ‘exposure-effects’ approach <strong>to</strong> <strong>risk</strong> <strong>assessment</strong> is designed <strong>to</strong> estimate <strong>risk</strong>s associated<br />
with <strong>threats</strong> that are measurable and ongoing (see US EPA 1992, 1998). Because the impacts<br />
associated with those <strong>threats</strong> are generally not well-known, a two-stage <strong>assessment</strong> process is<br />
required: an impact <strong>assessment</strong> <strong>to</strong> estimate the level <strong>of</strong> the effect associated with each threat, then<br />
an evaluation <strong>of</strong> the associated ecological or population-level consequence (i.e. <strong>risk</strong>). Because<br />
the relationship between impact and <strong>risk</strong> is affected by the specific biological or population<br />
characteristics <strong>of</strong> the organism in question, this latter stage is best informed by specialist<br />
knowledge or population modelling, or may benefit from reference <strong>to</strong> established benchmarks for<br />
evaluating the consequences <strong>of</strong> impacts at different levels (e.g. PBR for marine mammals).<br />
1.5 A <strong>risk</strong> <strong>assessment</strong> for Maui’s <strong>dolphins</strong><br />
To inform the development <strong>of</strong> the Maui’s dolphin component <strong>of</strong> the TMP review, all new<br />
information on Maui’s dolphin biology and potential <strong>threats</strong> was evaluated and incorporated in<br />
a <strong>risk</strong> <strong>assessment</strong> workshop process. The purpose <strong>of</strong> the workshop was <strong>to</strong> identify, analyse and<br />
evaluate all <strong>threats</strong> <strong>to</strong> Maui’s <strong>dolphins</strong> and estimate the level <strong>of</strong> impact and corresponding <strong>risk</strong> posed<br />
by these <strong>threats</strong>, individually and collectively, <strong>to</strong> the achievement <strong>of</strong> management objectives<br />
(see MFish & DoC 2007; MPI & DoC 2012). A semi-quantitative <strong>risk</strong> <strong>assessment</strong> method consistent<br />
with the ‘exposure-effects’ approach was chosen for this exercise. In the absence <strong>of</strong> reliable<br />
quantitative information from which <strong>to</strong> estimate impacts on Maui’s <strong>dolphins</strong> arising from different<br />
<strong>threats</strong> in a systematic way, an expert panel considered available data and characterised the nature<br />
<strong>of</strong> each threat, then used their expert judgement <strong>to</strong> assess the associated impact, but expressed each<br />
estimate on a quantitative scale (i.e. dolphin deaths or equivalent dolphin deaths per annum).<br />
An advantage <strong>of</strong> this approach is that the resulting semi-quantitative impact estimates are<br />
expressed on a common scale and are additive for all <strong>threats</strong>, and the corresponding combined<br />
population-level consequences can be expressed quantitatively and compared with empirical<br />
estimates. The <strong>risk</strong> <strong>assessment</strong> method did not conflate uncertainty with <strong>risk</strong>; rather, each expert<br />
was asked <strong>to</strong> represent their own estimated uncertainty for each impact score, by defining a<br />
triangular distribution (i.e. most likely level <strong>of</strong> impact plus upper and lower bounds).<br />
All threat characterisations included a spatially explicit characterisation <strong>of</strong> <strong>risk</strong> by visually and<br />
mathematically representing in a Geographic Information System (GIS) the spatial overlap <strong>of</strong><br />
the threat (e.g. spatial fishing effort distribution) and the affected population (i.e. the spatial<br />
dolphin distribution; see below). As a consequence, even estimates <strong>of</strong> impacts made by expert<br />
judgement could be subsequently disaggregated in space using available spatial data. This allows,<br />
for example, the generation <strong>of</strong> testable hypotheses about levels <strong>of</strong> impact occurring in particular<br />
areas and prediction <strong>of</strong> the extent <strong>to</strong> which impact and <strong>risk</strong> might be reduced using different<br />
management measures.<br />
Finally, the outputs <strong>of</strong> this method are amenable <strong>to</strong> incremental improvement, such that if reliable<br />
quantitative estimates <strong>of</strong> impact for particular <strong>threats</strong> become available in the future (e.g. by<br />
the acquisition <strong>of</strong> fisheries observer data <strong>to</strong> estimate capture rates in particular fisheries), then<br />
empirically derived impact estimates can replace the expert-derived estimates for that threat<br />
without the need <strong>to</strong> repeat the <strong>risk</strong> <strong>assessment</strong> exercise for all <strong>threats</strong>.<br />
This report summarises the methodology applied and the results <strong>of</strong> the <strong>risk</strong> <strong>assessment</strong><br />
workshop. Note that the focus <strong>of</strong> the workshop and <strong>of</strong> this report is <strong>risk</strong> <strong>assessment</strong>, not <strong>risk</strong><br />
management. Management objectives, recommended management measures informed by the<br />
outcomes <strong>of</strong> this workshop and report, and future research priorities are proposed in the Maui’s<br />
dolphin Threat Management Plan (MPI & DoC 2012) 4 .<br />
4 The Maui’s dolphin Threat Management Plan 2012 will be available at www.mpi.govt.nz and www.doc.govt.nz<br />
Risk <strong>assessment</strong> <strong>of</strong> <strong>threats</strong> <strong>to</strong> Maui’s <strong>dolphins</strong><br />
5
2. Methods<br />
2.1 Risk <strong>assessment</strong> workshop<br />
A <strong>risk</strong> <strong>assessment</strong> workshop was held in Welling<strong>to</strong>n, New Zealand on 12–13 June 2012. The<br />
workshop was facilitated by scientists from the Royal Society <strong>of</strong> New Zealand, MPI and DoC.<br />
The <strong>risk</strong> <strong>assessment</strong> scoring was conducted by an expert panel (the panel) comprising domestic<br />
and international specialists in marine mammal science and ecological <strong>risk</strong> <strong>assessment</strong>. The<br />
panellists were selected <strong>to</strong> ensure a broad range <strong>of</strong> scientific expertise was represented, including<br />
specialists in marine mammal acoustics, ecology, genetics, population biology and taxonomy, as<br />
well as ecological <strong>risk</strong> <strong>assessment</strong> methodology and its application <strong>to</strong> fisheries. Representatives<br />
(stakeholders) from a range <strong>of</strong> sec<strong>to</strong>rs, including central and local government, environmental<br />
NGOs, the fishing industry, the mining industry and iwi, were present <strong>to</strong> inform the <strong>risk</strong><br />
<strong>assessment</strong> scoring by the panel and <strong>to</strong> ensure transparency in the workshop process.<br />
The workshop began with invited presentations on Hec<strong>to</strong>r’s and Maui’s dolphin biology, including<br />
their diet, foraging ecology, demography, population genetics and distribution5 . Following<br />
the presentations, there was directed discussion <strong>to</strong> produce an agreed map <strong>of</strong> Maui’s dolphin<br />
distribution (Fig. 1). This was followed by discussion <strong>of</strong> <strong>risk</strong> <strong>assessment</strong> methodology and then the<br />
<strong>risk</strong> <strong>assessment</strong> <strong>to</strong>ok place.<br />
The method for the <strong>risk</strong> <strong>assessment</strong> involved five key steps:<br />
• Defining Maui’s dolphin spatial distribution.<br />
• Threat identification.<br />
• Threat characterisation.<br />
• Threat scoring.<br />
• Quantitative analysis.<br />
The <strong>risk</strong> <strong>assessment</strong> steps will be discussed consecutively under these headings below. Analysis <strong>of</strong><br />
cumulative <strong>risk</strong> combined for all <strong>threats</strong> was completed by the authors <strong>of</strong> this report subsequent <strong>to</strong><br />
the workshop.<br />
2.2 Defining Maui’s dolphin spatial distribution<br />
The map <strong>of</strong> Maui’s dolphin 6 distribution was developed from a combination <strong>of</strong> empirical evidence<br />
and expert judgment (Fig. 1, see Appendix 2 for details). Sighting data, from various systematic<br />
surveys <strong>of</strong> Maui’s <strong>dolphins</strong> <strong>of</strong>f the west coast <strong>of</strong> the North Island (Ferreira & Roberts 2003;<br />
Slooten et al. 2005; Scali 2006; Rayment & du Fresne 2007; Childerhouse et al. 2008; Stanley<br />
2009; Hamner et al. 2012a), were modelled <strong>to</strong> estimate the probability that a dolphin would be<br />
seen at a given point, averaged over time. The panel agreed that certain aspects <strong>of</strong> the resulting<br />
modelled distribution did not accurately reflect Maui’s dolphin distribution due <strong>to</strong> limitations<br />
5 Assoc. Pr<strong>of</strong>. Liz Slooten (University <strong>of</strong> otago) presented a primer on the biology <strong>of</strong> Hec<strong>to</strong>r’s and Maui’s <strong>dolphins</strong>, including information on<br />
diet, foraging ecology and maximum population growth rate. Rebecca Hamner (oregon State University) presented the recent estimate <strong>of</strong><br />
Maui’s dolphin abundance (Hamner et al. 2012a) as well as the genetic test results <strong>of</strong> two recent beachcast <strong>dolphins</strong>. Dr Finlay Thompson<br />
(Dragonfly Science) presented analysis <strong>of</strong> Maui’s dolphin distribution and fishing effort <strong>to</strong> provide spatial distribution layers for the spatial<br />
<strong>assessment</strong> <strong>of</strong> <strong>risk</strong> (Appendix 2).<br />
6 The map <strong>of</strong> the distribution <strong>of</strong> Maui’s <strong>dolphins</strong> was produced using a number <strong>of</strong> information sources, including sightings from aerial and<br />
boat surveys, public observations, and expert judgement. The subspecies identity <strong>of</strong> many <strong>of</strong> the sightings was unable <strong>to</strong> be confirmed.<br />
While Hec<strong>to</strong>r’s <strong>dolphins</strong> have been detected <strong>of</strong>f the North Island West Coast, they are likely <strong>to</strong> represent a relatively small proportion <strong>of</strong> the<br />
<strong>to</strong>tal sightings used <strong>to</strong> generate the distribution, as they comprised just 4 <strong>of</strong> the 91 animals that have been genetically sampled within the<br />
area <strong>of</strong> the agreed distribution since 2001. Given that the proportion <strong>of</strong> Hec<strong>to</strong>r’s <strong>dolphins</strong> is likely <strong>to</strong> be small, the expert panel agreed <strong>to</strong><br />
proceed with the map produced on the basis that it provided the best estimate <strong>of</strong> Maui’s dolphin distribution available.<br />
6 Risk <strong>assessment</strong> <strong>of</strong> <strong>threats</strong> <strong>to</strong> Maui’s <strong>dolphins</strong>
Maui density, <strong>dolphins</strong> per square nautical mile<br />
0.003<br />
0.0025<br />
0.002<br />
0.0015<br />
0.001<br />
0.0005<br />
Figure 1. Maui’s dolphin distribution as agreed by the expert panel. It was created mostly from the sightings and effort data<br />
from nine aerial and biopsy surveys conducted between 2000 and 2012. The distribution has been normalised <strong>to</strong> one, and so<br />
the colours represent the proportion <strong>of</strong> the dolphin population in each square nautical mile (see Appendix 2 for details). The<br />
grey outline marks the extent <strong>of</strong> the Marine Mammal Sanctuary, including the proposed southern extension.<br />
arising from unequal survey effort, differences in sighting probability in close <strong>to</strong> shore and<br />
differences in survey methodology. Accordingly, the panel agreed that the modelled distribution<br />
should be modified <strong>to</strong> alter the shape <strong>of</strong> the <strong>of</strong>fshore distribution function and extend the<br />
alongshore range further south (see Appendix 2 for details).<br />
Risk <strong>assessment</strong> <strong>of</strong> <strong>threats</strong> <strong>to</strong> Maui’s <strong>dolphins</strong><br />
7
2.3 Threat identification<br />
The next step in the <strong>risk</strong> <strong>assessment</strong> process was <strong>to</strong> compile a list <strong>of</strong> possible <strong>threats</strong> <strong>to</strong> Maui’s<br />
<strong>dolphins</strong>. The panel worked from a list assembled for the Hec<strong>to</strong>r’s and Maui’s dolphin Threat<br />
Management Plan (MFish & DoC 2007) with the addition <strong>of</strong> tidal power generation. Given that<br />
the list <strong>of</strong> <strong>threats</strong> was originally developed 6 years ago, and includes <strong>threats</strong> <strong>to</strong> both Hec<strong>to</strong>r’s and<br />
Maui’s <strong>dolphins</strong>, the list was presented <strong>to</strong> the panel <strong>to</strong> be revised based on the applicability <strong>of</strong> each<br />
threat <strong>to</strong> Maui’s <strong>dolphins</strong>. The updated list <strong>of</strong> <strong>threats</strong> (Table 1), as agreed by the panel with input<br />
from stakeholders, then formed the basis <strong>of</strong> the <strong>risk</strong> <strong>assessment</strong>.<br />
2.4 Threat characterisation<br />
The threat characterisation involved initial prioritisation <strong>of</strong> the <strong>threats</strong> <strong>to</strong> be included in the<br />
<strong>risk</strong> <strong>assessment</strong> followed by a description <strong>of</strong> the nature <strong>of</strong> the <strong>risk</strong> posed <strong>to</strong> the population.<br />
Based on the term <strong>of</strong> the previous Hec<strong>to</strong>r’s and Maui’s dolphin threat management plan, the<br />
<strong>risk</strong> <strong>assessment</strong> was time bounded <strong>to</strong> include <strong>threats</strong> that were assessed as likely <strong>to</strong> affect<br />
population trends within the next 5 years (Table 1). Threats for which no plausible effect on<br />
population trend was anticipated in the next 5 years (either because the threat was unlikely <strong>to</strong><br />
affect population trends, or was unlikely <strong>to</strong> be present or occur within the next 5 years) were<br />
eliminated from further consideration. The panel under<strong>to</strong>ok an evaluation <strong>of</strong> whether each threat<br />
met this criterion, taking in<strong>to</strong> account feedback from stakeholders. Where a consensus was<br />
not achieved among the members <strong>of</strong> the panel, the threat was included among those subject <strong>to</strong><br />
further consideration. As a consequence, <strong>threats</strong> that were poorly unders<strong>to</strong>od underwent scoring<br />
<strong>to</strong> ensure their potential impact was still considered and that the level <strong>of</strong> uncertainty around this<br />
threat could be quantified. From this process the expert panel identified 23 <strong>threats</strong> and eliminated<br />
24 others from further consideration (Table 1).<br />
The 23 <strong>threats</strong> evaluated by the panel as relevant for Maui’s <strong>dolphins</strong> and with the potential<br />
<strong>to</strong> affect population trends in the next 5 years were then characterised <strong>to</strong> document the nature<br />
<strong>of</strong> the <strong>risk</strong> posed <strong>to</strong> the population. This included qualitative characterisation <strong>to</strong> identify, for<br />
example, the mechanism by which the threat could affect Maui’s <strong>dolphins</strong>; whether the impact<br />
is direct, via removals from the population, or indirect, involving a longer-term reduction in<br />
survival or fecundity; and the specific component(s) <strong>of</strong> the population affected (e.g. fecundity,<br />
juvenile survival, or adult survival). each characterisation also involved the use <strong>of</strong> available<br />
spatial data <strong>to</strong> examine (either visually or, where data <strong>to</strong> characterise <strong>threats</strong> was available as<br />
spatially comprehensive data layers, mathematically) the spatial overlap between the threat and<br />
the dolphin distribution produced in step 1. These spatial overlap maps were valuable during<br />
the threat scoring process <strong>to</strong> provide context for the expert panel regarding the actual intensity<br />
<strong>of</strong> threat exposure experienced by the <strong>dolphins</strong>, and will also provide a valuable resource for<br />
informing evaluation <strong>of</strong> the effects <strong>of</strong> alternate spatial <strong>risk</strong> management options.<br />
The threat characterisation was compiled in summary form and provided <strong>to</strong> the panel for<br />
discussion. once a consensus was reached, the resulting table (Table 2) was used as the basis for<br />
<strong>risk</strong> <strong>assessment</strong> scoring.<br />
2.5 Threat scoring<br />
Following the threat characterisation, each threat evaluated by the panel as relevant for Maui’s<br />
<strong>dolphins</strong> and likely <strong>to</strong> affect population trends in the next 5 years was scored. Members <strong>of</strong> the<br />
panel were asked <strong>to</strong> assess the population-level impact from each <strong>of</strong> the identified <strong>threats</strong> <strong>to</strong> Maui’s<br />
<strong>dolphins</strong> over the next 5 years. After discussion, the panellists agreed that the best approach would<br />
be <strong>to</strong> express estimated impact levels in terms <strong>of</strong> the expected number <strong>of</strong> Maui’s dolphin mortalities<br />
(or equivalent mortalities for indirect <strong>threats</strong>) per year associated with each threat.<br />
8 Risk <strong>assessment</strong> <strong>of</strong> <strong>threats</strong> <strong>to</strong> Maui’s <strong>dolphins</strong>
Table 1. A list <strong>of</strong> the <strong>threats</strong> <strong>to</strong> hec<strong>to</strong>r’s and Maui’s <strong>dolphins</strong>. Threats were evaluated by the<br />
panel <strong>to</strong> assess whether they were applicable <strong>to</strong> Maui’s <strong>dolphins</strong> and, if so, whether they were<br />
likely <strong>to</strong> affect population trends within the next 5 years.<br />
ThreAT ClASS ThreAT ApplICAble To lIkely To AFFeCT<br />
Risk <strong>assessment</strong> <strong>of</strong> <strong>threats</strong> <strong>to</strong> Maui’s <strong>dolphins</strong><br />
MAuI'S dolphInS? populATIon TrendS<br />
wIThIn nexT<br />
5 yeArS?<br />
Fishing Commercial trawl yes yes<br />
Commercial setnet yes yes<br />
Commercial driftnet no n/A<br />
recreational setnet yes yes<br />
recreational driftnet yes yes<br />
Cus<strong>to</strong>mary setnets yes yes<br />
Craypot entanglement no n/A<br />
Trophic effects yes yes<br />
Vessel noise: displacement, yes yes<br />
sonar<br />
Shellfish farming displacement yes no<br />
pollution yes no<br />
Finfish farming displacement yes no<br />
pollution yes no<br />
entanglement yes no<br />
Tourism boat strike yes no<br />
noise yes no<br />
disturbance yes no<br />
displacement yes no<br />
Vessel traffic boat strike yes yes<br />
disturbance yes yes<br />
pollution Agricultural run-<strong>of</strong>f yes yes<br />
Industrial run-<strong>of</strong>f yes yes<br />
plastics yes yes<br />
oil spills yes yes<br />
Trophic effects yes yes<br />
Sewage and s<strong>to</strong>rmwater yes yes<br />
Coastal development Marinas, ports no n/A<br />
displacement, noise, pollution, yes no<br />
sedimentation<br />
wave power generation yes no<br />
Tidal power generation yes no<br />
disease natural yes yes<br />
Stress-induced yes yes<br />
domestic animal vec<strong>to</strong>rs yes yes<br />
Small population effects S<strong>to</strong>chastic and Allee effects* yes yes<br />
Mining and oil activities noise (non-trauma) yes yes<br />
noise (trauma) yes yes<br />
pollution (discharge) yes yes<br />
habitat degradation yes yes<br />
Climate/environmental Temperature no n/A<br />
change prey availability no n/A<br />
displacement no n/A<br />
Shooting Shooting no n/A<br />
research physical no n/A<br />
disturbance no n/A<br />
predation predation no n/A<br />
Inbreeding Inbreeding no n/A<br />
Military operations Military operations no n/A<br />
* S<strong>to</strong>chastic effects refers <strong>to</strong> the inherent variability in the survival and reproductive success <strong>of</strong> individuals, which can result in<br />
fluctuating population trends for small populations (Courchamp et al. 2008). These effects are distinct from depensation or Allee<br />
effects that small populations may also experience if the survival or reproduction <strong>of</strong> individuals is compromised when they are at<br />
low abundance (Stephens et al. 1999; Courchamp et al. 2008). In this report, the term ‘small population effects’ is used <strong>to</strong> describe<br />
both s<strong>to</strong>chastic and Allee effects <strong>of</strong> small population size.<br />
9
Table 2. Characterisation <strong>of</strong> <strong>threats</strong> evaluated as relevant <strong>to</strong> Maui’s <strong>dolphins</strong> and likely <strong>to</strong> affect population<br />
trends within the next 5 years.<br />
ThreAT ThreAT MeChAnISM Type populATIon<br />
ClASS CoMponenT(S)<br />
10 Risk <strong>assessment</strong> <strong>of</strong> <strong>threats</strong> <strong>to</strong> Maui’s <strong>dolphins</strong><br />
AFFeCTed<br />
Fishing Commercial trawl Incidental capture, cryptic mortality direct Juvenile or adult survival<br />
Commercial setnet Incidental capture, cryptic mortality direct Juvenile or adult survival<br />
recreational setnet Incidental capture, cryptic mortality direct Juvenile or adult survival<br />
recreational driftnet Incidental capture, cryptic mortality direct Juvenile or adult survival<br />
Cus<strong>to</strong>mary setnet Incidental capture, cryptic mortality direct Juvenile or adult survival<br />
Trophic effects Competition for prey, changes in Indirect Fecundity, juvenile or adult<br />
abundance <strong>of</strong> prey and preda<strong>to</strong>r species survival<br />
Vessel noise: displacement from habitat, masking Indirect Fecundity, juvenile or adult<br />
displacement, sonar biologically important behaviour survival<br />
Vessel traffic boat strike physical injury/mortality direct Juvenile or adult survival<br />
disturbance displacement from habitat, masking Indirect Fecundity, juvenile or adult<br />
biologically important behaviour survival<br />
pollution Agricultural run-<strong>of</strong>f Compromising dolphin health, habitat Indirect Fecundity, juvenile or adult<br />
degradation, trophic effects survival<br />
Industrial run-<strong>of</strong>f Compromising dolphin health, habitat Indirect Fecundity, juvenile or adult<br />
degradation, trophic effects survival<br />
plastics Compromising dolphin health, ingestion both Fecundity, juvenile or adult<br />
and entanglement survival<br />
oil spills Compromising dolphin health, ingestion both Fecundity, juvenile or adult<br />
(direct & prey) and inhalation survival<br />
Trophic effects Changes in abundance <strong>of</strong> prey and Indirect Fecundity, juvenile or adult<br />
preda<strong>to</strong>r species survival<br />
Sewage and s<strong>to</strong>rmwater Compromising dolphin health, habitat Indirect Fecundity, juvenile or adult<br />
degradation, trophic effects survival<br />
disease natural Compromising dolphin health both Fecundity, juvenile or adult<br />
survival<br />
Stress-induced Compromising dolphin health both Fecundity, juvenile or adult<br />
survival<br />
domestic animal vec<strong>to</strong>rs Compromising dolphin health both Fecundity, juvenile or adult<br />
survival<br />
Small population S<strong>to</strong>chastic and Allee Increased susceptibility <strong>to</strong> other <strong>threats</strong> Indirect Fecundity, juvenile or adult<br />
effects effects survival<br />
Mining and oil noise (non-trauma) displacement from habitat, masking Indirect Fecundity, juvenile or adult<br />
activities biologically important behaviour survival<br />
noise (trauma) Compromising dolphin health direct Fecundity, juvenile or adult<br />
survival<br />
pollution (discharge) Compromising dolphin health Indirect Fecundity, juvenile or adult<br />
survival<br />
habitat degradation displacement from habitat, reduced Indirect Fecundity, juvenile or adult<br />
foraging efficiency, trophic effects survival<br />
For indirect <strong>threats</strong>, panellists elected <strong>to</strong> either estimate a mortality level equivalent <strong>to</strong> the<br />
population consequences <strong>of</strong> the threat, or <strong>to</strong> estimate the equivalent impact on population<br />
growth rate (λ), which was then transformed in<strong>to</strong> a mortality estimate. Mortality estimates were<br />
based on the current level <strong>of</strong> <strong>risk</strong> posed by the threat, considering the presence and efficacy<br />
<strong>of</strong> existing <strong>risk</strong> management measures (e.g. fisheries restrictions existing at the time <strong>of</strong> the<br />
workshop). Interim fisheries restrictions introduced in the Taranaki region since the workshop<br />
was held were not considered, meaning <strong>risk</strong> was estimated as if these restrictions were not<br />
in effect. These estimates represented a judgement by the panel members, given available<br />
information and taking in<strong>to</strong> account input from stakeholders and other informed workshop<br />
attendees (e.g. regional government <strong>of</strong>ficials with relevant local knowledge). The resulting<br />
estimates permit an <strong>assessment</strong> <strong>of</strong> population-level impact arising from each threat.
To inform the scoring process, the panel was presented with background material (du Fresne<br />
et al. 2012; Appendices 1 & 2). The background material included information specific <strong>to</strong> Maui’s<br />
<strong>dolphins</strong> as well as material from research on Hec<strong>to</strong>r’s <strong>dolphins</strong> (du Fresne et al. 2012). The panel<br />
agreed that information from Hec<strong>to</strong>r’s <strong>dolphins</strong> could be used as a proxy in situations where<br />
information was limited for Maui’s <strong>dolphins</strong>. Further, DoC and MPI staff compiled relevant<br />
spatial data <strong>to</strong> plot the spatial distribution <strong>of</strong> activities identified as <strong>threats</strong> <strong>to</strong> Maui’s <strong>dolphins</strong>.<br />
The data layers were analysed in advance <strong>of</strong> the workshop and displayed by GIS experts at the<br />
workshop in real time. Based on the advice <strong>of</strong> the panel, the mortality associated with the two<br />
natural <strong>threats</strong> in the threat characterisation (natural diseases and small population effects) was<br />
not estimated separately. Instead, the level <strong>of</strong> mortality from these <strong>threats</strong> and their population<br />
consequences were considered <strong>to</strong> be incorporated within the choice <strong>of</strong> maximum population<br />
growth rate used in the quantitative analysis. The panel agreed <strong>to</strong> use the maximum population<br />
growth rate suggested for Hec<strong>to</strong>r’s <strong>dolphins</strong> by Slooten & Lad (1991), i.e. 1.8% per annum.<br />
each panel member was asked <strong>to</strong> estimate the number <strong>of</strong> Maui’s dolphin mortalities per year<br />
for each threat, along with an upper and lower bound representing uncertainty. The individual<br />
estimates were then presented back <strong>to</strong> the workshop. The panel was provided with an opportunity<br />
<strong>to</strong> discuss the results, and individual panel members were permitted <strong>to</strong> update their estimates<br />
following these discussions. The updated estimates, including upper and lower bounds, were then<br />
recorded.<br />
Subsequent <strong>to</strong> the workshop, during data analysis and report preparation, estimates <strong>of</strong> cumulative<br />
impact from all combined <strong>threats</strong> were compiled by workshop facilita<strong>to</strong>rs and corresponding<br />
estimates <strong>of</strong> population growth rate were generated. expert panellists were re-contacted at this<br />
time and <strong>of</strong>fered the opportunity <strong>to</strong> update their scores in light <strong>of</strong> the combined population<br />
growth or decline rate implied by their threat-specific impact estimates. This was <strong>to</strong> ensure that<br />
the combined population-level consequences <strong>of</strong> cumulative impacts were considered and the<br />
combined mortality estimates were not influenced by the level <strong>of</strong> threat disaggregation. The<br />
panellists’ final estimates were then used for the quantitative analysis.<br />
2.6 Quantitative analysis<br />
To preserve the uncertainty <strong>of</strong> individual expert scores in subsequent analysis <strong>of</strong> cumulative<br />
impacts and population-level consequences, each individual expert score for each threat was<br />
resampled using a parametric bootstrap (10000 samples) from the distribution specified by the<br />
expert. If no alternate distribution was specified, the panel agreed <strong>to</strong> apply a default triangular<br />
distribution that peaked at the expert’s best estimate <strong>of</strong> impact and tailed <strong>of</strong>f linearly <strong>to</strong> zero<br />
at the lower and upper bounds. These distributions were aggregated with equal weighting <strong>to</strong><br />
produce impact distributions representing estimated annual Maui’s dolphin mortalities for<br />
each threat, for each threat class, for each expert, and combined across all <strong>threats</strong> and experts.<br />
The aggregated distributions across all experts incorporate estimates <strong>of</strong> uncertainty provided<br />
by individual panellists as well as the degree <strong>of</strong> consensus among the panellists. To summarise<br />
these distributions and reflect associated uncertainty, we reported medians 7 and 95% confidence<br />
intervals in the results.<br />
To represent the population-level consequence associated with estimated impacts, we applied two<br />
different approaches: first, we generated a corresponding rate <strong>of</strong> population growth or change<br />
(λ); second, we estimated a <strong>risk</strong> ratio (RR), i.e. the level <strong>of</strong> estimated population mortality as a<br />
proportion <strong>of</strong> the Potential Biological Removals (PBR).<br />
To estimate λ and RR, we bootstrap resampled (10 000 samples) using distributions (see below)<br />
for each <strong>of</strong> the parameters in the following formulae:<br />
7 Medians are measures <strong>of</strong> central tendency that are robust <strong>to</strong> skewed data (when compared with arithmetic means). However, as medians<br />
are contingent on the shape <strong>of</strong> their underlying distribution, multiple medians cannot be summed.<br />
Risk <strong>assessment</strong> <strong>of</strong> <strong>threats</strong> <strong>to</strong> Maui’s <strong>dolphins</strong><br />
11
λ = (N λmax –MP)/N (1)<br />
RR = M/PBR (2)<br />
Where:<br />
• N was the most recent abundance estimate (55 animals over 1 year <strong>of</strong> age; 95% CI: 48–69;<br />
selected from an empirical distribution applying Chao’s (1989) formula for sparse data;<br />
Hamner et al. 2012a).<br />
•• λmax was the maximum population growth rate fixed as agreed by the panel (1.8 % per<br />
annum; Slooten & Lad 1991).<br />
• M was the <strong>to</strong>tal estimated human-induced mortalities combined across all <strong>threats</strong> as scored<br />
by the panel, with a distribution estimated from the expert score resampling.<br />
• P was the proportion <strong>of</strong> <strong>to</strong>tal estimated threat-induced mortalities that were <strong>of</strong> individuals<br />
over 1 year <strong>of</strong> age (fixed at 100%).<br />
• PBR was the level <strong>of</strong> potential biological removal provided <strong>to</strong> the panel (1 dolphin every<br />
10 <strong>to</strong> 23 years; which was simulated as a uniform distribution between 0.1 and 0.044 <strong>to</strong><br />
incorporate uncertainty, Appendix 1).<br />
This approach assumed that the current population is at a proportion <strong>of</strong> carrying capacity<br />
sufficiently low as not <strong>to</strong> be subject <strong>to</strong> the density-dependent effects on population growth rate<br />
that affect populations near carrying capacity and, noting that any small population effects are<br />
reflected in the value chosen for λmax. To summarise these distributions in the results, we report<br />
medians and 95% confidence intervals as well as the likelihood <strong>of</strong> threat-induced mortalities<br />
exceeding reference limits such as PBR (i.e. RR > 1) or the level <strong>of</strong> surplus production (i.e. λ < 1).<br />
These reference limits provide measures <strong>of</strong> the biological sustainability <strong>of</strong> <strong>threats</strong> individually or<br />
cumulatively.<br />
12 Risk <strong>assessment</strong> <strong>of</strong> <strong>threats</strong> <strong>to</strong> Maui’s <strong>dolphins</strong>
3. Results<br />
3.1 estimated mortality<br />
The panel estimated that there were likely <strong>to</strong> be 5.27 (95% CI: 0.97–8.40) Maui’s dolphin<br />
mortalities per annum from all <strong>threats</strong> over the next 5 years (Fig. 2). The broad range <strong>of</strong> the<br />
confidence intervals <strong>of</strong> mortality estimates reflected the uncertainty <strong>of</strong> individual panellists as well<br />
as the degree <strong>of</strong> consensus among them in their estimated levels <strong>of</strong> mortality. The bimodal shape<br />
<strong>of</strong> the distribution resulted from differences in overall mortality estimates between panellists.<br />
While eight <strong>of</strong> nine panellists provided scores that were broadly consistent and relatively<br />
uncertain, one expert provided estimates that were significantly lower and comparatively more<br />
certain (Table 3). Subsequent analyses retain the outlying expert’s estimates <strong>to</strong> ensure the findings<br />
are robust <strong>to</strong> diverging views among panellists.<br />
Likelihood based on aggregated expert scores<br />
0.045<br />
0.04<br />
0.035<br />
0.03<br />
0.025<br />
0.02<br />
0.015<br />
0.01<br />
0.005<br />
0<br />
0 1 2 3 4 5 6 7 8 9 10 11<br />
Estimated number <strong>of</strong> <strong>Maui's</strong> dolphin mortalities per year<br />
Figure 2. distribution <strong>of</strong> estimated Maui’s dolphin mortalities per year for all <strong>threats</strong> as scored by<br />
the panel. Individual scores were bootstrap resampled from distributions specified by the panel<br />
and aggregated <strong>to</strong> provide an overall distribution that incorporates uncertainty and the degree <strong>of</strong><br />
consensus.<br />
Table 3. estimated number <strong>of</strong> Maui’s dolphin mortalities per year arising from fishing-related<br />
<strong>threats</strong> and from all <strong>threats</strong> combined, as scored by each member <strong>of</strong> the panel. Individual threat<br />
scores were bootstrap resampled from distributions specified by the panellists and aggregated<br />
<strong>to</strong> generate medians and 95% confidence intervals.<br />
experT FIShIng-relATed All ThreATS proporTIon FroM FIShIng<br />
MedIAn 95% CI 95% CI MedIAn 95% CI 95% CI MedIAn perCenTAge<br />
lower upper lower upper<br />
expert A 0.31 0.23 0.41 1.04 0.84 1.24 30.1<br />
expert b 4.17 2.26 6.55 4.53 2.62 6.91 92.3<br />
expert C 4.69 3.41 6.22 4.78 3.51 6.31 98.3<br />
expert d 4.77 3.34 5.94 4.86 3.43 6.03 98.3<br />
expert e 4.97 2.95 6.95 5.11 3.16 7.07 96.8<br />
expert F 4.81 3.06 6.54 5.43 3.67 7.21 88.3<br />
expert g 5.77 4.15 7.88 6.13 3.94 8.47 89.1<br />
expert h 5.91 3.69 8.19 6.48 4.83 8.54 96.4<br />
expert I 7.00 5.05 9.22 7.24 5.30 9.58 96.4<br />
Total 4.97 0.28 8.04 5.27 0.97 8.39 95.5<br />
Risk <strong>assessment</strong> <strong>of</strong> <strong>threats</strong> <strong>to</strong> Maui’s <strong>dolphins</strong><br />
13
The panel estimated that fishing-related <strong>threats</strong> were responsible for 4.97 (95% CI: 0.28–8.04)<br />
Maui’s dolphin mortalities per annum, or 95.5% <strong>of</strong> <strong>to</strong>tal human-associated mortalities (Table 3).<br />
In comparison, non-fishing-related <strong>threats</strong> (<strong>of</strong> which mining and oil activities, vessel traffic,<br />
pollution and disease generated non-zero impacts) were estimated <strong>to</strong> contribute 0.27 (95% CI:<br />
0.05–0.90) Maui’s dolphin mortalities per annum, or 4.5% <strong>of</strong> <strong>to</strong>tal threat-associated mortalities<br />
(Table 4).<br />
Table 4. estimated Maui’s dolphin mortalities per year, the <strong>risk</strong> ratio <strong>of</strong> mortalities <strong>to</strong> pbr and<br />
the likelihood <strong>of</strong> exceeding pbr for each threat class, as scored by the panel. Individual threat<br />
scores were bootstrap resampled from distributions specified by the panel and aggregated <strong>to</strong><br />
generate medians and 95% confidence intervals.<br />
ThreAT eSTIMATed rISk lIklIhood oF<br />
ClASS MorTAlITIeS rATIo exCeedIng pbr<br />
Figure 3. distribution <strong>of</strong> estimated Maui’s dolphin mortalities per year from all fisheries-related<br />
<strong>threats</strong>, as scored by the panel. Individual scores were bootstrap resampled from distributions<br />
specified by the panel and aggregated <strong>to</strong> provide an overall distribution that incorporates uncertainty<br />
and the degree <strong>of</strong> consensus.<br />
14 Risk <strong>assessment</strong> <strong>of</strong> <strong>threats</strong> <strong>to</strong> Maui’s <strong>dolphins</strong><br />
MedIAn 95% CI 95% CI MedIAn 95% CI 95% CI MedIAn perCenTAge<br />
lower upper lower upper<br />
Fishing 4.97 0.28 8.04 71.5 3.7 143.6 100.0<br />
Mining and oil<br />
activities<br />
0.10 0.01 0.46 1.5 0.1 7.4 61.3<br />
Vessel traffic 0.07
Commercial setnet, commercial trawl and recreational/cus<strong>to</strong>mary setnet fisheries were the <strong>threats</strong><br />
estimated <strong>to</strong> have the greatest impact on Maui’s <strong>dolphins</strong> (Fig. 4). The median estimated numbers<br />
<strong>of</strong> Maui’s dolphin mortalities from commercial setnet, commercial trawl and recreational/<br />
cus<strong>to</strong>mary setnet fisheries were 2.33 (95% CI: 0.02–4.26), 1.13 (95% CI: 0.01–2.87) and 0.88<br />
(95% CI: 0.02–3.14) <strong>dolphins</strong> per year respectively (see Appendix 3 for a complete list <strong>of</strong> <strong>threats</strong><br />
and associated estimated mortalities). Despite the lack <strong>of</strong> consensus among panellists about the<br />
impact <strong>of</strong> fishing-related activities, the relative importance <strong>of</strong> commercial setnet, commercial<br />
trawl and recreational/cus<strong>to</strong>mary setnet fisheries was unchanged whether the one outlying<br />
expert’s estimates were included or not (see Appendix 3).<br />
Commercial trawl bycatch<br />
Commercial setnet bycatch<br />
Recreational/cus<strong>to</strong>mary setnet bycatch<br />
Recreational driftnet bycatch<br />
Trophic effects <strong>of</strong> fishing<br />
Vessel noise/disturbance from fishing<br />
Boat strike from all vessels<br />
Vessel noise/disturbance from other vessels<br />
Agricultural run-<strong>of</strong>f<br />
Industrial run-<strong>of</strong>f<br />
Plastics<br />
Oil spills<br />
Sewage and s<strong>to</strong>rmwater<br />
Trophic effects <strong>of</strong> pollution<br />
Stress-induced diseases<br />
Domestic animal diseases<br />
Noise (non-trauma) from mining & oil activities<br />
Noise (trauma) from mining & oil activities<br />
Pollution (discharge) from mining & oil activities<br />
Habitat degradation from mining & oil activities<br />
Figure 4. estimated Maui’s dolphin mortalities per year for each threat, as scored by the panel. Individual threat scores were<br />
bootstrap resampled from distributions specified by the panel and aggregated <strong>to</strong> generate medians (shaded bars) and 95%<br />
confidence intervals (error bars).<br />
3.2 Population level impact<br />
The level <strong>of</strong> combined impact from all <strong>threats</strong> as estimated by the expert panel is considerably<br />
higher than the population can sustain, given a maximum population growth rate <strong>of</strong> 1.8% per<br />
annum. Population projections based on the panel’s estimated <strong>to</strong>tal mortalities suggest that there<br />
is a 95.7% likelihood <strong>of</strong> population decline in the population <strong>of</strong> Maui’s <strong>dolphins</strong> over the next<br />
5 years. The population projections suggest that, at the current rate <strong>of</strong> human-induced mortality,<br />
the population will decline at 7.6% per annum (95% CI: 13.8% decline <strong>to</strong> 0.1% increase); Fig. 5.<br />
The panel’s scores suggest a rate <strong>of</strong> population change that is more negative than, but broadly<br />
consistent with, a recent empirical estimate (Hamner et al. 2012a; Fig. 6). Total estimated Maui’s<br />
dolphin mortalities equate <strong>to</strong> a <strong>risk</strong> ratio <strong>of</strong> 75.5 (95% CI: 12.4–150.7) times the level <strong>of</strong> the PBR<br />
(Table 4; see Appendix 3 for a complete list <strong>of</strong> <strong>threats</strong> and associated <strong>risk</strong> ratios). each threat class<br />
had at least a 30% chance <strong>of</strong> exceeding the PBR in the absence <strong>of</strong> other <strong>threats</strong> (Table 4).<br />
Risk <strong>assessment</strong> <strong>of</strong> <strong>threats</strong> <strong>to</strong> Maui’s <strong>dolphins</strong><br />
0 1 2 3 4 5<br />
Estimated number <strong>of</strong> <strong>Maui's</strong> dolphin mortalities per year<br />
15
Likelihood based on aggregated expert scores<br />
0.04<br />
0.035<br />
0.03<br />
0.025<br />
0.02<br />
0.015<br />
0.01<br />
0.005<br />
0<br />
-20% -18% -16% -14% -12% -10% -8% -6% -4% -2% 0% 2% 4%<br />
Estimated annual rate <strong>of</strong> population change for <strong>Maui's</strong> <strong>dolphins</strong><br />
Figure 5. estimated annual rate <strong>of</strong> population growth or decline for Maui’s <strong>dolphins</strong> given the<br />
estimated mortalities per year across all <strong>threats</strong> scored by the panel. estimates were generated via<br />
bootstrap resampling <strong>of</strong> mortality and abundance estimates <strong>to</strong> provide an overall distribution that<br />
incorporates uncertainty and the degree <strong>of</strong> consensus.<br />
Likelihood based on aggregated expert scores<br />
0.035<br />
0.03<br />
0.025<br />
0.02<br />
0.015<br />
0.01<br />
0.005<br />
0<br />
-20% -16% -12% -8% -4% 0% 4% 8% 12%<br />
Estimated annual rate <strong>of</strong> population change for <strong>Maui's</strong> <strong>dolphins</strong><br />
Figure 6. estimated annual rate <strong>of</strong> population growth or decline for Maui’s <strong>dolphins</strong> given the<br />
estimated mortalities per year across all <strong>threats</strong> scored by the panel (black) compared with an<br />
empirical estimate (grey) generated via bootstrap resampling the estimate <strong>of</strong> hamner et al. (2012a).<br />
3.3 Spatial distribution<br />
In the initial characterisation <strong>of</strong> specific <strong>threats</strong>, the panel characterised the spatial overlap<br />
between the dolphin distribution and the spatial distribution <strong>of</strong> each threat, as a proxy for the<br />
overall threat intensity experienced by the <strong>dolphins</strong>.<br />
Following threat scoring, these spatial overlap maps were examined in greater detail for the two<br />
<strong>threats</strong> estimated <strong>to</strong> pose the greatest level <strong>of</strong> <strong>risk</strong> <strong>to</strong> Maui’s <strong>dolphins</strong>, i.e. commercial setnet<br />
and trawl fisheries. For these <strong>threats</strong>, the spatial overlap maps were generated empirically by<br />
multiplying the average annual fishing intensity under the current spatial management regime<br />
(i.e. 2008–2011 for setnets and 2008–2011 for trawls) by the relative dolphin density in each<br />
spatial cell on a fine scale (cell size = 1 nautical mile (n.m.)). The resulting maps (Figs 7 & 8) provide<br />
an empirically derived representation <strong>of</strong> the spatial distribution <strong>of</strong> impact and <strong>risk</strong> arising from<br />
each <strong>of</strong> these <strong>threats</strong>; the <strong>to</strong>tal impact estimates generated by the expert panel can be disaggregated<br />
and assigned quantitatively <strong>to</strong> each cell proportional <strong>to</strong> their relative values in Figs 7 & 8.<br />
16 Risk <strong>assessment</strong> <strong>of</strong> <strong>threats</strong> <strong>to</strong> Maui’s <strong>dolphins</strong>
0.05<br />
0.05 - 0.1<br />
0.1 - 0.5<br />
0.5 - 0.75<br />
1<br />
Figure 7. Intersection <strong>of</strong> Maui’s dolphin distribution (Fig. 1) with all setnet effort between 2008 and 2011. The intersection<br />
is calculated by multiplying the fishing effort with the dolphin distribution value in each cell (as shown in blue). The values<br />
have been scaled <strong>to</strong> indicate relative intensity, with the maximum intersection having a value <strong>of</strong> 1. The existing and proposed<br />
areas closed <strong>to</strong> setnet fishing are indicated in shades <strong>of</strong> red 8 . The marine mammal sanctuary is outlined in grey, including the<br />
proposed extension <strong>to</strong> the sanctuary in southern Taranaki (see Appendix 2 for further details).<br />
8 Not all fisheries closures displayed in this map were in effect throughout the 2008–2011 period. The palest red region around Taranaki<br />
was the area proposed for closure under interim measures at the time <strong>of</strong> the workshop.<br />
Risk <strong>assessment</strong> <strong>of</strong> <strong>threats</strong> <strong>to</strong> Maui’s <strong>dolphins</strong><br />
17
0.05<br />
0.05 - 0.1<br />
0.1 - 0.5<br />
0.5 - 0.75<br />
1<br />
Figure 8. Intersection <strong>of</strong> Maui’s dolphin distribution (Fig. 1) with all trawl effort between 2008 and 2011. The intersection<br />
(shown in blue) is calculated by multiplying the fishing effort with the dolphin distribution value in each cell. The values have<br />
been scaled <strong>to</strong> indicate relative intensity, with the maximum intersection having a value <strong>of</strong> 1. The areas closed <strong>to</strong> trawl fishing<br />
are indicated in red. The marine mammal sanctuary is outlined in grey, including the proposed extension <strong>to</strong> the sanctuary in<br />
southern Taranaki (see Appendix 2 for further details).<br />
18 Risk <strong>assessment</strong> <strong>of</strong> <strong>threats</strong> <strong>to</strong> Maui’s <strong>dolphins</strong>
Figure 7 reveals that Maui’s <strong>dolphins</strong> are exposed <strong>to</strong> the greatest level <strong>of</strong> <strong>risk</strong> from setnet fisheries<br />
in the area <strong>of</strong> the northern Taranaki coastline out <strong>to</strong> 7 n.m. <strong>of</strong>fshore, and at the entrance <strong>to</strong> the<br />
Manukau Harbour. Figure 8 reveals that Maui’s <strong>dolphins</strong> are exposed <strong>to</strong> the greatest level <strong>of</strong> <strong>risk</strong><br />
from inshore trawl fisheries between the boundary <strong>of</strong> the trawl fishery closures areas (that extend<br />
2 or 4 n.m. <strong>of</strong>fshore) and 7 n.m. <strong>of</strong>fshore, particularly in the core region <strong>of</strong> dolphin distribution<br />
(from Raglan Harbour entrance <strong>to</strong> the Kaipara Harbour entrance).<br />
These maps, in combination with the expert-panel-derived estimates <strong>of</strong> <strong>to</strong>tal fisheries-associated<br />
impact from these methods, can be used <strong>to</strong> generate testable hypotheses <strong>of</strong> expected impact levels<br />
in particular locations, which could be tested or updated in future using actual data, e.g. from<br />
deploying fisheries observers (as in Richard et al. 2011). The absence <strong>of</strong> spatial information for<br />
recreational and cus<strong>to</strong>mary setnet effort at comparable spatial resolution prevented the workshop<br />
from generating similarly precise spatial estimates <strong>of</strong> relative <strong>risk</strong>, but the application <strong>of</strong> lowerresolution<br />
spatial estimates <strong>of</strong> the relative prevalence <strong>of</strong> these <strong>threats</strong> (e.g. regional-level data from<br />
local compliance or fisheries <strong>of</strong>ficials) may prove valuable.<br />
4. Discussion<br />
4.1 Risk <strong>assessment</strong> for Maui’s <strong>dolphins</strong><br />
The <strong>risk</strong> <strong>assessment</strong> process indicates that the long-term viability <strong>of</strong> the Maui’s dolphin<br />
population remains at <strong>risk</strong> from human-induced mortality. Cumulative mortality estimates <strong>of</strong><br />
5.27 <strong>dolphins</strong> per year (95% CI: 0.97–8.40) cannot be sustained by a population with only<br />
55 individuals over 1 year <strong>of</strong> age (95% CI: 48 <strong>to</strong> 69; Hamner et al. 2012a) with a maximum rate<br />
<strong>of</strong> increase <strong>of</strong> 1.8% per year. The present estimates <strong>of</strong> mortality are 76 times greater than the<br />
PBR, a level that would allow Maui’s <strong>dolphins</strong> <strong>to</strong> reach or maintain a population level above their<br />
maximum net productivity level with high certainty (Wade 1998). This means that, exposed <strong>to</strong> the<br />
current level <strong>of</strong> threat, the population is highly unlikely <strong>to</strong> recover. Indeed, quantitative analysis<br />
using the panel’s estimates <strong>of</strong> mortality (with associated uncertainty) indicated a 95.7% likelihood<br />
<strong>of</strong> ongoing population decline, with a median rate <strong>of</strong> population decline <strong>of</strong> 7.6% per annum.<br />
Fishing-related <strong>threats</strong> were assessed by the panel as posing greatest <strong>risk</strong> <strong>to</strong> Maui’s <strong>dolphins</strong>,<br />
particularly bycatch in commercial setnets, commercial trawl nets and recreational or cus<strong>to</strong>mary<br />
setnets. Fishing-related activities accounted for 95.5% <strong>of</strong> <strong>to</strong>tal Maui’s dolphin mortalities as<br />
estimated by the panel, and mortalities associated with fishing were assessed as having a 100%<br />
likelihood <strong>of</strong> exceeding the PBR, even in the absence <strong>of</strong> other <strong>threats</strong>. This is consistent with the<br />
conclusions <strong>of</strong> the Hec<strong>to</strong>r’s and Maui’s dolphin Threat Management Plan (2007; p. 12) that it<br />
is believed that the effects <strong>of</strong> fishing are the greatest cause <strong>of</strong> human-induced mortality on the<br />
<strong>dolphins</strong> and the effect <strong>of</strong> fishing related mortality is likely <strong>to</strong> be greatest on populations that<br />
are small because the level <strong>of</strong> mortality they can sustain will be less. The panel’s estimates are<br />
also broadly consistent with a number <strong>of</strong> studies that have assessed the <strong>risk</strong> posed by commercial<br />
setnet fisheries <strong>to</strong> population trends for Hec<strong>to</strong>r’s and Maui’s <strong>dolphins</strong> (Slooten 2007; Davies<br />
et al. 2008; Slooten & Dawson 2010; Slooten & Davies 2012). Their general conclusion that setnet<br />
bycatch is likely <strong>to</strong> be driving ongoing population decline is consistent with the findings <strong>of</strong> this<br />
study. Similar findings have been made for similar small cetacean populations, including vaquita<br />
in the Gulf <strong>of</strong> California (Jaramillo-Legorreta et al. 2007; Gerrodette et al. 2011), and harbour<br />
porpoises (Phocoena phocoena) in the Baltic Sea (Berggren et al. 2002). Marine mammal bycatch<br />
in setnet fisheries is a global issue. In the 1990s, 84% <strong>of</strong> cetacean bycatch in the USA and most <strong>of</strong><br />
the world’s cetacean bycatch occurred in setnet fisheries (Read et al. 2006).<br />
Risk <strong>assessment</strong> <strong>of</strong> <strong>threats</strong> <strong>to</strong> Maui’s <strong>dolphins</strong><br />
19
Among the non-fishing-related <strong>threats</strong> considered by the panel, mining and oil activities, vessel<br />
traffic, pollution and disease were all assessed as posing <strong>risk</strong> <strong>to</strong> Maui’s <strong>dolphins</strong> over the next<br />
5 years. Collectively, they represented 4.5% <strong>of</strong> <strong>to</strong>tal Maui’s dolphin mortalities as estimated<br />
by the panel. However, impacts arising from each <strong>of</strong> these <strong>threats</strong> were identified as having<br />
between a 30% and 60% likelihood <strong>of</strong> exceeding the PBR, even in the absence <strong>of</strong> other <strong>threats</strong>,<br />
suggesting that non-fisheries <strong>threats</strong> may be expected <strong>to</strong> delay or prevent the recovery <strong>of</strong> the<br />
population even if all fishing-related mortality was eliminated. The different components <strong>of</strong><br />
prospecting, exploration and active mining for petroleum and minerals have the ability <strong>to</strong><br />
impact the Maui’s dolphin population in a number <strong>of</strong> ways, both direct and indirect, through<br />
noise, increased vessel traffic, pollution, degradation <strong>of</strong> habitat and trophic interactions<br />
(Thompson 2012). Since the workshop, new research has identified the pro<strong>to</strong>zoan Toxoplasma<br />
gondii as the cause <strong>of</strong> death for 7 <strong>of</strong> 28 Hec<strong>to</strong>r’s and Maui’s <strong>dolphins</strong> in fresh enough condition<br />
<strong>to</strong> be examined since 2007 (a <strong>to</strong>tal <strong>of</strong> 54 were submitted for necropsy) (W. Roe, Massey<br />
University, unpubl. data, 31 July 2012). Land-based run<strong>of</strong>f containing cat faeces is believed <strong>to</strong><br />
be the means by which Toxoplasma gondii enters the marine environment (Hill & Dubey 2002),<br />
potentially putting inshore coastal dolphin species at <strong>risk</strong> <strong>of</strong> infection. The panel’s <strong>assessment</strong><br />
<strong>of</strong> the <strong>risk</strong> posed by disease did not include this information, because it was not available at the<br />
time <strong>of</strong> the workshop.<br />
The panel chose <strong>to</strong> include or exclude individual <strong>threats</strong> from this <strong>assessment</strong> based on their<br />
judgement <strong>of</strong> the likelihood <strong>of</strong> each threat having an impact on the Maui’s dolphin population in<br />
the next 5 years. As a consequence, the <strong>risk</strong> <strong>assessment</strong> focused on current levels <strong>of</strong> <strong>risk</strong> arising<br />
from activities that are already occurring within the Maui’s dolphin range or can be anticipated<br />
<strong>to</strong> occur with some level <strong>of</strong> regularity. It was noted, though, that some <strong>threats</strong> may increase in the<br />
future and that these activities should not be ignored. Threats that were considered likely <strong>to</strong> have<br />
a minimal impact on the population were not assessed, but where consensus was not reached,<br />
or the panel considered the potential consequence <strong>of</strong> an unlikely event <strong>to</strong> be high (e.g. oil spill),<br />
they were assessed. However, such <strong>threats</strong> generally resulted in low median estimates with quite<br />
wide confidence intervals. This probably reflects, in part, the low likelihood <strong>of</strong> the event occurring,<br />
but may not adequately represent the high consequence <strong>of</strong> an event should one occur. For these<br />
reasons, the panel and the stakeholders present at the workshop recommended that these<br />
potential <strong>threats</strong> be moni<strong>to</strong>red and considered in future <strong>risk</strong> <strong>assessment</strong>s for Maui’s <strong>dolphins</strong>.<br />
Panel experts emphasised that this <strong>assessment</strong> <strong>of</strong> current <strong>risk</strong>s does not replace the need for<br />
forward-looking impact <strong>assessment</strong>s associated with proposed new activities.<br />
4.2 Application <strong>of</strong> the semi-quantitative methodology<br />
The semi-quantitative methodology developed and applied for this <strong>risk</strong> <strong>assessment</strong> provides a<br />
useful template for <strong>risk</strong> <strong>assessment</strong>s for other threatened, endangered or protected species or<br />
for ecosystem-based <strong>risk</strong> <strong>assessment</strong>s. The following discussion highlights the strengths and<br />
weaknesses <strong>of</strong> the method and provides suggestions for its future use.<br />
The mortality estimates provided by the panel are analogous <strong>to</strong> a severity or consequence score<br />
in a more traditional ecological <strong>risk</strong> <strong>assessment</strong> process. However, a notable difference is that<br />
the semi-quantitative approach provides an absolute estimate <strong>of</strong> population-level impact arising<br />
from each threat, such that each impact is expressed in a common currency for all <strong>threats</strong>,<br />
making it possible <strong>to</strong> generate estimates <strong>of</strong> combined impact and <strong>risk</strong> and corresponding<br />
expected population trajec<strong>to</strong>ries. Moving from a relative measure <strong>of</strong> <strong>risk</strong> (as in more traditional<br />
approaches) <strong>to</strong> an absolute measure <strong>of</strong> impact makes the results more biologically meaningful,<br />
more amenable <strong>to</strong> empirical validation and incremental improvement using new sources <strong>of</strong> data,<br />
and more informative for <strong>risk</strong> management.<br />
The semi-quantitative method used here was designed <strong>to</strong> be able <strong>to</strong> incorporate change. For<br />
example, as new information becomes available, including empirical impact estimates (e.g. from<br />
20 Risk <strong>assessment</strong> <strong>of</strong> <strong>threats</strong> <strong>to</strong> Maui’s <strong>dolphins</strong>
independent fisheries observers), the scores can be updated or selectively replaced, and the<br />
resultant estimate <strong>of</strong> combined impact and <strong>risk</strong> will change in a logical and transparent way. This<br />
ease <strong>of</strong> modification and repeatability with new information also enables trends in <strong>risk</strong> over time<br />
<strong>to</strong> be compared. The method can be used for other protected species, such as the South Island<br />
Hec<strong>to</strong>r’s dolphin subspecies, and would allow for comparisons between populations and species<br />
for a given threat. Several new approaches <strong>to</strong> fisheries <strong>risk</strong> <strong>assessment</strong> estimate the impact<br />
<strong>of</strong> a particular fishing method across a range <strong>of</strong> species, and the environment (Mil<strong>to</strong>n 2001;<br />
S<strong>to</strong>butzki et al. 2001; Griffiths et al. 2006; Sharp et al. 2009; Zhou et al. 2009; Fillipi et al. 2010;<br />
Sharp et al. 2011; Richard et al. 2011). Using spatial data and scoring based on the number <strong>of</strong><br />
mortalities per year or the proportion <strong>of</strong> habitat modified by the given threat, this method could<br />
likewise be applied in other contexts.<br />
Another valuable <strong>to</strong>ol that the semi-quantitative method <strong>of</strong>fers is the ability <strong>to</strong> disaggregate<br />
the level <strong>of</strong> impact each <strong>of</strong> the individual <strong>threats</strong> has on the population, as well as <strong>to</strong> assess the<br />
cumulative <strong>risk</strong> posed by all <strong>threats</strong> combined. Threats do not act on a population in isolation, so<br />
it is important <strong>to</strong> consider all <strong>threats</strong> having an effect on the population as well as the potential<br />
interaction <strong>of</strong> <strong>threats</strong>.<br />
Another benefit <strong>of</strong> using a semi-quantitative method for assessing <strong>risk</strong> is the treatment <strong>of</strong><br />
uncertainty. More qualitative <strong>risk</strong> <strong>assessment</strong>s tend <strong>to</strong> conflate uncertainty and <strong>risk</strong> on the same<br />
scale, thereby making it difficult <strong>to</strong> detect the difference between the two (Hobday et al. 2007).<br />
The present method reflects and enables visualisation <strong>of</strong> two key forms <strong>of</strong> uncertainty—individual<br />
expert uncertainty and the degree <strong>of</strong> consensus between experts (equivalent <strong>to</strong> parameter<br />
uncertainty, and model uncertainty, Burnham & Anderson 2002). This approach also enables<br />
estimation <strong>of</strong> the likelihood <strong>of</strong> specific outcomes (e.g. the likelihood <strong>of</strong> mortality exceeding the<br />
PBR, the likelihood <strong>of</strong> population decline) in a way that explicitly acknowledges the uncertainties<br />
involved. Future applications <strong>of</strong> this approach would benefit from disaggregating individual<br />
expert uncertainty further <strong>to</strong> separate variability (naturally occurring, unpredictable change in<br />
the circumstances leading <strong>to</strong> mortalities) from uncertainty (lack <strong>of</strong> data upon which <strong>to</strong> make more<br />
confident estimates <strong>of</strong> mortality).<br />
One issue with qualitative <strong>assessment</strong>s is the potential for human bias <strong>to</strong> influence the experts’<br />
scores. To avoid this, a quantitative approach similar <strong>to</strong> that used for assessing trawl fisheries <strong>risk</strong><br />
<strong>to</strong> sea snakes in Australia’s Northern Prawn Fishery (Mil<strong>to</strong>n 2001) could be used. However, where<br />
data are sparse or don’t exist, a semi-quantitative approach that utilises expert judgement can be<br />
employed. The semi-quantitative method employed for the Maui’s dolphin <strong>assessment</strong> was more<br />
complex than simple categorical scoring <strong>of</strong> low, medium, high, and required the expert panel <strong>to</strong><br />
have knowledge and understanding <strong>of</strong> a number <strong>of</strong> fac<strong>to</strong>rs, including:<br />
• The biology <strong>of</strong> the <strong>dolphins</strong>.<br />
• Their distribution.<br />
• The frequency and area <strong>of</strong> operation <strong>of</strong> the potential <strong>threats</strong>.<br />
• How the <strong>threats</strong> might impact on the dolphin population.<br />
Where data are lacking, judgements can draw on information and experiences gained in other<br />
locations or with other species.<br />
When a <strong>risk</strong> <strong>assessment</strong> method that is dependent on expert judgement is used, it is important<br />
<strong>to</strong> bear in mind the many fac<strong>to</strong>rs that can affect an expert’s perception <strong>of</strong> <strong>risk</strong>. These include<br />
overconfidence, bias, anchoring (deferral <strong>to</strong> other expert judgements), beliefs and values, and<br />
the level <strong>of</strong> comfort with the elicitation method. Although it is impossible <strong>to</strong> completely remove<br />
human bias, the effect <strong>of</strong> bias can be mitigated. The present method aimed <strong>to</strong> minimise human<br />
bias in a number <strong>of</strong> ways, including:<br />
• Using a series <strong>of</strong> presentations at the beginning <strong>of</strong> the workshop <strong>to</strong> make background<br />
information available <strong>to</strong> everyone at the start <strong>of</strong> the process.<br />
Risk <strong>assessment</strong> <strong>of</strong> <strong>threats</strong> <strong>to</strong> Maui’s <strong>dolphins</strong><br />
21
• Circulating information (such as the Maui’s dolphin bibliography and draft PBR report) <strong>to</strong><br />
the expert panel members prior <strong>to</strong> the workshop.<br />
• Having invited stakeholders present at the workshop and allowing the panel <strong>to</strong> ask for<br />
clarification from the stakeholders about some <strong>of</strong> the processes (e.g. mining methods and<br />
<strong>risk</strong> <strong>assessment</strong>, safety procedures).<br />
• Presenting spatial data on pre-prepared maps and diagrams.<br />
• Having all expert panel members present and then discussing their respective mortality<br />
estimates during the workshop.<br />
• Providing individual panellists the opportunity <strong>to</strong> rescore in light <strong>of</strong> the population-level<br />
effects <strong>of</strong> their estimates <strong>of</strong> cumulative impact.<br />
To address the lack <strong>of</strong> observational data for Maui’s <strong>dolphins</strong> in general and the impacts <strong>of</strong><br />
<strong>threats</strong> on them in particular, spatial data were collated from as many activities or proxies for<br />
<strong>threats</strong> (e.g. human settlements, river mouths, discharge points etc. for pollution and coastal<br />
development) as possible. This information was displayed by GIS experts in real time, providing<br />
a visual representation <strong>of</strong> where the <strong>dolphins</strong> and the <strong>threats</strong> occur. This allowed the workshop <strong>to</strong><br />
assess the spatial overlap between the <strong>threats</strong> and the <strong>dolphins</strong> and <strong>to</strong> judge what they believed<br />
the likelihood and consequence <strong>of</strong> areas <strong>of</strong> overlap would be in terms <strong>of</strong> number <strong>of</strong> dolphin<br />
mortalities per year. Mapping made it possible for the workshop <strong>to</strong> focus on what was known<br />
about each threat while stakeholders were present, which aids quality assurance (people can point<br />
out problems or omissions with the data) and provides context <strong>to</strong> the other data presented. This<br />
meant that, even where data on the actual impacts <strong>of</strong> an activity on Maui’s <strong>dolphins</strong> were sparse,<br />
occurrence data combined with knowledge <strong>of</strong> the species in question could be used <strong>to</strong> formulate<br />
expert judgements while minimising human bias (Macguire 2004; Kerns & Ager 2007).<br />
Another potential issue with use <strong>of</strong> this semi-quantitative approach is time constraints. The<br />
proposal <strong>to</strong> utilise a novel <strong>risk</strong> <strong>assessment</strong> method required agreement from the expert panel<br />
on how the method would work. This, <strong>to</strong>gether with addressing all potential <strong>threats</strong> <strong>to</strong> Maui’s<br />
<strong>dolphins</strong>, resulted in the workshop being time constrained. However, the panel was able <strong>to</strong> score<br />
all <strong>threats</strong> prioritised for scoring during the workshop, and the panellists were then provided with<br />
their aggregate scores and overall estimate <strong>of</strong> mortality and rate <strong>of</strong> population decline following<br />
the workshop and given the opportunity <strong>to</strong> adjust their scores in this follow-up process. The<br />
authors therefore consider it unlikely that time constraints compromised the final outcome.<br />
Another benefit <strong>of</strong> the semi-quantitative approach is that it generated testable hypotheses about<br />
how impacts associated with different <strong>threats</strong> are likely <strong>to</strong> affect the Maui’s dolphin population.<br />
This can assist with planning subsequent research aimed at improving our understanding <strong>of</strong> the<br />
<strong>risk</strong>s <strong>to</strong> the <strong>dolphins</strong>.<br />
4.3 Possible improvements for future <strong>risk</strong> <strong>assessment</strong>s<br />
other work that would have been valuable <strong>to</strong> do as part <strong>of</strong> the <strong>risk</strong> <strong>assessment</strong> for Maui’s <strong>dolphins</strong><br />
included determining the area <strong>of</strong> impact for point source <strong>threats</strong>, such as vessel discharge, or from<br />
mining activities, and determining the spatial overlap between all potential threatening activities<br />
and dolphin distribution. This would have allowed identification <strong>of</strong> the areas where the combined<br />
<strong>risk</strong> <strong>to</strong> the <strong>dolphins</strong> is greatest.<br />
It would be advantageous for future <strong>assessment</strong>s <strong>to</strong> obtain as much quantitative and spatially<br />
explicit analysis <strong>of</strong> priority <strong>threats</strong> as possible prior <strong>to</strong> the workshop. The most reliable (and<br />
therefore defensible) way <strong>of</strong> estimating the impacts <strong>of</strong> any threat is <strong>to</strong> observe those impacts<br />
directly. However, it is not possible <strong>to</strong> observe all threatening processes (e.g. recreational/<br />
cus<strong>to</strong>mary fishing, or pollution). In addition, the low abundance <strong>of</strong> Maui’s <strong>dolphins</strong> and the<br />
consequent low likelihood <strong>of</strong> their presence (let alone actual injury or capture) being observed<br />
22 Risk <strong>assessment</strong> <strong>of</strong> <strong>threats</strong> <strong>to</strong> Maui’s <strong>dolphins</strong>
means considerable resources could be invested for minimal return <strong>of</strong> data. For these reasons<br />
it is important <strong>to</strong> focus effort on observing and collating data for those activities believed <strong>to</strong> be<br />
<strong>of</strong> greatest threat <strong>to</strong> the <strong>dolphins</strong> and <strong>to</strong> use a range <strong>of</strong> methods <strong>to</strong> quantify effects. In the case<br />
<strong>of</strong> fisheries-related <strong>threats</strong> it may be more productive <strong>to</strong> design research <strong>to</strong> generate empirical<br />
estimates <strong>of</strong> vulnerability for Hec<strong>to</strong>r’s <strong>dolphins</strong>, for which capture events are expected <strong>to</strong> be more<br />
observable, and apply those estimates also <strong>to</strong> Maui’s <strong>dolphins</strong> (e.g. using the method used by<br />
Richard et al. 2011 for seabirds).<br />
4.4 Implications for the Maui’s dolphin population<br />
The current status <strong>of</strong> Maui’s dolphin has raised concern about the population’s chances for<br />
recovery even with the removal <strong>of</strong> human-induced mortality. However, the panel judged that the<br />
population can recover, based on their selection <strong>of</strong> a maximum population growth rate <strong>of</strong> 1.8% per<br />
annum; a positive number that reflects an increasing population in the absence <strong>of</strong> human impacts.<br />
Further, there is evidence, both within the Maui’s dolphin population and in cetacean examples<br />
globally (see Jenner et al. 2008; Carroll et al. 2011), <strong>to</strong> suggest that, if human-induced mortalities<br />
are adequately reduced, the population does stand a chance <strong>of</strong> recovery.<br />
Although genetic diversity is low for Maui’s dolphin compared with their subspecies counterpart<br />
the South Island Hec<strong>to</strong>r’s dolphin, their level <strong>of</strong> genetic diversity was found <strong>to</strong> be higher than<br />
expected for a population <strong>of</strong> about 55 animals over the age <strong>of</strong> 1 year (Hamner et al. 2012a). The sex<br />
ratio was also found <strong>to</strong> be near even but with slightly more females, which is also beneficial <strong>to</strong> the<br />
potential recovery <strong>of</strong> the population (Hamner et al. 2012a). The average along-shore home range<br />
<strong>of</strong> about 35 km and extreme movements <strong>of</strong> up <strong>to</strong> 80 km exhibited by Maui’s <strong>dolphins</strong> will support<br />
gene flow through the population (Oremus et al. in press).<br />
Also positive for Maui’s <strong>dolphins</strong> is the presence <strong>of</strong> two female Hec<strong>to</strong>r’s <strong>dolphins</strong> in the Maui’s<br />
range. one <strong>of</strong> the two was sampled in the core <strong>of</strong> the Maui’s dolphin range in two consecutive<br />
years (Hamner et al. 2012a). In addition, two Cephalorynchus <strong>dolphins</strong> found beachcast along the<br />
West Coast <strong>of</strong> the North Island in the last year were also found <strong>to</strong> be Hec<strong>to</strong>r’s <strong>dolphins</strong>, providing<br />
further evidence for the overlap between Hec<strong>to</strong>r’s and Maui’s <strong>dolphins</strong> (DoC 2012; R. Hamner,<br />
oregon State University, unpubl. data, 12 June 2012). This overlap provides the potential for<br />
interbreeding between the subspecies. Although there is currently no evidence <strong>of</strong> interbreeding,<br />
should it happen it would increase the population’s genetic diversity and reproductive potential<br />
(Hamner et al. 2012b).<br />
Globally, a number <strong>of</strong> whale and dolphin species have been hunted <strong>to</strong> quite low numbers<br />
in the past and there are a number <strong>of</strong> examples <strong>of</strong> marine mammal populations recovering<br />
from low numbers once protection has been implemented (e.g. southern right whales, Carroll<br />
et al. 2011; Antarctic blue whales, Jenner et al. 2008). Even in the absence <strong>of</strong> human-induced<br />
<strong>threats</strong>, however, population recovery for cetaceans will be slow. Antarctic blue whales have<br />
been recovering at approximately 8.2% per annum, resulting in numbers increasing from<br />
approximately 360 in the 1970s <strong>to</strong> approximately 2300 in 2007 (representing less than 10% <strong>of</strong><br />
their pre-whaling population, Jenner et al. 2008). In the absence <strong>of</strong> all human-induced <strong>threats</strong>,<br />
Maui’s <strong>dolphins</strong> are likely <strong>to</strong> increase at less than 2% per annum (Slooten & Lad 1991). At their<br />
current population size, this equates <strong>to</strong> an average <strong>of</strong> about one dolphin a year.<br />
The vaquita, another critically endangered small cetacean, provides another example <strong>of</strong> a<br />
declining population where the largest contribution <strong>to</strong> human-induced mortality is bycatch in<br />
setnet fisheries (Jaramillo-Legorreta et al. 2007). Based on the 1997 population estimate and<br />
estimated bycatch, it was concluded that the vaquita population could be as low as 150 individuals<br />
by 2007 and that the rate <strong>of</strong> population decline meant there was a window <strong>of</strong> only 2 years before<br />
the population declined below the number needed <strong>to</strong> retain reproductive fitness (50 adults,<br />
Franklin 1980). While the midpoint <strong>of</strong> the most recent population estimate (in 2008) was not<br />
Risk <strong>assessment</strong> <strong>of</strong> <strong>threats</strong> <strong>to</strong> Maui’s <strong>dolphins</strong><br />
23
as low as that predicted (245—95% CI: 68–884), it still suggests a population decline <strong>of</strong> about<br />
57% since 1997 and a rate <strong>of</strong> about 7.6% per year (Gerrodette et al. 2011). This is similar <strong>to</strong> the<br />
estimated rate <strong>of</strong> population decline for Maui’s dolphin agreed on by the panel in this <strong>assessment</strong>.<br />
Although this estimate is larger than the 3% decline per annum estimated by Hamner et al. 2012a<br />
(see also Appendix 1), it is within the confidence intervals that those authors estimated (95% CI:<br />
10.5% decline <strong>to</strong> 5.6% increase).<br />
There are numerous challenges in studying rare species like Maui’s dolphin. estimates <strong>of</strong><br />
abundance are typically imprecise because sighting rates are generally low, especially at the<br />
extremes <strong>of</strong> the population range (Jaramillo-Legorreta et al. 2007). The small body size <strong>of</strong> Maui’s<br />
<strong>dolphins</strong>, inconspicuous surfacing, small group size and preference for murky inshore waters all<br />
affect the ability <strong>of</strong> observers <strong>to</strong> detect them. This lack <strong>of</strong> precision is also reflected in the large<br />
confidence intervals around estimates <strong>of</strong> population change and the probability <strong>of</strong> decline for<br />
a population. For example, Wade and colleagues estimated a 75.3% probability that the Maui’s<br />
dolphin population is declining (See Appendix 1). Jaramillo-Legorreta et al. 2007 suggest that,<br />
when dealing with small populations, detecting population change will take several years. They<br />
estimated that reliably detecting a 4% increase in population size for vaquita through annual<br />
surveys would take 25 years. Thus, for a small population, a further population decline may go<br />
undetected for several years.<br />
5. Conclusions<br />
The Maui’s dolphin <strong>risk</strong> <strong>assessment</strong> indicates that the current level <strong>of</strong> human-induced impact on<br />
this population cannot be sustained. The key points resulting from the <strong>risk</strong> <strong>assessment</strong> process<br />
are:<br />
1. The expert panel agreed that a spatially-based, semi-quantitative method could be used <strong>to</strong><br />
estimate current human-induced impacts on Maui’s <strong>dolphins</strong>.<br />
2. The panel estimated that there were likely <strong>to</strong> be 5.27 (95% CI: 0.97–8.40) human-induced<br />
Maui’s dolphin mortalities per annum from all <strong>threats</strong>.<br />
3. The broad confidence intervals for this estimate reflect uncertainty within and between<br />
panellists; 8 <strong>of</strong> 9 panellists had broadly consistent scores, whereas one panellist estimated<br />
mortalities <strong>to</strong> be much lower.<br />
4. Fishing-related <strong>threats</strong> accounted for about 95% <strong>of</strong> <strong>to</strong>tal estimated impact compared with<br />
5% from mining and oil activities, vessel traffic, pollution and disease combined.<br />
5. The estimated level <strong>of</strong> impact on Maui’s <strong>dolphins</strong> is 75.5 (95% CI: 12.4–150.7) times the<br />
level <strong>of</strong> PBR. All classes <strong>of</strong> threat had a 30% or greater probability <strong>of</strong> exceeding the PBR in<br />
the absence <strong>of</strong> other <strong>threats</strong>.<br />
6. The panellists’ estimates indicate a 95.7% likelihood <strong>of</strong> population decline over the next<br />
5 years, assuming the agreed maximum population growth rate <strong>of</strong> 1.8% per annum.<br />
7. Population projections assuming the current rate <strong>of</strong> human-induced mortality (i.e. as at the<br />
time <strong>of</strong> the workshop and prior <strong>to</strong> the introduction <strong>of</strong> interim measures) indicate that the<br />
population will decline at 7.6% per annum (95% CI: 13.8% decline <strong>to</strong> 0.1% increase).<br />
8. Residual <strong>risk</strong> <strong>to</strong> Maui’s <strong>dolphins</strong> from setnet fisheries is greatest <strong>of</strong>f the northern Taranaki<br />
coastline out <strong>to</strong> 7 n.m. <strong>of</strong>fshore and close <strong>to</strong> the entrance <strong>of</strong> the Manukau Harbour.<br />
9. Residual <strong>risk</strong> from inshore trawl fisheries remains between the boundary <strong>of</strong> the trawl fishery<br />
closures areas (that extend 2 or 4 n.m. <strong>of</strong>fshore) and 7 n.m. <strong>of</strong>fshore, particularly <strong>to</strong>wards<br />
the centre <strong>of</strong> dolphin distribution (from Raglan Harbour entrance <strong>to</strong> the Kaipara Harbour<br />
entrance.<br />
24 Risk <strong>assessment</strong> <strong>of</strong> <strong>threats</strong> <strong>to</strong> Maui’s <strong>dolphins</strong>
6. Acknowledgements<br />
We would like <strong>to</strong> thank all the workshop participants, particularly the expert panellists:<br />
Dr Rochelle Constantine (University <strong>of</strong> Auckland), Assoc. Pr<strong>of</strong>. Steve Dawson (University <strong>of</strong> otago),<br />
Alistair Dunn (NIWA), Rebecca Hamner (oregon State University), Dr David Middle<strong>to</strong>n (New<br />
Zealand Seafood Industry Council), Assoc. Pr<strong>of</strong>. Liz Slooten (University <strong>of</strong> otago), Dr Barb Taylor<br />
(National Marine Fisheries Service), Dr Leigh Torres (NIWA) and Dr An<strong>to</strong>n van Helden<br />
(Te Papa Tongarewa). The report was improved by the helpful comments <strong>of</strong> Chris Francis (NIWA),<br />
Pr<strong>of</strong>. Andy Read (Duke University) and Richard S<strong>to</strong>klosa (e-Systems). Finally, we would like <strong>to</strong><br />
acknowledge the many DoC and MPI staff that assisted with the workshop and the preparation <strong>of</strong><br />
this report.<br />
7. References<br />
Baker, C.S.; Chilvers, B.L.; Constantine, R.; Du Fresne, S.; Mattlin, R.H.; van Helden, A.; Hitchmough, R. 2010:<br />
Conservation status <strong>of</strong> New Zealand marine mammals (suborders Cetacea and Pinnipedia), 2009. New Zealand<br />
Journal <strong>of</strong> Marine and Freshwater Research 44(2): 101–115.<br />
Berggren, P.; Wade, P.R.; Carlströma, J.; Read, A.J. 2002: Potential limits <strong>to</strong> anthropogenic mortality for harbour<br />
porpoises in the Baltic region. Biological Conservation 103: 313–322<br />
Burgman, M.A.; Akçakaya, H.R.; Ferson, S. 1993: Risk <strong>assessment</strong> in conservation biology. Chapman and Hall,<br />
London. 314 p.<br />
Burnham, K.P.; Anderson, D.R. 2002: Model selection and multi-model inference: a practical information-theoretic<br />
approach (Second ed.). Springer-Verlag, New York. 496 p.<br />
Carroll, e.L.; Childerhouse, S.J.; Fewster, R.M.; Patenaude, N.J.; Steel, D.; Dunshea, G.; Boren, L.; Baker, C.S. 2011:<br />
Updated abundance and estimate <strong>of</strong> rate <strong>of</strong> increase for the New Zealand southern right whale. Report <strong>to</strong> the<br />
International Whaling Commission. SC/S11/RW20.<br />
Chao, A. 1989: Estimating population size for sparse data in capture-recapture experiments. Biometrics 4: 126–135.<br />
Childerhouse, S.; Rayment, W.; Webster, T.; Scali, S.; du Fresne, S.D. 2008: Offshore aerial survey <strong>of</strong> Maui’s dolphin<br />
distribution 2008. <strong>Department</strong> <strong>of</strong> Conservation, Auckland Conservancy Office, New Zealand (unpublished). 6 p.<br />
Courchamp, F.; Berec, L.; Gascoigne, J. 2008: Allee effects in ecology and conservation. Oxford University Press,<br />
oxford, U.K. 256 p.<br />
Dawson, S.M. 2008: Cephalorhynchus <strong>dolphins</strong> C. heavisidii, C. eutropia, C. hec<strong>to</strong>ri,and C. commersonii. Pp. 191–196<br />
in Perrin, W.F.; Wursig, B.; Thewissen, J.G.M. (eds): encyclopedia <strong>of</strong> marine mammals. Academic Press, San<br />
Diego.<br />
Davies, N.M.; Bian, R.; Starr, P.; Lallemand, P.; Gilbert, D.; McKenzie, J. 2008: Risk analysis for Hec<strong>to</strong>r’s dolphin and<br />
Maui’s dolphin subpopulations <strong>to</strong> commercial set net fishing using a temporal-spatial age-structured model.<br />
Ministry <strong>of</strong> Fisheries, Welling<strong>to</strong>n. 113 p.<br />
Del Bianco, D.; De Albernaz, J.R.; Tavares, D.; Fernandes, H.; Jardim, P.G.; Da Silva, L.G.P.; Ne<strong>to</strong>, A.A.d.; Ne<strong>to</strong>, D.D.;<br />
Beltrane, D. Jr 2011: Semi-quantitative <strong>risk</strong> analysis. United States Patent: 8050933 B2.<br />
DoC (<strong>Department</strong> <strong>of</strong> Conservation) 2012: Hec<strong>to</strong>r’s and Maui’s <strong>dolphins</strong> incident database. <strong>Department</strong> <strong>of</strong><br />
Conservation, Welling<strong>to</strong>n.<br />
Du Fresne, S.; Burns, D.; Gates, e. 2012: An updated, annotated bibliography for Hec<strong>to</strong>r’s (Cephalorhynchus hec<strong>to</strong>ri<br />
hec<strong>to</strong>ri) and Maui’s (C. hec<strong>to</strong>ri maui) <strong>dolphins</strong>. DOC Research and Development Series 332. <strong>Department</strong> <strong>of</strong><br />
Conservation, Welling<strong>to</strong>n. 47 p.<br />
Ferreira, S.M.; Roberts, C.C. 2003: Distribution and abundance <strong>of</strong> Maui’s <strong>dolphins</strong> (Cephalorhynchus hec<strong>to</strong>ri maui)<br />
along the North Island west coast, New Zealand. DOC Science Internal Series 93. <strong>Department</strong> <strong>of</strong> Conservation,<br />
Welling<strong>to</strong>n. 19 p.<br />
Filippi, D.; Waugh, S.; Nichol, S. 2010; Revised spatial indica<strong>to</strong>rs for seabird interactions with longline fisheries in the<br />
western and central pacific. Unpublished report (WCPFC-SC6-2010-EB-IP-01) prepared for the Western and<br />
Central Pacific Fisheries Commission.<br />
Risk <strong>assessment</strong> <strong>of</strong> <strong>threats</strong> <strong>to</strong> Maui’s <strong>dolphins</strong><br />
25
Franklin, I.R. 1980: Evolutionary change in small populations. Pp. 135–150 in Soulé, M.E.; Wilcox, B.A. (Eds):<br />
Conservation biology: an evolutionary-ecological perspective. Sineauer Associates, Sunderland, Massachusetts.<br />
Gerrodette, T.; Taylor, B.L.; Swift, R.; Rankin, S.; Jaramillo-Legorreta, A.M.; Rojas-Bracho, L. 2011: A combined visual<br />
and acoustic estimate <strong>of</strong> 2008 abundance, and change in abundance since 1997, for the vaquita, Phocoena sinus.<br />
Marine Mammal Science 27(2): e79–e100.<br />
Griffiths, S.P.; Brewer, D.T.; Heales, D.S.; Mil<strong>to</strong>n, D.A.; S<strong>to</strong>butzki, I.C. 2006: Validating ecological <strong>risk</strong> <strong>assessment</strong>s<br />
for fisheries: assessing the impacts <strong>of</strong> turtle excluders devices on elasmobranch bycatch populations in an<br />
Australian trawl fishery. Marine and Freshwater Research 57(4): 395–401.<br />
Hamner, R.M.; oremus, M.; Stanley, M.; Brown, P.; Constantine, R.; Baker, C.S.<br />
2012a: estimating the abundance and effective population size <strong>of</strong> Maui’s <strong>dolphins</strong> using microsatellite genotypes in<br />
2010–11, with retrospective matching <strong>to</strong> 2001–07. <strong>Department</strong> <strong>of</strong> Conservation, Auckland. 44 p.<br />
Hamner, R.M.; Pichler, F.P.; Heimerier, D.H.; Constantine, R.; Baker, C.S. 2012b: Genetic differentiation and limited<br />
gene flow among fragmented populations <strong>of</strong> New Zealand endemic Hec<strong>to</strong>r’s and Maui’s <strong>dolphins</strong>. Conservation<br />
Genetics. DOI 10.1007/s10592-012-0347-9.<br />
Hill, D.; Dubey, J.P. 2002: Toxoplasma gondii: transmission, diagnosis and prevention. Clinical Microbiology and<br />
Infection 8(10): 634–640.<br />
Hobday, A.J. 2004: Ecological <strong>risk</strong> <strong>assessment</strong> for Australian Commonwealth Fisheries final report stage 1 hazard<br />
identification and preliminary <strong>risk</strong> <strong>assessment</strong>. Report R01/0934 for the Australian Fisheries Management<br />
Authority, Canberra: 172 pp.<br />
Hobday, A.J.; Smith, A.; Webb, H.; Daley, R.; Wayte, S.; Bulman, C.; Dowdney, J.; Williams, A.; Sporcic, M.;<br />
Dambacher, J.; Fuller, M.; Walker, T. 2007: Ecological <strong>risk</strong> <strong>assessment</strong> for effects <strong>of</strong> fishing: Methodology.<br />
Report R04/1072 for the Australian Fisheries Management Authority, Canberra: 174 p.<br />
IUCN (International Union for the Conservation <strong>of</strong> Nature) 2012: The IUCN Red List <strong>of</strong> threatened species. Version<br />
2012.1. . Downloaded on 22 August 2012.<br />
Jaramillo-Legorreta, A.; Rojas-Bracho, L.; Brownell, R.L. Jr; Read, A.J.; Reeves, R.R.; Ralls, K.; Taylor, B.L. 2007:<br />
Saving the vaquita: immediate action, not more data. Conservation Biology 21(6): 1653–1655.<br />
Jefferson, T.A.; Leatherwood, S.; Webber, M.A. 1993: FAO species identification guide: marine mammal species <strong>of</strong> the<br />
World. Food and Agriculture organization <strong>of</strong> the United Nations, Rome. 320p. http://www.fao.org/<br />
Jenner, C.; Jenner, M.; Bur<strong>to</strong>n, C.; Sturrock, V.; Salgado Kent, C.; Morrice, M.; Attard, C.; Moller, L.; Double, M.C.<br />
2008: Mark recapture analysis <strong>of</strong> pygmy blue whales from the Perth Canyon, Western Australia 2000–2005.<br />
Paper submitted for consideration by the IWC Scientific Committee SC/60/SH16. SC/60/SH16. 9 p.<br />
Kerns, B.K.; Ager, A. 2007: Risk <strong>assessment</strong> for biodiversity conservation planning in Pacific Northwest forests.<br />
Forest Ecology and Management 246: 38–44.<br />
Macguire, L.A. 2004: What can decision analysis do for invasive species management? Risk Analysis 24: 859–868.<br />
MFish (Ministry <strong>of</strong> Fisheries); DoC (<strong>Department</strong> <strong>of</strong> Conservation) 2007: Hec<strong>to</strong>r’s dolphin threat management plan.<br />
Ministry <strong>of</strong> Fisheries and <strong>Department</strong> <strong>of</strong> Conservation. 154 p.<br />
Miller, e.; Lalas, C.; Dawson, S.; Hiltrun, R.; Slooten, e. in press: Hec<strong>to</strong>r’s dolphin diet: the species, sizes and relative<br />
importance <strong>of</strong> prey eaten by Cephalorhynchus hec<strong>to</strong>ri, investigated using s<strong>to</strong>mach content analysis. Marine<br />
Mammal Science.<br />
Mil<strong>to</strong>n, D.A. 2001: Assessing the susceptibility <strong>to</strong> fishing <strong>of</strong> populations <strong>of</strong> rare trawl bycatch: sea snakes caught by<br />
Australia’s Northern Prawn Fishery. Biological Conservation 101: 281–290.<br />
MPI (Ministry for Primary Industries); DoC (<strong>Department</strong> <strong>of</strong> Conservation) 2012: Maui’s dolphin Threat Management<br />
Plan discussion document. Ministry for Primary Industries and <strong>Department</strong> <strong>of</strong> Conservation, Welling<strong>to</strong>n. 217 p.<br />
oremus, M.; Hamner, R.M.; Stanley, M.; Brown, P.; Baker, C.S.; Constantine, R. in press: Distribution, group<br />
characterisitics and movements <strong>of</strong> the critically endangered Maui’s dolphin (Cephalorhynchus hec<strong>to</strong>ri maui).<br />
Endangered Species Research.<br />
Perrin, W.F.; Würsig, B.; Thewissen, J.G.M. (Eds) 2008: Encyclopedia <strong>of</strong> marine mammals. Second Edition. Academic<br />
Press, San Diego.<br />
Rayment, W.; du Fresne, S.D. 2007: <strong>of</strong>fshore aerial survey <strong>of</strong> Maui’s dolphin distribution 2007. Auckland<br />
Conservancy, <strong>Department</strong> <strong>of</strong> Conservation (unpublished). 6 p.<br />
Rayment, W.; Dawson, S.; Slooten, e.; Childerhouse, S. 2006: <strong>of</strong>f shore distribution<strong>of</strong> Hec<strong>to</strong>r’s dolphin at Banks<br />
Peninsula. DOC Research & Development Series 232. <strong>Department</strong> <strong>of</strong> Conservation, Welling<strong>to</strong>n. 23 p.<br />
26 Risk <strong>assessment</strong> <strong>of</strong> <strong>threats</strong> <strong>to</strong> Maui’s <strong>dolphins</strong>
Rayment, W.; Dawson, S.; Slooten, L.; Brager, S.; du Fresne, S.; Webster, T. 2009: Kernel density estimates <strong>of</strong> alongshore<br />
home range <strong>of</strong> Hec<strong>to</strong>r’s <strong>dolphins</strong> at Banks Peninsula, New Zealand. Marine Mammal Science 25(3): 537–556.<br />
Read, A.J.; Drinker, P.; Northridge, S. 2006: Bycatch <strong>of</strong> marine mammals in U.S. and global fisheries. Conservation<br />
Biology 20(1): 163–169.<br />
Reeves, R.R.; Dawson, S.M.; Jefferson, T.A.; Karczmarski, L.; Laidre, K.; o’Corry-Crowe, G.; Rojas-Bracho, L.; Secchi,<br />
e.R.; Slooten, e.; Smith, B.D.; Wang, J.Y.; Zhou, K. 2000: Cephalorhynchus hec<strong>to</strong>ri ssp. maui. In: IUCN 2012.<br />
IUCN Red List <strong>of</strong> threatened species. Version 2012.1. . Downloaded on 22 August 2012.<br />
Richard, Y.; Abraham, e.R.; Filippi, D. 2011: Assessment <strong>of</strong> the <strong>risk</strong> <strong>to</strong> seabird populations from New Zealand<br />
commercial fisheries. Final Research Report for Ministry <strong>of</strong> Fisheries projects IPA2009/19 and IPA2009/20<br />
(unpublished report held by the Ministry for Primary Industries, Welling<strong>to</strong>n). 66 p.<br />
Scali, S. 2006: Use <strong>of</strong> harbours by the critically endangered species Maui’s dolphin (Cephalorhynchus hec<strong>to</strong>ri maui).<br />
<strong>Department</strong> <strong>of</strong> Conversation, Auckland Conservancy Office, New Zealand (unpublished). 28 p.<br />
Sharp, B.R.; Parker, S.J.; Smith, N. 2009: An impact <strong>assessment</strong> framework for bot<strong>to</strong>m fishing methods in the<br />
CAMLR Convention area. CCAMLR Science 16: 195–210.<br />
Sharp, B.R.; Waugh, S.M.; Walker, N.A. 2011. A <strong>risk</strong> <strong>assessment</strong> framework for incidental seabird mortality associated<br />
with New Zealand fishing in the New Zealand EEZ. Unpublished report held by the Ministry for Primary<br />
Industries, Welling<strong>to</strong>n.<br />
Slooten, e. 1991: Age, growth, and reproduction in Hec<strong>to</strong>r’s <strong>dolphins</strong>. Canadian Journal <strong>of</strong> Zoology 69: 1689–1700.<br />
Slooten, e.; Lad, F. 1991: Population biology and conservation <strong>of</strong> Hec<strong>to</strong>r’s dolphin. Canadian Journal <strong>of</strong> Zoology 69:<br />
1701–1707.<br />
Slooten, e. 2007: Conservation management in the face <strong>of</strong> uncertainty: effectiveness <strong>of</strong> four options for managing<br />
Hec<strong>to</strong>r’s dolphin bycatch. Endangered Species Research 3: 169–179.<br />
Slooten, e.; Dawson, S.M. 2010: Assessing the effectiveness <strong>of</strong> conservation management decisions: likely effects <strong>of</strong><br />
new protection measures for Hec<strong>to</strong>r’s dolphin. Aquatic Conservation: Marine and Freshwater Ecosystems 20:<br />
334–347.<br />
Slooten, e.; Davies, N. 2012: Hec<strong>to</strong>r’s dolphin <strong>risk</strong> <strong>assessment</strong>s: old and new analyses show consistent results. Journal<br />
<strong>of</strong> the Royal Society <strong>of</strong> New Zealand 42(1): 49–60.<br />
Slooten, e.; Dawson, S.M.; Rayment, W.J.; Childerhouse, S.J. 2005: Distribution <strong>of</strong> Maui’s dolphin, Cephalorhynchus<br />
hec<strong>to</strong>ri maui. New Zealand Fisheries Assessment Report, 2005/28.<br />
Slooten, e.; Dawson, S.M.; Rayment, W.J.; Childerhouse, S.J. 2006: A new abundance estimate for Maui’s dolphin:<br />
what does it mean for managing this critically endangered species? Biological Conservation 128(4): 576–581.<br />
Smith, A.D.M.; Ful<strong>to</strong>n, E.J.; Hibday, A.J.; Smith, D.C.; Shoulder, P. 2007: Scientific <strong>to</strong>ols <strong>to</strong> support the practical<br />
implementation <strong>of</strong> ecosystem-based fisheries management. ICES Journal <strong>of</strong> Marine Science 64: 633–639.<br />
Stanley, M. 2009: Maui’s winter <strong>of</strong>fshore aerial survey June/July 2009. Auckland Conservancy, <strong>Department</strong> <strong>of</strong><br />
Conservation, (unpublished). 10 p.<br />
Stephens, P.A.; Sutherland, W.J.; Freckle<strong>to</strong>n, R.P. 1999: What is the Allee effect? Oikos 87: 185–190.<br />
S<strong>to</strong>butzki, I.; Miller, M.; Brewer, D. 2001: Sustainability <strong>of</strong> fishery bycatch: a process for assessing highly diverse and<br />
numerous bycatch. Environmental Conservation 28(2): 167–181.<br />
Thompson, K. 2012: Maui’s and mining: a review <strong>of</strong> marine mineral mining activity on the west coast <strong>of</strong> New Zealand and<br />
its potential impacts. Unpublished report prepared for Auckland Conservancy, <strong>Department</strong> <strong>of</strong> Conservation. 43 p.<br />
Turvey, S.T. et al. 2007: First human-caused extinction <strong>of</strong> a cetacean species? Biology Letters 3: 537–540.<br />
US ePA (US environmental Protection Agency) 1992: A framework for ecological <strong>risk</strong> <strong>assessment</strong>. Document<br />
EPA/630/R-92/001. Risk Assessment Forum, U.S. Environmental Protection Agency, Washing<strong>to</strong>n, DC. 41 p.<br />
US EPA (US Environmental Protection Agency) 1998: Guidelines for ecological <strong>risk</strong> <strong>assessment</strong>. Document EPA/630/<br />
R-95/002F. Risk Assessment Forum, U.S. Environmental Protection Agency, Washing<strong>to</strong>n, DC. 188 p.<br />
Wade, P.R. 1998: Calculating limits <strong>to</strong> the allowable human-induced mortality <strong>of</strong> cetaceans and pinnipeds. Marine<br />
Mammal Science 14: 1–37.<br />
Wade, P.R.; Reeves, R.R.; Mesnick, S.L. 2012: Social and behavioural fac<strong>to</strong>rs in cetacean responses <strong>to</strong> overexploitation:<br />
are odon<strong>to</strong>cetes less ‘resilient’ than mysticetes? Journal <strong>of</strong> Marine Biology: doi: 10.1155/2012/567276.<br />
Zhou, S.; Griffiths, S.P.; Miller, M. 2009: Sustainability <strong>assessment</strong> for fishing effects (SAFE) on highly diverse and<br />
data-limited fish bycatch in a tropical prawn trawl fishery. Marine and Freshwater Research 60: 563–570.<br />
Risk <strong>assessment</strong> <strong>of</strong> <strong>threats</strong> <strong>to</strong> Maui’s <strong>dolphins</strong><br />
27
Appendix 1<br />
The Potential Biological Removal (PBR)<br />
and probability <strong>of</strong> decline for Maui’s<br />
dolphin<br />
Paul R. Wade 1 , Rebecca M. Hamner 2 , Rochelle Constantine 3 and C. Scott Baker 2,3<br />
1 National Marine Mammal Labora<strong>to</strong>ry, Alaska Fisheries Science Center, National Marine<br />
Fisheries Service, 7600 Sand Point Way NE, Seattle, WA 98155 USA<br />
email: Paul.Wade@noaa.gov<br />
2 Marine Mammal Institute and <strong>Department</strong> <strong>of</strong> Fisheries and Wildlife, oregon State University,<br />
Hatfield Marine Science Center, 2030 SE Marine Science Drive, Newport, OR 97365 USA<br />
3 Molecular ecology and evolution Labora<strong>to</strong>ry, School <strong>of</strong> Biological Sciences, University <strong>of</strong><br />
Auckland, Auckland, New Zealand<br />
Background<br />
Maui’s dolphin (Cephalorhynchus hec<strong>to</strong>ri maui; a subspecies <strong>of</strong> Hec<strong>to</strong>r’s and Maui’s dolphin,<br />
Cephalorhynchus hec<strong>to</strong>ri) is classified as ‘critically endangered’ by the International Union<br />
for the Conservation <strong>of</strong> Nature (IUCN 2009) and ‘nationally critical’ under the New Zealand<br />
Threat Classification Scheme (Baker et al. 2010). Maui’s <strong>dolphins</strong> are thought <strong>to</strong> once have been<br />
widely distributed along the west coast <strong>of</strong> the North Island (du Fresne 2010). Based on records<br />
<strong>of</strong> strandings and sightings (Dawson et al. 2001), this distribution has apparently contracted<br />
over the last 100 years. Since 1970, when systematic collection <strong>of</strong> stranding records began, the<br />
distribution <strong>of</strong> strandings has been concentrated along the northwestern coast from Dargaville in<br />
the north <strong>to</strong> Whanganui in the south. Within this limited range, the distribution has contracted<br />
further over the last three decades (Dawson et al. 2001). Surveys <strong>of</strong> Maui’s <strong>dolphins</strong> since the<br />
late 1990s have reported the large majority <strong>of</strong> sightings along only 40 km <strong>of</strong> coastline from the<br />
Manakau Harbour <strong>to</strong> Port Waika<strong>to</strong> (Slooten et al. 2006; du Fresne 2010). Previous estimates <strong>of</strong><br />
abundance from small-boat and aerial surveys vary from 75 <strong>to</strong> 140 individuals, with relatively<br />
large confidence intervals (Table 1; Dawson & Slooten 1988; Martien et al. 1999; Ferreira &<br />
Roberts 2003; Slooten et al. 2006).<br />
Here we present a calculation <strong>of</strong> the Potential Biological Removal (PBR) and probability <strong>of</strong><br />
decline based on estimates <strong>of</strong> abundance from genotype capture-recapture models using biopsy<br />
samples from living <strong>dolphins</strong> collected from 2001 <strong>to</strong> 2011 and previous estimates from aerial<br />
and vessel surveys. Unlike the previous sighting surveys <strong>of</strong> Maui’s <strong>dolphins</strong>, the biopsy-based<br />
genotyping allowed for the accumulation <strong>of</strong> capture records over time, providing estimates<br />
<strong>of</strong> trends in abundance through open-population models. As reported in detail in Hamner<br />
et al. (2012), biopsy samples collected by the University <strong>of</strong> Auckland during surveys in 2001 <strong>to</strong><br />
2006 were augmented with samples collected during more intensive surveys in 2010 and 2011,<br />
conducted in collaboration between the New Zealand <strong>Department</strong> <strong>of</strong> Conservation (DoC), the<br />
University <strong>of</strong> Auckland and the Marine Mammal Institute <strong>of</strong> oregon State University. Based<br />
on the intensive sampling in 2010 and 2011, the abundance <strong>of</strong> Maui’s <strong>dolphins</strong> was estimated<br />
<strong>to</strong> be 55 (95% CL: 48 <strong>to</strong> 69), using a two-sample, closed-population model. Across the entire<br />
10 year study (i.e. 2001–11), annual survival was estimated <strong>to</strong> be 84% (95% CL: 75% <strong>to</strong> 90%) and<br />
population decline was estimated <strong>to</strong> be –2.8% per year (95% CL: –10.5% <strong>to</strong> +5.6%), based on a<br />
Pradel Survival and Lambda model (Hamner et al. 2012).<br />
28 Risk <strong>assessment</strong> <strong>of</strong> <strong>threats</strong> <strong>to</strong> Maui’s <strong>dolphins</strong>
Potential Biological Removal<br />
Wade (1998) developed a method for calculating a threshold for human-related mortality for<br />
marine mammal populations. This development was driven, in large part, by amendments <strong>to</strong><br />
the US Marine Mammal Protection Act (MMPA) in 1994. These specified the use <strong>of</strong> a Potential<br />
Biological Removal (PBR) scheme for managing human-related mortality, particularly incidental<br />
mortality (‘by catch’) in commercial fisheries (Wade & Angliss 1997). The PBR scheme calculates<br />
a threshold for the number <strong>of</strong> allowable takes using an estimate <strong>of</strong> abundance for the population<br />
subject <strong>to</strong> the mortality and a standard ‘recovery fac<strong>to</strong>r’ developed through population<br />
simulations. The ‘standard’ PBR is calculated <strong>to</strong> achieve the management goal <strong>of</strong> allowing<br />
populations <strong>to</strong> stay above, or recover <strong>to</strong>, their Maximum Net Productivity Level (generally taken<br />
<strong>to</strong> be between 50% and 80% <strong>of</strong> carrying capacity). Wade (1998) also proposed an alternative take<br />
threshold based on a more conservative recovery fac<strong>to</strong>r chosen <strong>to</strong> allow populations <strong>to</strong> recover<br />
(increase) at a rate close <strong>to</strong> their intrinsic (or biological) maximum (Rmax). This lower threshold<br />
has been adopted in the US as the PBR for populations listed as endangered under the US<br />
endangered Species Act (eSA).<br />
The endangered Species PBR (using a recovery fac<strong>to</strong>r <strong>of</strong> 0.1) was calculated based on the criterion<br />
that time <strong>to</strong> recovery (<strong>to</strong> the Maximum Net Productivity Level) should not be delayed by more<br />
than 10%. However, the model used for the PBR calculations is implicitly deterministic and thus<br />
does not account for the increased threat <strong>of</strong> extinction through s<strong>to</strong>chastic processes that could<br />
be caused by human-related mortality in very small populations. Additionally, the model used<br />
for the PBR calculations does not incorporate depensation or ‘Allee’ effects, which can increase<br />
extinction <strong>risk</strong> in very small populations (Stephens et al. 1999). For these reasons, in the case<br />
<strong>of</strong> small populations, Wade (1998) notes that a Population Viability Analysis (PVA) should be<br />
used <strong>to</strong> model very small populations and evaluate extinction <strong>risk</strong> from human-related mortality<br />
and s<strong>to</strong>chastic fac<strong>to</strong>rs. In the US, some eSA-listed species have human-related mortality limits<br />
that are set <strong>to</strong> lower values than those calculated by the PBR for endangered species, based on<br />
consideration <strong>of</strong> the s<strong>to</strong>chastic extinction <strong>risk</strong> and other <strong>risk</strong> fac<strong>to</strong>rs. Therefore, it should be<br />
unders<strong>to</strong>od that the PBR can be used <strong>to</strong> set limits for human-related mortality that should have a<br />
minimal impact on a population <strong>of</strong> an endangered species, all other fac<strong>to</strong>rs being equal. In other<br />
words, such a population will have a similar probability <strong>of</strong> growth or decline as a comparable<br />
population in which there is no human-related mortality. Because <strong>of</strong> s<strong>to</strong>chastic <strong>risk</strong>s, however,<br />
the endangered Species PBR does not represent a threshold above which extinction is certain, or<br />
below which survival is assured, and it should not be interpreted in that way.<br />
With these caveats in mind, we have revised the PBR previously calculated by Slooten et al.<br />
(2006) from the 2004 aerial surveys. From the estimate <strong>of</strong> N = 111, Slooten et al. (2006)<br />
calculated a PBR <strong>of</strong> 0.16 (or one dolphin every 6.4 years). For the genotype capture-recapture<br />
analysis, 2010–11 abundance was estimated <strong>to</strong> be N = 55, with a CV <strong>of</strong> 0.152 (Hamner et al. 2012,<br />
Table 1). Using a value <strong>of</strong> 0.04 for Rmax (the default value recommended for dolphin populations<br />
by Wade (1998) and the value used under the US MMPA) and a recovery fac<strong>to</strong>r value <strong>of</strong> 0.1, the<br />
endangered Species PBR was calculated <strong>to</strong> be 0.10, or 1 dolphin every 10 years. Further, Slooten<br />
& Lad (1991) estimated Rmax for Hec<strong>to</strong>r’s <strong>dolphins</strong> as 0.018, considerably lower than the default<br />
Rmax value <strong>of</strong> 0.04. Using this lower value <strong>of</strong> 0.018, the Endangered Species PBR for Maui’s<br />
dolphin is 0.044, or 1 dolphin every 23 years.<br />
Probability <strong>of</strong> decline<br />
Trend from the Pradel model<br />
Hamner et al. (2012) fit a Pradel Survival and Lambda model <strong>to</strong> the capture his<strong>to</strong>ries for Maui’s<br />
dolphin for the years 2001–11. From this, the rate <strong>of</strong> growth (referred <strong>to</strong> as Lambda) was<br />
estimated <strong>to</strong> be 0.972 (SE: 0.041), which represents a population decline <strong>of</strong> –2.8% per year<br />
(95% CI: –10.5% <strong>to</strong> +5.6%). The decline is not significant at the p = 0.05 level, which is not<br />
Risk <strong>assessment</strong> <strong>of</strong> <strong>threats</strong> <strong>to</strong> Maui’s <strong>dolphins</strong><br />
29
Table A1.1. estimates <strong>of</strong> abundance (N), and associated 95% confidence limits (Cl), for Maui’s<br />
<strong>dolphins</strong>, based on small-boat surveys, aerial sighting surveys and genotype capture-recapture<br />
(gCr)<br />
reFerenCe SurVey ApplICAble N CI CI<br />
MeThod yeAr(S) lower upper<br />
dawson & Slooten 1988 Small boat strip transect 1985 134 n.a. n.a.<br />
Martien et al. 1999 Small boat strip transect 1985* 140 46 280<br />
russell 1999 Small boat 1998 80 n.a. n.a.<br />
Ferreira & roberts 2003 Aerial line transect 2001/02 75 48 130<br />
baker et al. 2012 Small boat gCr 2002 † 69 52 100<br />
Slooten et al. 2006 Aerial line transect 2004 111 48 252<br />
hamner et al. 2012 Small boat gCr 2010/11 ‡ 55 48 69<br />
* The estimate and confidence intervals in Martien et al. (1999) were recalculated from the sightings reported in dawson & Slooten<br />
(1988); i.e. these are not independently derived.<br />
† Calculated here with a two-sample, closed-population model using genotype capture-recapture from samples collected in the<br />
years 2001 and 2003, as reported by C.S. baker et al. (unpubl. data).<br />
‡ The estimate and confidence intervals do not include two individuals identified as migrant hec<strong>to</strong>r’s <strong>dolphins</strong>, based on genotype<br />
population assignment.<br />
surprising given the relatively sparse capture-recapture records data (e.g. there were more than<br />
10 identifications in only 4 years) and the short length <strong>of</strong> time available <strong>to</strong> establish a trend.<br />
However, these results, and independent evidence from the apparent contraction <strong>of</strong> the Maui’s<br />
dolphin range (Dawson et al. 2001), suggest the population was declining during this period and<br />
over the previous several decades. A Bayesian interpretation <strong>of</strong> the results for Lambda (assuming<br />
an uninformative prior distribution) from the 2001–11 capture-recapture analysis would be that<br />
there is a 75.3% probability the population is declining. This probability was calculated from the<br />
cumulative probability <strong>of</strong> Lambda being < 1.0, under the assumption <strong>of</strong> a normal distribution with<br />
a mean <strong>of</strong> 0.972 and a Se <strong>of</strong> 0.041.<br />
Trend from all available abundance estimates, 1985–2011<br />
Given that there was an abundance survey in 1985 (Dawson & Slooten 1988; Martien et al. 1999),<br />
it is possible <strong>to</strong> examine the trend in the population from 1985 until 2011, providing a much longer<br />
time-period over which <strong>to</strong> potentially document a trend. Hamner et al. (2012) provide a two-sample<br />
Lincoln-Petersen estimate <strong>of</strong> abundance for 2010–11. Examining the genotype capture his<strong>to</strong>ries<br />
for 2001–06, as reported in Baker et al. (in press), there are two other years that have more than<br />
10 identifications in a year—2001 and 2003. In these 2 years there were 21 identifications in 2001,<br />
18 in 2003, with 5 individuals seen in both years. Using the same methods as Hamner et al. (2012),<br />
the two-sample estimate for 2001–03 is N = 69 (95% CI: 52–100). Other surveys that estimated<br />
abundance occurred in 1998 (Russell 1999), 2001–02 (Ferreira & Roberts 2003), and 2004<br />
(Slooten et al. 2006) (Table A1.1). The various surveys were conducted using different methods.<br />
However, all <strong>of</strong> the surveys covered the current longitudinal range <strong>of</strong> Maui’s <strong>dolphins</strong>.<br />
A trend analysis was conducted using abundance estimates assigned <strong>to</strong> the years 1985 (Martien<br />
et al. 1999), 1998 (Russell 1999), 2001.5 (a midpoint chosen <strong>to</strong> reflect data collection spanning<br />
multiple years, in this case data from 2001–02, Ferreira & Roberts 2003), 2002 (data from 2001–<br />
03, as reported by Baker et al. (2012), recalculated here with Lincoln-Petersen genotype capturerecapture),<br />
2004 (Slooten et al. 2006), and 2010.5 (midpoint for data collected from 2010–11,<br />
Hamner et al. 2012). Using a linear regression on the natural logarithm <strong>of</strong> abundance, the trend<br />
from these six abundance estimates is –3.2% per year (90% CL: –5.7% <strong>to</strong> –0.6%) for the time<br />
period 1985 <strong>to</strong> 2011. This estimated trend is significantly different from 0.0 at the alpha = 0.05 level<br />
(p-value = 0.029, one-sided test). A Bayesian linear regression with uninformative conjugate prior<br />
distributions on the parameters gives identical results <strong>to</strong> a maximum likelihood linear regression<br />
analysis. Therefore, in a Bayesian framework, this can be interpreted as a 97.1% probability that<br />
30 Risk <strong>assessment</strong> <strong>of</strong> <strong>threats</strong> <strong>to</strong> Maui’s <strong>dolphins</strong>
the trend from these abundance estimates was less than zero. This suggests that the population<br />
may have been declining over a longer time period (since 1985) than documented by the genotype<br />
capture-recapture analysis (2001 <strong>to</strong> 2011).<br />
Given that aerial surveys went further <strong>of</strong>fshore than the small boat surveys, it is conceivable that the<br />
aerial survey estimates could include more animals and, therefore, not be strictly comparable <strong>to</strong> the<br />
boat-based estimates (sighting and capture-recapture). Therefore, we repeated the analysis above <strong>to</strong><br />
re-calculate the trend using only the four abundance estimates from boat surveys, in the years 1985,<br />
1998, 2002, and 2010.5. The estimated trend from those four estimates is –3.7% per year (90% CI:<br />
–4.2% <strong>to</strong> –3.2%) for the time period 1985 <strong>to</strong> 2011. The probability that the trend is less than 0.0 is<br />
~1.0. This is very similar <strong>to</strong> the estimate that included the aerial surveys, suggesting the population<br />
has been declining over this time period. Despite differences in methods between the surveys<br />
the trend appears consistent <strong>to</strong> that from Hamner et al (2012) where survey methodology was<br />
consistent, therefore the results here are broadly indicative <strong>of</strong> a declining population irrespective <strong>of</strong><br />
differences in methodology.<br />
Acknowledgements<br />
We sincerely thank Rohan Currey, Ministry for Primary Industries; Phil Brown and Laura Boren,<br />
<strong>Department</strong> <strong>of</strong> Conservation, for helpful comments and suggestions.<br />
Literature cited<br />
Baker, C.S.; Chilvers, B.L.; Constantine, R.; du Fresne, S.; Mattlin, R.H.; van Helden, A.; Hitchmough, R. 2010.<br />
Conservation status <strong>of</strong> New Zealand marine mammals (suborders Cetacea and Pinnipedia), 2009. New Zealand<br />
Journal <strong>of</strong> Marine and Freshwater Research 44: 101–115.<br />
Baker, C.S.; Hamner, R.M.; Cooke, J.; Heimeier, D.; Vant, M.; Steel, D.; Constantine, R. (2012): Low abundance and<br />
probable decline <strong>of</strong> the critically endangered Maui’s dolphin estimated by genotype capture–recapture. Animal<br />
Conservation. doi:10.1111/j.1469-1795.2012.00590.x.<br />
Dawson, S.; Russell, K.; Pichler, F.B.; Slooten, L.; Baker, C.S. 2001: The North Island Hec<strong>to</strong>r’s dolphin is vulnerable<br />
<strong>to</strong> extinction. Marine Mammal Science 17: 366–371.<br />
Dawson, S.M.; Slooten, E. 1988: Hec<strong>to</strong>r’s dolphin: Cephalorhynchus hec<strong>to</strong>ri: distribution and abundance. Pp. 315–324<br />
in: Brownell, R.L. Jr; Donovan, G.P. (eds): Biology <strong>of</strong> the genus Cephalorhynchus. Reports <strong>of</strong> the International<br />
Whaling Commission, Cambridge.<br />
du Fresne, S. 2010: Distribution <strong>of</strong> Maui’s <strong>dolphins</strong> (Cephalorhynchus hec<strong>to</strong>ri maui), 2000–2009. DOC Research<br />
and Development Series 322, <strong>Department</strong> <strong>of</strong> Conservation, Welling<strong>to</strong>n. 47 p.<br />
Ferreira, S.M.; Roberts, C.C. 2003: Distribution and abundance <strong>of</strong> Maui’s <strong>dolphins</strong> (Cephalorhynchus hec<strong>to</strong>ri maui)<br />
along the North Island West Coast, New Zealand. DOC Internal Series 93, <strong>Department</strong> <strong>of</strong> Conservation,<br />
Welling<strong>to</strong>n.<br />
Hamner, R.M.; oremus, M.; Stanley, M.; Brown, P.; Constantine, R.; Baker, C.S. 2012. estimating the abundance<br />
and effective population size <strong>of</strong> Maui’s <strong>dolphins</strong> using microsatellite genotypes in 2010–11, with retrospective<br />
matching <strong>to</strong> 2001–07. Auckland Conservancy, <strong>Department</strong> <strong>of</strong> Conservation, Auckland. Available at http://<br />
www.doc.govt.nz/upload/documents/conservation/native-animals/marine-mammals/mauis-dolphinabundance-estimate-report.pdf.<br />
IUCN (International Union for the Conservation <strong>of</strong> Nature) 2009: The IUCN Red List <strong>of</strong> Threatened Species. http://<br />
redlist.org/apps/redlist/details/2475/0<br />
Martien, K.K.; Taylor, B.L.; Slooten, e.; Dawson, S. 1999: A sensitivity analysis <strong>to</strong> guide research and management for<br />
Hec<strong>to</strong>r’s dolphin. Biological Conservation 90: 183–191.<br />
Russell, K. 1999: The North Island Hec<strong>to</strong>r’s dolphin: a species in need <strong>of</strong> conservation. Unpublished MSc thesis,<br />
School <strong>of</strong> environmental and Marine Sciences, University <strong>of</strong> Auckland, Auckland. 136 p.<br />
Slooten, e.; Dawson, S.; Rayment, W.; Childerhouse, S. 2006: A new abundance estimate for Maui’s dolphin: what<br />
does it mean for managing this critically endangered species? Biological Conservation 128: 576–581.<br />
Slooten, e.; Lad, F. 1991: Population biology and conservation <strong>of</strong> Hec<strong>to</strong>r’s dolphin. Canadian Journal <strong>of</strong> Zoology 69:<br />
1701–1707.<br />
Risk <strong>assessment</strong> <strong>of</strong> <strong>threats</strong> <strong>to</strong> Maui’s <strong>dolphins</strong><br />
31
.<br />
Stephens, P.A.; Sutherland, W.J. 1999: Consequences <strong>of</strong> the Allee effect for behaviour, ecology and conservation.<br />
Trends in Ecology and Evolution 14: 401–405.<br />
Wade, P.R. 1998: Calculating limits <strong>to</strong> the allowable human-caused mortality <strong>of</strong> cetaceans and pinnipeds. Marine<br />
Mammal Science 14: 1–37.<br />
Wade, P.R.; Angliss, R.P. 1997: Guidelines for assessing marine mammal s<strong>to</strong>cks: report <strong>of</strong> the GAMMS Workshop,<br />
April 3–5, 1996. NOAA Technical Memorandum NMFS-OPR-12. 93 p.<br />
32 Risk <strong>assessment</strong> <strong>of</strong> <strong>threats</strong> <strong>to</strong> Maui’s <strong>dolphins</strong>
Appendix 2<br />
Maui’s dolphin distribution and<br />
fishing effort<br />
Finlay N. Thompson and Yvan Richard<br />
Dragonfly Science, PO Box 27535, Welling<strong>to</strong>n 6141, New Zealand<br />
www.dragonfly.co.nz<br />
Introduction<br />
Maui’s <strong>dolphins</strong> (Cephalorhynchus hec<strong>to</strong>ri maui) are endemic <strong>to</strong> the west coast <strong>of</strong> the North<br />
Island, and share the space with inshore fishers, both commercial and recreational. The <strong>dolphins</strong><br />
live close <strong>to</strong> shore and have been observed along the whole west coast, although most recently,<br />
only between Raglan and Kaipara harbours. Most inshore commercial fishing uses setnets and<br />
small trawl nets, and Maui’s <strong>dolphins</strong> have been observed caught in setnets.<br />
This appendix includes information presented <strong>to</strong> the Maui’s dolphin <strong>risk</strong> <strong>assessment</strong> workshop’s<br />
expert panel on Maui’s dolphin distribution, and commercial fishing effort in the area they occupy.<br />
Maui dolphin distribution<br />
A map <strong>of</strong> Maui’s dolphin distribution was developed using information from sightings made<br />
during various systematic surveys <strong>of</strong> Maui’s <strong>dolphins</strong> on the west coast <strong>of</strong> the North Island<br />
(Ferreira & Roberts 2003; Slooten et al. 2005; Scali 2006; Rayment & du Fresne 2007;<br />
Childerhouse et al. 2008; Stanley 2009; Hamner et al. 2012). The distribution was intended <strong>to</strong><br />
describe current knowledge <strong>of</strong> the dolphin’s range and patterns <strong>of</strong> movement. The surveys used <strong>to</strong><br />
develop the distribution are listed in Table A2.1.<br />
Table A2.1. Surveys used <strong>to</strong> develop the distribution <strong>of</strong> Maui’s <strong>dolphins</strong><br />
described in this Appendix.<br />
SurVey SIghTIngS on SIghTIngS oFF ToTAl SIghTIngS<br />
Ferreira 2000/2001 25 25<br />
Ferreira 2001/2002 34 34<br />
Slooten 2004—summer 20 4 24<br />
Slooten 2004—winter 9 4 13<br />
Scali 2006 7 7<br />
rayment 2007 13 4 17<br />
Childerhouse 2008 6 3 9<br />
biopsies 2010 37 37<br />
biopsies 2011 28 28<br />
The distribution was developed by incorporating sightings data in<strong>to</strong> a model. The model estimated<br />
the probability (π) that a dolphin would be seen at a given point. This probability was decomposed<br />
in<strong>to</strong> an alongshore function, da, describing the north-south density, and an <strong>of</strong>fshore function, do,<br />
describing the density <strong>of</strong> Maui’s <strong>dolphins</strong> from the shore out <strong>to</strong> sea.<br />
π(x,y) = do (x), d a(y)<br />
A generalised additive model was used <strong>to</strong> estimate these functions from the survey sightings using<br />
semi-parametric methods (Wood 2004). The survey areas were derived from published records<br />
and from some survey shape files provided (L. Boren, DOC, unpubl. data). A one-n.m. grid was<br />
applied <strong>to</strong> an area that included all the survey areas and, for each grid cell that overlapped a<br />
survey, a record was included in data used <strong>to</strong> fit the model. The number <strong>of</strong> sightings in each cell,<br />
Risk <strong>assessment</strong> <strong>of</strong> <strong>threats</strong> <strong>to</strong> Maui’s <strong>dolphins</strong><br />
33
Yi, was assumed <strong>to</strong> follow a Poisson distribution with a rate, µi, that varied between cells, indicated<br />
by i. Because the extent <strong>of</strong> the observations was published as part <strong>of</strong> survey reporting, we were<br />
able <strong>to</strong> include cells with zero sightings.<br />
A fac<strong>to</strong>r, λs, was added <strong>to</strong> the model <strong>to</strong> account for unknown differences between the various<br />
surveys. In some cases, the observation effort was not uniform. In these cases, a term, Es,i, was<br />
added <strong>to</strong> account for differences in this effort between areas.<br />
Yi ~ Poisson (µi)<br />
log(µi) = do(xi) + da(xi) + log(Es,i) + λs<br />
The model was fit using the MGCV package developed for the R statistical methods system (Wood,<br />
2004). The resulting <strong>of</strong>fshore distribution function is plotted in Fig. A2.1. To test for sensitivity<br />
<strong>to</strong> the models used, data with each <strong>of</strong> the surveys omitted one by one was also used. It is clear<br />
that the general shape does not change when individual surveys are dropped. In Fig. A2.2, the<br />
alongshore distribution shows that the peak area in which Maui’s <strong>dolphins</strong> have been seen is<br />
around Port Waika<strong>to</strong>. This peak is also visible in Figs A2. 3 <strong>to</strong> A2.5. These figures show the derived<br />
Maui’s dolphin distribution.<br />
Offshore distance (n.m.)<br />
Figure A2.1. The relationship between distance <strong>of</strong>fshore and Maui’s dolphin<br />
abundance, created from the survey data. The grey lines on the plot report are the<br />
results from a cross validation <strong>of</strong> the model. each line is created by running the<br />
model with one <strong>of</strong> the surveys omitted<br />
Figure A2.2. The relationship between the distance alongshore and Maui’s dolphin<br />
abundance, created from the survey data. The grey lines in the plot report results<br />
from cross validation <strong>of</strong> the model. each line is created by running the model with<br />
one <strong>of</strong> the surveys omitted.<br />
34 Risk <strong>assessment</strong> <strong>of</strong> <strong>threats</strong> <strong>to</strong> Maui’s <strong>dolphins</strong>
Maui density, <strong>dolphins</strong> per square nautical mile<br />
0.0025<br />
0.002<br />
0.0015<br />
0.001<br />
0.0005<br />
Figure A2.3. Maui’s dolphin distribution, created from the sightings and effort data from nine aerial and biopsy surveys<br />
conducted between 2000 and 2012. The distribution has been normalised <strong>to</strong> one, and so the colours represent the expected<br />
number <strong>of</strong> <strong>dolphins</strong> per square nautical mile.<br />
Modifications suggested by the <strong>risk</strong> <strong>assessment</strong> workshop<br />
The expert panel agreed on two modifications <strong>to</strong> the Maui’s dolphin distribution. These relate <strong>to</strong><br />
the shape <strong>of</strong> the <strong>of</strong>fshore distribution and the southerly extent <strong>of</strong> the alongshore distribution.<br />
The expert panel considered that the shape <strong>of</strong> the <strong>of</strong>fshore distribution derived from the survey<br />
data was unreliable. Instead, a triangular distribution was decided, based on survey data from<br />
the west coast <strong>of</strong> the South Island. The shape imposed was defined by a triangle with maximum<br />
density at the coast, going <strong>to</strong> zero at 7 n.m. (see figs 6 and 7 in Slooten et al. 2005).<br />
Risk <strong>assessment</strong> <strong>of</strong> <strong>threats</strong> <strong>to</strong> Maui’s <strong>dolphins</strong><br />
35
Maui density, <strong>dolphins</strong> per square nautical mile<br />
0.0025<br />
0.002<br />
0.0015<br />
0.001<br />
0.0005<br />
Figure A2.4. A close-up <strong>of</strong> the core area <strong>of</strong> the Maui’s dolphin distribution created from the sightings and effort data from<br />
nine aerial and biopsy surveys conducted between 2000 and 2012. The distribution has been normalised <strong>to</strong> one, and so the<br />
colours represent the expected number <strong>of</strong> <strong>dolphins</strong> per square nautical mile.<br />
The expert panel considered that the range <strong>of</strong> the distribution derived from survey sightings was<br />
quite restricted, and prone <strong>to</strong> being underestimated. The panel agreed that various non-survey<br />
sightings suggested that the distribution should be expanded, especially <strong>to</strong>wards Taranaki. The<br />
final decision <strong>to</strong> extend the distribution south was based on decisions made by the expert panel<br />
members. A linear ramp from Port Waika<strong>to</strong> <strong>to</strong> Whanganui was defined, with a linear decrease<br />
alongshore, reaching zero at Whanganui. Similarly, expert panel discussions informed the<br />
decision <strong>to</strong> define the distribution <strong>of</strong> Maui’s <strong>dolphins</strong> in the various harbours by a linear ramp<br />
decreasing with distance from the entrance <strong>of</strong> the harbour.<br />
36 Risk <strong>assessment</strong> <strong>of</strong> <strong>threats</strong> <strong>to</strong> Maui’s <strong>dolphins</strong>
Maui density, <strong>dolphins</strong> per square nautical mile<br />
0.003<br />
0.0025<br />
0.002<br />
0.0015<br />
0.001<br />
0.0005<br />
Figure A2.5. Maui’s dolphin distribution as agreed by the expert panel, using the distribution from research findings and effort<br />
data for the core range and applying a ramp <strong>to</strong> identify the extent <strong>of</strong> the southern range and in<strong>to</strong> harbours. The distribution<br />
has been normalised <strong>to</strong> one, and so the colours represent the expected number <strong>of</strong> <strong>dolphins</strong> per square nautical mile. The grey<br />
outline marks the extent <strong>of</strong> the Marine Mammal Sanctuary, including the proposed southern extension.<br />
The final Maui’s dolphin distribution map (Fig. 1) was created by combining the alongshore<br />
distribution derived from the survey data with modifications suggested by the expert panel.<br />
The different parts <strong>of</strong> the distribution were combined <strong>to</strong>gether by matching probabilities at<br />
boundaries, and then renormalised so that the overall distribution integrated in<strong>to</strong> one.<br />
Risk <strong>assessment</strong> <strong>of</strong> <strong>threats</strong> <strong>to</strong> Maui’s <strong>dolphins</strong><br />
37
Fishing effort<br />
Commercial fishers are required <strong>to</strong> report all fishing effort <strong>to</strong> the MPI on various paper forms<br />
(MFish 2008). The older Catch Effort Landing Return form (CELR) has one record per day,<br />
and does not (generally) include latitude and longitude information. More detailed forms were<br />
introduced for trawl fisheries (TCER) in Oc<strong>to</strong>ber 2007, and for setnet fishing (NCELR) in Oc<strong>to</strong>ber<br />
2006. These forms include one record per fishing event, trawl <strong>to</strong>w or net set, and capture the<br />
latitude and longitude.<br />
Since its introduction, almost all <strong>of</strong> the trawl effort has been reported on the new TCeR form.<br />
However, setnet fishers on vessels less than 6 m in length are not required <strong>to</strong> use the new NCELR<br />
form. The smaller vessels operate almost entirely inside the harbours; consequently, there is no<br />
quantitative information about the location <strong>of</strong> fishing effort in these areas. The coastal setnet<br />
fishery is assumed <strong>to</strong> have been accurately reported since the introduction <strong>of</strong> the NCELR form in<br />
oc<strong>to</strong>ber 2006.<br />
Trawl effort is measured in number <strong>of</strong> <strong>to</strong>ws. Setnet effort records include number <strong>of</strong> nets set, the<br />
length <strong>of</strong> nets set, and the duration <strong>of</strong> time in the water. After grooming the data we found that the<br />
most reliable measure is the <strong>to</strong>tal length <strong>of</strong> nets set, which we report in kilometres.<br />
All fishing effort is reported <strong>to</strong> a statistical area. In Tables A2.2–A2.5, the fishing effort is divided<br />
in<strong>to</strong> the six statistical areas from Whanganui <strong>to</strong> north <strong>of</strong> Kaipara Harbour. In Fig. A2.6, the<br />
statistical areas are given names <strong>to</strong> make them easier <strong>to</strong> interpret. Figures A2.7–A2.14 show setnet<br />
and trawl fishing effort, plus the intersection <strong>of</strong> fishing effort and Maui’s dolphin distribution.<br />
References<br />
Childerhouse, S.; Rayment, W.; Webster, T.; Scali, S.; du Fresne, S.D. 2008: Offshore aerial survey <strong>of</strong> Maui’s dolphin<br />
distribution 2008. Auckland Conservancy, <strong>Department</strong> <strong>of</strong> Conservation (unpublished). 6 p.<br />
Ferreira, S.M.; Roberts, C.C. 2003: Distribution and abundance <strong>of</strong> Maui’s <strong>dolphins</strong> (Cephalorhynchus hec<strong>to</strong>ri maui)<br />
along the North Island west coast, New Zealand. DOC Science Internal Series 93. 19 p.<br />
MFish (Ministry <strong>of</strong> Fisheries) 2008: Research database documentation. Retrieved from http://tinyurl.com/fdbdoc<br />
Hamner, R.M.; oremus, M.; Stanley, M.; Brown, P.; Constantine, R.; Baker, C.S. 2012: estimating the abundance<br />
and effective population size <strong>of</strong> Maui’s <strong>dolphins</strong> using microsatellite genotypes in 2010–11, with retrospective<br />
matching <strong>to</strong> 2001–07. Auckland Conservancy, <strong>Department</strong> <strong>of</strong> Conservation. 44 p.<br />
Rayment, W.; du Fresne, S.D. 2007: <strong>of</strong>fshore aerial survey <strong>of</strong> Maui’s dolphin distribution 2007. Auckland<br />
Conservancy, <strong>Department</strong> <strong>of</strong> Conservation (unpublished). 6 p.<br />
Scali, S. 2006: Use <strong>of</strong> harbours by the critically endangered species Maui’s dolphin (Cephalorhynchus hec<strong>to</strong>ri maui).<br />
Auckland Conservancy, <strong>Department</strong> <strong>of</strong> Conversation (unpublished). 28 p.<br />
Slooten, e.; Dawson, S.M.; Rayment, W.J.; Childerhouse, S.J. 2005: Distribution <strong>of</strong> Maui’s dolphin,<br />
Cephalorhynchus hec<strong>to</strong>ri maui. New Zealand Fisheries Assessment Report, 2005/28.<br />
Slooten, e.; Dawson, S.M.; Rayment, W.J.; Childerhouse, S.J. 2006: A new abundance estimate for Maui’s dolphin:<br />
what does it mean for managing this critically endangered species? Biological Conservation 128(4): 576–581.<br />
Stanley, M. 2009: Maui’s winter <strong>of</strong>fshore aerial survey June/July 2009. Auckland Conservancy, <strong>Department</strong> <strong>of</strong><br />
Conservation (unpublished). 10 p.<br />
Wood, S.N. 2004: Stable and efficient multiple smoothing parameter estimation for generalized additive models.<br />
Journal <strong>of</strong> the American Statistical Association 99: 673–687.<br />
38 Risk <strong>assessment</strong> <strong>of</strong> <strong>threats</strong> <strong>to</strong> Maui’s <strong>dolphins</strong>
Table A2.3. Fisher-reported setnet fishing effort reported between 1992–93 and 2010–11, reported as number <strong>of</strong><br />
vessels, records, nets set, and kilometres <strong>of</strong> net set broken down by statistical areas 040–045. The ‘located %’<br />
column provides the percentage <strong>of</strong> <strong>to</strong>tal effort that has been reported with a latitude and longitude.<br />
yeAr* VeSSelS reCordS SeTS kIloMeTreS oF neT SeT ToTAl loC’d †<br />
Risk <strong>assessment</strong> <strong>of</strong> <strong>threats</strong> <strong>to</strong> Maui’s <strong>dolphins</strong><br />
egMonT TArAnAkI wAIkATo MAnukAu kAIpArA h’VIlle ‡<br />
1992–93 209 10349 44012 1749 1508 354 1718 3446 372 9147 0.0<br />
1993–94 179 9683 29100 1621 965 350 2365 3310 342 8952 0.1<br />
1994–95 181 9906 39044 1521 1452 505 2020 3259 452 9209 0.0<br />
1995–96 179 9425 52539 1238 1293 397 1858 3179 353 8317 0.0<br />
1996–97 184 10705 46535 1180 1382 934 1824 3798 437 9555 0.0<br />
1997–98 171 11755 65908 800 1358 753 2052 4671 336 9969 0.0<br />
1998–99 158 11042 33087 1010 1133 368 2087 5320 283 10202 0.3<br />
1999–00 162 12513 30959 860 958 528 2356 5370 152 10224 0.0<br />
2000–01 171 13115 24930 893 850 574 2469 6083 136 11004 0.0<br />
2001–02 175 11296 18174 909 731 587 2175 5176 284 9862 0.0<br />
2002–03 160 10098 15446 853 977 437 1958 4235 106 8566 0.0<br />
2003–04 147 9557 15843 960 774 517 1961 3790 14 8016 0.0<br />
2004–05 138 9245 16522 930 1012 468 1749 3473 56 7688 0.0<br />
2005–06 128 8554 23446 585 965 350 1666 3137 55 6759 0.0<br />
2006–07 136 9015 42579 757 1002 308 1978 2698 70 6814 29.4<br />
2007–08 123 8322 41725 742 1060 320 1581 2716 120 6538 32.4<br />
2008–09 120 8283 46742 815 1260 399 1146 3104 99 6823 35.0<br />
2009–10 122 7921 45257 797 1244 290 1135 3088 20 6573 35.4<br />
2010–11 124 8130 55501 633 1178 357 1244 3102 5 6520 33.6<br />
* Fishing year<br />
† located %<br />
‡ helensville<br />
Table A2.2. number <strong>of</strong> fisher reported records, by fishing method group, and statistical area,<br />
for the two fishing years, 2009–10 and 2010–11.<br />
yeAr MeThod reCordS<br />
egMonT TArAnAkI wAIkATo MAnukAu kAIpArA helenSVIlle<br />
2009–10 Setnet 317 1072 485 1868 3832 21<br />
Trawl 658 1813 836 803<br />
Troll 19 265 173 1 333<br />
bot<strong>to</strong>m longline 53 184 79 2 84<br />
purse or beach seine 9 38 28<br />
ring net 12 10 49 41<br />
lines, gathering, or diving 68 12 4 3 14 4<br />
Surface longline 1 8 29<br />
potting 13 4<br />
Fish traps 3<br />
2010–11 Setnet 240 922 527 2034 4157 5<br />
Trawl 545 1397 818 1 749<br />
Troll 20 153 131 1 131<br />
bot<strong>to</strong>m longline 59 308 131 1 1 151<br />
purse or beach seine 2 157 55 33 7<br />
ring net 9 3 69 49<br />
lines, gathering, or diving 61 23 4 15 3<br />
Surface longline 1 14 35<br />
potting 10 1<br />
39
Table A2.4. Fisher-reported trawl effort between 1992–93 and 2010–11, reported as number <strong>of</strong> vessels, records,<br />
number <strong>of</strong> <strong>to</strong>ws by statistical areas, <strong>to</strong>tal number <strong>of</strong> <strong>to</strong>ws. The ‘located’ column provides the percentage <strong>of</strong> <strong>to</strong>tal<br />
effort that has been reported with a latitude and longitude.<br />
yeAr* VeSSelS reCordS TowS ToTAl loC’d †<br />
* Fishing year<br />
† located %<br />
‡ helensville<br />
40 Risk <strong>assessment</strong> <strong>of</strong> <strong>threats</strong> <strong>to</strong> Maui’s <strong>dolphins</strong><br />
egMonT TArAnAkI wAIkATo MAnukAu kAIpArA h’VIlle ‡<br />
1992–93 61 4325 647 2807 1728 2 20 2221 7425 39.82<br />
1993–94 57 3356 574 2176 1646 49 11 2086 6542 29.88<br />
1994–95 60 2893 446 1547 1448 1 20 1611 5073 37.69<br />
1995–96 67 3217 288 1379 1450 28 9 1760 4914 50.43<br />
1996–97 64 3887 325 1831 1690 5 26 1529 5406 63.06<br />
1997–98 67 4448 472 1679 2005 26 25 1823 6030 62.6<br />
1998–99 64 4229 345 2251 1911 34 22 1735 6298 54.45<br />
1999–00 53 3792 719 1815 1526 10 5 1583 5658 49.75<br />
2000–01 54 4582 875 1515 1731 7 1663 5791 68.42<br />
2001–02 55 4508 1085 1618 1562 4 8 1252 5529 71.48<br />
2002–03 48 4391 1055 1729 754 1 5 1422 4966 81.09<br />
2003–04 50 5238 662 1700 1820 3 1424 5609 89.09<br />
2004–05 48 5540 725 1820 1626 2 4 1655 5832 91.34<br />
2005–06 41 4038 838 1646 897 4 1086 4471 82.93<br />
2006–07 42 3714 714 1543 940 4 948 4149 81.83<br />
2007–08 36 4516 702 1817 1010 1 1 1022 4553 98.57<br />
2008–09 35 3945 579 1568 867 3 4 940 3961 99.8<br />
2009–10 37 4116 673 1833 837 1 1 804 4149 99.95<br />
2010–11 36 3516 546 1401 819 1 749 3516 99.91<br />
Table A2.5. Fisher-reported trawl effort, from vessels less than 43 m long, between 1992–93 and 2010–11,<br />
reported as number <strong>of</strong> vessels, records, number <strong>of</strong> <strong>to</strong>ws by statistical areas, <strong>to</strong>tal number <strong>of</strong> <strong>to</strong>ws. The ‘located’<br />
column provides the percentage <strong>of</strong> <strong>to</strong>tal effort that has been reported with a latitude and longitude.<br />
yeAr* VeSSelS reCordS TowS ToTAl loC’d †<br />
* Fishing year<br />
† located %<br />
‡ helensville<br />
egMonT TArAnAkI wAIkATo MAnukAu kAIpArA h’VIlle ‡<br />
1992--93 44 2783 163 1785 1700 2 20 2213 5883 24.14<br />
1993--94 41 2138 180 1360 1638 49 11 2086 5324 13.86<br />
1994--95 43 2206 166 1142 1446 1 20 1611 4386 27.95<br />
1995--96 56 3002 150 1315 1437 28 9 1760 4699 48.16<br />
1996--97 54 3625 215 1699 1671 5 26 1528 5144 61.18<br />
1997--98 59 4001 250 1565 1896 26 25 1821 5583 59.61<br />
1998--99 55 4124 254 2246 1910 34 22 1727 6193 53.67<br />
1999--00 46 3674 623 1803 1516 10 5 1583 5540 48.68<br />
2000--01 43 4056 414 1454 1730 7 1660 5265 65.26<br />
2001--02 40 3829 516 1525 1549 4 8 1248 4850 67.48<br />
2002--03 39 3021 214 1336 631 1 5 1409 3596 73.92<br />
2003--04 43 3232 342 940 1011 3 1307 3603 83.04<br />
2004--05 36 3624 342 1007 1112 2 4 1449 3916 87.10<br />
2005--06 32 2546 313 953 683 4 1026 2979 74.39<br />
2006--07 32 2259 217 824 755 4 894 2694 72.01<br />
2007--08 25 2933 198 896 875 1 1 999 2970 97.85<br />
2008--09 24 2768 252 859 749 3 4 917 2784 99.71<br />
2009--10 26 2650 222 1027 636 1 1 796 2683 99.93<br />
2010--11 28 2425 255 855 574 1 740 2425 99.88
045 - Helensville<br />
042 - Waika<strong>to</strong><br />
040 - Egmont<br />
041 - Taranaki<br />
Figure A2.6. labelled fisheries statistical areas which show the areas included in the tables <strong>of</strong> fishing effort.<br />
Risk <strong>assessment</strong> <strong>of</strong> <strong>threats</strong> <strong>to</strong> Maui’s <strong>dolphins</strong><br />
044 - Kaipara<br />
043 - Manukau<br />
41
5 km<br />
5 - 10 km<br />
10 - 50 km<br />
50 - 100 km<br />
100 - 500 km<br />
> 500 km<br />
Figure A2.7. Setnet effort, measured in kilometres <strong>of</strong> net set per year, per 1 square nautical mile, for the years 2006 <strong>to</strong> 2008.<br />
The various existing and proposed areas closed <strong>to</strong> setnet fishing are indicated in red. The grey outline marks the extent <strong>of</strong> the<br />
Marine Mammal Sanctuary, including the proposed southern extension.<br />
42 Risk <strong>assessment</strong> <strong>of</strong> <strong>threats</strong> <strong>to</strong> Maui’s <strong>dolphins</strong>
5 km<br />
5 - 10 km<br />
10 - 50 km<br />
50 - 100 km<br />
100 - 500 km<br />
> 500 km<br />
Figure A2.8. Setnet effort, measured in kilometres <strong>of</strong> net set per year, per 1 square nautical mile, for the years 2008 <strong>to</strong> 2011.<br />
The various existing and proposed areas closed <strong>to</strong> setnet fishing are indicated in red. The grey outline marks the extent <strong>of</strong> the<br />
Marine Mammal Sanctuary, including the proposed southern extension.<br />
Risk <strong>assessment</strong> <strong>of</strong> <strong>threats</strong> <strong>to</strong> Maui’s <strong>dolphins</strong><br />
43
0.05<br />
0.05 - 0.1<br />
0.1 - 0.5<br />
0.5 - 0.75<br />
1<br />
Figure A2.9. Intersection <strong>of</strong> Maui’s dolphin distribution with all setnet effort between 2008 and 2011. The intersection is<br />
calculated by multiplying the fishing effort with the dolphin distribution value in each cell (as shown in blue). The values have<br />
been scaled so that the maximum value is 1. The various existing and proposed areas closed <strong>to</strong> setnet fishing are indicated<br />
in red. The grey outline marks the extent <strong>of</strong> the Marine Mammal Sanctuary, including the proposed southern extension.<br />
44 Risk <strong>assessment</strong> <strong>of</strong> <strong>threats</strong> <strong>to</strong> Maui’s <strong>dolphins</strong>
1 <strong>to</strong>w<br />
1 - 5 <strong>to</strong>ws<br />
5 - 10 <strong>to</strong>ws<br />
10 - 50 <strong>to</strong>ws<br />
50 - 100 <strong>to</strong>ws<br />
Figure A2.10. Trawl effort from vessels greater than 43 m long measured in <strong>to</strong>ws per year, per square nautical mile, for the<br />
years 2006 <strong>to</strong> 2011. The various existing areas closed <strong>to</strong> trawl fishing are indicated in red. The grey outline marks the extent<br />
<strong>of</strong> the Marine Mammal Sanctuary, including the proposed southern extension.<br />
Risk <strong>assessment</strong> <strong>of</strong> <strong>threats</strong> <strong>to</strong> Maui’s <strong>dolphins</strong><br />
45
1 <strong>to</strong>w<br />
1 - 5 <strong>to</strong>ws<br />
5 - 10 <strong>to</strong>ws<br />
10 - 50 <strong>to</strong>ws<br />
50 - 100 <strong>to</strong>ws<br />
Figure A2.11. Trawl effort from vessels less than 43 m long, measured in <strong>to</strong>ws per year, per square nautical mile, for the<br />
years 2006 <strong>to</strong> 2011. The various existing areas closed <strong>to</strong> trawl fishing are indicated in red. The grey outline marks the extent<br />
<strong>of</strong> the Marine Mammal Sanctuary, including the proposed southern extension.<br />
46 Risk <strong>assessment</strong> <strong>of</strong> <strong>threats</strong> <strong>to</strong> Maui’s <strong>dolphins</strong>
1 <strong>to</strong>w<br />
1 - 5 <strong>to</strong>ws<br />
5 - 10 <strong>to</strong>ws<br />
10 - 50 <strong>to</strong>ws<br />
50 - 100 <strong>to</strong>ws<br />
Figure A2.12. Trawl effort from vessels less than 43 m long, measured in <strong>to</strong>ws per year, per square nautical mile, for the<br />
years 2006 <strong>to</strong> 2008. The various existing areas closed <strong>to</strong> trawl fishing are indicated in red. The grey outline marks the extent<br />
<strong>of</strong> the Marine Mammal Sanctuary, including the proposed southern extension.<br />
Risk <strong>assessment</strong> <strong>of</strong> <strong>threats</strong> <strong>to</strong> Maui’s <strong>dolphins</strong><br />
47
1 <strong>to</strong>w<br />
1 - 5 <strong>to</strong>ws<br />
5 - 10 <strong>to</strong>ws<br />
10 - 50 <strong>to</strong>ws<br />
50 - 100 <strong>to</strong>ws<br />
Figure A2.13. Trawl effort from vessels less than 43 m long, measured in <strong>to</strong>ws per year, per square nautical mile, for the<br />
years 2008 <strong>to</strong> 2011. The various existing areas closed <strong>to</strong> trawl fishing are indicated in red. The grey outline marks the extent<br />
<strong>of</strong> the Marine Mammal Sanctuary, including the proposed southern extension.<br />
48 Risk <strong>assessment</strong> <strong>of</strong> <strong>threats</strong> <strong>to</strong> Maui’s <strong>dolphins</strong>
0.05<br />
0.05 - 0.1<br />
0.1 - 0.5<br />
0.5 - 0.75<br />
1<br />
Figure A2.14. Intersection <strong>of</strong> Maui’s dolphin distribution with all trawl effort between 2008 and 2011. The intersection (shown<br />
in blue) is calculated by multiplying the fishing effort with the dolphin distribution value in each cell. The values have been<br />
scaled so that the maximum value is 1. The various existing areas closed <strong>to</strong> trawl fishing are indicated in red. The grey outline<br />
marks the extent <strong>of</strong> the Marine Mammal Sanctuary, including the proposed southern extension.<br />
Risk <strong>assessment</strong> <strong>of</strong> <strong>threats</strong> <strong>to</strong> Maui’s <strong>dolphins</strong><br />
49
Appendix 3<br />
Maui’s dolphin threat scoring<br />
Table A3.1. estimated number <strong>of</strong> Maui’s dolphin mortalities per year, the <strong>risk</strong> ratio <strong>of</strong> mortalities <strong>to</strong> pbr and<br />
the likelihood <strong>of</strong> exceeding pbr for each threat, as scored by the panel. Individual threat scores were bootstrap<br />
resampled from distributions specified by the panel and aggregated <strong>to</strong> generate medians and 95% confidence<br />
intervals.<br />
ThreAT eSTIMATed MorTAlITIeS rISk rATIo lIkelIhood oF<br />
exCeedIng pbr<br />
50 Risk <strong>assessment</strong> <strong>of</strong> <strong>threats</strong> <strong>to</strong> Maui’s <strong>dolphins</strong><br />
MedIAn 95% CI 95% CI MedIAn 95% CI 95% CI MedIAn<br />
lower upper lower upper perCenTAge<br />
Fishing 4.97 0.28 8.04 71.5 3.7 143.6 100.0<br />
Commercial setnet bycatch 2.33 0.02 4.26 33.8 0.3 74.3 88.9<br />
recreational/cus<strong>to</strong>mary setnet bycatch 0.88 0.02 3.14 12.8 0.3 50.9 88.7<br />
Commercial trawl bycatch 1.13 0.01 2.87 16.7 0.1 48.5 88.9<br />
recreational driftnet bycatch 0.05 0.01 0.71 0.7 0.1 10.9 41.3<br />
Trophic effects <strong>of</strong> fishing 0.01
Table A3.2. estimated number <strong>of</strong> Maui’s dolphin mortalities per year, the <strong>risk</strong> ratio <strong>of</strong> mortalities <strong>to</strong> pbr and the<br />
likelihood <strong>of</strong> exceeding pbr for each threat, as scored by 8 <strong>of</strong> 9 members <strong>of</strong> the panel (excluding the outlying<br />
panellist). Individual threat scores were bootstrap resampled from distributions specified by the panel and<br />
aggregated <strong>to</strong> generate medians and 95% confidence intervals.<br />
ThreAT eSTIMATed MorTAlITIeS rISk rATIo lIkelIhood oF<br />
Risk <strong>assessment</strong> <strong>of</strong> <strong>threats</strong> <strong>to</strong> Maui’s <strong>dolphins</strong><br />
exCeedIng pbr<br />
MedIAn 95% CI 95% CI MedIAn 95% CI 95% CI MedIAn<br />
lower upper lower upper perCenTAge<br />
Fishing 5.16 3.02 8.13 75.1 39.1 143.9 100.0<br />
Commercial setnet bycatch 2.48 1.18 4.3 36.2 15.5 76.1 100.0<br />
recreational/cus<strong>to</strong>mary setnet bycatch 0.97 0.20 3.17 14.4 2.8 52.7 99.7<br />
Commercial trawl bycatch 1.21 0.44 2.91 18.3 6.1 49.7 100.0<br />
recreational driftnet bycatch 0.04 0.01 0.73 0.6 0.1 11.3 34.9<br />
Trophic effects <strong>of</strong> fishing 0.01