Lydia's Memo Format - City of Concord
Lydia's Memo Format - City of Concord
Lydia's Memo Format - City of Concord

You also want an ePaper? Increase the reach of your titles
YUMPU automatically turns print PDFs into web optimized ePapers that Google loves.
<strong>City</strong> <strong>of</strong> <strong>Concord</strong>, California<br />
Fiscal Year 2007- 2008<br />
Adopted<br />
Operating Budget<br />
CITY COUNCIL<br />
Mark A. Peterson, Mayor<br />
William D. Shinn, Vice Mayor<br />
Helen M. Allen<br />
Michael A. Chavez<br />
Laura M. H<strong>of</strong>fmeister<br />
Prepared by<br />
Lydia E. Du Borg, <strong>City</strong> Manager<br />
(Volume I)
On the Cover<br />
Clockwise from top left: <strong>Concord</strong> unfolds at the foot <strong>of</strong> Mt. Diablo; the Police Services<br />
building; the <strong>Concord</strong> Senior Citizens Center hosts hundreds <strong>of</strong> visitors every day; the<br />
timely repair <strong>of</strong> storm damage to a major thoroughfare; Salvio Pacheco Square has<br />
recently undergone a renovation; Newhall park shines with it’s new signage.
T A B L E OF C O N T E N T S<br />
INTRODUCTION<br />
Principal Officers ................................................................................................................... iii<br />
Mission Statement, Vision and Organizational Values ......................................................... iv<br />
Corporate Goals.................................................................................................................... vi<br />
<strong>City</strong> Manager Budget Message............................................................................................. viii<br />
GFOA Distinguished Budget Presentation Award ................................................................ xlix<br />
CSMFO Certificate <strong>of</strong> Award for Excellence in Operational Budgeting ................................ l<br />
CITY ORGANIZATION, FUNCTIONS, AND STATISTICS<br />
Organizational Charts ........................................................................................................... 1<br />
Comparative Summary <strong>of</strong> Authorized Full-Time Positions ................................................... 14<br />
<strong>City</strong> Maps .............................................................................................................................. 15<br />
An Early History <strong>of</strong> <strong>Concord</strong>.................................................................................................. 17<br />
Miscellaneous Statistics ....................................................................................................... 19<br />
Demographics ....................................................................................................................... 20<br />
Annual Budget Preparation (Administrative Directive No. 91).............................................. 24<br />
Budget Calendar ................................................................................................................... 27<br />
Resolution Adopting the Municipal Budget ........................................................................... 29<br />
Budget Appropriation Transfer Controls (Policy & Procedure No. 31) ................................. 32<br />
Budget and Fiscal Policy (Policy & Procedure No. 129)....................................................... 36<br />
Annual Appropriation Limit & Legal Debt Margin.................................................................. 40<br />
GENERAL FUND TEN YEAR<br />
Ten-Year Projection for the Year Ending June 30, 2008...................................................... 41<br />
General Fund Operating & Capital Expenditures by Department......................................... 42<br />
Summary <strong>of</strong> Program Expenditures FY2007-08................................................................... 43<br />
Expenditures by Program FY2003-04 – FY2016-2017......................................................... 47<br />
Major Tax Revenue by Type ……………………………………………………………………... 49<br />
Revenue by Source FY2003-04 – FY2016-17...................................................................... 51<br />
Reserve Funds...................................................................................................................... 54<br />
Summary <strong>of</strong> Population, Adopted Budgets & Net Assessed Values .................................... 56<br />
SUMMARY BY FUND & DEPARTMENT<br />
Accounting Basis & Program Structure................................................................................. 59<br />
Fund Structure Description ................................................................................................... 60<br />
Fund Balance Summary by Fund ......................................................................................... 62<br />
Revenue Summary by Fund ................................................................................................. 63<br />
Expenditure Summary by Fund ............................................................................................ 64<br />
Operating Expenditures Summary by Organization ............................................................. 65<br />
Departmental Budget Summaries by Department (All Funding Sources) ............................ 66<br />
General Fund & Enterprise Funds Operating Budgets ......................................................... 79<br />
DETAIL OF FY2007-08 DEPARTMENTAL BUDGETS<br />
Building Engineering & Neighborhood Services ................................................................... 81<br />
<strong>City</strong> Attorney.......................................................................................................................... 101<br />
<strong>City</strong> Management.................................................................................................................. 107<br />
Community & Recreation Services ....................................................................................... 125<br />
Finance ................................................................................................................................ 145<br />
Human Resources ................................................................................................................ 163<br />
Information Technology......................................................................................................... 179<br />
Planning and Economic Development.................................................................................. 197<br />
Police Department................................................................................................................. 217<br />
Public Works ......................................................................................................................... 233<br />
i
T A B L E OF C O N T E N T S<br />
(Continued)<br />
SPECIAL REVENUE FUNDS<br />
Description and Funds Summary.......................................................................................... 291<br />
State Gas Tax Ten Year Projection ...................................................................................... 294<br />
Housing & Community Services ........................................................................................... 295<br />
Redevelopment Agency (RDA) Housing Set-Aside Fund Ten Year Projection.................... 296<br />
Maintenance Districts<br />
Street Lighting Ten Year Projection......................................................................... 297<br />
Downtown Landscape Ten Year Projection............................................................. 298<br />
Pine Hollow Landscape Ten Year Projection .......................................................... 299<br />
Landscape & Lighting District No. 3 Ten Year Projection........................................ 300<br />
Storm Water Management Ten Year Projection...................................................... 301<br />
DEBT SERVICE FUNDS ................................................................................................................... 303<br />
CAPITAL PROJECTS<br />
Description and Funds Summary… ...................................................................................... 311<br />
Ten Year Projections............................................................................................................. 314<br />
Capital Projects Descriptions ................................................................................................ 320<br />
General Fund Capital Projects and Operating and Maintenance Costs............................... 323<br />
ENTERPRISE FUNDS<br />
Description…......................................................................................................................... 327<br />
Diablo Creek Golf Course Ten Year Projection .................................................................... 329<br />
Sewer Twenty Year Projection.............................................................................................. 331<br />
INTERNAL SERVICE FUNDS<br />
Description…......................................................................................................................... 333<br />
Workers’ Compensation Ten Year Projection....................................................................... 334<br />
Liability Fund Ten Year Projection ........................................................................................ 335<br />
Post Retirement Healthcare Benefits Ten Year Projection................................................... 336<br />
Fleet Maintenance Equipment Operations & Replacement Ten Year Projections............... 337<br />
Information Technology Operations & Replacement Ten Year Projections ......................... 339<br />
Building Maintenance Operations & Replacement Ten Year Projections ........................... 341<br />
FIDUCIARY FUND............................................................................................................................. 343<br />
REDEVELOPMENT AGENCY<br />
Ten Year Projection .............................................................................................................. 345<br />
AUTHORIZED POSITIONS BY DEPARTMENT AND CLASSIFICATION<br />
Full-Time ............................................................................................................................... 349<br />
Part-Time .............................................................................................................................. 355<br />
GLOSSARY OF TERMS ................................................................................................................... 357<br />
INDEX ................................................................................................................................................ 363<br />
CONTRIBUTORS .............................................................................................................................. 370<br />
Volume II presents the performance measurements and details <strong>of</strong> this budget on the task level.<br />
ii
Mayor<br />
HONORABLE MARK A. PETERSON<br />
Vice Mayor<br />
WILLIAM SHINN<br />
<strong>City</strong> Council Members<br />
HELEN M. ALLEN MICHAEL A. CHAVEZ LAURA M. HOFFMEISTER<br />
<strong>City</strong> Clerk <strong>City</strong> Treasurer<br />
MARY RAE LEHMAN THOMAS J. WENTLING<br />
<strong>City</strong> Manager<br />
Lydia E. Du Borg<br />
Joan Carrico..........................................................................Director <strong>of</strong> Community and Recreation<br />
Mark G. Deven.............................................................................................. Assistant <strong>City</strong> Manager<br />
Peter Dragovich ................................................................................... Director <strong>of</strong> <strong>City</strong> Management<br />
James Forsberg .......................................................Director <strong>of</strong> Planning & Economic Development<br />
Qamar Khan................................................................................................ Director <strong>of</strong> Public Works<br />
Craig Labadie.................................................................................................................<strong>City</strong> Attorney<br />
Margaret Lefebvre................................................................................................Director <strong>of</strong> Finance<br />
David Livingston..........................................................................................................Chief <strong>of</strong> Police<br />
Alex Pascual ........................................ Director <strong>of</strong> Building, Engineering & Neighborhood Services<br />
Ron Puccinelli .............................................................................Director <strong>of</strong> Information Technology<br />
Cherie Rosenquist ..............................................................................Director <strong>of</strong> Human Resources<br />
Michael Wright .............................................................<strong>Concord</strong> Community Reuse Project Director<br />
iii
This page intentionally left blank and unnumbered
Mission Statement for the Organization<br />
Adopted January 31, 1996<br />
Our mission is to join with our community to make <strong>Concord</strong> a city <strong>of</strong> the highest quality.<br />
We do this by providing responsive, cost-effective, and innovative local government<br />
services.<br />
Our Vision for the Future<br />
• We will be a customer based, performance driven, results oriented organization,<br />
focused on finding the answer, solving the problem, and achieving positive<br />
outcomes.<br />
• We will partner with the <strong>Concord</strong> community to maximize resources, deliver high<br />
quality services, and be recognized as setting the standard for excellence.<br />
• We will be trustworthy guardians <strong>of</strong> the public's resources.<br />
• We will make <strong>Concord</strong> a premier business location.<br />
• We will collaborate to provide "seamless" services that benefit both our external and<br />
internal customers, streamlining our work processes and removing barriers wherever<br />
they arise.<br />
• We will accept the challenge <strong>of</strong> change and be committed to continually enhancing<br />
the safety, environment, quality <strong>of</strong> life, and economic vitality <strong>of</strong> our community.<br />
• We will constantly look for new and better ways to deliver services. We will seek to<br />
be innovative, take reasonable risks, learn from our mistakes and always strive for<br />
excellence.<br />
• We will welcome diversity in our community and our work place.<br />
• We will conduct our work in an atmosphere <strong>of</strong> trust, respect and courtesy with open<br />
doors and open communication for our customers and each other.<br />
• We will provide ethical, dynamic and effective leadership, establish clear direction<br />
and priorities, and model the mission and values in support <strong>of</strong> our common Vision.<br />
• We will be accountable for our performance and our organization's success, and be<br />
recognized for our achievements.
Organizational Values<br />
Integrity and Trust - We say what we mean and mean what we say. We honor our<br />
word and keep our commitments. We are worthy <strong>of</strong> the public's and each other's trust.<br />
Commitment to Service - We put our customers first. We respond to our internal<br />
customers and treat them with the same courtesy and respect as our external<br />
customers. We facilitate, enable, and problem-solve.<br />
Partnerships - We place a high value on building partnerships with members <strong>of</strong> our<br />
community to assure we understand their needs and continue to deliver the services<br />
they desire in the most effective manner possible.<br />
Innovation and Continuous Improvement - We strive for excellence in the quality and<br />
productivity <strong>of</strong> our work. We create a work environment in which we look for new<br />
solutions and experiment with innovative ways to do things - even if they don't always<br />
work the first time. We recognize the need to be dynamic in meeting the community's<br />
changing needs. Each and every employee is given the opportunity to develop and<br />
grow.<br />
Performance Accountability - We set measurable performance goals which support<br />
the priorities <strong>of</strong> the <strong>City</strong> and our individual work groups. We are given the necessary<br />
authority, training and resources to enable us to achieve these goals. Performance<br />
reviews are conducted in a timely and effective manner. Employee advancement and<br />
other incentives are based on performance. We are proud <strong>of</strong> the pr<strong>of</strong>essionalism,<br />
competency and dedication that exist throughout the organization.<br />
Long Range Planning - We conduct long range strategic and financial planning to<br />
maximize service delivery and build the economic stability <strong>of</strong> the <strong>City</strong>. We practice<br />
sound fiscal management to protect the public's resources.<br />
Team Work - We respect each other as individuals, and we take the time and effort to<br />
show it. Although certain positions have more decision-making authority, we treat all<br />
members <strong>of</strong> the organization with the same consideration for their ideas and concerns.<br />
We really listen to, and give each other honest feedback. We recognize partnerships<br />
among work groups and employees as essential to effectively maximizing resources<br />
and delivering high quality services.<br />
Individual Worth and Diversity - We recognize and appreciate the uniqueness <strong>of</strong><br />
each individual. We value the contribution made and the synergy created by different<br />
experiences and perspectives. We are committed to treating each and every person<br />
within the organization and the larger community with respect and dignity.
Corporate Goals<br />
Adopted June 23, 1998<br />
Goal 1 Continue to make <strong>Concord</strong> a desirable place to live, work, and raise<br />
a family.<br />
Goal 2 Be responsive to the needs <strong>of</strong> <strong>Concord</strong> citizens, maintain a high<br />
level <strong>of</strong> customer satisfaction, and provide quality public information<br />
and outreach.<br />
Goal 3 Promote and improve <strong>Concord</strong> as a premier location for existing,<br />
expanding, and new businesses.<br />
Goal 4 Ensure a balanced budget for a ten-year planning period with<br />
adequate replacement funds for buildings and equipment.<br />
Goal 5 Preserve and enhance the livability <strong>of</strong> <strong>Concord</strong>'s residential<br />
neighborhoods with opportunities for a broad range <strong>of</strong> housing<br />
options.<br />
Goal 6 Offer an array <strong>of</strong> recreation, leisure, and cultural events and<br />
programs to meet the needs <strong>of</strong> citizens <strong>of</strong> all ages, with an<br />
emphasis on the well-being <strong>of</strong> youth.<br />
Goal 7 Maintain a safe and efficient traffic circulation system.<br />
Goal 8 Have <strong>Concord</strong> be among the safest cities <strong>of</strong> comparable size in<br />
California and have citizens feel safe in their homes, places <strong>of</strong><br />
work, and throughout the <strong>City</strong>.<br />
Goal 9 Maintain <strong>City</strong> parks, recreation facilities, streets, buildings, and<br />
other infrastructure to meet high standards <strong>of</strong> condition and<br />
appearance.<br />
Goal 10 Guide <strong>Concord</strong>'s development according to the General Plan and<br />
manage physical resources based on sound environmental<br />
principles.
vii<br />
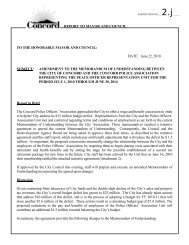
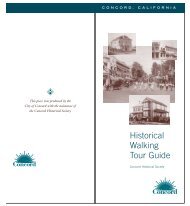
The Civic Center is a<br />
complex <strong>of</strong> three buildings<br />
where the majority <strong>of</strong> city<br />
services are provided. In<br />
the center is the Council<br />
Chamber.
MEMORANDUM<br />
April 16, 2007<br />
TO: Mayor Peterson and Members <strong>of</strong> the <strong>City</strong> Council<br />
FROM: Lydia E. Du Borg, <strong>City</strong> Manager<br />
SUBJECT: Budget Message for Fiscal Year 2007-2008 and Ten-Year Financial Plan<br />
For Fiscal Year 2007-2008 through Fiscal Year 2016-2017<br />
Introduction<br />
This message presents the proposed budget for Fiscal Year (FY) 2007-08 and the Ten-Year<br />
Financial Plan for FY 2007-08 through FY 2016-17 for each <strong>of</strong> the <strong>City</strong> <strong>of</strong> <strong>Concord</strong>’s major<br />
funds. The <strong>City</strong> continues to be financially stable and to meet all current fiscal obligations.<br />
Given constrained resources and known future obligations, improvements in services provided to<br />
the community are aimed at efficiencies and effectiveness rather than growth <strong>of</strong> services. The<br />
resources we have and estimate to be available in the Ten-Year Plan are committed to supporting<br />
existing service levels.<br />
Challenges to the <strong>City</strong>’s budget picture arise from a number <strong>of</strong> quarters even within the backdrop<br />
<strong>of</strong> an overall stable Bay Area economy, still in a slow recovery from early 2000, though the real<br />
estate market has somewhat flattened. These fiscal challenges place even greater importance on<br />
the <strong>City</strong>’s reliance on Performance Based Budgeting and Ten-Year Financial Planning, so<br />
decisions can be made along the way to proactively prepare for and to address issues before they<br />
become <strong>of</strong> crisis dimensions or create service disruption.<br />
Higher than originally projected revenues have helped the <strong>City</strong> to eliminate future projected gaps<br />
in the operating budget. The previously projected $500,000 gap in this year’s operating budget<br />
and all future years has been eliminated primarily due to gains in property tax revenues. This<br />
was driven by a high level <strong>of</strong> real estate activity over the last two years, which has now slowed.<br />
Higher revenues in combination with the <strong>City</strong>’s ongoing review <strong>of</strong> the way business is done in<br />
order to improve levels <strong>of</strong> service with existing staffing and with more closely monitored cost<br />
recovery have contributed to fiscal stability. Higher than projected revenues also enabled setting<br />
aside funding to “seed” the Other Post Employment Benefit (OPEB), our retiree health coverage<br />
obligation.<br />
Implementation <strong>of</strong> innovations in the way business is done continues. The October 2006<br />
realignment <strong>of</strong> Police Department Information Technology in an integrated operation with the<br />
Information Technology Department was necessary to more efficiently respond to the expanding<br />
viii
Budget Message for FY 2007-08 and Ten-Year Financial Plan<br />
April 16, 2007<br />
Page 2<br />
use and heavy reliance on technology <strong>of</strong> communications and computer related public safety<br />
work. My review <strong>of</strong> all vacancies throughout the <strong>City</strong> to determine whether they should be filled<br />
or whether there is some other cost effective alternative that could be implemented continues.<br />
The Downtown Landscape District assessment balloting represents our approach to increase<br />
revenues to keep current with costs the <strong>City</strong> incurs in service provision. We are actively seeking<br />
to attract new businesses, and to retain and expand existing businesses to add to the local<br />
economic base. With existing and future anticipated resources fully committed, new programs<br />
or project proposals are analyzed in depth to ensure the on-going operation can be sustained<br />
within existing or reassigned resources. We are not in a position to add new operating<br />
obligations without new resources or <strong>of</strong>fsetting cost savings. There is more to be done to<br />
increase revenues and/or decrease expenditures to prevent future budgetary gaps, but the Ten-<br />
Year Projection for the General Fund (Attachment No. 1) provides a balanced plan.<br />
Our major budget challenges:<br />
1. The State’s fiscal condition.<br />
2. Threat <strong>of</strong> unfriendly legislative and/or regulatory actions sponsored by the State or<br />
Federal governments.<br />
3. Health plan benefit costs continuing to rise at rates that outpace inflation.<br />
4. Funding liability for Other Post Employment Benefits (OPEB), i.e. retiree health<br />
coverage.<br />
5. Increases in shared <strong>City</strong> costs for County provided services to <strong>Concord</strong> residents.<br />
6. Future financial considerations associated with the Pavilion annual debt service.<br />
7. With our current employee base, maintaining existing quality service levels for a growing<br />
and changing community.<br />
<strong>Concord</strong> Community Reuse Plan<br />
As FY 2007-08 gets underway, so will the Local Reuse Authority’s (LRA) significant work <strong>of</strong><br />
preparing a plan for the civilian reuse <strong>of</strong> the closed <strong>Concord</strong> Naval Weapons Station. The<br />
second phase <strong>of</strong> the <strong>Concord</strong> Community Reuse Project is now underway. The Community<br />
Advisory Committee has been established by the LRA and Technical Advisory Groups have<br />
been meeting. In conjunction with <strong>City</strong> Boards and Commissions, these entities will identify site<br />
alternatives and prepare a financial and fiscal analysis for those alternatives with<br />
recommendations to the LRA. An environmental assessment <strong>of</strong> the alternatives will be prepared<br />
in accordance with State and Federal law. It is anticipated the <strong>City</strong> will adopt a Community<br />
Reuse Plan by early calendar year 2009. This Reuse Plan will be refined and an implementation<br />
strategy will be prepared in the third phase <strong>of</strong> the process before the property is transferred by<br />
the Navy.<br />
Funding for this significant effort is addressed in the proposed budget as a project continued<br />
from 2006-07 (Project No. 2011) for your approval in the Capital Improvement Program.<br />
Resources for this effort are proposed as a project, and not part <strong>of</strong> the <strong>City</strong>’s operating budget,<br />
since the reuse project has a beginning and an end. Eventual civilian uses on the property would<br />
ix
Budget Message for FY 2007-08 and Ten-Year Financial Plan<br />
April 16, 2007<br />
Page 3<br />
be served through <strong>City</strong> operating departments as is done with the rest <strong>of</strong> the <strong>City</strong>. One <strong>of</strong> the<br />
adopted guiding principles <strong>of</strong> the <strong>Concord</strong> Community Reuse Project is that the civilian use <strong>of</strong><br />
the former military property will sustain itself financially with the cost to provide <strong>City</strong> and other<br />
public services in the newly developed area being paid for by the revenue the area generates.<br />
The ongoing project continues to provide for the Reuse Project Office focused on preparing the<br />
Reuse Plan and supporting the project through to conveyance <strong>of</strong> the property for civilian uses.<br />
The major reuse plan work will be performed under consulting contracts. The costs <strong>of</strong> this<br />
project are anticipated to be reimbursed primarily by the Department <strong>of</strong> Defense Office <strong>of</strong><br />
Economic Adjustment (OEA), through grants it provides. Redevelopment Agency funds are<br />
allocated to the project as supplemental funding for the required OEA match, and for work effort<br />
not funded by OEA. Coordinating and supporting work performed by existing employees in<br />
other departments is being coded and tracked to this project. We will seek reimbursement <strong>of</strong> any<br />
<strong>City</strong> expenditures advanced for this effort which are not covered in grant funding in future<br />
agreements related to the disposition and/or development <strong>of</strong> the property.<br />
With uses not yet specified or timelines not yet definitive for the beginning <strong>of</strong> civilian reuse, the<br />
costs <strong>of</strong> future service delivery to this new area are not estimated or included in the proposed<br />
operating costs <strong>of</strong> the <strong>City</strong>’s FY 2007-08 through FY 2016-17 Ten-Year Financial Plan.<br />
Conceivably, some services may be needed within the Ten-Year Plan horizon, but projected land<br />
uses will determine the needed services, and that work is soon to begin. A primary reason the<br />
<strong>City</strong> has declined to accept use or occupancy <strong>of</strong> the area on an interim basis is to avoid unfunded<br />
service costs. Maintenance and support <strong>of</strong> the property during the reuse planning effort remain<br />
the Department <strong>of</strong> the Navy’s responsibility. Study and preparation <strong>of</strong> eventual service plans<br />
and identification <strong>of</strong> new funding sources for <strong>City</strong> and other public services to be delivered to the<br />
area will be a product <strong>of</strong> the Reuse Plan.<br />
Discussion<br />
The report is organized in the following major sections:<br />
A. Budget Challenges<br />
1. The State’s Fiscal Condition<br />
2. Threat <strong>of</strong> “Unfriendly” Legislative or Regulatory Actions<br />
3. Health Plan Premium Increases<br />
4. Other Post Employment Benefits<br />
5. Increasing Costs <strong>of</strong> County Services<br />
6. Pavilion Annual Debt Service<br />
7. Serving a Growing and Changing Community with Quality Services<br />
B. Strategies Addressing Budget Challenges<br />
C. Economic Overview<br />
D. General Fund<br />
1. Revenue Assumptions<br />
2. Expenditure Assumptions<br />
x
Budget Message for FY 2007-08 and Ten-Year Financial Plan<br />
April 16, 2007<br />
Page 4<br />
E. Other Major Funds Budget Discussion<br />
1. Post Retirement Healthcare Benefits Fund (OPEB)<br />
2. Street Maintenance<br />
3. Storm Water<br />
4. Downtown Landscape Maintenance District<br />
5. Pine Hollow Landscape Maintenance District<br />
6. Landscape and Lighting Maintenance District<br />
7. <strong>City</strong>wide Street Lighting Assessment District<br />
8. Sewer Enterprise<br />
9. Golf Course Enterprise<br />
10. Pavilion<br />
11. Redevelopment Agency<br />
F. Reserve Funds<br />
G. Budget and Fiscal Policies<br />
A. Budget Challenges<br />
1. The State’s Fiscal Condition<br />
The State’s fiscal condition has improved in one major aspect. The State’s FY 2007-08 proposed<br />
operating budget has eliminated the structural deficits (expenditures greater than revenues) <strong>of</strong><br />
past budgets. However, the reasonableness <strong>of</strong> the proposed budget is dependent on achieving<br />
projected revenues. The Legislatives Analyst’s Office (LAO) considers the State’s projected<br />
revenues to be overly aggressive due to slower growth in the State’s current revenues reflecting a<br />
more moderate economic expansion and a dip in income from capital gains. LAO predicts that<br />
State revenues will fall below the budget forecast for the current and budget years due to weaker<br />
personal income tax projections. Revenue volatility could return the State to a structural deficit,<br />
and with it, create uncertainties for local governments.<br />
2. Threat <strong>of</strong> “Unfriendly” Legislative or Regulatory Actions<br />
Over the last several years the State and Federal governments through legislative and regulatory<br />
actions have adversely impacted the fiscal integrity and authority <strong>of</strong> local governments.<br />
Unfortunately, these threats will continue into the foreseeable future. The California<br />
Legislature’s approval <strong>of</strong> AB 2987 in 2006 has changed local government’s franchise authority<br />
related to cable and telecommunications services. As a result, the <strong>City</strong> has fewer tools with<br />
which to regulate services such as AT&T’s Project Lightspeed and no authority to collect income<br />
from commercial ventures gaining access to use <strong>of</strong> the <strong>City</strong>’s Rights <strong>of</strong> Way. California<br />
Redevelopment Law was severely threatened by Proposition 90 which would have restricted the<br />
authority <strong>of</strong> the Redevelopment Agency and the <strong>City</strong>’s ability to impose environmental<br />
mitigation conditions on projects. This threat was temporarily stopped by the electorate when<br />
the initiative was defeated last November but proponents <strong>of</strong> the measure remain active. A final<br />
example <strong>of</strong> legislation adverse to the <strong>City</strong>’s interest is proposed implementation <strong>of</strong> new storm<br />
water requirements that are pending before the San Francisco Regional Water Quality Control<br />
xi
Budget Message for FY 2007-08 and Ten-Year Financial Plan<br />
April 16, 2007<br />
Page 5<br />
Board. These requirements will generate additional financial and operational burdens that will<br />
impact services such as street cleaning and impose onerous conditions on public and private<br />
development. The fiscal implications <strong>of</strong> this issue will be explained in more detail under the<br />
summary <strong>of</strong> the storm water program’s Ten-Year Plan. It is critical that the <strong>City</strong> remain vigilant<br />
in the area <strong>of</strong> legislative advocacy.<br />
3. Health Plan Premium Increases<br />
Along with all other employers providing health plan benefits, we continue to experience double<br />
digit increases in health plan premium costs. Since <strong>Concord</strong> joined the California Public<br />
Employees’ Retirement System (CalPERS) Health Program in 1998, the <strong>City</strong>’s premiums for<br />
health care have tripled. The projected health premium increase for FY 2007-08 is 11.3%. The<br />
regionalized pricing <strong>of</strong> health plan premiums adopted by CalPERS has not resulted in any<br />
reduction to premiums in the northern California region. While current <strong>Memo</strong>randa <strong>of</strong><br />
Understanding (MOUs) provide for coverage through CalPERS Health, staff continues to<br />
research other alternatives in advance <strong>of</strong> future labor negotiations.<br />
In an effort to control budget impacts <strong>of</strong> rapidly rising costs <strong>of</strong> health care benefits, current<br />
MOUs, negotiated in 2002 with Local One and the <strong>Concord</strong> Association <strong>of</strong> Pr<strong>of</strong>essional<br />
Employees (CAPE), included provisions for some cost-sharing formulas for health care<br />
premiums. The cost-sharing formulas have been in effect since 2004, and continue through the<br />
remaining contract terms to July 2009. Police Management and Police Officer Association<br />
MOUs do not at this time include cost-sharing formula provisions.<br />
4. Other Post Employment Benefits (OPEB)<br />
The impact <strong>of</strong> the rising cost <strong>of</strong> health benefits affects both the State’s fiscal standing as well as<br />
that <strong>of</strong> many other communities along with <strong>Concord</strong>, which provide paid health coverage as a<br />
retiree and current employee benefit. The provision <strong>of</strong> this benefit to future retirees establishes<br />
the further requirement under the new Governmental Accounting Standards Board (GASB)<br />
Statement No. 45 to report these future costs and the progress made toward funding these costs<br />
in financial statements beginning in FY 2007-08.<br />
In March <strong>of</strong> this year a study session was held providing the <strong>City</strong> Council with information on<br />
the <strong>City</strong>’s costs <strong>of</strong> retiree health benefits. The Council was presented with the estimated costs <strong>of</strong><br />
providing this benefit and with a number <strong>of</strong> options to help manage the long term effect on<br />
finances. The results <strong>of</strong> the actuarial study presented showed <strong>Concord</strong>’s unfunded liability to<br />
range between approximately $38 million and $78 million depending on several factors. Key<br />
factors included: 1) whether the <strong>City</strong> or an Irrevocable Trust held the funds, 2) length <strong>of</strong> the<br />
unfunded liability amortization period (20-30 years), 3) the interest rate earned on funds (4.25%-<br />
7%), and 4) the effects <strong>of</strong> previously set aside funds on unfunded liability.<br />
xii
Budget Message for FY 2007-08 and Ten-Year Financial Plan<br />
April 16, 2007<br />
Page 6<br />
The Council was introduced to three possible options to deal with the OPEB:<br />
1. The <strong>City</strong> may choose to continue its present “pay-as-you-go” (PAYGO) method <strong>of</strong><br />
funding the retiree health benefit. This PAYGO cost for FY 2007-08 is projected at $2.1<br />
million, but grows rapidly as the <strong>City</strong>’s number <strong>of</strong> retired employees grows.<br />
2. The <strong>City</strong> may keep the benefit as it is but set funds aside as the benefit is earned in an<br />
irrevocable trust. This option would dedicate these funds to this benefit and the<br />
investment opportunities would not be subject to the limitations <strong>of</strong> the <strong>City</strong>’s Investment<br />
Policy and the State Government Code.<br />
3. The <strong>City</strong> may modify the benefit to make it less prohibitively expensive.<br />
During the study session Staff recommended that the <strong>City</strong> proceed with an OPEB plan that<br />
implements Options No. 2 and No. 3. The irrevocable trust holds the funds separate from other<br />
<strong>City</strong> resources and guarantees that funds may only be used for the identified purpose, thus<br />
enabling higher interest earnings that help grow the fund. Modification <strong>of</strong> the benefit must come<br />
through both labor and management working together in a collaborative process to address the<br />
issue.<br />
Staff further recommended that the <strong>City</strong> Council establish the following provisions in the plan to<br />
guide the <strong>City</strong>’s approach for dealing with OPEB including:<br />
• Acknowledge that the current PAYGO method is not a viable option.<br />
• Use one time money as it becomes available to build up the funds to pay for the benefits<br />
(as <strong>of</strong> July 1, 2007, the OPEB fund will have about $15 million already set aside).<br />
• Acknowledge that the current retiree benefit plan must be changed.<br />
• Acknowledge that the cost <strong>of</strong> the OPEB obligation must be factored into every decision<br />
committing <strong>City</strong> monetary resources.<br />
• Commit to look for new and creative ways in a collaborative process to provide a health<br />
benefit to retirees in the future without absorbing an inordinate amount <strong>of</strong> the <strong>City</strong>’s<br />
resources and thereby reducing the <strong>City</strong>’s ability to serve the public.<br />
• Seek bargaining unit commitment to a collaborative process to provide the best possible<br />
benefit while keeping in mind the fact that the current plan is and will become more and<br />
more cost prohibitive.<br />
• Recognize the fact that this issue is one that requires all <strong>of</strong> our collective creativity to<br />
resolve and a commitment to an “interest based” approach, including any training or<br />
facilitation which might be necessary.<br />
At the study session the Council was asked to discuss the options presented to address the <strong>City</strong>’s<br />
unfunded OPEB liability and provide direction to staff on the three basic options and establishing<br />
provisions a. through g. above to guide the preparation <strong>of</strong> the OPEB plan. After receipt <strong>of</strong><br />
direction the plan would be brought back to the <strong>City</strong> Council for consideration and for<br />
subsequent incorporation into the <strong>City</strong>’s FY 2007-08 Budget and Ten-Year Plan.<br />
xiii
Budget Message for FY 2007-08 and Ten-Year Financial Plan<br />
April 16, 2007<br />
Page 7<br />
The OPEB plan (Attachment No. 2) included in this proposed budget and Ten-Year Plan projects<br />
adoption by the <strong>City</strong> Council <strong>of</strong> the staff recommendations. It assumes that an irrevocable trust<br />
will be established and that set-aside funds will be used as “seed money” to minimize future<br />
unfunded liability. The OPEB Plan assumes that the unfunded liability will be amortized over a<br />
twenty-five year period and that the trust will achieve a 7% return on its investment.<br />
5. Increasing Shared Costs <strong>of</strong> County Services<br />
In March 2007, the <strong>City</strong> received notice <strong>of</strong> an increase <strong>of</strong> $63,000 or 14% over last year in the<br />
cost <strong>of</strong> the <strong>City</strong>’s contract with the County Animal Services Department for animal control<br />
services. This increase adds $690,000 to <strong>City</strong> costs over the Ten-Year Plan. This amount brings<br />
the annual cost to the <strong>City</strong> for animal control services to $522,631 for FY 2007-08. The Animal<br />
Control Services Director has provided an explanation that the increases are necessary to reflect<br />
the operating costs <strong>of</strong> the new shelter and programs to meet the needs <strong>of</strong> residents. The County<br />
is the only provider <strong>of</strong> such services.<br />
6. Pavilion Annual Debt Service<br />
In 2006, Bill Graham Presents (BGP) became a division <strong>of</strong> Live Nation, Inc. (LNI), eliminating<br />
its past association with Clear Channel Entertainment. On April 11, 2006, the <strong>City</strong> Council<br />
approved an amendment to the Pavilion Management Agreement that renewed LNI’s operation<br />
for two more years following expiration <strong>of</strong> the first term on December 31, 2006. The<br />
amendment also revised the financial terms <strong>of</strong> the Management Agreement by reducing LNI’s<br />
obligation to cover 100% <strong>of</strong> the Pavilion’s Annual Debt Service payment. These changes<br />
occurred in response to LNI’s initial proposal submitted last September to exercise the first<br />
extension term. Following the disappointing 2004 season that resulted in a $979,000 loss and the<br />
continued volatility <strong>of</strong> the live entertainment industry for the near future, LNI originally<br />
proposed to guarantee only $1 million <strong>of</strong> the Pavilion’s approximate $1,750,000 annual debt<br />
service on bonds that funded expansion <strong>of</strong> the facility. In November 2005, the <strong>City</strong> Council<br />
approved an agreement with Tonic Entertainment that assisted staff in negotiating significantly<br />
better terms. This strategy worked as LNI provided a new <strong>of</strong>fer in March to guarantee payment<br />
<strong>of</strong> $1,400,000 <strong>of</strong> the annual debt and proposed modification <strong>of</strong> the first extension term from five<br />
years to two years. The Council approved the amendment based on the $400,000 increase for the<br />
guarantee on the bond payment, and LNI’s continued commitment to provide community events<br />
at the Pavilion.<br />
Under the amended agreement, the <strong>City</strong> General Fund Ten-Year Plan includes approximately<br />
$378,000 in FY 2007-08 and FY 2008-09 for this purpose. The strategy to <strong>of</strong>fset this estimated<br />
cost is by utilizing reallocated funds available through one-time adjustments. Beginning in FY<br />
2009-10, the Ten-Year Plan assumes a continued annual obligation <strong>of</strong> $200,000. If the financial<br />
outlook for the entertainment industry does not improve, the $200,000 annual obligation could<br />
be significantly greater. The impact and duration <strong>of</strong> the Pavilion annual debt service obligation<br />
xiv
Budget Message for FY 2007-08 and Ten-Year Financial Plan<br />
April 16, 2007<br />
Page 8<br />
further constrains the <strong>City</strong>’s ability to expand other programs and services in order to maintain<br />
the operation <strong>of</strong> an existing <strong>City</strong> facility.<br />
The implementation <strong>of</strong> the two year agreement for the renewal supported LNI’s commitment to<br />
increase the minimum annual payment by $400,000. However, the shorter term will require the<br />
<strong>City</strong> to be prepared for a challenging negotiation with LNI for extending the term <strong>of</strong> the<br />
agreement when it expires on December 31, 2008 or soliciting new proposals should negotiations<br />
fail. In order to facilitate this process, the <strong>City</strong> Council approved a second agreement with Tonic<br />
Entertainment on January 9, 2007. This agreement engages Tonic to support the <strong>City</strong>’s<br />
negotiation with LNI prior to the end <strong>of</strong> the current renewal term, provide detailed review <strong>of</strong> the<br />
Pavilion operation in 2007 and 2008 and act as the <strong>City</strong>’s representative in the entertainment<br />
industry. Staff believes the most critical task that Tonic will perform as part <strong>of</strong> this engagement<br />
is a report that analyzes the condition <strong>of</strong> the national and regional entertainment industry and<br />
provides advice regarding the future use <strong>of</strong> the Pavilion and other community entertainment<br />
assets. Understanding the national and regional entertainment market will enable the <strong>City</strong><br />
Council and staff to develop a realistic view <strong>of</strong> the Pavilion’s future chances for economic and<br />
artistic success as a performing arts facility. Given this realistic view, the <strong>City</strong> Council and staff<br />
will be able to better evaluate all potential options associated with the Pavilion.<br />
7. Serving a Growing and Changing Community<br />
The broader challenge remains for the <strong>City</strong> to consider taking actions to increase the resources<br />
needed to serve <strong>Concord</strong>’s growing and changing community. The proposals made for changes<br />
in the FY 2007-08 Budget and Ten-Year Plan are all within existing available resources. There<br />
is no provision for expansion <strong>of</strong> services or new programs without additional resources. All<br />
projected resources are devoted to maintaining and continuing existing services with the<br />
existing-sized workforce. With the OPEB obligation coming into effect in FY 2007-08, any<br />
discretionary General Fund resources received become more constrained. A creative approach to<br />
gaining additional resources through grants has proven successful in our Capital Improvement<br />
Program, but would not apply to on-going operating services. New authority for additional<br />
resources through assessments is being sought this year with a Proposition 218 ballot <strong>of</strong> property<br />
owners in the <strong>Concord</strong>’s Downtown Landscape Maintenance District. The Contra Costa Clean<br />
Water program is considering a parcel fee increase in 2008 for the Storm Water Program<br />
operated by the <strong>City</strong>. In 2014 a Proposition 218 ballot <strong>of</strong> property owners in the Pine Hollow<br />
Landscape Maintenance District will need to be considered. If successful, these additional<br />
resources would be restricted to the purposes <strong>of</strong> these specific programs and funds. If the <strong>City</strong><br />
wants to grow its services more broadly to meet community needs, new unrestricted resources<br />
will be required.<br />
B. Strategies Addressing Budget Challenges<br />
The Strategic Plan for Continuing Financial Health <strong>of</strong> the Organization and Provision <strong>of</strong> Quality<br />
Services to the Community, along with the Council’s Budget and Fiscal Policy document, serve<br />
xv
Budget Message for FY 2007-08 and Ten-Year Financial Plan<br />
April 16, 2007<br />
Page 9<br />
as guiding principles for development <strong>of</strong> strategies to meet the resource challenges and for<br />
implementation <strong>of</strong> efficiencies. The principles are:<br />
• <strong>City</strong> Manager will present a budget (capital and operating) that is balanced over the Ten-<br />
Year planning period for all funds.<br />
• Utilize the Ten-Year Financial Plan as the basis for making long-range financial planning<br />
decisions.<br />
• Include resources required to maintain and operate all capital improvements commencing<br />
the year the project is completed and continuing through the balance <strong>of</strong> the Ten-Year<br />
Financial Plan.<br />
• Maintain essential services and existing facilities.<br />
• Continue to utilize the Performance Based Budget and outcome management in order to<br />
maximize efficiency and effectiveness.<br />
• Minimize impacts on services to the public.<br />
• Minimize impacts to employees.<br />
• Foster thriving and diverse residential and business communities.<br />
C. Economic Overview<br />
While the national economy faces many <strong>of</strong> the same concerns as it has over the past few years,<br />
such as expanding Federal budget and trade deficits, the war in Iraq, terrorist threats, extremely<br />
high oil prices, Federal disaster aid, and increasing short-term interest rates, it continues to grow,<br />
though at a slower rate. The Federal government efforts to bring its own budget under control<br />
may affect local programs such as the Community Development Block Grant (CDBG) funding<br />
which could be further curtailed.<br />
The State is still dealing with its deficit problems and has had the advantage <strong>of</strong> “growing” out <strong>of</strong><br />
a portion <strong>of</strong> it, by realizing higher revenues. The State, without directly confronting the OPEB<br />
issue, believes it has eliminated the structural deficits <strong>of</strong> prior budgets in its proposed budget for<br />
FY 2007-08, though the Legislative Analyst Office is not quite so optimistic. Operating revenue<br />
estimates are finally close to covering operating expenditures for programs.<br />
Proposition 1A has helped to “normalize” the States financial relations with the local<br />
governments, though there is always the potential <strong>of</strong> further raids on local resources.<br />
Redevelopment funds remain especially vulnerable.<br />
The Bay Area is pulling out <strong>of</strong> its “dot.com” recession, albeit slowly, though cost <strong>of</strong> living in the<br />
Bay Area and the creation <strong>of</strong> permanent jobs back to the point <strong>of</strong> those in place in early 2000, are<br />
still major concerns and the real estate market has slowed and flattened considerably. For the<br />
<strong>City</strong> <strong>of</strong> <strong>Concord</strong>, the revenue projections were developed using a cautious optimism reflecting<br />
very conservative growth estimates for FY 2007-08.<br />
xvi
Budget Message for FY 2007-08 and Ten-Year Financial Plan<br />
April 16, 2007<br />
Page 10<br />
D. General Fund<br />
1. Revenue Assumptions<br />
Sales Tax<br />
Sales tax ($30.5 million estimated for FY 2007-08) makes up 40% <strong>of</strong> General Fund revenue.<br />
This is, by far, the largest single source <strong>of</strong> revenue in the General Fund. The budget for FY<br />
2006-07 anticipated $29.9 in sales tax revenues. Current year estimates decrease this number<br />
slightly. In order to reflect recently experienced lower levels <strong>of</strong> sales tax collections the<br />
projected amount is based on an increase <strong>of</strong> only 2.2% over the revenue estimated for the FY<br />
2006-07 budget. The remaining years in the Ten-Year Plan reflect sales tax growth at 3.5%, a<br />
conservative estimation <strong>of</strong> what will be generated over the time period given the overall history<br />
<strong>of</strong> this revenue source.<br />
Property Tax<br />
The assessed valuation <strong>of</strong> property in the <strong>City</strong> <strong>of</strong> <strong>Concord</strong> continues to climb based upon interest<br />
rates that are still favorable and a stable real estate market. The property tax revenue generated<br />
by this growth is an important resource for the provision <strong>of</strong> <strong>City</strong> services. Over the years the<br />
increase has far exceeded the rate <strong>of</strong> inflation:<br />
FY 2001/02 9.6%<br />
FY 2002/03 7.0%<br />
FY 2003/04 8.0%<br />
FY 2004/05 7.1%<br />
FY 2005/06 9.9%<br />
FY 2006/07 6.4%<br />
The FY 2006-07 budget anticipated property tax revenue <strong>of</strong> $19.4 million. Current year<br />
estimates increase this number significantly. To reflect the recently experienced increase,<br />
property taxes are projected to be $22.5 million in FY 2007-08 based upon updated projections<br />
<strong>of</strong> the property tax received in FY 2006-07. Growth in property taxes has continued to be<br />
projected at 5% throughout the Ten-Year Plan. This conservative estimate includes a factor for<br />
the flattening <strong>of</strong> the residential real estate market.<br />
Business License Tax<br />
The budget for FY 2006-07 anticipated $3.3 million in Business License taxes and processing<br />
fees. Current year estimates support this projection. For FY 2007-08 Business Licenses related<br />
taxes and fees are projected to total $3.4 million with a 3% growth factor in the Ten-Year Plan.<br />
xvii
Budget Message for FY 2007-08 and Ten-Year Financial Plan<br />
April 16, 2007<br />
Page 11<br />
Transient Occupancy Tax<br />
The budget for FY 2006-07 anticipated the receipt <strong>of</strong> $1.61 million from Transient Occupancy<br />
Tax (commonly referred to as the “hotel” tax as it is charged to guests staying in the hotels and<br />
motels). The revenue is tracking at this level and the <strong>City</strong> anticipates receiving about $1.66<br />
million from this source in FY 2007-08. Hotel tax revenues are reflecting the changing economy<br />
and cultural patterns <strong>of</strong> business and pleasure travel. As long as the number <strong>of</strong> available rooms<br />
in the hotels within the <strong>City</strong> remains static, the increase in the Transient Occupancy Tax will<br />
remain largely inflationary and is therefore projected at 3% per year throughout the Ten-Year<br />
Plan.<br />
Transfers from Other Funds<br />
Transfers are made from the other funds (e.g., Enterprise Funds, Redevelopment, etc.) under a<br />
Cost Allocation Plan to pay for the support provided by General Fund departments to their<br />
operations. The cost allocation plan allows for the payment <strong>of</strong> <strong>City</strong> Management, <strong>City</strong> Council,<br />
Finance and Human Resources costs, separately from the charges which are paid directly to the<br />
Internal Service Funds for Information Technology, Fleet, Insurance and Building Maintenance<br />
and Replacement. In FY 2007-08, $3.9 million is budgeted for transfer to repay the General<br />
Fund for services provided.<br />
Fees and Charges<br />
Fees and charges are reviewed each year to ensure the <strong>City</strong> is recouping the cost <strong>of</strong> doing<br />
business. For FY 2007-08, the increase in the cost <strong>of</strong> doing business is greater than the<br />
Consumer Price Index (CPI) because <strong>of</strong> increases in costs that are increasing at a rate higher than<br />
overall inflation. The overall increase to General Fund operating expenditures is about 7.7%.<br />
This increase, coupled with adjustments to fees and charges in prior years which did not keep<br />
pace with the increased cost <strong>of</strong> doing business, indicate that, at the very least, a 5% increase in<br />
fees is warranted. It is the Finance Department’s intention to continue working with each<br />
department in FY 2007-08 to ensure that fees are calculated appropriately and that the costs for<br />
providing the services for which fees and charges are appropriate are identified. Services by<br />
policy that the Council has determined to be supported by the General Fund will continue to<br />
receive support. In the meantime, under separate cover in the Fees and Charges Resolution, an<br />
increase in fees will be proposed which will, with some exceptions, total 5%. Where the charge<br />
is based upon “per-hour” costs basis, the fee or charge will include the full cost <strong>of</strong> that hour.<br />
New fees are proposed for services such as:<br />
• Public notification process associated with the announcement <strong>of</strong> public meetings for<br />
development projects. The technology required for the process will be ready for<br />
implementation beginning July 1, 2007.<br />
• Business License Exemption audit fee.<br />
• A new schedule <strong>of</strong> maximum employee hourly rates (discussion below).<br />
xviii
Budget Message for FY 2007-08 and Ten-Year Financial Plan<br />
April 16, 2007<br />
Page 12<br />
Further analysis and recommendations will be brought to the <strong>City</strong> Council during FY 2007-08,<br />
following the assessment to be conducted by the Finance Department.<br />
Employee hourly charge rates have been recalculated based upon the fully loaded costs for each<br />
employee (averaged by position). For governmental activities, these rates are the maximum that<br />
the <strong>City</strong> may charge for services provided by employees. Governmental activity charges may<br />
reflect cost recovery, but they are precluded from being calculated to achieve a pr<strong>of</strong>it. Recovery<br />
includes the fully “loaded” cost <strong>of</strong> employees to provide services. Some examples <strong>of</strong> costs<br />
calculated into the rate include, but are not limited to:<br />
• Salary and benefit cost.<br />
• Materials and supplies directly related to the provision <strong>of</strong> services.<br />
• Departmental overhead – the cost <strong>of</strong> administrative support provided within each<br />
Department.<br />
• <strong>City</strong>wide overhead – the cost <strong>of</strong> support provided by the general governmental functions<br />
<strong>of</strong> the city such as <strong>City</strong> Management, <strong>City</strong> Attorney, Human Resources, and Finance.<br />
• Computer, fleet maintenance, building maintenance, rent, etc.<br />
There are many costs which are NOT included in the development <strong>of</strong> employee hourly charge<br />
rates because they are not directly attributable to the cost <strong>of</strong> providing services. Some <strong>of</strong> these<br />
costs, which are borne by the <strong>City</strong> and not subject to reimbursement include:<br />
• Debt Service<br />
• Capital Projects.<br />
• Certain contracts and consultants which, if charged to a customer, would be directly<br />
allocated.<br />
• Contracts which provide services to the public directly.<br />
By reviewing the expenditures made by the <strong>City</strong> in support <strong>of</strong> the services provided, the<br />
determination <strong>of</strong> which costs should be included and which should not is reviewed by the<br />
Council annually to ensure both accuracy and reasonableness. Further, it is at the <strong>City</strong> Council’s<br />
discretion whether or not 100% <strong>of</strong> the cost recovery fee should be charged.<br />
2. Expenditure Assumptions<br />
All known labor agreement <strong>Memo</strong>randum <strong>of</strong> Understanding (MOU) adjustments are included in<br />
the preliminary appropriations, for the remaining terms <strong>of</strong> each respective MOU. For time<br />
periods not covered by current MOUs, wage adjustments have been estimated using a 3% CPI<br />
inflator. For the three attrition positions which are still staffed, the assumption is that the<br />
position salary and benefit charges are not going to continue throughout the Ten-Year Plan.<br />
However, the <strong>City</strong> is continuing such full-time employees until the position is voluntarily<br />
vacated or a vacancy becomes available for them in an equivalent position. I review all<br />
xix
Budget Message for FY 2007-08 and Ten-Year Financial Plan<br />
April 16, 2007<br />
Page 13<br />
vacancies, including those not designated in the attrition plan, and may decide to hold other<br />
positions vacant, or postpone filling them.<br />
CPI inflators <strong>of</strong> 2 – 3% have been included in the Ten-Year Plan projections for planning<br />
purposes. Assumptions for medical benefits and post-retirement medical benefits (OPEB) have<br />
been made in accordance with the actuarial projection done in 2006. All additional operating<br />
costs expected due to the addition or construction <strong>of</strong> new capital projects have been included in<br />
the Ten-Year Plan.<br />
Service fees charged by internal service funds have been adjusted to reflect current services<br />
received and/or equipment provided. Adjustment includes assignment <strong>of</strong> fees at the program<br />
level and reflects the redistribution <strong>of</strong> services fees that may have been previously assigned only<br />
at the fund or department level. The internal service fees charged to users are sufficient to meet<br />
known needs for the FY 2007-08 budget and the remainder <strong>of</strong> the Ten-Year planning period.<br />
E. Other Major Funds Budget Discussion<br />
1. Post Retirement Healthcare Benefits (OPEB)<br />
A fund has been established to hold the money set aside for retiree health benefits. This fund<br />
reflects the funds which will ultimately be transferred into the irrevocable trust and will be used<br />
to pay the retiree health premiums. A phased-in approach to pay both for the unfunded liability<br />
(the “catch-up”) and for the ongoing year-to-year cost has been established to meet the<br />
obligation. As discussed at the Study Session and proposed to be formalized on April 24, 2007,<br />
a great deal <strong>of</strong> additional work will be done by both the bargaining units and management to<br />
develop a program which is not so cost prohibitive. By using a phased-in approach, the <strong>City</strong> is<br />
acknowledging that the full unfunded liability will not be mitigated in the short-term. As a result<br />
the fund will show a negative fund balance for a period <strong>of</strong> years. With concerted effort, this<br />
deficit will be reduced with the benefit being funded as it is earned in a manner similar to that by<br />
which the employee pensions are funded. The 25-year plan proposed for the fund will reflect<br />
sufficient cash flow to pay the health premiums <strong>of</strong> retirees for which the <strong>City</strong> is already<br />
committed. The deficit will be attributed to the future benefits for which the cash payment is not<br />
yet due.<br />
2. Street Maintenance Program<br />
Projections for street maintenance activities and infrastructure related capital improvement<br />
projects have been impacted by two factors. The first factor is associated with the rising cost <strong>of</strong><br />
crude oil that has resulted in a substantial increase for asphalt related material such as asphalt<br />
concrete and asphalt emulsion (material used in surface seal). The second factor is the flattening<br />
out <strong>of</strong> the revenue sources that are used to fund street maintenance and infrastructure projects.<br />
These factors have adversely affected the <strong>City</strong>’s ability to fund the street maintenance program<br />
and other street infrastructure projects such as sidewalk and drainage improvements.<br />
xx
Budget Message for FY 2007-08 and Ten-Year Financial Plan<br />
April 16, 2007<br />
Page 14<br />
As a result, the <strong>City</strong> has reduced the fund balances for Gas Tax, Proposition 111, Measure C, and<br />
Measure J (successor to Measure C) during the last year in order to meet the street maintenance<br />
schedule and complete infrastructure projects. Without taking steps to revise expenditures for<br />
the current program and identifying new sources <strong>of</strong> revenue, the Ten-Year street maintenance<br />
program would have become negative as soon as FY 2008-09. Meeting the street maintenance<br />
schedule means performing the right maintenance work at the right time to ensure the optimum<br />
condition <strong>of</strong> the street pavements. Deferred maintenance is costly. A recent study completed by<br />
the Metropolitan Transportation Commission (MTC) as part <strong>of</strong> their Local Streets and Roads<br />
Strategic Plan shows that for every dollar spent performing preventative maintenance at the right<br />
time (while the pavement is in good condition) saves up to $10 if such maintenance is deferred<br />
and performed later as a complete reconstruction project. The <strong>City</strong>’s Public Works Department<br />
staff has reported that the savings have been even greater in specific comparisons between<br />
maintenance and reconstruction projects in <strong>Concord</strong>.<br />
It is critical for the <strong>City</strong> Council to note that preventative maintenance are activities that address<br />
aging, oxidation, surface deterioration and normal wear and tear from daily use and<br />
environmental conditions. The current preventative maintenance program extends the service<br />
life <strong>of</strong> the <strong>City</strong>’s existing pavement in a cost-effective manner through techniques and strategies<br />
such as surface seals, overlays, joint repair, patch paving and crack sealing. In a typical year, the<br />
<strong>City</strong> provides surface seal to 6,000,000 – 7,000,000 square feet <strong>of</strong> pavement through contractors.<br />
The surface seal program fills small cracks, provides an excellent seal against the damaging<br />
effects <strong>of</strong> water intrusion into the pavement and provides a new wearing surface. This activity<br />
also includes the removal and replacement <strong>of</strong> existing pavement reflective markers, striping and<br />
legends. Contractors are also used to perform the patch paving program. Under this program<br />
failed asphalt and base material is removed and replaced with new material. The resulting<br />
repaired pavement provides an appropriate surface to which the surface seal is applied. In a<br />
typical year, 300,000 to 400,000 square feet <strong>of</strong> pavement is replaced under this program.<br />
<strong>Concord</strong>’s street maintenance program continues to provide an excellent return on the funds<br />
invested in the program. As the Council is aware, the <strong>City</strong> contracts for an annual inspection <strong>of</strong><br />
all 305 miles <strong>of</strong> paved streets in order to fulfill the MTC’s requirement for providing a<br />
comprehensive street condition assessment known as the Pavement Condition Index (PCI). The<br />
PCI generates a numerical rating that enables the MTC and local jurisdictions to evaluate the<br />
relative condition <strong>of</strong> their streets and roads. <strong>Concord</strong>’s current PCI <strong>of</strong> 79 generates a “Very<br />
Good” rating and is in the top 10% <strong>of</strong> all Bay Area local governments. It is also well above the<br />
average rating <strong>of</strong> 64 and ahead <strong>of</strong> all Contra Costa County cities with the exception <strong>of</strong><br />
Brentwood which benefits, for the purpose <strong>of</strong> this rating process, from the presence <strong>of</strong> new<br />
infrastructure because <strong>of</strong> residential development.<br />
The return on investment is well demonstrated when the PCI is compared with the street<br />
maintenance expenditure per mile reported by cities to MTC for 2002-2005. <strong>Concord</strong>’s<br />
expenditure <strong>of</strong> $13,389 per mile is slightly above the regional median <strong>of</strong> $11,792. By<br />
comparison, per mile infrastructure cost in Brentwood is $80,192. Staff believes this reflects the<br />
combination <strong>of</strong> street maintenance, reconstruction and new construction expended through by<br />
xxi
Budget Message for FY 2007-08 and Ten-Year Financial Plan<br />
April 16, 2007<br />
Page 15<br />
public and private sources. In any case, a comparison <strong>of</strong> <strong>Concord</strong>’s and Brentwood’s<br />
expenditure per street mile as summarized in the MTC report supports the relative low cost <strong>of</strong><br />
preventative maintenance compared to new construction and reconstruction.<br />
The initial estimates for the Ten-Year plan for street maintenance based on the current rate <strong>of</strong><br />
expenditure and availability <strong>of</strong> funds from Gas Tax, Proposition 111, Measure C and Measure J<br />
projected a deficit beginning in FY 2008-09 that would have escalated to $9.5 million by FY<br />
2016-17. Strategies needed to be developed that would address the looming deficit without<br />
generating a backlog <strong>of</strong> deferred maintenance. These strategies needed to focus on both<br />
revenues and expenditures.<br />
The proposed Ten-Year plan for the street maintenance (Attachment No. 3) includes a one-time<br />
infusion <strong>of</strong> funds from Proposition 1B (State Infrastructure Bond) and AB 2928 (Proposition 42)<br />
that will supplement Gas Tax, Prop 111, Measure C and Measure J funds. Proposition 1B funds<br />
are allocated to local governments based on a per capita formula; <strong>Concord</strong>’s allocation is<br />
estimated at about $4 million. However, the Legislatives Analyst’s Office indicated that there is<br />
a potential for reducing the amounts (particularly in the early years) if the transit tax revenue<br />
does not meet the projections. For planning purposes, staff has assumed 80% <strong>of</strong> the anticipated<br />
revenue and will adjust the amount next fiscal year when updated information becomes<br />
available. Therefore, the Ten-Year plan allocates $3.2 million spread over 9 years based on the<br />
Governor’s January budget proposal. The proposed Ten-Year plan also includes AB 2928<br />
funding <strong>of</strong> $1.1 million in FY 2007-08 and $1.3 million in FY 2008-09 for a total <strong>of</strong> $2.4<br />
million.<br />
The $3.2 million from Proposition 1B and $2.4 million from AB 2928 provides a total <strong>of</strong> $5.6<br />
million in one-time funds for the proposed Ten-Year plan. However, this infusion will not<br />
address the entire $9.5 million deficit. To address the remaining deficit, the proposed Ten-Year<br />
Street Maintenance Plan includes the following strategies:<br />
• Implement pavement overlay or rehabilitation contingent on receipt <strong>of</strong> grant funding -<br />
Over the years, the <strong>City</strong> has received State Transportation Improvement Program (STIP)<br />
grant funds to rehabilitate arterial streets such as Kirker Pass Road, Ygnacio Valley<br />
Road, Treat Boulevard and Clayton Road. This is a short term recommendation that<br />
would allow staff, at a later time, to reevaluate funding availability and the need to<br />
implement the right preventative maintenance measure at the right time.<br />
• Moderate sidewalk funding by providing funding every other year instead <strong>of</strong> every year -<br />
Over the past decade, the <strong>City</strong> has invested heavily on its sidewalk program. The <strong>City</strong><br />
has also been very successful in obtaining grants for sidewalk projects, thus leveraging<br />
the <strong>City</strong>’s resources. The moderation <strong>of</strong> funding to alternate years reflects the significant<br />
level <strong>of</strong> past investment.<br />
The proposed Ten-Year plan appropriates an average <strong>of</strong> $4.7 million per year to street related<br />
projects. The 10 th year balance <strong>of</strong> about $150,000 (barely 1/3 <strong>of</strong> 1% <strong>of</strong> the average annual<br />
xxii
Budget Message for FY 2007-08 and Ten-Year Financial Plan<br />
April 16, 2007<br />
Page 16<br />
appropriation <strong>of</strong> $4.7 million) and the infusion <strong>of</strong> one-time funds along with the receipt <strong>of</strong> grants<br />
for the street overlay and rehabilitation program indicate that funding problems will continue. It<br />
is important for the <strong>City</strong> to implement long term strategies to address the escalating street<br />
maintenance cost and lack <strong>of</strong> available funding. Along this line, staff recommends the <strong>City</strong><br />
Council’s consideration <strong>of</strong> the following strategies:<br />
1. Reduce or limit the future maintenance burden to the <strong>City</strong> – Staff recommends that the<br />
<strong>City</strong> encourage private streets in new developments when appropriate. For example, the<br />
<strong>City</strong> could require future residential developments to include Homeowners Associations<br />
that have the financial ability to maintain the streets. It may be necessary for the <strong>City</strong> to<br />
transition the cost <strong>of</strong> sidewalk maintenance to the property owners as some cities already<br />
do.<br />
2. Increase the <strong>City</strong>’s maintenance fund revenue – Staff recommends that the <strong>City</strong> support<br />
the Strategic Plan developed by MTC’s Local Streets & Roads Committee, which<br />
provides a number <strong>of</strong> initiatives that could potentially increase the maintenance funding<br />
for local agencies. At the <strong>City</strong> level, staff recommends that the <strong>City</strong> collect cash or<br />
deposits for Deferred Improvement Agreements (DIA) associated with frontage<br />
improvements related to developments. Staff believes that the developer is in a much<br />
better financial position to secure the obligation when compared to individual property<br />
owners who have not budgeted for the cost if the <strong>City</strong> activates the DIA in the future.<br />
3. Follow the maintenance schedule per MTC’s Pavement Management System (PMS) -<br />
Implement the appropriate pavement preventative maintenance measure at the right time<br />
to ensure that the <strong>City</strong> is maintaining its streets in a cost-effective manner. This is a case<br />
<strong>of</strong> “pay me now or pay me later” scenario. As previously discussed, deferred<br />
maintenance is costly. For every dollar expended at the right time could cost the <strong>City</strong><br />
about $10 if the maintenance is deferred.<br />
If infusion <strong>of</strong> further maintenance funds such as Proposition 1B and AB 2928 and receipt <strong>of</strong><br />
grants do not materialize in the future, the street maintenance program will be curtailed and a<br />
backlog will build up to the point that costly rehabilitation projects will be required to make local<br />
streets and roads passable. The Council may recall that these conditions existed in <strong>Concord</strong> in<br />
the mid-1990s when inefficient operations and declining revenues reduced many <strong>City</strong> programs,<br />
including street maintenance. As the local economy generated additional income and the <strong>City</strong><br />
implemented performance measures to improve the efficiency <strong>of</strong> all operations, a determined<br />
effort was made to address the backlog <strong>of</strong> deferred street maintenance. This effort included an<br />
infusion from the <strong>City</strong>’s General Fund since it was impossible to rely solely on existing street<br />
maintenance funding sources. By 2000, the backlog was addressed and the required level <strong>of</strong><br />
street maintenance could be achieved by utilizing the present sources <strong>of</strong> funds. At this time, our<br />
General Fund resources are fully committed cannot be used to support street maintenance unless<br />
other services are significantly reduced. Staff believes it is critical to avoid any slippage back to<br />
the point that a backlog <strong>of</strong> deferred maintenance occurs.<br />
xxiii
Budget Message for FY 2007-08 and Ten-Year Financial Plan<br />
April 16, 2007<br />
Page 17<br />
3. Storm Water Special Revenue Fund<br />
The Storm Water Special Revenue Fund pays for implementing storm water pollution prevention<br />
and monitoring programs required by <strong>Concord</strong>'s National Pollutant Discharge Elimination<br />
System (NPDES) permit. The San Francisco Bay Regional Water Quality Control Board<br />
(SFBRWQCB) issued <strong>Concord</strong>'s first 5-year permit in 1994 under the Federal Clean Water Act.<br />
The <strong>City</strong>’s Clean Water Program is designed to meet mandated performance standards in five<br />
areas: New Development/Construction Controls, Public Education/Industrial Outreach,<br />
Municipal Maintenance (street sweeping, storm drain maintenance, and creek maintenance),<br />
Business Inspections, and Illicit Discharge Control. On July 21, 1999 the SFBRWQCB issued a<br />
second 5-year NPDES permit to <strong>Concord</strong> and twenty other co-permittees in Contra Costa<br />
County. This permit has been administratively extended while the SFBRWQCB works on a<br />
joint municipal regional permit for all <strong>of</strong> the Bay Area Clean Water Programs. The current<br />
permit increased the number <strong>of</strong> performance standards from 80 in 1994 to 257 in 1999. In<br />
addition, C.3 provisions for new development were added in 2003. The next joint municipal<br />
regional permit will likely be even more stringent and compliance more costly.<br />
Total Maximum Daily Load (TMDL) will be included with the new municipal regional permit<br />
under development. Section 303(d) <strong>of</strong> the federal Clean Water Act requires that the State Water<br />
Board identify water bodies that do not meet water quality standards, examine the water quality<br />
problems, identify sources <strong>of</strong> pollutants, and specify corrective actions. TMDLs must account<br />
for all the sources <strong>of</strong> a pollutant, including discharges from wastewater treatment facilities,<br />
run<strong>of</strong>f from homes, agriculture, streets, highways, contaminated industrial sites, and deposits<br />
from the air. The TMDL for mercury was approved by the SFBRWQCB in September 2004 and<br />
is scheduled for implementation with the new municipal regional permit. TMDLs for diazinon,<br />
nickel, and PCBs are under development and are expected to be implemented following the<br />
implementation <strong>of</strong> the mercury TMDL. In total, the SFBRWQCB is developing more than 30<br />
TMDLs to address more than one hundred sixty 303(d) listings for water bodies impaired by<br />
specific pollutants. In addition to accounting for past and current activities, TMDLs must<br />
consider future development that could increase pollutant levels.<br />
Program revenue is capped at $35 per equivalent run<strong>of</strong>f unit (ERU) - each single-family<br />
residence represents one equivalent unit. The assessment can be increased only by a two-thirds<br />
majority <strong>of</strong> property owners voting on a Proposition 218 ballot. With inflation, increased<br />
NPDES permit compliance requirements, and increased personnel benefits costs, this fund is<br />
projected to go negative in FY 2014-2015 (see Attachment No. 4 Storm Water Ten-Year Plan).<br />
Depending on how much more costly the new Municipal Regional Permit will be to comply with<br />
than our existing permit, the plan could go negative much sooner. Funds are being set-aside by<br />
the Contra Costa Clean Water Program for a Proposition 218 initiative in 2008 to generate more<br />
storm water revenue.<br />
A county-wide, two-phased survey <strong>of</strong> likely voters was conducted in Fall <strong>of</strong> 2006 to assess<br />
support for a Proposition 218 vote this year. Results were not encouraging. For a ballot to pass<br />
successfully, survey results should have shown that at least 50% <strong>of</strong> respondents would<br />
xxiv
Budget Message for FY 2007-08 and Ten-Year Financial Plan<br />
April 16, 2007<br />
Page 18<br />
“definitely” support the initiative. Depending on the location, only 14.3% - 22.3% <strong>of</strong> all the<br />
residents in Contra Costa County said they would “definitely” support the initiative. The reasons<br />
for low support included: voter fatigue, the economy, and lack <strong>of</strong> name recognition. Few<br />
potential voters knew anything about the Contra Costa Clean Water Program. Based on these<br />
results, co-permittees agreed to postpone the proposed ballot until November 2008 while<br />
concentrating on public outreach and education to raise public awareness <strong>of</strong> our efforts. In<br />
Summer 2008, the Contra Costa Clean Water Program will do another survey to re-assess public<br />
sentiment.<br />
The biggest challenge to our Clean Water Program will be long term funding. The situation is<br />
likely to get worse with ever increasing new requirements being imposed by the SFBRWQCB.<br />
Four recent legislative efforts to increase resources for the program have proven unsuccessful:<br />
• Assembly Constitutional Amendment 13 (Harmon) would have redefined storm water<br />
fees as not subject to the restrictions <strong>of</strong> Proposition 218. It expired in committee in 2005.<br />
• Senate Bill 658 (Kuehl) that would have instituted a $6.00 charge on vehicle license fees<br />
to fund storm water programs was vetoed by Governor Schwarzenegger in 2005.<br />
• Assembly Bill 1623, (Klehs) that would have authorized a $5 charge on vehicle license<br />
fees to mitigate impacts <strong>of</strong> motor vehicles was vetoed by Governor Schwarzenegger in<br />
2005.<br />
• Assembly Bill 2444 (Klehs) would have authorized the Bay Area Air Quality<br />
Management District to impose a $5 charge on vehicle license fees for mitigation <strong>of</strong><br />
impacts <strong>of</strong> motor vehicles on the environment including storm water run<strong>of</strong>f. It was<br />
vetoed by the Governor in 2006.<br />
<strong>Concord</strong>'s Mayor, Vice-mayor, <strong>City</strong> Manager, Assistant <strong>City</strong> Manager, and <strong>City</strong> staff have met<br />
with State legislators to ask for help in with storm water requirements. They met with Senator<br />
Tom Torlakson on February 16, 2007 and with Assembly Member Mark DeSaulnier on February<br />
23, 2007. Senator Torlakson, in particular, assured the visitors that he will work on balancing<br />
the implementation <strong>of</strong> new requirements with the resources cities have available.<br />
There are three general areas <strong>of</strong> concern that our legislators need to address. First, there is a lack<br />
<strong>of</strong> funding to implement current storm water requirements at the municipal level. Local<br />
jurisdictions are not able to raise storm water assessments without a Proposition 218 vote.<br />
<strong>Concord</strong>'s storm water program is projected to go negative. Second, a host <strong>of</strong> unfunded<br />
requirements imposed on local jurisdictions including TMDL's and C.3 requirements. Third,<br />
unrealistic new storm water requirements proposed for the Municipal Regional Permit, the<br />
Stream and Wetlands Protection Policy, the State-wide Construction General Permit, etc. Staff<br />
will continue to work with legislators for a long-term solution to these problems and lead and<br />
continue to encourage the County and other cities in working with their legislators as well.<br />
xxv
Budget Message for FY 2007-08 and Ten-Year Financial Plan<br />
April 16, 2007<br />
Page 19<br />
4. Downtown Landscape Maintenance District<br />
The Downtown Landscape Maintenance District provides all landscape services for the Central<br />
<strong>Concord</strong> area, including Todos Santos Plaza and the median islands on Willow Pass Road<br />
(between East Street and Contra Costa Boulevard), <strong>Concord</strong> Avenue and Market Street. <strong>City</strong><br />
employees provide all maintenance services charged to the District. Beginning in FY 2004-05,<br />
the Downtown Maintenance District absorbed the cost <strong>of</strong> maintaining the "Living Flag" in Todos<br />
Santos Plaza. This cost was previously charged to the General Fund. This floral display was<br />
constructed as a temporary display for the 2002 Winter Olympic Torch Relay celebration and<br />
was so well received by citizens that the <strong>City</strong> continued to maintain the display following the<br />
event.<br />
Attachment No. 5 is the Ten-Year Plan for the Downtown District. The Plan shows that the<br />
District will become negative in FY 2009-10 if revenues and/or expenditures are not adjusted.<br />
Staff is currently conducting a Proposition 218 ballot election to increase the assessments in the<br />
Downtown District with ballots having been sent to property owners on April 18, 2007. <strong>City</strong> and<br />
Redevelopment Agency owned properties located in the District are also assessed and issued<br />
ballots. The proposed increase will include an annual Consumer Price Index (CPI) adjustment<br />
with the minimum increase <strong>of</strong> 3% and a maximum <strong>of</strong> 5%. Ballots will be counted at the June 5,<br />
2007 Council Meeting. If this ballot is successful, the <strong>City</strong> will be able to maintain the level <strong>of</strong><br />
service for the Downtown area and the positive fiscal condition for the District.<br />
5. Pine Hollow Landscape Maintenance District<br />
The Pine Hollow Landscape Maintenance District provides all landscape services for the area<br />
bordering Pine Hollow Road east <strong>of</strong> Ygnacio Valley Road. All <strong>of</strong> the landscape services charged<br />
to the Pine Hollow District are provided through a maintenance contract managed by the Public<br />
Works Department. Council awarded a contract last year with the option for two additional<br />
years. A new contract was awarded this March accepting the second year option. The proposed<br />
Ten-Year Plan (see Attachment No. 6) shows that the District is balanced through FY 2016-17,<br />
but based on the current projections will go negative in the 11 th year. Staff believes that actions<br />
should be implemented in FY 2014-15 to insure the long term solvency <strong>of</strong> this fund.<br />
6. Landscape and Lighting Maintenance District No. 3<br />
Landscape and Lighting Maintenance District No. 3 is comprised <strong>of</strong> four Benefit Zones,<br />
Kirkwood, Ygnacio Woods, Balhan Terrace and Valley Terrace, all residential neighborhoods in<br />
the Clayton Valley District <strong>of</strong> the <strong>City</strong>. With the exception <strong>of</strong> Ygnacio Woods, landscape<br />
services charged to District No. 3 are provided through a contract managed by the Public Works<br />
Department. Council awarded a contract last year with the option for two additional years. A<br />
new contract was awarded this March accepting the second year option. <strong>City</strong> employees provide<br />
landscape services for Ygnacio Woods. Staff has combined these districts into a single Ten-Year<br />
Plan because they were formed by the same <strong>City</strong> Council action on June 25, 1979 (see<br />
Attachment No. 7). Staff has also developed Ten-Year Plans showing the assessments and<br />
xxvi
Budget Message for FY 2007-08 and Ten-Year Financial Plan<br />
April 16, 2007<br />
Page 20<br />
expenditures for each <strong>of</strong> the Benefit Zones within District No. 3. Appropriate financial<br />
management <strong>of</strong> these individual zones requires the expenses and assessments for each area to be<br />
reviewed separately. A successful Proposition 218 ballot for Ygnacio Woods was conducted in<br />
FY 2004-05 to increase the annual assessments beginning in FY 2005-06 and putting an<br />
automatic inflation factor into the rates to insure its long term solvency. All <strong>of</strong> the Ten-Year<br />
Plans for District No. 3 are balanced through FY 2016-17. Beginning in FY 2007-08 a Capital<br />
Reserve Fund <strong>of</strong> approximately $3,000 each year will be established to provide for the funding<br />
<strong>of</strong> Capital Replacement items such as driveway paving or unexpected expenditures. Staff will<br />
continue to monitor each zone to insure their financial stability<br />
7. <strong>City</strong>wide Street Lighting Assessment District<br />
The <strong>City</strong>wide Street Light Assessment District provides street lighting services including<br />
electrical costs, street light repair and replacement, capital improvements, and Assessment<br />
District proceedings. The District includes all parcels <strong>of</strong> land within the incorporated limits <strong>of</strong><br />
the <strong>City</strong> <strong>of</strong> <strong>Concord</strong> that benefit from existing or newly installed streetlights.<br />
On April 2, 2002, the <strong>City</strong> Council authorized the purchase <strong>of</strong> PG&E’s existing street light<br />
system within the <strong>City</strong> <strong>of</strong> <strong>Concord</strong>. The agreement was finalized and transfer <strong>of</strong> ownership took<br />
place on April 22, 2005. The system was purchased for $1.2 million which included a loan from<br />
the Traffic Management Fund <strong>of</strong> $477,000. The Street Light Assessment District will pay the<br />
loan back over a six year period from ongoing savings in the District. Loan payments are<br />
currently scheduled to commence in FY 2011-12.<br />
The streetlight system is currently being maintained by <strong>City</strong> staff in the Public Works<br />
Department. Staff continues to work and coordinate with PG&E to achieve the optimal level <strong>of</strong><br />
service in the <strong>City</strong>. Beginning in FY 2005-06 the District absorbed the cost <strong>of</strong> an additional<br />
Traffic Signal Technician to perform maintenance on the additional lights purchased. Outages<br />
reported to the street light hotline are repaired within 48 hours. Quarterly night surveys and<br />
repairs are performed every 3 months along the major arterials in order to achieve the highest<br />
level <strong>of</strong> service. All maintenance and personnel costs are included in the Ten-Year Financial<br />
Plan. The Ten-Year Financial Plan remains balanced throughout the planning period.<br />
Attachment No. 8 represents the Ten-Year Financial Plan for the <strong>City</strong>wide Street Light<br />
Assessment District.<br />
8. Sewer Enterprise Fund<br />
This fund pays for the operation and maintenance <strong>of</strong> the <strong>City</strong>’s Sewage Pump Station and<br />
sewage collection system maintenance. It also pays Central Contra Costa Sanitary District<br />
(CCCSD) for the cost <strong>of</strong> treating the <strong>City</strong>’s sewage and for part <strong>of</strong> the capital costs associated<br />
with improving CCCSD’s sewage treatment plant. Attachment No. 9 presents the Twenty-Year<br />
Financial Plan being proposed for the Sewer Fund.<br />
xxvii
Budget Message for FY 2007-08 and Ten-Year Financial Plan<br />
April 16, 2007<br />
Page 21<br />
Based on the results <strong>of</strong> a study <strong>of</strong> the capacity and condition <strong>of</strong> the <strong>City</strong>’s concrete trunk sewer<br />
mains, a phased program to replace or rehabilitate a significant number <strong>of</strong> these mains was<br />
previously approved by Council. The total program was originally estimated to cost $48 million,<br />
but by competing different trenchless technologies against each other this work will end up<br />
costing less than half that amount. On January 6, 2004, Council approved the issuance <strong>of</strong> Sewer<br />
Revenue Certificates <strong>of</strong> Participation (COPs) to finance the $12.2 million first phase <strong>of</strong><br />
rehabilitation. That work was completed last year and included the rehabilitation <strong>of</strong> more than<br />
10 miles <strong>of</strong> deteriorated concrete trunk sewer mains.<br />
Currently, all sewage flowing to <strong>Concord</strong>’s Sewage Pump Station is pumped under Walnut<br />
Creek and then to CCCSD’s A-line located just east <strong>of</strong> I-680. This past year the <strong>City</strong> <strong>of</strong> <strong>Concord</strong><br />
and CCCSD began a joint project to construct a gravity-feed connection between the Pump<br />
Station and a new 96” diameter A-line Relief Interceptor sewer main that CCCSD will construct<br />
under Meridian Park Boulevard from Buchanan Fields Golf Course to Galaxy Way. Once this<br />
project is complete, <strong>Concord</strong>’s Sewage Pump Station can be taken out <strong>of</strong> service. The <strong>City</strong> is<br />
currently preparing to issue $12 million in COPs to finance the gravity connection to CCCSD’s<br />
A-line extension and the remaining rehabilitation work.<br />
Periodic sewer service rate increases are necessary to finance the COPs payments for these major<br />
projects as well as increased operating costs, and projected increases in CCCSD’s capital<br />
program. Beginning in FY 2001-02 periodic rate increases have been included throughout the<br />
Sewer Enterprise Twenty-Year Plan. An annual sewer service charge increase <strong>of</strong> $36 for FY<br />
2007-08 is projected in the current Twenty-Year Plan. Staff has conducted a Proposition 218<br />
notification discussing the proposed $36 increase to all property owners paying the annual sewer<br />
service charge in <strong>Concord</strong>, Clayton, and a portion <strong>of</strong> Contra Costa County.<br />
In prior years, the <strong>City</strong> has reduced expenditures for our direct operations and maintenance by<br />
revising operational activities and introducing more efficient work practices. Connecting to<br />
CCCSD by gravity flow instead <strong>of</strong> pumping to them will significantly reduce direct operation<br />
costs. Staff will continue to diligently review the sewer program to initiate efficiencies in the<br />
scheduled projects and in operations to limit/reduce any projected increases in later years.<br />
Future rate increases are shown in the attached Twenty-Year Plan.<br />
Staff continues to work with CCCSD to ensure that the <strong>City</strong>’s Sewer Enterprise budget is not<br />
impacted by unforeseen expenditures incurred in CCCSD’s capital programs (<strong>Concord</strong> pays for a<br />
percentage <strong>of</strong> their treatment plant capital improvements). CCCSD has been cooperative in<br />
providing budget information and including staff comments in their budget process.<br />
9. Golf Course Enterprise Fund<br />
The Golf Course Enterprise Fund pays for the operation and maintenance <strong>of</strong> the <strong>City</strong>-owned<br />
Diablo Creek Golf Course, which includes the Legends and Heroes Restaurant, pro shop, driving<br />
range and the 160-acre, 18–hole golf course facility. Concessionaires for the restaurant and pro<br />
shop pay the majority <strong>of</strong> the operational costs associated with the clubhouse building and return<br />
xxviii
Budget Message for FY 2007-08 and Ten-Year Financial Plan<br />
April 16, 2007<br />
Page 22<br />
a percentage <strong>of</strong> their gross income to the <strong>City</strong> as their monthly rent. A major capital<br />
improvement was completed in 1999, which included expansion <strong>of</strong> the parking lot, entryway<br />
landscaping, new irrigation system, golf cart paths, reconstruction <strong>of</strong> several greens, new<br />
bathrooms and other pertinent work. These improvements are being financed through bonds.<br />
Attachment No. 10 represents the proposed Ten-Year Financial Plan. The plan projects<br />
increases for green fees, driving range, and power cart rental income <strong>of</strong> approximately 5% - 10%<br />
every other year beginning in FY 2007-08. In recognition <strong>of</strong> the currently “s<strong>of</strong>t” market demand<br />
for golf within Northern California, rounds are significantly reduced from the previously<br />
projected 70,000 to 57,000 annually throughout the Ten-Year Plan. This condition reflects a<br />
trend that has affected golf courses within the region and throughout the United States. Since<br />
1997, several new daily fee public golf courses have opened up within Diablo Creek’s market<br />
area. As a result, the demand for golf has fallen to the current level.<br />
The continued downward trend in the number <strong>of</strong> rounds prompted staff to propose strategies in<br />
FY 2005-06 to significantly reduce costs. In recognition <strong>of</strong> the fact that the <strong>City</strong> operation <strong>of</strong> the<br />
golf course maintenance program was the single largest expense associated with the golf course,<br />
a study evaluating the feasibility <strong>of</strong> contracting for maintenance services was conducted. As a<br />
result <strong>of</strong> this study, the <strong>City</strong> Council approved an agreement with Valley Crest Golf Course<br />
Maintenance in November 2005 and contract maintenance began in January 2006. The updated<br />
Ten-Year Plan includes significantly revised maintenance costs that reflect the impact <strong>of</strong><br />
engaging Valley Crest. Valley Crest has provided maintenance services for over a year and a<br />
half and the course continues to generate a high level <strong>of</strong> customer satisfaction due to the upkeep<br />
<strong>of</strong> the course and grounds.<br />
The implementation <strong>of</strong> contract maintenance improved the expenditure side <strong>of</strong> the Golf Course<br />
Enterprise Fund. However, the reduction in rounds described above continues to impact revenue<br />
projections and impact the bottom line. As a result, the golf course continues to fall short <strong>of</strong><br />
meeting its entire fair share <strong>of</strong> the allocated costs <strong>of</strong> <strong>City</strong> provided administrative and general<br />
services which include services such as payroll, risk management and legal support. The<br />
inability <strong>of</strong> the golf course to meet its allocated cost obligations will continue to impact the<br />
General Fund. In addition, some capital projects such as the replacement <strong>of</strong> greens are being<br />
delayed until conditions improve. Some areas <strong>of</strong> deferred capital improvement cannot be<br />
delayed any further, however. During FY 2006-07 the pump station which provides water to the<br />
irrigation system will be replaced through a loan from the General Fund. The loan will be paid<br />
back within the next five years. In addition, the clubhouse ro<strong>of</strong> will be replaced in FY 2007-08.<br />
The s<strong>of</strong>t golf market is also impacting Diablo Creek’s business partners. Income generated from<br />
the Head Golf Pr<strong>of</strong>essional and food/beverage concession has been revised downward to reflect<br />
the current market.<br />
Staff will continue to manage and analyze the operations with the goal <strong>of</strong> making the operations<br />
self-sufficient. In FY 2007-08 a competitive services study for pr<strong>of</strong>essional golf services will be<br />
performed. The study is necessary because the current renewal term <strong>of</strong> the agreement between<br />
the <strong>City</strong> and the head golf pr<strong>of</strong>essional will expire on June 30, 2008. The agreement provides for<br />
one additional five year renewal option. The results <strong>of</strong> the study <strong>of</strong> the current market <strong>of</strong> golf<br />
xxix
Budget Message for FY 2007-08 and Ten-Year Financial Plan<br />
April 16, 2007<br />
Page 23<br />
pr<strong>of</strong>essional services to assess best practices in the field will be reviewed with the head golf<br />
pr<strong>of</strong>essional. Staff expects that the results <strong>of</strong> the study will facilitate the collaborative<br />
improvement <strong>of</strong> golf services.<br />
10. Pavilion<br />
Beginning in FY 2000-01, the Pavilion Fund was no longer an enterprise fund. This is due to the<br />
Council action to contract with Bill Graham Presents (BGP) for the complete operation and<br />
maintenance <strong>of</strong> the Pavilion. BGP is now a division <strong>of</strong> Live Nation Inc. (LNI).). While regular<br />
financial evaluations <strong>of</strong> the Pavilion’s status will continue, the financial reporting now required<br />
for the Pavilion has changed. Payments <strong>of</strong> debt service on the Pavilion’s bond issue are now<br />
recorded in the Debt Service Fund along with other non-enterprise <strong>City</strong> debt. The fixed assets<br />
have been transferred to the Fixed Asset Group <strong>of</strong> accounts where other city assets are recorded.<br />
Payments to the <strong>City</strong> from LNI are now recorded in the <strong>City</strong>’s General Fund.<br />
On April 11, 2006, the <strong>City</strong> Council approved an amendment to the Pavilion management<br />
agreement. The amendment renewed LNI’s operation <strong>of</strong> the Pavilion for two additional years to<br />
December 31, 2008. New financial terms, including a reduction in LNI’s obligation to guarantee<br />
the Pavilion’s annual debt service payment, were also part <strong>of</strong> the amendment. LNI is now<br />
required to pay $1,400,000 <strong>of</strong> the annual bond debt and will no longer cover 20% <strong>of</strong> the Director<br />
<strong>of</strong> Community & Recreation Services compensation effective January 1, 2007. These changes<br />
have required the <strong>City</strong> to assume expenditures <strong>of</strong> $378,060 and $376,710 from the General Fund<br />
in FY 2007-08 and FY 2008-09. It is possible that these expenditures could be <strong>of</strong>fset by the net<br />
income split conditions <strong>of</strong> the agreement which remain in place for the renewal term. These<br />
conditions require LNI to share any net income generated for the Pavilion based on the following<br />
formula:<br />
• 50% <strong>of</strong> net income for the first $200,00<br />
• 70% LNI/30% <strong>City</strong> <strong>of</strong> net income for the next $200,000<br />
• 80% LNI/20% <strong>City</strong> for net income over $400,000<br />
LNI is required to provide the <strong>City</strong> with a report on the audited statement <strong>of</strong> operations for the<br />
2006 season by approximately mid-April. Based on discussions with LNI <strong>of</strong>ficials and staff<br />
observations regarding the 2006 season, the report is expected to summarize a third consecutive<br />
year <strong>of</strong> financial loss at the Pavilion.<br />
In addition, the updated Ten-Year Plan assumes an annual expenditure for $200,000 for the<br />
<strong>City</strong>’s share <strong>of</strong> the debt service payment beginning in FY 2009-10. If the entertainment industry<br />
does not improve, it is possible that the <strong>City</strong> will need to expend more than $200,000 to cover the<br />
entire debt service.<br />
Staff believes it is critical to note that a commitment from LNI or another promoter to guarantee<br />
100% <strong>of</strong> the $1,775,000 Pavilion debt service payment is not likely if the entertainment industry<br />
does not significantly improve. In order to better evaluate the future condition <strong>of</strong> the<br />
xxx
Budget Message for FY 2007-08 and Ten-Year Financial Plan<br />
April 16, 2007<br />
Page 24<br />
entertainment industry and support staff’s future negotiations with LNI, the <strong>City</strong> has engaged<br />
Tonic Entertainment. A critical task that will be performed by Tonic as part <strong>of</strong> the agreement is<br />
completion <strong>of</strong> a report that analyzes the condition <strong>of</strong> the national and regional entertainment<br />
industry. Staff believes this report is critical to evaluating the Pavilion’s future economic and<br />
artistic success as a performing arts facility and support the identification <strong>of</strong> options to address<br />
the potential fiscal obligations.<br />
11. Redevelopment Agency<br />
In FY 2006-07, the <strong>Concord</strong> Redevelopment Agency accomplished a significant long-term<br />
project by including an additional 400 acres in the Redevelopment Plan, nearly doubling the size<br />
<strong>of</strong> the Redevelopment Area to include portions <strong>of</strong> North <strong>Concord</strong>, the Willow Pass Road<br />
Corridor, and the Monument Boulevard Corridor. The FY 2007-08 budget reflects this expanded<br />
scope for redevelopment by incorporating new projects that address adverse conditions in these<br />
areas, while continuing its emphasis on downtown revitalization, economic development, and<br />
affordable housing.<br />
In FY 2007-08, the Redevelopment Agency will focus on a combination <strong>of</strong> long-range planning,<br />
infrastructure investment, and project development. The Redevelopment Agency will update its<br />
Strategic Plan to incorporate these new areas and will participate in an update <strong>of</strong> the <strong>City</strong> <strong>of</strong><br />
<strong>Concord</strong>’s General Plan Housing Element. In the downtown, the Redevelopment Agency will<br />
continue work on redevelopment projects that expand residential, employment, retail, and dining<br />
opportunities in the city center and will invest in capital improvement programs to update<br />
streetscape, lighting, and undergrounding. The Redevelopment Agency will also be developing<br />
an Urban Design Plan and Design Guidelines for Monument Boulevard and will be providing<br />
matching funding for pedestrian and streetscape improvements to implement these plans.<br />
Entryway and downtown wayfinder programs are being designed that will project and build<br />
<strong>Concord</strong>’s image, locally and in the wider community by coordinating the <strong>City</strong> <strong>of</strong> <strong>Concord</strong>’s<br />
signage through incorporating a unified branding/identification theme. The Redevelopment<br />
Agency will continue to be actively involved in reuse planning for the <strong>Concord</strong> Naval Weapons<br />
Station through the process <strong>of</strong> adopting a new Redevelopment Area in the Naval Weapons<br />
Station. It will also continue funding Economic Development programs that enhance business<br />
performance in <strong>Concord</strong>, develop new jobs, expand business operations, and build important<br />
relationships with the local business community.<br />
The FY 2007-08 budget includes allocations to the following key projects to fulfill its objectives.<br />
• $320,000 for long range planning.<br />
• $800,000 for downtown streetscape and lighting.<br />
• $440,000 for implementation <strong>of</strong> the Monument Boulevard Urban Design Plan.<br />
• $355,000 for design and construction <strong>of</strong> an entryway and wayfinder program.<br />
• $1.9 million for Strategic Plan implementation.<br />
• $1.7 million for Naval Weapons Station planning.<br />
xxxi
Budget Message for FY 2007-08 and Ten-Year Financial Plan<br />
April 16, 2007<br />
Page 25<br />
A number <strong>of</strong> these projects are multi-year in nature and receive funding in future years <strong>of</strong> the<br />
Ten-Year Plan (See Attachment No.11).<br />
The Redevelopment Agency’s FY 2007-08 Ten-Year Plan begins with a fund balance <strong>of</strong> $7.6<br />
million. Gross tax increment is projected to be $14.9 million. Deducting pass-through<br />
payments, tax increment rebates, and the low and moderate income housing transfer, net tax<br />
increment is projected to be $10.8 million. The Agency’s funding for low and moderate income<br />
housing equals 20 percent <strong>of</strong> gross tax increment, or $2.9 million. Other sources <strong>of</strong> revenue<br />
include interest, ground lease payments, loan repayments, and rents. Accounting for all sources,<br />
there is $12.3 million in revenue available for operations, debt service and capital projects.<br />
The Agency’s major expenses are operating costs <strong>of</strong> $3.4 million, debt service <strong>of</strong> $7.8 million,<br />
and $5.6 million in capital projects. The Agency’s operating budget primarily consists <strong>of</strong><br />
salaries, consultant and contract services, fixed charges, and expenditures for <strong>City</strong> provided<br />
administrative & general services.<br />
The Agency’s Ten-Year Plan is balanced overall. On an ongoing basis, Redevelopment Agency<br />
revenues exceed operating costs. Agency reserves are reduced by capital improvement<br />
allocations that vary on an annual basis. In FY 2007-08 total uses <strong>of</strong> funds exceed sources <strong>of</strong><br />
funds by $4.8 million, reducing the fund balance at the end <strong>of</strong> the year to $2.7 million.<br />
Continuing allocations to capital programs throughout the projection period have the affect <strong>of</strong><br />
further reducing unallocated fund balance to a projected $349,251 in FY 2010-11. After this<br />
year, unallocated fund balance grows to $2.8 million by the end <strong>of</strong> the ten year projection period.<br />
F. Reserve Funds<br />
To sustain <strong>City</strong> functions and to enable effective decision making in the face <strong>of</strong> significant and<br />
unanticipated negative fiscal challenges, the <strong>City</strong> formally established by policy the following<br />
four reserve funds in 2003, which are maintained according to the Council’s Budget and Fiscal<br />
Policy:<br />
• Benefits Reserve – Funds are set aside to support unplanned costs and obligations <strong>of</strong><br />
existing employment benefits (not available for MOU negotiation). The balance as <strong>of</strong><br />
July 1, 2007, is estimated at $826,000. If present trends in experienced workers<br />
compensation claims continues this reserve anticipates transfers <strong>of</strong> funds from the<br />
Workers’ Compensation internal service fund <strong>of</strong> $200,000 a year beginning in FY 2009-<br />
10.<br />
• Economic Contingency Reserve – Funds are set aside to supplement General Fund<br />
revenues in the event <strong>of</strong> a severe economic downturn that depletes or significantly<br />
reduces estimated operating revenues. The balance as <strong>of</strong> July 1, 2007, is estimated at<br />
$11.5 million and transfers from this reserve into the General Fund to support operations<br />
are not planned in the next ten years.<br />
• Unforecasted Reserve – Funds are set aside to provide or continue services if external<br />
funding sources, such as the State, Federal or grant opportunities, do not materialize or<br />
xxxii
Budget Message for FY 2007-08 and Ten-Year Financial Plan<br />
April 16, 2007<br />
Page 26<br />
are lost to <strong>of</strong>fset future unfunded mandates. The balance as <strong>of</strong> July 1, 2007, is estimated<br />
at $1.8 million with an increase <strong>of</strong> $100,000 during FY 2007-08. Over the life <strong>of</strong> the<br />
Ten-Year Plan, another $1.3 million is planned to be set aside in this reserve.<br />
• Capital/Maintenance Reserve – Funds are set aside for facility failures or unexpected,<br />
unplanned major capital and maintenance projects. The balance as <strong>of</strong> July 1, 2007, is<br />
estimated at $1.5 million with an increase <strong>of</strong> $100,000 during FY 2007-08. Over the life<br />
<strong>of</strong> the Ten-Year Plan, another $1.3 million is planned to be set aside in this reserve.<br />
Full funding is achieved when the reserve funds in aggregate comprise 20% <strong>of</strong> the General Fund<br />
operating budget. The FY 2007-08 Proposed Budget and Ten-Year Financial Plan meets these<br />
criteria on average over the life <strong>of</strong> the plan. In summary, the combined balance <strong>of</strong> the four<br />
reserve funds as <strong>of</strong> June 30, 2008, is estimated to be $15.9 million which represents 20.59% <strong>of</strong><br />
the recommended General Fund operating expenditures and therefore complies with Policy and<br />
Procedure No. 129, Budget and Fiscal Policies.<br />
G. Budget and Fiscal Policies<br />
The Budget and Fiscal Policies adopted by the <strong>City</strong> Council in Policy and Procedure No. 129<br />
guide budget decisions toward maintaining the <strong>City</strong>’s long-term financial stability to ensure that<br />
basic <strong>City</strong> services are delivered, and that the investment in public infrastructure and facilities is<br />
protected. The policy statement was recently amended to provide for an annual review <strong>of</strong> the<br />
performance based budget and Ten-Year Plan. The policy includes eight categories with<br />
pertinent policies related to each. The categories include guidance regarding Ten-Year planning,<br />
Performance Based Budgeting, Capital Improvement Program, Internal Service Funds,<br />
Enterprise Funds, Investment Policies/Financial Practices, Annual Budget Review and Reserve<br />
Funds. The budget being recommended to the <strong>City</strong> Council complies with the Budget and Fiscal<br />
policies presented in Policy and Procedure No. 129.<br />
Conclusion<br />
The Budget Team <strong>of</strong> Finance Director Peggy Lefebvre, Budget Officer Ron Buck, Assistant <strong>City</strong><br />
Manager Mark Deven deserve recognition for the many hours we’ve sat in review with<br />
individual departments, as well as the pr<strong>of</strong>essional skill the Budget Team has demonstrated and<br />
the contributions they have made in preparation <strong>of</strong> this budget. The <strong>City</strong> is fortunate to have<br />
such a dedicated team, and I heartily express my appreciation for their work and expertise. The<br />
proposed General Fund FY 2007-08 Budget and Ten-Year Plan are balanced, and that is an<br />
achievement given our ever more constrained resources.<br />
When the <strong>City</strong> Council made such difficult decisions in FY 2003-04 to withdraw a number <strong>of</strong><br />
new projects, we gained a new footing on financial stability; however, the challenges have not<br />
diminished, and that action was worthwhile in “buying” time to reassess. Our long-range<br />
financial planning is an invaluable tool as we conduct the ongoing assessments <strong>of</strong> our operation<br />
and the soundness <strong>of</strong> the future <strong>of</strong> all our funding sources in our efforts to sustain quality service<br />
delivery. Unlike many agencies, the <strong>City</strong> Council has already made progress in funding our<br />
xxxiii
Budget Message for FY 2007-08 and Ten-Year Financial Plan<br />
April 16, 2007<br />
Page 27<br />
OPEB obligation, because we saw it coming in the Ten-Year Financial Plan. The long-range<br />
financial plan for Diablo Creek Golf Course laid out the need for changes in operation. There<br />
are other areas <strong>of</strong> the <strong>City</strong>’s operation that may need to change just as significantly. I very much<br />
appreciate that the <strong>City</strong> Council, faced with these difficult decisions, has placed the long-term<br />
beneficial outcome <strong>of</strong> the decision ahead <strong>of</strong> the shorter-term considerations, and recognized the<br />
broader improvement to be gained for the community.<br />
<strong>City</strong> employees through their commitment to the <strong>City</strong>’s Mission Vision and Values recognize<br />
and participate in an organization where innovation is part <strong>of</strong> doing business. The reassessment<br />
and innovation must continue to be focused on providing quality services through our adopted<br />
system <strong>of</strong> Community Oriented Government. Those principles recognize all <strong>City</strong> services as<br />
essential to the quality <strong>of</strong> life in <strong>Concord</strong>. We’ve continued to grow the workforce smaller along<br />
with a budget that is thinner. We are at the point where further reductions in staff providing<br />
services to a growing and changing community cannot be accomplished without affecting service<br />
levels. We need to be yet more creative and willing to change our ways <strong>of</strong> doing business to<br />
meet this challenge, and the <strong>City</strong> will continue to enhance the quality <strong>of</strong> life for its residents.<br />
“Our mission is to join with our community to make <strong>Concord</strong><br />
a city <strong>of</strong> the highest quality. We do this by providing<br />
responsive, cost effective, and innovative<br />
local government services.”<br />
______________________________<br />
Lydia E. Du Borg<br />
<strong>City</strong> Manager<br />
Attachments:<br />
No. 1 - Proposed General Fund 10-Year Financial Plan and Reserves<br />
No. 2 - Other Post Employment Benefits (OPEB) - Ten Year Projection<br />
No. 3 - Street Maintenance Program<br />
No. 4 - Storm Water Fund - Ten Year Projection<br />
No. 5 - Downtown Landscape Maintenance District - Ten Year Projection<br />
No. 6 - Pine Hollow Landscape Maintenance District - Ten Year Projection<br />
No. 7 - Landscape Maintenance District No.3 - Ten Year Projection<br />
No. 8 - Street Lighting Maintenance District - Ten Year Projection<br />
No. 9 - Sewer Enterprise – Twenty Year Projection<br />
No. 10 - Golf Course – Ten Year Projection<br />
No. 11 - Redevelopment Agency- Ten Year Projection<br />
xxxiv
xxxv<br />
<strong>City</strong> <strong>of</strong> <strong>Concord</strong><br />
General Fund<br />
Ten Year Projection<br />
For the Year Ending June 30, 2008<br />
2007-08 2008-09 2009-10 2010-11 2011-12 2012-13 2013-14 2014-15 2015-16 2016-17<br />
Fund Balance 7/01 $ 9,913,563 $ 8,520,086 $ 8,223,161 $ 8,711,033 $ 8,897,994 $ 9,196,685 $ 9,534,940 $ 9,857,560 $ 10,154,964 $ 10,526,877<br />
Add:<br />
Revenues $ 76,494,312 $ 79,536,432 $ 82,493,642 $ 85,259,292 $ 88,425,720 $ 91,526,736 $ 94,875,822 $ 98,119,745 $ 102,066,535 $ 105,831,198<br />
Less:<br />
Operating Expenditures $ 76,956,176 $ 78,908,034 $ 81,191,738 $ 84,411,991 $ 87,464,219 $ 90,523,127 $ 93,685,227 $ 96,951,667 $ 100,821,167 $ 104,562,031<br />
Revenue Over(Under)<br />
Expenditures $ (461,864) $ 628,398 $ 1,301,904 $ 847,301 $ 961,501 $ 1,003,609 $ 1,190,595 $ 1,168,078 $ 1,245,368 $ 1,269,167<br />
10% Contingency Reserve $ 7,695,618 $ 7,890,803 $ 8,119,174 $ 8,441,199 $ 8,746,422 $ 9,052,313 $ 9,368,523 $ 9,695,167 $ 10,082,117 $ 10,456,203<br />
Less:<br />
Capital Improvement Projects (CIP) $ 731,613 $ 725,323 $ 614,032 $ 460,340 $ 462,810 $ 465,354 $ 467,975 $ 470,674 $ 473,455 $ 476,319<br />
Other Financing Sources:<br />
Intra-fund Transfers In $ - $ - $ - $ - $ - $ - $ - $ - $ - $<br />
-<br />
Intra-fund Transfers Out 200,000 200,000 200,000 200,000 200,000 200,000 400,000 400,000 400,000 400,000<br />
Total Intra-fund Transfers $ (200,000) $ (200,000) $ (200,000) $ (200,000) $ (200,000) $ (200,000) $ (400,000) $ (400,000) $ (400,000) $ (400,000)<br />
Fund Balance 6/30 $ 824,468 $ 332,358 $ 591,859 $ 456,795 $ 450,263 $ 482,627 $ 489,037 $ 459,797 $ 444,760 $ 463,522<br />
ATTACHMENT NO. 1<br />
Page 1 <strong>of</strong> 3
xxxvi<br />
<strong>City</strong> <strong>of</strong> <strong>Concord</strong><br />
General Fund Reserve Funds<br />
Ten Year Projection<br />
For the Year Ending June 30, 2008<br />
2007-08 2008-09 2009-10 2010-11 2011-12 2012-13 2013-14 2014-15 2015-16 2016-17<br />
Benefits Reserve<br />
Fund Balance 7/01 $ 825,684 $ 854,583 $ 888,767 $ 1,138,205 $ 1,400,115 $ 1,675,121 $ 1,963,877 $ 2,267,071 $ 2,585,424 $ 2,919,696<br />
Interest Earnings $ 28,899 $ 34,183 $ 49,438 $ 61,910 $ 75,006 $ 88,756 $ 103,194 $ 118,354 $ 134,271 $ 150,985<br />
Fund Transfers<br />
Inter-Fund Transfers In $ - $ - $ 200,000 $ 200,000 $ 200,000 $ 200,000 $ 200,000 $ 200,000 $ 200,000 $ 200,000<br />
Transfers Out -<br />
-<br />
-<br />
-<br />
-<br />
-<br />
-<br />
-<br />
-<br />
-<br />
Total Intra-Fund Transfers $ - $ - $ 200,000 $ 200,000 $ 200,000 $ 200,000 $ 200,000 $ 200,000 $ 200,000 $ 200,000<br />
Fund Balance 6/30 $ 854,583 $ 888,767 $ 1,138,205 $ 1,400,115 $ 1,675,121 $ 1,963,877 $ 2,267,071 $ 2,585,424 $ 2,919,696 $ 3,270,680<br />
Economic Contingency<br />
2007-08 2008-09 2009-10 2010-11 2011-12 2012-13 2013-14 2014-15 2015-16 2016-17<br />
Fund Balance 7/01 $ 11,512,802 $ 11,512,802 $ 11,512,802 $ 11,512,802 $ 11,512,802 $ 11,512,802 $ 11,512,802 $ 11,512,802 $ 11,512,802 $ 11,512,802<br />
Interest Earnings $ - $ - $ - $ - $ - $ - $ - $ - $ - $ -<br />
Intra-Fund Transfers<br />
Transfers In $ - $ - $ - $ - $ - $ - $ - $ - $ - $ -<br />
Transfers Out -<br />
-<br />
-<br />
-<br />
-<br />
-<br />
-<br />
-<br />
-<br />
-<br />
Total Intra-Fund Transfers $ - $ - $ - $ - $ - $ - $ - $ - $ - $ -<br />
Fund Balance 6/30 $ 11,512,802 $ 11,512,802 $ 11,512,802 $ 11,512,802 $ 11,512,802 $ 11,512,802 $ 11,512,802 $ 11,512,802 $ 11,512,802 $ 11,512,802<br />
ATTACHMENT NO. 1<br />
Page 2 <strong>of</strong> 3
xxxvii<br />
Unforcasted Reserve<br />
<strong>City</strong> <strong>of</strong> <strong>Concord</strong><br />
General Fund Reserve Funds<br />
Ten Year Projection<br />
For the Year Ending June 30, 2008<br />
2007-08 2008-09 2009-10 2010-11 2011-12 2012-13 2013-14 2014-15 2015-16 2016-17<br />
Fund Balance 7/01 $ 1,801,043 $ 1,901,043 $ 2,001,043 $ 2,101,043 $ 2,201,043 $ 2,301,043 $ 2,401,043 $ 2,601,043 $ 2,801,043 $ 3,001,043<br />
Interest Earnings $ - $ - $ - $ - $ - $ - $ - $ - $ - $ -<br />
Intra-Fund Transfers<br />
Transfers In $ 100,000 $ 100,000 $ 100,000 $ 100,000 $ 100,000 $ 100,000 $ 200,000 $ 200,000 $ 200,000 $ 200,000<br />
Transfers Out -<br />
-<br />
-<br />
-<br />
-<br />
-<br />
-<br />
-<br />
-<br />
-<br />
Total Intra-Fund Transfers $ 100,000 $ 100,000 $ 100,000 $ 100,000 $ 100,000 $ 100,000 $ 200,000 $ 200,000 $ 200,000 $ 200,000<br />
Fund Balance 6/30 $ 1,901,043 $ 2,001,043 $ 2,101,043 $ 2,201,043 $ 2,301,043 $ 2,401,043 $ 2,601,043 $ 2,801,043 $ 3,001,043 $ 3,201,043<br />
Maintenance & Capital<br />
2007-08 2008-09 2009-10 2010-11 2011-12 2012-13 2013-14 2014-15 2015-16 2016-17<br />
Fund Balance 7/01 $ 1,500,000 $ 1,600,000 $ 1,700,000 $ 1,800,000 $ 1,900,000 $ 2,000,000 $ 2,100,000 $ 2,300,000 $ 2,500,000 $ 2,700,000<br />
Interest Earnings $ - $ - $ - $ - $ - $ - $ - $ - $ - $ -<br />
Intra-Fund Transfers<br />
Transfers In $ 100,000 $ 100,000 $ 100,000 $ 100,000 $ 100,000 $ 100,000 $ 200,000 $ 200,000 $ 200,000 $ 200,000<br />
Transfers Out -<br />
-<br />
-<br />
-<br />
-<br />
-<br />
-<br />
-<br />
-<br />
-<br />
Total Intra-Fund Transfers $ 100,000 $ 100,000 $ 100,000 $ 100,000 $ 100,000 $ 100,000 $ 200,000 $ 200,000 $ 200,000 $ 200,000<br />
Fund Balance 6/30 $ 1,600,000 $ 1,700,000 $ 1,800,000 $ 1,900,000 $ 2,000,000 $ 2,100,000 $ 2,300,000 $ 2,500,000 $ 2,700,000 $ 2,900,000<br />
ATTACHMENT NO. 1<br />
Page 3 <strong>of</strong> 3
xxxviii<br />
<strong>City</strong> <strong>of</strong> <strong>Concord</strong><br />
Post Retirement Healthcare (OPEB) Obligation<br />
Ten Year Projection (7% Discount Rate/25 Year Amortization)<br />
For the Year Ending June 30, 2008<br />
2007-08 2008-09 2009-10 2010-11 2011-12 2012-13 2013-14 2014-15 2015-16 2016-17<br />
Fund Balance 7/01 $ 15,017,484 $ 15,395,578 $ 15,803,507 $ 16,232,689 $ 16,732,914 $ 17,270,935 $ 17,794,331 $ 18,353,890 $ 18,941,437 $ 19,517,968<br />
Add Revenues:<br />
Interest $ 1,028,461 $ 1,055,042 $ 1,083,350 $ 1,114,779 $ 1,149,889 $ 1,185,782 $ 1,222,404 $ 1,261,195 $ 1,300,560 $ 1,338,855<br />
Service Fees 1,493,814 1,796,349 2,115,691 2,452,578 2,807,774 3,182,074 3,576,305 3,991,326 4,428,030 4,887,344<br />
Total Revenue $ 2,522,275 $ 2,851,391 $ 3,199,041 $ 3,567,357 $ 3,957,663 $ 4,367,856 $ 4,798,709 $ 5,252,521 $ 5,728,590 $ 6,226,199<br />
Less Appropriations:<br />
Benefit Payments $ 2,135,000 $ 2,433,000 $ 2,758,000 $ 3,054,000 $ 3,405,000 $ 3,828,000 $ 4,221,000 $ 4,645,000 $ 5,130,000 $ 5,646,000<br />
Administrative Costs 9,181 10,462 11,859 13,132 14,642 16,460 18,150 19,974 22,059 24,278<br />
Total Appropriations $ 2,144,181 $ 2,443,462 $ 2,769,859 $ 3,067,132 $ 3,419,642 $ 3,844,460 $ 4,239,150 $ 4,664,974 $ 5,152,059 $ 5,670,278<br />
Revenue Over (Under)<br />
Appropriations $ 378,094 $ 407,929 $ 429,182 $ 500,225 $ 538,021 $ 523,396 $ 559,559 $ 587,547 $ 576,531 $ 555,921<br />
Net OPEB Obligation $ 3,877,600 $ 7,637,579 $ 11,258,348 $ 14,774,483 $ 18,136,723 $ 21,278,980 $ 24,237,346 $ 26,987,093 $ 29,473,684 $ 31,672,773<br />
Other Funding Sources<br />
General Fund Transfer $ - $ - $ - $ - $ - $ - $ - $ - $ - $<br />
-<br />
Total Other Funding $ - $ - $ - $ - $ - $ - $ - $ - $ - $<br />
-<br />
Fund Balance 6/30 $ 11,517,978 $ 8,165,928 $ 4,974,341 $ 1,958,431 $ (865,788) $ (3,484,649) $ (5,883,456) $ (8,045,656) $ (9,955,716) $ (11,598,884)<br />
ATTACHMENT NO. 2
xxxix<br />
<strong>City</strong> Of <strong>Concord</strong><br />
Street Maintenance Program (Operating & Capital)<br />
Ten Year Projection<br />
For the Year Ending June 30, 2008<br />
2007-08 2008-09 2009-10 2010-11 2011-12 2012-13 2013-14 2014-15 2015-16 2016-17<br />
Fund Balance 7/01 $ 1,827,942 $ 897,407 $ 2,072,795 $ 2,403,641 $ 2,194,138 $ 1,798,467 $ 1,445,886 $ 1,385,403 $ 986,169 $ 775,229<br />
Add Revenues:<br />
Gas Tax $ 1,499,000 $ 1,477,000 $ 1,522,000 $ 1,522,000 $ 1,522,000 $ 1,522,000 $ 1,522,000 $ 1,522,000 $ 1,522,000 $ 1,522,000<br />
Prop. 111 760,000 760,000 760,000 760,000 760,000 760,000 760,000 760,000 760,000 760,000<br />
Measure C 1,544,000 1,598,040<br />
-<br />
-<br />
-<br />
-<br />
-<br />
-<br />
-<br />
-<br />
Measure J -<br />
- 1,653,971 1,711,860 1,771,776 1,833,788 1,897,970 1,964,399 2,033,153 2,104,314<br />
AB2928 (Prop. 42) - 1,277,938<br />
-<br />
-<br />
-<br />
-<br />
-<br />
-<br />
-<br />
-<br />
Proposition 1B (LSR Fund) - 960,000 480,000 251,400 251,400 251,400 251,400 251,400 251,400 251,600<br />
Interest 51,666 76,377 89,257 82,003 69,377 56,632 53,610 41,658 33,351 14,004<br />
Total Revenue $ 3,854,666 $ 6,149,355 $ 4,505,228 $ 4,327,263 $ 4,374,553 $ 4,423,820 $ 4,484,980 $ 4,539,457 $ 4,599,904 $ 4,651,918<br />
Less Appropriations:<br />
Street Maintenance (Operating) $ 1,516,449 $ 1,566,927 $ 1,611,440 $ 1,662,724 $ 1,715,826 $ 1,767,328 $ 1,824,129 $ 1,882,858 $ 1,942,971 $ 2,004,385<br />
Patch Paving Contracts (Operating 1A01) 931,250 959,188 987,963 1,017,602 1,048,130 1,079,574 1,111,961 1,145,320 1,179,680 1,215,070<br />
Seal Program Contracts (Operating 1A03,1A05) 981,867 1,010,667 1,071,082 1,082,330 1,109,586 1,168,933 1,199,933 1,230,786 1,263,135 1,290,266<br />
Monument Blvd. (2064) 20,000<br />
-<br />
-<br />
-<br />
-<br />
-<br />
-<br />
-<br />
-<br />
-<br />
Bridge Maintenance (2060) - 400,000<br />
-<br />
-<br />
-<br />
-<br />
-<br />
-<br />
-<br />
-<br />
Annual CIP/TIP Management Program (1024) 32,980 32,619 32,248 31,865 31,471 31,065 30,647 30,217 29,773 30,217<br />
Traffic Calming (1028) 120,000 120,000 120,000 120,000 80,000 80,000 50,000 50,000 50,000 50,000<br />
LED Replacement (1037) 32,500 64,050 103,464 139,978 144,178 148,503 76,479 78,774 81,137 83,571<br />
Congestion Management (1531) 16,883 17,389 17,911<br />
-<br />
-<br />
-<br />
-<br />
-<br />
-<br />
-<br />
Sidewalk Annual Program (1173) - 119,405<br />
- 126,678<br />
- 134,392<br />
- 142,577<br />
- 212,700<br />
Transpac Work Program (1361) 66,950 68,959 71,027 73,158 75,353 77,613 79,942 82,340 84,810 87,354<br />
Pavement Management System (PMS) (1363) - 120,000<br />
- 120,000 400,000 120,000<br />
- 120,000<br />
- 120,000<br />
PMS Commerce (1363) - 221,000<br />
-<br />
-<br />
-<br />
-<br />
-<br />
-<br />
-<br />
-<br />
PMS Commerce (1363) 513,259 117,639<br />
-<br />
-<br />
-<br />
-<br />
-<br />
-<br />
-<br />
-<br />
PMS Improve Grant St. (2363) 200,000<br />
-<br />
-<br />
-<br />
-<br />
-<br />
-<br />
-<br />
-<br />
-<br />
PMS Improve Willcrest Dr. (2363) 200,000<br />
-<br />
-<br />
-<br />
-<br />
-<br />
-<br />
-<br />
-<br />
-<br />
Traffic Maintenance Material (1623) 153,063 156,124 159,247 162,432 165,680 168,992 172,372 175,820 179,338 182,926<br />
Total Appropriations $ 4,785,201 $ 4,973,967 $ 4,174,382 $ 4,536,767 $ 4,770,224 $ 4,776,400 $ 4,545,463 $ 4,938,692 $ 4,810,844 $ 5,276,489<br />
Revenue Over(Under) Appropriations $ (930,535) $ 1,175,388 $ 330,846 $ (209,503) $ (395,671) $ (352,581) $ (60,483) $ (399,235) $ (210,940) $ (624,571)<br />
Fund Balance 6/30 $ 897,407 $ 2,072,795 $ 2,403,641 $ 2,194,138 $ 1,798,467 $ 1,445,886 $ 1,385,403 $ 986,169 $ 775,229 $ 150,657<br />
ATTACHMENT NO. 3
xl<br />
<strong>City</strong> <strong>of</strong> <strong>Concord</strong><br />
Special Revenue Fund<br />
Storm Water Fund<br />
Ten Year Projection<br />
For the Year Ending June 30, 2008<br />
2007-08 2008-09 2009-10 2010-11 2011-12 2012-13 2013-14 2014-15 2015-16 2016-17<br />
Fund Balance - 7/01 $ 1,292,063 $ 1,292,360 $ 1,294,467 $ 1,249,204 $ 1,152,649 $ 987,718 $ 752,645 $ 438,118 $ 37,942 $ (444,155)<br />
Add Revenues:<br />
Taxes - Parcel Fees $ 1,951,330 $ 1,953,330 $ 1,955,330 $ 1,957,330 $ 1,959,330 $ 1,961,330 $ 1,963,330 $ 1,965,330 $ 1,967,330 $ 1,969,330<br />
Use <strong>of</strong> Money & Property 44,450<br />
44,491<br />
49,876<br />
58,582<br />
Total Revenues $ 1,995,780 $ 1,997,821 $ 2,005,206 $ 2,015,912 $ 2,011,534 $ 2,003,778 $ 1,992,373 $ 1,976,941 $ 1,967,330 $ 1,969,330<br />
Less Appropriations:<br />
Operations $ 985,615 $ 1,011,898 $ 1,037,489 $ 1,065,093 $ 1,093,495 $ 1,121,869 $ 1,151,911 $ 1,182,806 $ 1,214,443 $ 1,246,975<br />
Prop 218 Vote 60,000<br />
Drainage System 469,376<br />
Street Cleaning 480,492<br />
-<br />
486,124<br />
497,691<br />
-<br />
500,430<br />
512,550<br />
-<br />
517,448<br />
529,926<br />
52,204<br />
-<br />
535,059<br />
547,911<br />
42,448<br />
-<br />
551,807<br />
565,175<br />
29,043<br />
-<br />
570,613<br />
584,376<br />
11,611<br />
-<br />
590,069<br />
604,242<br />
-<br />
-<br />
610,194<br />
624,790<br />
-<br />
-<br />
631,030<br />
646,068<br />
Total Appropriations $ 1,995,483 $ 1,995,713 $ 2,050,469 $ 2,112,467 $ 2,176,465 $ 2,238,851 $ 2,306,900 $ 2,377,117 $ 2,449,427 $ 2,524,073<br />
Excess (Deficiency) <strong>of</strong> Revenue<br />
Over (Under) Expenditures $ 297 $ 2,108 $ (45,263) $ (96,555) $ (164,931) $ (235,073) $ (314,527) $ (400,176) $ (482,097) $ (554,743)<br />
Less Reserves <strong>of</strong> 10 Percent $ 199,548 $ 199,571 $ 205,047 $ 211,247 $ 217,647 $ 223,885 $ 230,690 $ 237,712 $ 244,943 $ 252,407<br />
Less Capital Projects:<br />
Drainage Improvement -<br />
CCCWP Requirements -<br />
Total Capital Projects -<br />
-<br />
-<br />
-<br />
-<br />
-<br />
-<br />
-<br />
-<br />
-<br />
Fund Balance 6/30 $ 1,092,811 $ 1,094,896 $ 1,044,157 $ 941,402 $ 770,072 $ 528,760 $ 207,428 $ (199,769) $ (689,097) $ (1,251,305)<br />
-<br />
-<br />
-<br />
-<br />
-<br />
-<br />
-<br />
-<br />
-<br />
-<br />
-<br />
-<br />
-<br />
-<br />
-<br />
-<br />
-<br />
-<br />
ATTACHMENT NO. 4
xli<br />
Special Revenue Fund<br />
Downtown Landscape Maintenance District<br />
Ten Year Projection<br />
For the Year Ending June 30, 2008<br />
2007-08 2008-09 2009-10 2010-11 2011-12 2012-13 2013-14 2014-15 2015-16 2016-17<br />
Fund Balance 7/01 $ 286,747 $ 187,908 $ 75,883 $ (50,088) $ (187,096) $ (334,853) $ (493,234) $ (663,055) $ (844,683) $ (1,038,497)<br />
Add Revenues:<br />
Taxes $ 207,454 $ 207,454 $ 207,454 $ 207,454 $ 207,454 $ 207,454 $ 207,454 $ 207,454 $ 207,454 $ 207,454<br />
Other Revenues 197,470 203,394 209,495 215,780 222,254 228,921 235,789 242,863 250,149 257,654<br />
Use <strong>of</strong> Money & Property 8,164 5,172 629<br />
-<br />
-<br />
-<br />
-<br />
-<br />
-<br />
-<br />
Total Revenue $ 413,088 $ 416,020 $ 417,578 $ 423,234 $ 429,708 $ 436,375 $ 443,243 $ 450,317 $ 457,603 $ 465,108<br />
Less Appropriations:<br />
Landscape Maintenance $ 347,681 $ 358,944 $ 369,448 $ 380,993 $ 392,915 $ 404,747 $ 417,433 $ 430,528 $ 444,042 $ 457,998<br />
Gas & Electricity 6,180 6,365 6,556 6,753 6,956 7,165 7,380 7,601 7,829 8,064<br />
Water & Miscellaneous 32,665 33,645 34,654 35,694 36,765 37,868 39,004 40,174 41,379 42,620<br />
<strong>City</strong> Provided Admin. & General Services 99,043 102,014 105,074 108,226 111,473 114,817 118,262 121,810 125,464 129,228<br />
Assessment Engineering 6,500 6,630 6,763 6,898 7,036 7,177 7,321 7,467 7,616 7,768<br />
County Collection Fees 714 728 743 758 773 788 804 820<br />
836<br />
837<br />
Postage & Mailing 541 557 574 591 609 627 646 665<br />
685<br />
706<br />
Other Fixed Charges 18,603 19,162 19,737 20,329 20,938 21,567 22,214 22,880 23,566 24,273<br />
Total Expenditures $ 511,927 $ 528,045 $ 543,549 $ 560,242 $ 577,465 $ 594,756 $ 613,064 $ 631,945 $ 651,417 $ 671,494<br />
Revenues Over (Under)<br />
Appropriations $ (98,839) $ (112,025) $ (125,971) $ (137,008) $ (147,757) $ (158,381) $ (169,821) $ (181,628) $ (193,814) $ (206,386)<br />
Contingency Reserve $ 31,446 $ 32,465 $ 33,405 $ 34,446 $ 35,521 $ 36,584 $ 37,728 $ 38,908 $ 40,127 $ 41,384<br />
Fund Balance 6/30 $ 156,462 $ 43,418 $ (83,493) $ (221,542) $ (370,374) $ (529,818) $ (700,783) $ (883,591) $ (1,078,624) $ (1,286,267)<br />
ATTACHMENT NO. 5
xlii<br />
<strong>City</strong> <strong>of</strong> <strong>Concord</strong><br />
Special Revenue Fund<br />
Pine Hollow Landscape Maintenance District<br />
Ten Year Projections<br />
For the Year Ending June 30, 2008<br />
2007-08 2008-09 2009-10 2010-11 2011-12 2012-13 2013-14 2014-15 2015-16 2016-17<br />
Fund Balance 7/01 $ 150,140 $ 142,011 $ 133,674 $ 126,159 $ 116,317 $ 104,741 $ 91,303 $ 75,871 $ 58,301 $ 38,442<br />
Add Revenues:<br />
Taxes $ 61,677 $ 61,677 $ 61,677 $ 61,677 $ 61,677 $ 61,677 $ 61,677 $ 61,677 $ 61,677 $ 61,677<br />
Use <strong>of</strong> Money & Property 8,444 9,609 11,946 11,171 11,029 10,798 10,474 10,049 9,516 8,868<br />
Total Revenue $ 70,121 $ 71,286 $ 73,623 $ 72,848 $ 72,706 $ 72,475 $ 72,151 $ 71,726 $ 71,193 $ 70,545<br />
Less Appropriations:<br />
Landscape Contract $ 20,156 $ 20,450 $ 20,859 $ 21,276 $ 21,702 $ 22,136 $ 22,579 $ 23,031 $ 23,492 $ 23,962<br />
Landscape Extra Work 15,000 15,300 15,606 15,918 16,236 16,561 16,892 17,230 17,575 17,927<br />
Contract Administration 1,327 1,354 1,381 1,409 1,437 1,466 1,495 1,525 1,556 1,587<br />
Gas & Electricity 899 926 954 983 1,012 1,042 1,073 1,105 1,138 1,172<br />
Capital Replacement Reserve 15,575 15,575 15,575 15,575 15,575 15,575 15,575 15,575 15,575 15,575<br />
Water & Miscellaneous 21,432 22,075 22,737 23,419 24,122 24,846 25,591 26,359 27,150 27,965<br />
Assessment Engineering 3,000 3,060 3,121 3,183 3,247 3,312 3,378 3,446 3,515 3,585<br />
Printing, Publishing & Mailing 453 467 481 495 510 525 541 557 574 591<br />
County Collection Fees 408 416 424 432 441 450 459 468 477 487<br />
Total Expenditures $ 78,250 $ 79,623 $ 81,138 $ 82,690 $ 84,282 $ 85,913 $ 87,583 $ 89,296 $ 91,052 $ 92,851<br />
Revenues Over (Under)<br />
Appropriations $ (8,129) $ (8,337) $ (7,515) $ (9,842) $ (11,576) $ (13,438) $ (15,432) $ (17,570) $ (19,859) $ (22,306)<br />
Contingency Reserve $ 7,825 $ 7,962 $ 8,114 $ 8,269 $ 8,428 $ 8,591 $ 8,758 $ 8,930 $ 9,105 $ 9,285<br />
Fund Balance 6/30 $ 134,186 $ 125,712 $ 118,045 $ 108,048 $ 96,313 $ 82,712 $ 67,113 $ 49,371 $ 29,337 $ 6,851<br />
ATTACHMENT NO. 6
xliii<br />
Special Revenue Fund<br />
Landscape & Lighting Maintenance District No. 3<br />
Ten Year Projection<br />
For the Year Ending June 30, 2008<br />
2007-08 2008-09 2009-10 2010-11 2011-12 2012-13 2013-14 2014-15 2015-16 2016-17<br />
Fund Balance 7/01 $ 188,787 $ 201,734 $ 213,275 $ 225,851 $ 237,442 $ 247,957 $ 257,297 $ 265,357 $ 272,031 $ 277,200<br />
Add Revenues:<br />
Taxes $ 75,006 $ 75,240 $ 75,481 $ 75,729 $ 75,985 $ 76,248 $ 76,519 $ 76,798 $ 77,086 $ 77,382<br />
Other Revenues 600 618 637 656 675 696 717 738 760 783<br />
Use <strong>of</strong> Money & Property 6,706 8,125 10,695 11,284 11,823 12,306 12,730 13,089 13,377 13,589<br />
Total Revenue $ 82,312 $ 83,983 $ 86,813 $ 87,669 $ 88,483 $ 89,250 $ 89,966 $ 90,625 $ 91,223 $ 91,754<br />
Less Appropriations:<br />
Landscape Contract $ 22,405 $ 23,993 $ 24,503 $ 25,023 $ 25,555 $ 26,100 $ 26,657 $ 27,225 $ 27,805 $ 28,397<br />
Landscape Extra Work 3,045 3,352 3,419 3,487 3,556 3,627 3,700 3,774 3,850 3,927<br />
Landscape Supplies 1,020 1,040 1,061 1,082 1,104 1,126 1,149 1,172 1,195 1,219<br />
Water 32,629 33,608 34,616 35,655 36,725 37,827 38,962 40,131 41,335 42,575<br />
Gas & Electricity 1,980 2,039 2,101 2,164 2,229 2,295 2,365 2,436 2,510 2,586<br />
Capital Replacement Reserve 3,000 3,000 3,000 3,000 3,000 3,000 3,000 3,000 3,000 3,000<br />
Assessment Engineering 3,000 3,061 3,123 3,186 3,250 3,315 3,381 3,448 3,518 3,589<br />
Printing, Publishing & Mailing 1,148 1,182 1,217 1,253 1,290 1,328 1,367 1,407 1,448 1,491<br />
County Collection Fees 538 549 560 572 584 596 608 620 633 646<br />
Other Fixed Charges 600 618 637 656 675 696 717 738 760 783<br />
Total Expenditures $ 69,365 $ 72,442 $ 74,237 $ 76,078 $ 77,968 $ 79,910 $ 81,906 $ 83,951 $ 86,054 $ 88,213<br />
Revenues Over (Under)<br />
Appropriations $ 12,947 $ 11,541 $ 12,576 $ 11,591 $ 10,515 $ 9,340 $ 8,060 $ 6,674 $ 5,169 $ 3,541<br />
Contingency Reserve $ 6,937 $ 7,244 $ 7,424 $ 7,608 $ 7,797 $ 7,991 $ 8,191 $ 8,395 $ 8,605 $ 8,821<br />
Fund Balance 6/30 $ 194,797 $ 206,031 $ 218,427 $ 229,834 $ 240,160 $ 249,306 $ 257,166 $ 263,636 $ 268,595 $ 271,920<br />
ATTACHMENT NO. 7
xliv<br />
<strong>City</strong> <strong>of</strong> <strong>Concord</strong><br />
Special Revenue Fund<br />
Street Lighting Maintenance District<br />
Ten Year Projection<br />
For the Year Ending June 30, 2008<br />
2007-08 2008-09 2009-10 2010-11 2011-12 2012-13 2013-14 2014-15 2015-16 2016-17<br />
Fund Balance 7/01 $ 582,942 $ 726,575 $ 849,767 $ 958,357 $ 1,041,547 $ 991,164 $ 910,513 $ 796,113 $ 645,218 $ 454,924<br />
Add Revenues:<br />
Taxes $ 1,044,549 $ 1,044,549 $ 1,044,549 $ 1,044,549 $ 1,044,549 $ 1,044,549 $ 1,044,549 $ 1,044,549 $ 1,044,549 $ 1,044,549<br />
Use <strong>of</strong> Money & Property 22,522 30,909 44,101 48,778 49,578 46,382 41,625 35,154 26,833 16,513<br />
Total Revenue $ 1,067,071 $ 1,075,458 $ 1,088,650 $ 1,093,327 $ 1,094,127 $ 1,090,931 $ 1,086,174 $ 1,079,703 $ 1,071,382 $ 1,061,062<br />
Less Appropriations:<br />
Street Lighting (Electricity) $ 600,000 $ 618,000 $ 636,540 $ 655,636 $ 675,305 $ 695,564 $ 716,431 $ 737,924 $ 760,062 $ 782,864<br />
Street Lighting (Consult./Contract) 26,265 27,053 27,865 28,701 29,562 30,449 31,362 32,303 33,272 34,270<br />
Street Lighting (Personnel) 206,383 214,411 220,795 228,837 237,176 244,871 253,802 263,057 272,647 282,600<br />
Street Lighting (Supplies) 20,808 21,224 21,648 22,081 22,523 22,973 23,432 23,901 24,379 24,867<br />
Assessment Engineering 16,500 16,830 17,167 17,510 17,860 18,217 18,581 18,953 19,332 19,719<br />
County Collection Fees 32,640 33,293 33,959 34,638 35,331 36,038 36,759 37,494 38,244 39,009<br />
Other Fixed Charges 20,842 21,455 22,086 22,734 23,403 24,095 24,807 25,541 26,290 27,060<br />
Loan Repayment w/Interest -<br />
-<br />
-<br />
- 103,350 99,375 95,400 91,425 87,450 83,475<br />
Total Expenditures $ 923,438 $ 952,266 $ 980,060 $ 1,010,137 $ 1,144,510 $ 1,171,582 $ 1,200,574 $ 1,230,598 $ 1,261,676 $ 1,293,864<br />
Revenues Over (Under) $ 143,633 $ 123,192 $ 108,590 $ 83,190 $ (50,383) $ (80,651) $ (114,400) $ (150,895) $ (190,294) $ (232,802)<br />
Contingency Reserve $ 92,344 $ 95,227 $ 98,006 $ 101,014 $ 104,116 $ 107,221 $ 110,517 $ 113,917 $ 117,423 $ 121,039<br />
Fund Balance 6/30 $ 634,231 $ 754,540 $ 860,351 $ 940,533 $ 887,048 $ 803,292 $ 685,596 $ 531,301 $ 337,501 $ 101,083<br />
ATTACHMENT NO. 8
xlv<br />
Page 1 <strong>of</strong> 2<br />
Sewer Enterprise<br />
Twenty Year Projection<br />
for the Year Ending June 30, 2008<br />
Fee Inc $36 Fee Inc $36 Fee Inc $36 Fee Inc $36<br />
2007-08 2008-09 2009-10 2010-11 2011-12 2012-13 2013-14 2014-15 2015-16 2016-17<br />
Fund Balance 7/01 $ 12,797,675 $ 9,359,351 $ 5,269,076 $ 6,335,427 $ 6,869,486 $ 6,495,484 $ 5,181,062 $ 5,396,809 $ 6,526,281 $ 6,535,038<br />
Add Revenues:<br />
Sewer Service Fees $ 17,016,470 $ 17,050,503 $ 19,124,604 $ 19,162,853 $ 19,201,179 $ 19,239,581 $ 21,318,060 $ 23,400,696 $ 23,447,497 $ 23,494,392<br />
Sewer Connection Fees 1,000,000 1,030,000 1,060,900 1,092,727 1,125,509 1,159,274 1,194,052 1,229,874 1,266,770 1,304,773<br />
Interest 381,079 286,832 283,037 322,071 325,975 284,794 257,997 290,807 318,569 298,260<br />
Loan Repayment -<br />
-<br />
-<br />
-<br />
-<br />
- 150,000 200,000 200,000 200,000<br />
Total Revenues $ 18,397,549 $ 18,367,335 $ 20,468,541 $ 20,577,651 $ 20,652,663 $ 20,683,649 $ 22,920,109 $ 25,121,377 $ 25,232,836 $ 25,297,425<br />
Less Expenditures:<br />
Maintenance & Operations $ 4,116,436 $ 4,216,867 $ 4,067,599 $ 4,165,122 $ 4,271,145 $ 4,376,371 $ 4,491,160 $ 4,614,741 $ 4,719,324 $ 4,834,762<br />
Animal Control Notes Payable 248,000<br />
-<br />
-<br />
-<br />
-<br />
-<br />
-<br />
-<br />
-<br />
-<br />
Household Hazardous Waste 468,905 482,972 497,461 512,385 527,757 543,589 559,897 576,694 593,995 605,875<br />
Rehab Bond Payment-Priority 1<br />
Bond Paymnt-Gravity Connection<br />
834,638 832,650 834,655 835,126 834,186 836,776 833,070 833,189 836,903 834,406<br />
In Lieu <strong>of</strong> Pumping To CCCSD<br />
Payment to CCCSD:<br />
500,000 995,000 995,000 995,000 995,000 995,000 995,000 995,000 995,000 995,000<br />
Operations 9,120,000 9,511,000 9,950,000 10,546,000 11,055,000 11,588,000 12,157,000 12,722,000 13,345,378 13,999,302<br />
Total Appropriations $ 15,287,979 $ 16,038,489 $ 16,344,715 $ 17,053,633 $ 17,683,088 $ 18,339,736 $ 19,036,127 $ 19,741,624 $ 20,490,600 $ 21,269,345<br />
Net Income(Loss) $ 3,109,570 $ 2,328,846 $ 4,123,826 $ 3,524,018 $ 2,969,575 $ 2,343,913 $ 3,883,982 $ 5,379,753 $ 4,742,236 $ 4,028,080<br />
10% Contingency Reserves $ 1,323,644 $ 1,372,787 $ 1,401,760 $ 1,471,112 $ 1,532,615 $ 1,596,437 $ 1,664,816 $ 1,733,674 $ 1,806,470 $ 1,883,406<br />
Reserve for Capital Projects:<br />
<strong>City</strong> Projects $ 140,894 $ 145,121 $ 149,475 $ 153,959 $ 158,577 $ 163,335 $ 168,235 $ 173,281 $ 178,479 $ 183,834<br />
Capital Facility Contingency 200,000 200,000 200,000 200,000 200,000 200,000 200,000 200,000 200,000 200,000<br />
CCCSD Capital Projects 6,207,000 6,074,000 2,708,000 2,636,000 2,985,000 3,295,000 3,300,000 3,877,000 4,355,000 4,485,650<br />
Total Capital Projects $ 6,547,894 $ 6,419,121 $ 3,057,475 $ 2,989,959 $ 3,343,577 $ 3,658,335 $ 3,668,235 $ 4,250,281 $ 4,733,479 $ 4,869,484<br />
Fund Balance 6/30 $ 8,035,707 $ 3,896,289 $ 4,933,667 $ 5,398,374 $ 4,962,869 $ 3,584,625 $ 3,731,993 $ 4,792,607 $ 4,728,568 $ 3,810,228<br />
ATTACHMENT NO. 9<br />
Page 1<strong>of</strong> 2
xlvi<br />
Page 2 <strong>of</strong> 2<br />
Sewer Enterprise<br />
Twenty Year Projection<br />
for the Year Ending June 30, 2008<br />
Fee Inc $36 Fee Inc $36 Fee Inc $36 Fee Inc $36 Fee Inc $36<br />
2017-18 2018-19 2019-20 2020-21 2021-22 2022-23 2023-24 2024-25 2025-26 2026-27<br />
Fund Balance 7/01 $ 5,693,634 $ 5,776,653 $ 4,904,840 $ 5,078,691 $ 6,309,941 $ 6,512,730 $ 5,586,355 $ 5,514,215 $ 6,289,378 $ 5,806,072<br />
Add Revenues:<br />
Sewer Service Fees $ 25,581,381 $ 25,632,544 $ 27,723,809 $ 29,819,257 $ 29,878,896 $ 29,938,654 $ 32,038,531 $ 34,142,608 $ 34,210,893 $ 34,279,315<br />
Sewer Connection Fees 1,343,916 1,384,233 1,425,760 1,468,533 1,512,589 1,557,967 1,604,706 1,652,847 1,702,432 1,753,505<br />
Interest 279,763 260,524 243,501 277,772 312,748 295,100 270,746 287,893 295,011 237,786<br />
Loan Repayment -<br />
-<br />
-<br />
-<br />
-<br />
-<br />
-<br />
-<br />
-<br />
-<br />
Total Revenues $ 27,205,060 $ 27,277,301 $ 29,393,070 $ 31,565,562 $ 31,704,233 $ 31,791,721 $ 33,913,983 $ 36,083,348 $ 36,208,336 $ 36,270,606<br />
Less Expenditures:<br />
Maintenance & Operations $ 4,979,805 $ 5,129,199 $ 5,283,075 $ 5,441,567 $ 5,604,814 $ 5,772,958 $ 5,946,147 $ 6,124,531 $ 6,308,267 $ 6,497,515<br />
Animal Control Notes Payable -<br />
-<br />
-<br />
-<br />
-<br />
-<br />
-<br />
-<br />
-<br />
-<br />
Household Hazardous Waste 617,993 630,353 642,960 655,819 668,935 682,314 695,960 709,879 724,077 738,559<br />
Rehab Bond Payment-Priority 1<br />
Bond Paymnt-Gravity Connection<br />
834,406 835,860 836,029 834,873 837,352 838,761 838,666 837,332 839,612 839,912<br />
In Lieu <strong>of</strong> Pumping To CCCSD<br />
Payment to CCCSD:<br />
995,000 995,000 995,000 995,000 995,000 995,000 995,000 995,000 995,000 995,000<br />
Operations 14,685,268 15,404,846 16,159,683 16,951,507 17,782,131 18,653,455 19,567,474 20,526,280 21,532,068 22,587,139<br />
Total Appropriations $ 22,112,472 $ 22,995,258 $ 23,916,747 $ 24,878,766 $ 25,888,232 $ 26,942,488 $ 28,043,247 $ 29,193,022 $ 30,399,024 $ 31,658,125<br />
NET INCOME(LOSS) $ 5,092,588 $ 4,282,043 $ 5,476,323 $ 6,686,796 $ 5,816,001 $ 4,849,233 $ 5,870,736 $ 6,890,326 $ 5,809,312 $ 4,612,481<br />
10% Contingency Reserves $ 1,966,507 $ 2,053,405 $ 2,144,276 $ 2,239,307 $ 2,338,695 $ 2,442,641 $ 2,551,362 $ 2,665,081 $ 2,784,034 $ 2,908,465<br />
Reserve for Capital Projects:<br />
<strong>City</strong> Projects $ 189,349 $ 195,029 $ 200,880 $ 206,906 $ 213,113 $ 219,506 $ 226,091 $ 232,874 $ 239,860 $ 247,056<br />
Capital Facility Contingency 200,000 200,000 200,000 200,000 200,000 200,000 200,000 200,000 200,000 200,000<br />
CCCSD Capital Projects 4,620,220 4,758,827 4,901,592 5,048,640 5,200,099 5,356,102 5,516,785 5,682,289 5,852,758 6,028,341<br />
Total Capital Projects $ 5,009,569 $ 5,153,856 $ 5,302,472 $ 5,455,546 $ 5,613,212 $ 5,775,608 $ 5,942,876 $ 6,115,163 $ 6,292,618 $ 6,475,397<br />
Fund Balance 6/30 $ 3,810,146 $ 2,851,435 $ 2,934,415 $ 4,070,634 $ 4,174,035 $ 3,143,714 $ 2,962,853 $ 3,624,297 $ 3,022,038 $ 1,034,691<br />
ATTACHMENT NO. 9<br />
Page 2<strong>of</strong> 2
xlvii<br />
<strong>City</strong> <strong>of</strong> <strong>Concord</strong><br />
Golf Course<br />
Ten Year Projection<br />
For the Year Ending June 30, 2008<br />
Fee Inc. Fee Inc. Fee Inc. Fee Inc. Fee Inc.<br />
2007-08 2008-09 2009-10 2010-11 2011-12 2012-13 2013-14 2014-15 2015-16 2016-17<br />
Fund Balance 7/01 $ 55,146 $ 147,902 $ 156,869 $ 165,372 $ 166,553 $ 174,417 $ 175,524 $ 183,861 $ 185,023 $ 194,344<br />
Add Revenues:<br />
Fees $ 1,501,759 $ 1,501,759 $ 1,576,847 $ 1,576,847 $ 1,655,689 $ 1,655,689 $ 1,738,473 $ 1,738,473 $ 1,825,396 $ 1,825,396<br />
Rentals 206,784 210,723 218,555 222,733 231,001 235,434 244,162 248,865 258,079 263,068<br />
Merchandise Sales 28,278 29,126 30,000 30,900 31,827 32,782 33,765 34,778 35,821 36,896<br />
Other Revenues 586,525 50,000 239,042 148,390 50,000 50,000 50,000 50,000 50,000 50,000<br />
Interest 3,492 5,976 7,860 8,096 8,316 8,535 8,765 8,997 9,252 9,514<br />
Total Revenues $ 2,326,838 $ 1,797,584 $ 2,072,304 $ 1,986,966 $ 1,976,833 $ 1,982,440 $ 2,075,165 $ 2,081,113 $ 2,178,548 $ 2,184,874<br />
Operating Expenditures<br />
Operations $ 553,830 $ 625,573 $ 683,392 $ 667,186 $ 716,969 $ 698,314 $ 751,077 $ 731,162 $ 791,910 $ 773,189<br />
Maintenance 925,192 943,118 970,324 998,344 1,027,202 1,056,924 1,087,536 1,119,064 1,151,534 1,183,941<br />
Debt Service 218,535 219,926 221,043 221,865 224,798 226,095 228,215 229,725 225,783 226,375<br />
Total Expenditures $ 1,697,557 $ 1,788,617 $ 1,874,759 $ 1,887,395 $ 1,968,969 $ 1,981,333 $ 2,066,828 $ 2,079,951 $ 2,169,227 $ 2,183,505<br />
Net Income (Loss) $ 629,281 $ 8,967 $ 197,545 $ 99,571 $ 7,864 $ 1,107 $ 8,337 $ 1,162 $ 9,321 $ 1,369<br />
10 % Contingency Reserves $ 147,902 $ 156,869 $ 165,372 $ 166,553 $ 174,417 $ 175,524 $ 183,861 $ 185,023 $ 194,344 $ 195,713<br />
Less Capital Expenses:<br />
Projects $ 536,525 $ - $ 189,042 $ 98,390 $ - $ - $ - $ - $ - $ -<br />
Capital Projects Reserve - -<br />
-<br />
-<br />
-<br />
-<br />
-<br />
-<br />
-<br />
-<br />
Total Capital Expenses $ 536,525 $ - $ 189,042 $ 98,390 $ - $ - $ - $ - $ - $ -<br />
Fund Balance 6/30 $ - $ - $ - $ - $ - $ - $ - $ - $ - $ -<br />
ATTACHMENT NO. 10
xlviii<br />
2007-08 2008-09 2009-10 2010-11 2011-12 2012-13 2013-14 2014-15 2015-16 2016-17<br />
Fund Balance 7/01 $ 7,579,531 $ 2,736,827 $ 1,526,550 $ 474,499 $ 349,251 $ 516,397 $ 927,811 $ 1,052,407 $ 1,422,189 $ 2,015,330<br />
Add Revenues:<br />
Gross Tax Increment $ 14,892,075 $ 15,471,502 $ 16,068,312 $ 16,978,368 $ 17,813,072 $ 18,812,063 $ 19,748,544 $ 20,730,352 $ 21,949,766 $ 23,272,411<br />
Less: Pass Through Payments (796,539) (916,651) (1,040,683) (1,223,539) (1,391,779) (1,592,824) (1,781,833) (2,002,614) (2,273,068) (2,565,404)<br />
Tax Increment Rebates (343,469) (348,729) (354,093) (359,561) (365,136) (370,819) (376,614) (382,309) (388,016) (393,834)<br />
Low & Moderate Income Housing (2,917,583) (3,033,468) (3,152,830) (3,334,842) (3,501,782) (3,701,580) (3,888,876) (4,085,238) (4,329,121) (4,593,650)<br />
Net Tax Increment $ 10,834,484 $ 11,172,654 $ 11,520,706 $ 12,060,426 $ 12,554,375 $ 13,146,840 $ 13,701,221 $ 14,260,191 $ 14,959,561 $ 15,719,523<br />
Use Of Money & Property $ 183,156 $ 87,956 $ 51,791 $ 20,974 $ 21,113 $ 35,225 $ 48,298 $ 60,356 $ 83,842 $ 116,602<br />
Home Depot Ground Lease 910,000 910,000 910,000 1,001,000 1,001,000 1,001,000 1,001,000 1,001,000 1,101,100 1,101,100<br />
Property Sales -<br />
-<br />
-<br />
-<br />
-<br />
-<br />
-<br />
-<br />
-<br />
-<br />
Rentals 46,505 47,900 49,337 50,817 52,341 53,911 55,529 57,195 58,911 27,305<br />
Transfer In (Fry's) 322,041 352,046 383,899 417,701 453,558 491,582 531,891 574,608 619,865 667,797<br />
Other 20,717 20,717 20,717 20,717 15,539<br />
-<br />
-<br />
-<br />
-<br />
-<br />
Subtotal Other Sources $ 1,482,419 $ 1,418,619 $ 1,415,744 $ 1,511,209 $ 1,543,551 $ 1,581,718 $ 1,636,718 $ 1,693,159 $ 1,863,718 $ 1,912,804<br />
Total Revenue $ 12,316,903 $ 12,591,273 $ 12,936,450 $ 13,571,635 $ 14,097,926 $ 14,728,558 $ 15,337,939 $ 15,953,350 $ 16,823,279 $ 17,632,327<br />
Less Appropriations:<br />
Operations $ 3,417,909 $ 3,511,021 $ 3,598,716 $ 3,695,441 $ 3,794,997 $ 3,893,123 $ 3,998,487 $ 4,117,587 $ 4,229,529 $ 4,343,790<br />
Debt Service 7,849,162 7,900,319 7,819,686 7,828,280 7,823,770 7,820,904 7,809,440 7,815,822 7,803,110 7,790,963<br />
Total Appropriations $ 11,267,071 $ 11,411,340 $ 11,418,402 $ 11,523,721 $ 11,618,767 $ 11,714,027 $ 11,807,927 $ 11,933,409 $ 12,032,639 $ 12,134,753<br />
Excess (Deficiency) <strong>of</strong> Revenues<br />
Over (Under) Expenditures 1,049,832<br />
1,179,933<br />
<strong>City</strong> <strong>of</strong> <strong>Concord</strong><br />
Redevelopment Agency<br />
Ten Year Projection<br />
For the Year Ending June 30, 2008<br />
1,518,048<br />
2,047,914<br />
Less Capital Projects<br />
Strategic Plan Projects $ 2,235,000 $ 300,000 $ 400,000 $ 950,000 $ 750,000 $ 1,500,000 $ 2,800,000 $ 3,000,000 $ 3,500,000 $ 4,000,000<br />
Capital Projects 3,319,520 1,721,869 1,769,579 788,508 1,091,163 593,897 55,534 57,200 58,916 60,683<br />
Total Capital Expenses $ 5,554,520 $ 2,021,869 $ 2,169,579 $ 1,738,508 $ 1,841,163 $ 2,093,897 $ 2,855,534 $ 3,057,200 $ 3,558,916 $ 4,060,683<br />
Other Financing Sources (Uses)<br />
Transfers Out $ (15,975) $ (16,295) $ (16,621) $ (16,953) $ (17,292) $ (17,638) $ (17,991) $ (18,351) $ (18,718) $ (19,092)<br />
Fry's Loan Disbursement (322,041) (352,046) (383,899) (417,701) (453,558) (491,582) (531,891) (574,608) (619,865) (667,797)<br />
Total Other Financing Sources (Uses) $ (338,016) $ (368,341) $ (400,520) $ (434,654) $ (470,850) $ (509,220) $ (549,882) $ (592,959) $ (638,583) $ (686,889)<br />
Excess (Deficiency) <strong>of</strong> Revenues and Other<br />
Sources Over (Under) Expenditures<br />
and Other Financing Uses $ (4,842,704) $ (1,210,277) $ (1,052,051) $ (125,248) $ 167,146 $ 411,414 $ 124,596 $ 369,782 $ 593,141 $ 750,002<br />
Fund Balance - 6/30 $ 2,736,827 $ 1,526,550 $ 474,499 $ 349,251 $ 516,397 $ 927,811 $ 1,052,407 $ 1,422,189 $ 2,015,330 $ 2,765,332<br />
2,479,159<br />
3,014,531<br />
3,530,012<br />
4,019,941<br />
4,790,640<br />
5,497,574<br />
ATTACHMENT NO. 11
xlix<br />
The Government Finance Officers<br />
Association <strong>of</strong> the United States and<br />
Canada (GFOA) presented a<br />
Distinguished Budget Presentation<br />
Award to the <strong>City</strong> <strong>of</strong> <strong>Concord</strong>,<br />
California for its annual budget for the<br />
fiscal year beginning July 1, 2006.<br />
In order to receive this award, a<br />
governmental unit must publish a<br />
budget document that meets program<br />
criteria as a policy document, as an<br />
operations guide, as a financial plan,<br />
and as a communications device.<br />
This award is valid for a period <strong>of</strong> one<br />
year only. We believe our current<br />
budget continues to conform to<br />
program requirements, and we are<br />
submitting it to GFOA to determine its<br />
eligibility for another award.
This page intentionally left blank and unnumbered.
1<br />
<strong>City</strong> Organization and Programs<br />
Our mission is to join with our community to make <strong>Concord</strong> a<br />
city <strong>of</strong> the highest quality. We do this by providing responsive, cost effective, and<br />
innovative local government services.<br />
Adopted July, 2007
2<br />
<br />
<strong>City</strong> Management<br />
Administrative Services<br />
<strong>City</strong> Clerk Services<br />
<strong>City</strong> Council Services<br />
<br />
Community Relations<br />
Franchise Management<br />
Printing Services<br />
Appointive/Advisory Boards,<br />
Committees, Commissions<br />
Direct Authority<br />
<strong>City</strong> Attorney<br />
Claims Processing<br />
Legal Counsel to <strong>City</strong> Council,<br />
Commissions, Committees<br />
Liability Defense<br />
Municipal Code Violation ProsecutionOrdinances/Resolutions/Contracts<br />
Community &<br />
Recreation Services<br />
Community Services<br />
Golf Course<br />
Pavilion Management/<br />
Operations Agreement<br />
Recreation Services<br />
Commission on Aging<br />
Community Services<br />
Commission<br />
Human Relations Commission<br />
Parks, Recreation &<br />
Open Space Com-<br />
Assistant <strong>City</strong> Manager<br />
Building, Engineering<br />
& Neighborhood<br />
Services<br />
Building<br />
Capital Improvement<br />
Design<br />
Capital Improvement<br />
Inspection<br />
Capital Improvement<br />
Contract Administration<br />
Development Review<br />
and Permits<br />
Encroachment Permit<br />
Review and Inspection<br />
Floodplain Management<br />
and permits<br />
Grading Permit Review<br />
and Inspection<br />
Mitigation Monitoring/<br />
Condition Compliance<br />
Program<br />
Neighborhood Services<br />
Public Information<br />
Subdivision Maps,<br />
Plans<br />
and Inspection<br />
Building Appeals Board<br />
Public Works<br />
The People <strong>of</strong> the <strong>City</strong> <strong>of</strong> <strong>Concord</strong><br />
<strong>City</strong> Council/Redevelopment Agency<br />
Mayor and Four Councilmembers<br />
ADA Compliance<br />
Program<br />
<strong>City</strong>wide Street Light<br />
Assessment District<br />
Custodial Services<br />
Facility Maintenance<br />
Fleet Management<br />
<br />
Landscape Assessment<br />
Districts<br />
Lease Management<br />
Parks Services<br />
Sewer Enterprise<br />
Signs/Striping/Signals<br />
Maintenance<br />
Storm Drain Maintenance<br />
Stormwater Management<br />
Street Maintenance<br />
Street Sweeping<br />
<br />
Transportation Planning<br />
<strong>City</strong> Manager<br />
Information<br />
Technology<br />
E-Government<br />
GIS/Land Use<br />
Networks, Microcomputers<br />
& Client-Server<br />
Services<br />
Business Systems &<br />
Programming<br />
Telecommunications<br />
Voice Services<br />
Human Resources<br />
Employment Services<br />
Risk Management/Organizational<br />
Training<br />
Personnel Board<br />
<strong>City</strong> Treasurer<br />
Assessment Districts<br />
Bond Service<br />
Deposits<br />
Investments<br />
Finance<br />
Budget & Financial<br />
Planning<br />
Financial Operations<br />
Materials Management<br />
Treasury<br />
<strong>City</strong> Clerk<br />
Council Proceedings<br />
Municipal Elections<br />
Oaths<br />
Public Notices<br />
Planning &<br />
Economic<br />
Development<br />
Economic Development<br />
Housing<br />
Planning<br />
Redevelopment Agency<br />
Design Review Board<br />
Mobile Home Rent<br />
Review Board<br />
Planning Commission<br />
ORGANIZATION CHART - CITY OF CONCORD<br />
The <strong>City</strong> <strong>of</strong> <strong>Concord</strong> has a <strong>City</strong> Council/<strong>City</strong> Manager form <strong>of</strong> government. Five Council members, the <strong>City</strong> Clerk, and the <strong>City</strong> Treasurer are elected by the voters. The Council appoints the <strong>City</strong> Manager and the <strong>City</strong> Attorney. The<br />
<br />
Police<br />
Administrative Services<br />
Emergency Preparedness<br />
Field Operations<br />
<br />
Police<br />
Support Services<br />
<strong>Concord</strong> Naval<br />
Weapons Station<br />
<br />
Public Outreach<br />
Reuse Planning<br />
Financial Feasibility<br />
Fiscal Sustainability<br />
Conveyance<br />
Strategies<br />
Citizens Advisory<br />
Committee<br />
Technical<br />
Advisory Group
3<br />
Building Appeals Board<br />
Building<br />
Building Inspection<br />
P.lan Review<br />
Public Information<br />
Response to Citizen<br />
Complaints<br />
.48 Administrative Support<br />
(FTE Part-time)<br />
3 Building Inspector<br />
1 Building Inspector Supervisor<br />
1 Building Plans Engineer<br />
<br />
3 Permit Technicians<br />
3 Senior Building Inspector<br />
Neighborhood Services<br />
Code Enforement<br />
Neighborhood Cleanup<br />
Neighborhood Partnership<br />
Multi-Family Housing<br />
Inspection<br />
1 Building Inspector<br />
.48 Craft Worker (FTE Part-time)<br />
2 Permit Technician<br />
4 Neighborhood Preservation<br />
Specialist<br />
2 Neighborhood Pres. Supervisor<br />
1 Neighborhood Services Manager<br />
.75 Technician (FTE Part-time)<br />
Administration<br />
Clerical Support<br />
Administrative Support<br />
Mitigation Monitoring Program<br />
Public Information<br />
1 Administrative Analyst<br />
1 Administrative Clerk II<br />
1 Administrative Secretary<br />
Building, Engineering & Neighborhood Services<br />
Current Development<br />
Permit Center<br />
Director <strong>of</strong> Building, Engineering & Neighborhood Services<br />
1 Senior Civil Engineer<br />
Development Review<br />
Encroachment Permit Review<br />
Floodzone Regulations<br />
Grading Permit Review<br />
Public Improvement Plan Review<br />
Public Information<br />
Sewer Permits<br />
Subdivision Map Review<br />
1 Associate Civil Engineer<br />
1 Permit Technician II<br />
3 Permit Tecnician III<br />
.70 Pr<strong>of</strong>essional (FTE Part-time)<br />
.70 Project Manager (FTE Part-time)<br />
.20 Technician (FTE Part-time)<br />
Total Full-Time Staff - 44<br />
FTE Part-Time - 4.90<br />
Inspection Inspection<br />
Development Inspection<br />
Encroachment Permit Inspection<br />
Erosion Control Monitoring<br />
Grading Permit Inspection<br />
3 Construction Inspector<br />
.15 Technician (FTE Part-time)<br />
Design<br />
Capital Improvement Design<br />
Capital Improvement Contract<br />
Administration<br />
.96 Administrative Support<br />
(FTE Part-time)<br />
1 Assistant Engineer<br />
1 Senior Civil Engineer<br />
.48 Technician (FTE Part-time)<br />
Capital Improvement Projects<br />
1 Senior Civil Engineer<br />
Construction<br />
Capital Improvement<br />
Inspection<br />
Capital Improvement Contract<br />
Administration<br />
3 Construction Inspector<br />
1 Construction Inspector Supervisor<br />
2 Associate Civil Engineer
4<br />
<br />
Ordinance, Resolution, Contract Preparation<br />
Legal Counsel to <strong>City</strong> Council, Commissions, Committees<br />
Liability Defense<br />
Municipal Code Violation Prosecution<br />
Redevelopment Agency Representation<br />
2 Assistant <strong>City</strong> Attorney<br />
1 Deputy <strong>City</strong> Attorney<br />
<strong>City</strong> Attorney<br />
Total Full-Time Staff - 6<br />
Legal Services<br />
Administration<br />
Administrative Support<br />
Claims Processing<br />
Clerical Support<br />
Public Information<br />
1 Executive Legal Secretary<br />
1 Legal Secretary
5<br />
<strong>City</strong> Clerk<br />
Administrative Services<br />
Bid Openings<br />
Boards & Commissions Administration<br />
Campaign Disclosure Filing<br />
<strong>City</strong>wide Records Management<br />
Program<br />
Contracts/Agreements Processing<br />
Council Agenda Packet/Mailings<br />
<br />
Council Minute Preparation<br />
Document Imaging Program<br />
Elections<br />
Historical Action Tracking/Research<br />
Legal Notices<br />
Mail Services<br />
<br />
Proclamations<br />
Public Records<br />
Public Information<br />
Resolutions/Ordinances<br />
Sister <strong>City</strong> Program<br />
.98 Administrative Clerk II<br />
0.57 Administrative Support<br />
(FTE Part-Time)<br />
1 Administrative Services Coordinator<br />
1 Administrative Secretary<br />
1 Administrative Asisistant<br />
<strong>City</strong> Council<br />
Community Relations<br />
<strong>City</strong> Publications<br />
<strong>City</strong> Website Content Management<br />
Community Relations<br />
Employee Communication<br />
Government Access Programming<br />
Intranet Content Management<br />
Media Relations<br />
Video Services<br />
1 Community Relations Manager<br />
<br />
1 Video Services Coordinator<br />
0.04 Video Technician (FTE Part-Time)<br />
<strong>City</strong> Management<br />
<strong>City</strong> Manager<br />
Assistant <strong>City</strong> Manager<br />
Total Full-Time Staff - 15<br />
FTE Part-Time Staff - .90<br />
Director <strong>of</strong> <strong>City</strong> Management<br />
Printing Services<br />
Artwork Composition<br />
Copier Service<br />
Document Assembly<br />
Offset Printing<br />
Project Cost Estimates<br />
User Consultation<br />
0.04 Administrative Support (FTE Part-Time)<br />
1 Desktop Publishing Specialist<br />
1 Duplicating/Offset Printing Operator<br />
1 Printing Services Supervisor<br />
1 Sr. Offset Duplicating Machine Operator<br />
1 Executive Assistant - Council/<strong>City</strong> Manager<br />
<strong>City</strong> Council/<br />
<br />
Budget Management/Long Range<br />
Planning<br />
Citizen Complaint Intervention<br />
Council Committee System<br />
Council Correspondence<br />
Event Coordination/Ceremonies<br />
Interdepartmental Coordination<br />
Legislative Advocacy<br />
Organizational Initiatives<br />
0.02 Administrative Clerk II<br />
0.25 Administrative Support (FTE Part-<br />
Time)<br />
<br />
Franchise Management<br />
Cable Television Liaison/Customer<br />
Service<br />
Energy Services Management<br />
Franchise Administration<br />
Solid Waste/Recycling Management
6<br />
Administration<br />
Administrative Support<br />
Clerical Support<br />
Recreation Facilities Planning<br />
1 Administrative Assistant<br />
1 Recreation Customer Service<br />
Coordinator<br />
Community Services<br />
CDBG Administrator<br />
Substructure Human Services<br />
1 Community Services Manager<br />
.48 Administrative Support (FTE<br />
Part-Time)<br />
Community & Recreation Services<br />
Director <strong>of</strong> Community & Recreation Services<br />
Recreation Services<br />
Adult Sports<br />
Aquatics<br />
Camp <strong>Concord</strong><br />
Community Center<br />
Festivals/Events<br />
Recreation Classes<br />
Senior Center<br />
Youth and Family Services<br />
1 Camp Director<br />
8.24 Camp Specialist<br />
(FTE Part-Time)<br />
2 Program Aide<br />
5 Program Coordinator<br />
1 Recreation Program Coordinator<br />
Contractual<br />
4 Recreation Program<br />
Manager<br />
70.39 Recreation Specialist<br />
(FTE Part-Time)<br />
2 Senior Program Manager<br />
1 Camp Facility Specialist<br />
Total Full-Time Staff - 20<br />
FTE Part-Time Staff - 79.11<br />
FTE = Full-Time Equivalent<br />
Golf Course<br />
Administration<br />
Food/Beverage Services Agreement<br />
Golf Pr<strong>of</strong>essional Services<br />
Agreement<br />
Golf Maintenance Agreement<br />
Commission on Aging<br />
Community Services Commission<br />
Human Relations Commission<br />
Parks, Recreation and<br />
Open Space Commission
7<br />
Citizens Advisory Committee<br />
<strong>Concord</strong> Naval Weapons Station<br />
<br />
Director<br />
Total Full-Time Staff - 3<br />
Administration<br />
Public Outreach<br />
Reuse Planning<br />
Financial Feasibility<br />
Fiscal Sustainability<br />
Conveyance Strategies<br />
1 Reuse Manager<br />
1 Administrative Assistant<br />
Technical Advisory Group
8<br />
<strong>City</strong> Treasurer<br />
Treasury<br />
Accounts Receivable<br />
Assessment District Administration<br />
Bond Service Program<br />
Business Licenses/Permits<br />
Investment <strong>of</strong> <strong>City</strong> Funds<br />
Revenue Collection<br />
Small Claims Administration<br />
2 Account Clerk III<br />
1 Administrative Clerk III<br />
1 Revenue Generation Team Leader<br />
1 Treasury Manager<br />
1 Treasury Technician<br />
Financial Operations<br />
Accounting<br />
Accounts Payable<br />
Financial Reporting<br />
Grants<br />
Payroll<br />
1 Accountant I<br />
3 Accountant II<br />
1 Account Clerk II<br />
1 Accounts Payable Team Leader<br />
1 Financial Operations Manager<br />
1 Payroll Specialist<br />
1 Payroll Technician<br />
3 Account Clerk III<br />
Finance<br />
Director <strong>of</strong> Finance<br />
Total Full-Time Staff - 27<br />
Purchasing & Materials<br />
Management<br />
Central Stores<br />
Goods & Services Procurement<br />
In-House Deliveries<br />
Public Project Procurement<br />
Receiving<br />
Surplus Property Storage/Disposal<br />
1 Administrative Clerk II<br />
1 Buyer<br />
1 Central Storekeeper<br />
1 Purchasing Agent<br />
Budget &<br />
Financial Planning<br />
10-Year Financial Plan<br />
CIP Support<br />
Financial Analysis<br />
Operating Budget<br />
Performance-Based Budget<br />
1 Accountant II<br />
<br />
1 Financial Analyst
9<br />
<br />
Employment<br />
Services<br />
2 Human Resources Technician II<br />
1 Employee Services Manager<br />
Human Resources<br />
Director <strong>of</strong> Human Resources<br />
Total Full-Time Staff - 9<br />
Risk Management/<br />
Organizational Training<br />
1 Sr. Human Resources Analyst<br />
1 Human Resources Analyst II<br />
1 Employment Services Manager<br />
1 Human Resources Analyst I<br />
Personnel Board
10<br />
Data Base Systems<br />
& Programming<br />
Application Provisioning<br />
Integration Services<br />
On-going Support<br />
Security Provisioning<br />
Database Management<br />
System Development/<br />
Programming<br />
1 Systems & Programming<br />
Manager<br />
2 Senior Programming<br />
Analysts<br />
1 Senior System Analyst<br />
Geographic<br />
Information Systems<br />
<br />
Land Records<br />
Parcel Maintenance<br />
Street Naming and<br />
Addressing<br />
Spatial Analysis<br />
1 GIS Program<br />
Supervisor<br />
1 GIS Technician<br />
Desktop Support<br />
Services<br />
PC Provisioning<br />
S<strong>of</strong>tware License Compliance,<br />
Management,<br />
Support Testing,<br />
Packaging<br />
Print Provisioning<br />
Break/Fix/Help Desk<br />
Equipment Moves/<br />
Adds/Changes<br />
(MACS)<br />
Remote Access<br />
Application Provisioning<br />
Security Provisioning<br />
Hardware & S<strong>of</strong>tware<br />
Asset Management<br />
1 Microcomputer Coordinator<br />
Network Support<br />
Services<br />
Server Provisioning<br />
Network Provisioning<br />
Security Provisioning<br />
Data Retention<br />
Secure Data Destruction<br />
WiFi System Provisioning<br />
.5 Information System<br />
Technician II<br />
1 Senior Network Systems<br />
Engineer<br />
1 Network Engineer<br />
Information Technology<br />
Director <strong>of</strong> Information Technology<br />
Total Full-Time Staff - 18<br />
FTE Part-Time Staff - 1.99<br />
Training Services<br />
Provisioning <strong>of</strong> Training<br />
Facility<br />
Provisioning <strong>of</strong> Training<br />
Classes across <strong>City</strong><br />
Provided S<strong>of</strong>tware<br />
Applications<br />
Partnership with other<br />
Agencies<br />
1.44 Technician (FTE-<br />
Part-Time)<br />
Police Information<br />
Systems<br />
Information Systems<br />
1 Information Systems<br />
Technician<br />
1 Microcomputer Coordinator<br />
1 Systems & Programming<br />
Manager<br />
1 Senior<br />
Programmer Analyst<br />
Telecommunications<br />
PBX Infrastructure<br />
Cellular Service<br />
Clayton Support/Liaison<br />
with Vendors<br />
Voice Mail Infrastructure<br />
Commercial Voice &<br />
Data Line Provisioning<br />
Wi-Fi System Provisioning<br />
Surveillance Systems<br />
Indoor Cable Plant<br />
Outdoor Cable Plant<br />
I-Net Provisioning<br />
Internal Phone Directory<br />
.25 Administrative Analyst<br />
.5 Information Systems<br />
Technician II<br />
1 Telecommunications<br />
Manager<br />
Web Services<br />
<strong>City</strong> Website Management<br />
& Development<br />
Internet E-mail Services<br />
Intranet Management<br />
E-mail Campaigns<br />
Domain Registration<br />
1 Web Coordinator<br />
.<br />
Document Services<br />
Template Creation, Updating,<br />
and Support<br />
PowerPoint Presentations<br />
Document Processing/<br />
Production<br />
<strong>City</strong> Publications Backup<br />
Design and Layout<br />
Support for Print<br />
Services<br />
Photo/Graphic Manipulation<br />
and Insertion<br />
SurveyPro Input /Reports<br />
Telephone and <strong>City</strong><br />
<br />
Directories<br />
PD Policy and Manuals<br />
Assistance<br />
.48 Document Specialist<br />
(FTE Part-Time)<br />
.07 Intern (FTE Part-<br />
Time)<br />
Administration<br />
Maintain Currency with<br />
Applicable Laws and<br />
Regulations<br />
Manage <strong>City</strong>wide<br />
Techonology Replacement<br />
Fund<br />
Budget Preparation and<br />
Maintenance<br />
Business-Value Based<br />
<br />
Records Keeping<br />
Vendor Billing Coordination<br />
.75 Administrative Analyst
11<br />
Planning<br />
Development Review<br />
General Plan Development and Implementation<br />
Land Use Policy Analyses<br />
1 Administrative Clerk III<br />
1 Administrative Secretary<br />
1 Assistant Planner<br />
1 Planning Manager<br />
2 Principal Planner<br />
4 Senior Planner<br />
1 Planning Technician<br />
Planning & Economic Development<br />
Director <strong>of</strong> Planning & Economic Development<br />
Planning Commission<br />
Design Review Board<br />
Zoning Administrator<br />
Total Full-Time Staff - 26<br />
Part-Time Staff - 1.22<br />
Economic Development/<br />
Redevelopment Agency<br />
Economic Development Strategy<br />
Redevelopment Ten-Year Implementation<br />
Plan<br />
.5 Administrative Assistant<br />
1 Administrative Secretary<br />
1 Business Development Manager<br />
1 Downtown Coordinator<br />
1 Economic Development/Redevelopment<br />
Manager<br />
1 Economic Development Specialist<br />
.24 Pr<strong>of</strong>essional (FTE Part-Time)<br />
.48 Administrative Support (FTE Part-<br />
Time)<br />
<br />
Administration<br />
.5 Administrative Assistant<br />
Housing<br />
Housing Rehabilitation<br />
Mobile Home Rent Review<br />
Assisted Housing Development<br />
1 Administrative Secretary<br />
1 Housing Manager<br />
1 Housing Program Analyst<br />
1 Housing Rehabilitation Coordinator<br />
1 Housing Rehabilitation Specialist<br />
1 Senior Housing Rehab. Specialist<br />
.50 Administrative Support<br />
(FTE Part-Time)<br />
1 Administrative Clerk III<br />
Mobile House<br />
Rent Review Board
12<br />
District<br />
Command<br />
Northern<br />
Command<br />
(Patrol)<br />
1 CSO<br />
1 Lieutenant<br />
1.44 Public Safety<br />
Assistant<br />
(FTE Part-<br />
Time)<br />
Southern<br />
Command<br />
1 CSO<br />
1 Lieutenant<br />
1.44 Public Safety<br />
Assistant<br />
(FTE Part-<br />
Time)<br />
Valley<br />
Command<br />
(Patrol)<br />
1 CSO<br />
1 Lieutenant<br />
1.44 Public Safety<br />
Assistant<br />
(FTE Part-<br />
Time)<br />
CSO=Community Services<br />
<br />
Community<br />
Service Desk<br />
Differential<br />
Police<br />
Responses<br />
2 CSO<br />
<br />
4.59 Public Safety<br />
Assistant<br />
(FTE Part-<br />
Time)<br />
Operations<br />
Command<br />
<br />
Selective<br />
Enforcement<br />
Special Events<br />
Parking<br />
Vehicle Abatement<br />
1 Administrative<br />
Clerk III<br />
<br />
1 Sergeant<br />
1 CSO<br />
4.52 Public Safety<br />
Assistant (FTE<br />
Part-Time)<br />
Patrol<br />
Operations<br />
& Response<br />
Corporal<br />
Program<br />
Police Training<br />
Program<br />
SET<br />
SWAT<br />
K-9<br />
4 Lieutenant<br />
9 Sergeant<br />
<br />
Pr<strong>of</strong>essional<br />
Standards<br />
1 Sergeant<br />
Field<br />
Operations<br />
1 Captain<br />
Special<br />
Operations<br />
Detention<br />
Catastrophic<br />
Incident<br />
Management<br />
Division Audit<br />
and Control<br />
Deployment<br />
and Strategy<br />
5 CSO/Detention<br />
1 Sergeant<br />
1 Administrative<br />
Secretary<br />
Internal<br />
Operations<br />
Equipment & Alarms<br />
Budget &<br />
Purchasing<br />
Licenses & Permits<br />
Building<br />
Maintenance<br />
1 CSO<br />
1 Financial<br />
Analyst<br />
Administrative<br />
Services<br />
1 Captain<br />
Public Information<br />
Crime Prevention/<br />
Neighborhood<br />
Watch<br />
Volunteers in<br />
Police Services<br />
1 Executive Secretary<br />
Training Comm. Action & Communications Crime Scene Records Detectives Detectives<br />
Awareness/Crime<br />
Investigations/<br />
Analysis<br />
Property<br />
Personnel<br />
Reserves<br />
Emergency<br />
Preparedness<br />
1 Sergeant<br />
.75 Technician (FTE<br />
Part-Time)<br />
3.26 Public Safety<br />
Assistant (FTE<br />
Part-Time)<br />
Police<br />
Chief <strong>of</strong> Police<br />
Total Full-Time Staff - 219<br />
FTE Part-Time Staff - 23.06<br />
1 Sergeant<br />
.76 Manager <strong>of</strong><br />
Volunteer<br />
Services<br />
(FTE Part-<br />
Time)<br />
1 Administrative Secretary<br />
1 Administrative<br />
Clerk III<br />
Dispatch<br />
2 Dispatcher I<br />
10 Dispatcher II<br />
4 Lead Dispatcher<br />
1 Sergeant<br />
1.66 Public Safety<br />
Assistant (FTE<br />
Part-Time)<br />
Crime Scene<br />
Investigation<br />
Property and<br />
Evidence<br />
2 CSO<br />
4 Forensic<br />
Specialist I<br />
1 Lead Forensic<br />
Specialist<br />
<br />
.49 Public Safety<br />
Assistant (FTE<br />
Part-Time)<br />
Support<br />
Operations<br />
1 Captain<br />
Records<br />
Warrants<br />
Public<br />
Information<br />
7 Administrative<br />
Clerk II<br />
3 Administrative<br />
Clerk III<br />
1 Administrative<br />
Secretary<br />
1 Police Records<br />
Manager<br />
.97 Public Safety<br />
Assistant (FTE<br />
Part-Time)<br />
1 Administrative<br />
Secretary<br />
Youth Services<br />
Crime<br />
Education<br />
School Resource<br />
Gangs<br />
Intelligence<br />
Persons<br />
Crime Analysis<br />
1 Administrative<br />
Clerk II<br />
1 Lieutenant<br />
<br />
2 Sergeants<br />
1 Violence-Victim<br />
Advocate<br />
1 Youth Violence<br />
Prevention<br />
Specialist<br />
1 Senior Crimes<br />
Analyst<br />
.75 Crime Analyst<br />
(FTE Part-Time)<br />
.5 Violence Victim<br />
Advocate (Part-<br />
Time)<br />
Financial<br />
Narcotics<br />
2 Administrative<br />
Clerk II<br />
1 Lieutenant<br />
<br />
2 Sergeant<br />
.49 Public Safety<br />
Assistant (FTE<br />
Part-Time)
13<br />
Administration<br />
Administrative Support<br />
Clerical Support<br />
Lighting Assessment<br />
District<br />
Public Information<br />
Special Projects<br />
Stormwater<br />
Management<br />
1 Administrative Assistant<br />
2 Administrative Clerk III<br />
1 Administrative Secretary<br />
1 Sr. Administrative<br />
Analyst<br />
1 Sr. Construction<br />
Fleet Management<br />
1 Fleet Manager<br />
Contractual Vehicle<br />
Repair<br />
Garage Operations<br />
Vehicle Maintenance<br />
Repairs &<br />
Replacement<br />
1 Lead Worker<br />
4 Equipment Mechanic<br />
<br />
Street Lights<br />
<br />
<br />
<br />
1 Transportation Program<br />
Manager II<br />
<br />
Technician<br />
Transportation<br />
1 Transportation Manager<br />
Transportation<br />
Planning<br />
Geometric Design<br />
Transportation Planning<br />
2 Transportation Program<br />
Coordinator<br />
Public Works<br />
Director <strong>of</strong> Public Works<br />
Total Full-Time Staff - 112<br />
FTE Part-Time Staff - 39.20<br />
Signs/Striping/<br />
Maintenance<br />
Pavement Markings<br />
<br />
.90 General Laborer<br />
(FTE Part-Time)<br />
1 Lead Worker<br />
1 Maintenance Team<br />
Leader<br />
3 Maintenance<br />
Worker II<br />
Pump Station/Sewers<br />
Central Contra Costa<br />
Sanitary District<br />
Pump Station Operations<br />
Sewer Pipe Maintenance<br />
USA Locates<br />
1 Lead Worker<br />
1 Maintenance Team<br />
Leader<br />
6 Maintenance Worker II<br />
1 Pump Station Operator<br />
Infrastructure<br />
Maintenance<br />
1 Infrastructure Manager<br />
Streets &<br />
Drainage<br />
Curb/Gutter/Sidewalk<br />
Repair<br />
Storm Drainage<br />
Street Maintenance<br />
Street Sweeping<br />
Storm Water<br />
Management<br />
3.05 General Laborer (FTE<br />
Part-Time)<br />
3 Heavy Equipment<br />
Operator I<br />
1 Heavy Equipment<br />
Operator II<br />
1 Maintenace Worker I<br />
5 Maintenance Worker II<br />
2 Sr. Maintenance Team<br />
Leader<br />
3 Sweeper Operator<br />
Parks Services Facility Maintenance<br />
1 Parks Manager 1 Facilities Mt. Man-<br />
Community Action Team<br />
Landscape Assessment<br />
Districts<br />
Medians<br />
Open Space/Pest &<br />
Weed Control<br />
Parks Maintenance<br />
Tree Maintenance<br />
1 Administrative Clerk III<br />
2 Environmental<br />
Maintenance Technician<br />
6 General Laborer<br />
31.41 General Laborer<br />
(FTE Part-Time)<br />
1 Heavy Equipment<br />
Operator I<br />
5 Landscape Gardener<br />
5 Maintenance Gardener<br />
1 Maintenance Sprinkler<br />
Fitter<br />
3 Maintenance Team<br />
Leader<br />
1 Maintenance Worker II<br />
3 Parks Lead Worker<br />
2 Sr. Maintenance Team<br />
Leader<br />
1 Tree Lead Worker<br />
2 Tree Trimmer<br />
1 Horticultureal Advisor<br />
ADA Compliance<br />
Program<br />
Custodial Services<br />
Facility Maintenance<br />
<br />
Hazardous Materials<br />
Management<br />
Repairs & Alterations<br />
Security and Alarms<br />
Lease Management<br />
6 Custodian<br />
2.4 Custodian (FTE<br />
Part-Time<br />
.24 Craft Worker (FTE<br />
Part-Time)<br />
1.2 General Laborer (FTE<br />
Part-Time)<br />
2 Lead Custodian<br />
3 Maintenance<br />
Carpenter<br />
3 Maintenance<br />
Electrician<br />
2 Maintenance Painter<br />
2 Maintenance Utility<br />
Mechanic<br />
2 Maintenance Worker II<br />
2 Sr. Maintenance Team<br />
Leader<br />
2 Recreation Utility<br />
Worker<br />
1 Facilities Maintenance
CITY OF CONCORD<br />
COMPARATIVE SUMMARY OF<br />
AUTHORIZED FULL-TIME POSITIONS<br />
FOR THE YEAR ENDING JUNE 30, 2008<br />
2005-2006 2006-2007 2007-2008 Incr.<br />
Budget Budget Budget <br />
A B C D = C - B<br />
GENERAL FUND<br />
Building, Engineering & Neighborhood Services * 47.0 45.0 44.0 (1.0)<br />
<strong>City</strong> Attorney 6.0 6.0 6.0 0.0<br />
<strong>City</strong> Council 6.0 6.0 6.0 0.0<br />
<strong>City</strong> Management 15.0 15.0 15.0 0.0<br />
Community & Recreation Services 21.0 20.0 20.0 0.0<br />
Finance * 26.0 26.0 27.0 1.0<br />
Human Resources 8.0 9.0 9.0 0.0<br />
Information Technology 14.0 14.0 18.0 4.0<br />
<strong>Concord</strong> Community Reuse Project 0.0 0.0 3.0 3.0<br />
Planning and Economic Development * 20.0 18.0 18.0 0.0<br />
Police 224.0 223.0 219.0 (4.0)<br />
Public Works 98.0 99.0 99.0 0.0<br />
Total General Fund 485.0 481.0 484.0 3.0<br />
ENTERPRISE FUNDS<br />
Storm Water Management 4.0 4.0 4.0 0.0<br />
Sewer 9.0 9.0 9.0 0.0<br />
Golf Course ** 5.0 0.0 0.0 0.0<br />
Total Enterprise Funds 18.0 13.0 13.0 0.0<br />
GRAND TOTAL CITY AUTHORIZED POSITIONS 503.0 494.0 497.0 3.0<br />
REDEVELOPMENT AGENCY 7.0 7.0 8.0 1.0<br />
TOTAL CITY AND REDEVELOPMENT AGENCY 510.0 501.0 505.0 4.0<br />
*Includes one overfilled position.<br />
**Golf Course maintenance staff supplanted by outside services maintenance contract 1/2006.
Nestled in the foothills <strong>of</strong> Mt. Diablo, <strong>Concord</strong> is the largest city in Contra Costa<br />
County with approximately 125,203 residents occupying 31.1 square miles. Its<br />
central location <strong>of</strong>fers easy access to San Francisco, Oakland, the Silicon Valley,<br />
the redwoods <strong>of</strong> Northern California, the wineries <strong>of</strong> Napa Valley, the rugged<br />
coastline <strong>of</strong> Monterey, and the astonishing beauty <strong>of</strong> the the Sierra mountain range.<br />
Bay Area Rapid Transit (BART) high-speed trains, local bus services, Amtrak,<br />
ferries and international airports provide transportation options for residents,<br />
commuters and visitors.<br />
<strong>Concord</strong> has attracted some <strong>of</strong> the country’s leading financial and commercial<br />
businesses. Affordability, accessibilty and a pr<strong>of</strong>icient workforce contribute to<br />
<strong>Concord</strong>’s appeal. <strong>Concord</strong>’s varied housing choices include new homes,<br />
apartments, established neighborhoods and townhouses in a broad spectrum <strong>of</strong><br />
price ranges. Twenty-five <strong>City</strong> parks, a state-<strong>of</strong>-the-art hospital, a wide variety <strong>of</strong><br />
restaurants, regional shopping centers, two community centers, a senior center and<br />
first-rate weather join the list <strong>of</strong> <strong>Concord</strong>’s assets.<br />
<strong>Concord</strong> is a General Law <strong>City</strong> and operates under the Council-Manager form <strong>of</strong><br />
government. The five members <strong>of</strong> the <strong>City</strong> Council are elected at large for four-year<br />
staggered terms. The Council selects representatives after each election to serve<br />
as Mayor and Vice-Mayor for what has traditionally been a one-year term. Under<br />
this system, the Council appoints the <strong>City</strong> Manager. The departments that make up<br />
the city government include Building Engineering & Neighborhood Services, <strong>City</strong><br />
Attorney, <strong>City</strong> Management, Community & Recreation Services, Finance, Human<br />
Resources, Information Technology, Planning and Economic Development, Police<br />
and Public Works.<br />
15
An Early History <strong>of</strong> <strong>Concord</strong>, California<br />
Once the Town <strong>of</strong> Todos Santos on the Land Grant <strong>of</strong> Monte Del Diablo<br />
• A small tribelet <strong>of</strong> Chupcan (Bay Miwok) Indians were the first know inhabitants <strong>of</strong> the valley.<br />
Dominated by a great mountain to their south, the Chupcan lived along the valley's streams,<br />
which flowed north to the wide tule marshes on the edge <strong>of</strong> the Bay. They shared the valley<br />
and the oak-covered hills with tremendous herds <strong>of</strong> elk, deer and antelope. Salmon filled<br />
the streams; grizzly bears roamed foothills.<br />
• In 1772 Spanish explorers, led by Captain Pedro Fages and Father Juan Crespi, became<br />
the first Europeans to cross this area. For the next 50 to 60 years, the Spanish would<br />
explore, but not settle in our valley.<br />
• In 1828, Don Salvio Pacheco petitioned the Mexican government for lands in the valley and<br />
received the "Monte del Diablo" land grant in 1834. The 17,921 acre grant covered our<br />
valley from the Walnut Creek channel east to the hills and generally from the Mt. Diablo<br />
foothills north to Suisun Bay.<br />
• The name "Monte del Diablo" originally had been used by Spanish soldiers to describe a<br />
dense thicket (monte) <strong>of</strong> willows at the north end <strong>of</strong> our valley. The soldiers believed the<br />
thicket was possessed by evil, devilish Man spirits, hence the name "Monte del Diablo,"<br />
thicket <strong>of</strong> the devil.<br />
• Don Salvio's son, Fernando Pacheco, was sent immediately to occupy the grant and begin<br />
cattle operations on the Pacheco family's new Rancho which he managed from an adobe<br />
still standing in Hillcrest Park. The family joined him in 1846. Don Salvio's grand adobe,<br />
which is still located in downtown <strong>Concord</strong>, became the business, social and cultural center<br />
<strong>of</strong> the region.<br />
• Don Francisco Galindo married Don Salvio's daughter, Maria Dolores Manuela. The<br />
Galindo's wood frame home, also on the national register, remains today near the Clayton<br />
Road extension and Galindo Street.<br />
• A new town called Pacheco, adjacent to the Rancho, prospered as an industrial and<br />
shipping center. Its prosperity was short lived due to fires, flooding and the 1868<br />
earthquake.<br />
• In 1868, Don Salvio Pacheco, his son Fernando, and his son-in-law Francisco Galindo<br />
created a new town at the center <strong>of</strong> their Rancho. They called their new town Todos Santos<br />
(All Saints), and, in 1869, <strong>of</strong>fered lots free to the merchants and residents <strong>of</strong> Pacheco. Its<br />
perimeter was marked by Bonifacio Street on the northwest, East Street on the northeast,<br />
Contra Costa Street on the southeast, and Galindo Street on the southwest.<br />
17
• The name Todos Santos would not identify the new town for long. Within months after<br />
Todos Santos had been recorded as the <strong>of</strong>ficial name <strong>of</strong> the subdivision, <strong>Concord</strong> was<br />
heralded by the Contra Costa Gazette as the actual name <strong>of</strong> the town. In an article dated<br />
April 17, 1869, the paper congratulated the residents <strong>of</strong> <strong>Concord</strong> for adopting such a<br />
meaningful name for their new village. They highlighted the harmonious spirit and euphony<br />
<strong>of</strong> this fine name. Despite later published reminders and protests by Fernando Pacheco,<br />
<strong>Concord</strong> became the name <strong>of</strong> our new town.<br />
• By 1879, a population <strong>of</strong> 300 was reported. It would double by February 1905, when<br />
incorporation <strong>of</strong> the "Town <strong>of</strong> <strong>Concord</strong>" was approved by a local eight vote margin.<br />
• It would take 35 years for the population to double again. At the beginning <strong>of</strong> World War II<br />
small town <strong>Concord</strong> had an extraordinary high school, a modern hospital, five churches, two<br />
railroads, a fine library, a central plaza, two cinemas, a full-service downtown commercial<br />
area, tree-lined streets, comfortable homes, and a population <strong>of</strong> only 1,400. The war years<br />
brought exposure; the postwar years began a population boom. By 1948, the population had<br />
grown to 6,500.<br />
• Today, the farms, orchards, and the old Rancho are neighborhoods; the classic old<br />
downtown has a multistory skyline. <strong>Concord</strong> has a diverse population approaching 130,000<br />
and is the largest city in Contra Costa County. Confident <strong>of</strong> its future, <strong>Concord</strong> is especially<br />
proud <strong>of</strong> its rich history.<br />
On the Cover<br />
Clockwise from top left: <strong>Concord</strong> unfolds at the foot <strong>of</strong> Mt. Diablo; the Police Services building;<br />
the <strong>Concord</strong> Senior Citizens Center hosts hundreds <strong>of</strong> visitors every day; the timely repair <strong>of</strong><br />
storm damage to a major thoroughfare; Salvio Pacheco Square has recently undergone a<br />
renovation; Newhall park shines with it’s new signage.<br />
18
MISCELLANEOUS STATISTICS<br />
June 30, 2008<br />
Population 125,203<br />
Population<br />
Date <strong>of</strong> incorporation February 9, 1905<br />
Registered voters 53,762 Form <strong>of</strong> government Council-<strong>City</strong> Manager<br />
(General Law)<br />
Area<br />
31.13<br />
Police Protection<br />
Number <strong>of</strong> stations 4<br />
Number <strong>of</strong> sworn personnel 159<br />
Fire Protection<br />
The <strong>City</strong> <strong>of</strong> <strong>Concord</strong> is part <strong>of</strong> Contra Costa County Consolidated Fire District<br />
Number <strong>of</strong> stations 5<br />
Number <strong>of</strong> firefighters 45<br />
Sewer Services<br />
Sewer lines in miles 384<br />
Number <strong>of</strong> households 37,928<br />
Average daily pumping in gallons 14.01 Million<br />
Education<br />
Number <strong>of</strong> public schools (elementary/Jr. High) 23<br />
Number <strong>of</strong> public schools (high school) 5<br />
Number <strong>of</strong> Universities/Colleges (California State, Chapman and Heald) 3<br />
Number <strong>of</strong> students in public schools 17,939<br />
Culture and Leisure<br />
Number <strong>of</strong> theaters 2<br />
Number <strong>of</strong> performing arts centers 1<br />
Number <strong>of</strong> <strong>City</strong> parks 18<br />
Number <strong>of</strong> art galleries 1<br />
Number <strong>of</strong> swimming pools 2<br />
Golf Course 1<br />
<strong>City</strong> Employees<br />
Full-time 505<br />
Part-time (varies seasonally) 166-399<br />
SOURCE: VARIOUS CITY, STATE AND MT. DIABLO UNIFIED SCHOOL DISTRICTS RECORDS
Demographic Characteristics for <strong>Concord</strong><br />
What is the total population <strong>of</strong>...?<br />
FY2007-2008<br />
<strong>Concord</strong>? 125,203<br />
Contra Costa County? 1,034,874<br />
California? 37,161,015<br />
What percentage <strong>of</strong> the total population in <strong>Concord</strong> is under 18?<br />
24.44 percent (30,485)<br />
What is the total number <strong>of</strong> people age 55 and older?<br />
26,990 people (21.69%)<br />
What is the total number <strong>of</strong> people age 65 and older?<br />
13,700 people (11.01%)<br />
What is the median age in the <strong>City</strong> <strong>of</strong> <strong>Concord</strong>?<br />
36.30 years<br />
What percentage <strong>of</strong> the total population is Hispanic or Latino?<br />
26.80 percent (33,356)<br />
What is the breakdown <strong>of</strong> males and females for the total population <strong>of</strong><br />
<strong>Concord</strong>?<br />
61,735 male/ 62,701 female<br />
What is the total number <strong>of</strong>...?<br />
Households? 45,085<br />
Families? 30,838<br />
Families with Children?<br />
What is the average...?<br />
15,478<br />
Household size? 2.76<br />
Family size? 3.30<br />
What is the total number <strong>of</strong> housing units?<br />
45,848<br />
What is the breakdown <strong>of</strong> owner occupied vs. renter occupied?<br />
Owner 27,369 61.6%<br />
Renter 17,082 38.5%<br />
Sources: 2000 Census and 2006 Claritas Inc. SiteReport.<br />
20
<strong>City</strong> <strong>of</strong> <strong>Concord</strong> Labor Force<br />
Labor Force Participation<br />
There is above average labor force participation in the <strong>Concord</strong> trade area.<br />
1 mile ring 3 mile ring<br />
5 mile ring<br />
Percent <strong>of</strong> population 16+ Years in Labor Force 47.6% 50.1% 51.7%<br />
Percent <strong>of</strong> Total Workers by Occupation<br />
Over two-third <strong>of</strong> the <strong>Concord</strong> trade area labor force is white collar.<br />
White Collar: 1 mile ring 3 mile ring 5 mile ring Blue Collar:<br />
1 mile ring 3 mile ring 5 mile ring<br />
Managerial/Executive 11.50% 16.15% 19.33% Craftsmen 11.93% 10.88% 9.05%<br />
Pr<strong>of</strong>essional 12.10% 18.70% 22.32% Services 26.99% 17.49% 13.78%<br />
Sales 25.99% 27.91% 28.17% Other Blue Collar 11.29% 8.76% 7.28%<br />
Percent White 49.60% 62.73% 69.78% Percent Blue 50.30% 37.20% 30.10%<br />
Collar<br />
Collar<br />
Education<br />
Over half <strong>of</strong> <strong>Concord</strong>'s trade area residents have a college education.<br />
1 mile ring<br />
3 mile ring<br />
5 mile ring<br />
Percent <strong>of</strong> Population with college education 49.8% 61.2% 69.0%<br />
Tenure<br />
The stability <strong>of</strong> <strong>Concord</strong>'s trade area labor force is evidenced in high rates <strong>of</strong> home ownership.<br />
1 mile ring 3 mile ring<br />
5 mile ring<br />
Percentage <strong>of</strong> total homes owner-occupied 35.22% 58.84% 64.64%<br />
Percentage <strong>of</strong> total homes renter-occupied 64.78% 41.16% 35.36%<br />
<strong>City</strong> <strong>of</strong> <strong>Concord</strong> Age Distribution - 2006<br />
The majority <strong>of</strong> <strong>Concord</strong> residents are in the prime employment age between 25 and 54 years.<br />
Number Percent<br />
Under 5 Years 8,250 6.63%<br />
6 to 17 Years 22,158 17.81%<br />
18 to 24 years 11,436 9.19%<br />
25 to 34 years 17,903 14.39%<br />
35 to 44 years 19,624 15.77%<br />
45 to 54 years 18,077 14.53%<br />
55 to 64 years 13,288 10.68%<br />
65 years and above 13,700 11.01%<br />
Total Population 124,436 100.00%<br />
*All statistics except for age distribution are based on 3, 5, and 10 mile rings from the intersection <strong>of</strong> <strong>Concord</strong> Avenue<br />
and Salvio Streets. Age distribution counts residents within the city boundary. Sources: 2000 Census and 2006<br />
Claritas Inc. Site Report.<br />
21
13.25%<br />
13.00%<br />
12.75%<br />
12.50%<br />
12.25%<br />
12.00%<br />
Contra Costa Annual Average Unemployment Rates(4)<br />
Fiscal Square School <strong>City</strong> Average Pop. County <strong>City</strong> Population<br />
Year Miles (1) Enrollment (2) Population (3) % Change Population (3) % <strong>of</strong> County <strong>City</strong> County State<br />
1998 30.68 19,400 113,400 1.43% 900,700 12.59% 3.8% 4.1% 6.3%<br />
1999 30.68 19,109 114,500 0.97% 916,400 12.49% 2.9% 3.1% 5.4%<br />
2000 30.68 19,122 121,780 6.36% 930,025 13.09% 2.4% 3.0% 5.2%<br />
2001 30.68 18,941 123,272 1.23% 948,816 12.99% 3.2% 3.4% 4.9%<br />
2002 30.68 19,075 123,935 0.54% 981,600 12.63% 4.7% 4.5% 6.5%<br />
2003 30.68 18,939 124,655 0.58% 994,900 12.53% 4.7% 4.5% 6.7%<br />
2004 31.13 19,010 124,856 0.16% 1,003,800 12.44% 5.1% 5.2% 6.2%<br />
2005 31.13 17,888 124,798 -0.05% 1,020,898 12.22% 5.2% 4.8% 5.4%<br />
2006 31.13 17,939 124,436 -0.29% 1,029,377 12.09% 4.6% 4.3% 4.9%<br />
2007 31.13 15,845 125,203 0.62% 1,034,874 12.10% 4.9% 4.5% 5.3%<br />
Sources: (1) <strong>City</strong> <strong>of</strong> <strong>Concord</strong> Planning Department.<br />
(2) Mt. Diablo Unified School District<br />
(3) U.S. Bureau <strong>of</strong> the Census & California Dept. <strong>of</strong> Finance<br />
(4) State <strong>of</strong> California Employment Development Dept.<br />
DEMOGRAPHIC STATISTICS<br />
Last Ten Fiscal Years<br />
1998 1999 2000 2001 2002 2003 2004 2005 2006 2007<br />
<strong>City</strong> Population as a % <strong>of</strong> County Population
Jurisdictional Comparison<br />
Fiscal Year 2008<br />
<strong>City</strong> <strong>of</strong> <strong>City</strong> <strong>of</strong> <strong>City</strong> <strong>of</strong><br />
<strong>Concord</strong> Walnut Creek Pleasant Hill<br />
Year Incorporated 1905 1914 1961<br />
Form <strong>of</strong> Government Council/Manager Council/Manager Council/Manager<br />
General Law <strong>City</strong> General Law <strong>City</strong> General Law <strong>City</strong><br />
Physical Area 31.13 square miles 19.5 square miles 8.2 square miles<br />
Population 125,203 66,111 33,462<br />
Full Time Employees 505 366 124<br />
Employees per capita 248 181 270<br />
Sworn Personnel 159 59 44<br />
Sworn Personnel per capita 787 1,121 761<br />
Ethnic Make-up <strong>of</strong> Population<br />
White 60,404 55,467 27,057<br />
Black or African American 2,915 727 535<br />
Asian and Native Hawaiian and Pacific Islander 9,657 621 2,142<br />
American Indian and Alaska Native 1,185 198 100<br />
Some Other Race 16,946 9,097 3,627<br />
Hispanic or Latino (<strong>of</strong> any race) 33,356 3,960 2,299<br />
Registered Voters 53,762 40,393 18,368<br />
Party Affiliation<br />
Democrat 25,357 17,259 8,551<br />
Republican 15,856 14,842 5,431<br />
Other 12,549 8,292 4,386<br />
Number <strong>of</strong> Housing Units 45,848 32,267 14,320<br />
Mean Household Income $77,629 $87,500 $84,199<br />
Persons per Household 2.76 2.09 2.35
ADMINISTRATIVE DIRECTIVE<br />
1. PURPOSE<br />
BUDGET PREPARATION<br />
CITY OF CONCORD<br />
Number:<br />
Authority:<br />
Effective:<br />
Revised:<br />
Reviewed:<br />
Initiating Dept.:<br />
91<br />
<strong>City</strong> Manager<br />
01-02-73<br />
03-22-07<br />
To establish procedures for the development and computation <strong>of</strong> budget data, including<br />
the formulation and updates <strong>of</strong> work programs and standards <strong>of</strong> service for the following<br />
fiscal year and ten-year financial plan.<br />
2. GENERAL<br />
2007<br />
FI<br />
The budget adopted by the <strong>City</strong> Council is the financial plan <strong>of</strong> the city government <strong>of</strong><br />
<strong>Concord</strong>. As such, it is a significant document, and its preparation is one <strong>of</strong> the most<br />
important duties performed by <strong>City</strong> personnel. Time schedules and deadlines indicated in<br />
the budget calendar for submission and review <strong>of</strong> the various phases <strong>of</strong> the budget are<br />
extremely critical and shall be adhered to by all personnel.<br />
Departmental requests for appropriations must be realistic and based on work programs,<br />
analysis <strong>of</strong> needs, and past experience. Each year a comprehensive review <strong>of</strong> each<br />
department’s programs and proposals for enhancements is performed. The approved<br />
annual budget is an operating plan that establishes expenditure allocations for each<br />
program and projections <strong>of</strong> expenditure allocations for the next nine years. The <strong>City</strong> <strong>of</strong><br />
<strong>Concord</strong> prepares a ten-year financial plan for all <strong>City</strong> services.<br />
3. PROCEDURE<br />
The budget process is presented in separate stages to permit specialized analysis in each<br />
particular area. Preparers must keep in mind the final product as they prepare each<br />
phase, so that all phases, although they are prepared independently, can be coordinated<br />
into a final budget.<br />
3.1 Budget Kick<strong>of</strong>f<br />
3.11 This meeting is held early in November to present the budget calendar,<br />
distribute information on preparation for both the Operating and Capital<br />
Improvement Projects budgets, and position allocation listings for all currently<br />
authorized full-time positions.<br />
3.2 Personnel Services<br />
3.21 The Finance Department will calculate full-time personnel salaries and related<br />
benefits in accordance with current memoranda <strong>of</strong> understanding. Requests<br />
for new positions or classification change <strong>of</strong> a vacant position will be included<br />
in the projection if they are approved by the <strong>City</strong> Manager. Any capital outlay<br />
required in conjunction with a new position must be submitted in accordance<br />
24
ADMINISTRATIVE DIRECTIVE NO. 91<br />
with section 3.32 below. Requests to exchange or upgrade filled positions<br />
must be done in accordance with the procedure outlined by the Human<br />
Resources Department.<br />
3.22 Position allocations for full-time employees must be submitted to the Finance<br />
Department by mid-November. Position allocations shall be in accordance<br />
with the tasks in the Performance Based Budget (PBB) system.<br />
3.23 Limited service and overtime requests must be completed and include job<br />
classification, hours or dollars requested, and position allocations. These<br />
requests are then submitted to the Finance Department by mid-November.<br />
Finance will include these requests for salary and benefits in projections <strong>of</strong><br />
personnel costs for all ten-years in the financial plan. Position allocations shall<br />
be in accordance with the tasks in the PBB system.<br />
3.3 Operating Expenditures and Capital Equipment Requests<br />
3.31 The Finance Department will provide a report to assist each department in<br />
completing this phase <strong>of</strong> budget preparation. The report will contain last<br />
year’s projection for this budget year by account unit (or task) and account.<br />
Each department will make necessary changes on an exception basis and<br />
notify Finance <strong>of</strong> changes made. Finance will adjust the next nine years with<br />
the appropriate inflation factor. Each department will review and update their<br />
performance indicators and tasks in the PBB system prior to their budget<br />
meeting.<br />
3.32 Requests for capital equipment cost or any equipment impacting internal<br />
service funds must be justified on a special “Capital Request” form to be<br />
forwarded to the Finance Department by September 15 each year. Budget for<br />
capital equipment should be recorded with the correct account code in the “1Z”<br />
task, unless the equipment is so specialized as to apply to a single<br />
performance task.<br />
3.4 Internal Service Funds<br />
3.41 Capital equipment requests which impact any <strong>of</strong> the internal service funds<br />
shall be submitted to the Finance Department with copies to the appropriate<br />
fund manager so those requests can be included in the internal service fund<br />
manager’s proposal to the <strong>City</strong> Manager. Such requests must be submitted by<br />
September 15 th <strong>of</strong> each year.<br />
3.42 The internal service fund managers will prepare and submit their proposed<br />
ten-year replacement and operation plans to the <strong>City</strong> Manager no later than<br />
October 31 st <strong>of</strong> each year for the following fiscal year budget. Any required<br />
changes for service charges will be reflected in departmental budgets and<br />
reviewed as part <strong>of</strong> the budget process.<br />
25
ADMINISTRATIVE DIRECTIVE NO. 91<br />
3.5 Departmental Meetings<br />
3.51 Prior to the departmental meetings, the <strong>City</strong> Manager and the appointed<br />
budget review committee will meet to discuss the preliminary ten-year financial<br />
forecast. The Finance Director will present and explain assumptions and<br />
forecasts for the <strong>City</strong>’s major revenue sources.<br />
3.52 Meetings with departments will begin early in January. At this time, the <strong>City</strong><br />
Manager and the budget review committee will review each department’s<br />
revenue projections (if applicable), expenditure requests, Performance Based<br />
Budgeting (PBB) performance measures (indicators and tasks), service level<br />
changes, new program requests and ten-year financial forecasts (if<br />
applicable).<br />
3.53 Departments will make required changes and schedule a revisit meeting if<br />
necessary. Departments will update the section in the PBB system describing<br />
services performed during the current year, initiatives for the next fiscal year,<br />
and any significant changes proposed before the first <strong>of</strong> March.<br />
3.6 Budget Presentation<br />
3.61 The proposed budget will be presented to the <strong>City</strong> Council for preliminary<br />
review no later than the middle <strong>of</strong> May. The public is invited to the<br />
preliminary review, however, this review is intended to be a formal<br />
presentation by the <strong>City</strong> Manager and Department Heads highlighting<br />
accomplishments, proposed program enhancements, and significant<br />
changes. In June, the <strong>City</strong> Council will hold two public hearings at which they<br />
will review budgets, budget policies and changes. The budget is scheduled<br />
for adoption at the second public hearing council meeting in June.<br />
3.62 The proposed budget will be available for public review at three locations:<br />
<strong>City</strong> Clerk’s Office, Finance Department, and the public library. The proposed<br />
budget will be posted to the <strong>City</strong>’s website. A taped two-hour presentation <strong>of</strong><br />
the proposed budget will be shown on the <strong>City</strong>’s public access station several<br />
times before adoption. The <strong>City</strong> solicits and welcomes all public comments.<br />
26
DATE<br />
November 1, 2006<br />
November 17, 2006<br />
November 20, 2006<br />
November 29, 2006<br />
December 4, 2006<br />
December 18, 2006<br />
January 12, 2007<br />
January 12, -<br />
February 16, 2007<br />
CITY OF CONCORD<br />
BUDGET CALENDAR 2007-2008<br />
27<br />
DESCRIPTION<br />
Budget Kick-Off Meeting:<br />
1:30 to 3:00 meeting to provide guidance and instructions on the<br />
operating and PBB budget preparation process.<br />
Information to be completed/submitted:<br />
1. Position Control Listing (Signed by Department Head)<br />
2. Status <strong>of</strong> Departmental Planned Position Reductions<br />
3. Limited Service and Overtime<br />
Finalize Internal Service Funds:<br />
12:30 to 2:00 meeting with Internal Service Fund Managers<br />
finalizing 10-Year Replacement Plans<br />
Information to be completed/submitted:<br />
1. PBB Performance Indicator and Structural Changes to <strong>City</strong><br />
Manager<br />
2. Proposed Fee Adjustments<br />
Information to be completed/submitted:<br />
1. Changes to expenditure requests for FY2007-08 keyed into<br />
system by Departments and any needed adjustments to 10-Year<br />
plan sent to Finance<br />
2. Changes to revenue estimates for FY2007-08 keyed into<br />
system by Departments and any needed adjustments to 10-year<br />
plan sent to Finance<br />
Information to be completed/submitted:<br />
Enter PBB unit and performance indicator outcomes anticipated<br />
for FY2007-08<br />
10:00 - 12:00 - Budget Committee meets to discuss preliminary<br />
10-Year Financial forecast and Non-Departmental Revenues<br />
Department Meetings<br />
(see attached table for exact times)<br />
Items to review with Budget Committee:<br />
1. 10-Year Financial Forecasts updated continuously<br />
2. FY2007-08 Revenue Projections<br />
3. FY2007-08 Department Budget Requests<br />
4. Updated Department Initiatives and Significant Changes<br />
5. Updates to Fee Schedule<br />
6. Mid-year Budget Review including your Standard Operating<br />
Procedures to support PBB numbers
CITY OF CONCORD<br />
BUDGET CALENDAR 2007-2008<br />
DATE DESCRIPTION<br />
March 12, 2007 Preliminary Budget <strong>Memo</strong> to Council.<br />
March 30, 2007 Draft Budget Document Complete.<br />
April 2, – April 6, 2007 Draft Budget Document Reviewed and Edited.<br />
April 9, 2007 Proposed Budget Volumes I &II to Printing.<br />
April 20, 2007 Proposed Budget to Council.<br />
April 23, – May 4, 2007 <strong>City</strong> Manager reviews budget with individual council members.<br />
May 8, 2007<br />
May 15, 2007<br />
June 5, and June 19,<br />
2007<br />
June 19, 2007<br />
Budget Workshop I – Department Heads and Managers<br />
<strong>City</strong> Council Study Session for Preliminary Review.<br />
Budget Workshop II – Department Heads and Managers<br />
<strong>City</strong> Council Study Session for Continuing Review.<br />
<strong>City</strong> Council reviews budgets, budget policies and holds public<br />
hearings:<br />
1. <strong>City</strong> Budget<br />
2. Redevelopment Agency Budget<br />
3. Capital Improvement Program<br />
4. Assessment Districts<br />
5. Proposed Fee Increases<br />
6. Review <strong>City</strong> policies<br />
1. <strong>City</strong> Council hearing/adoption <strong>of</strong>:<br />
a. Capital Improvement Program<br />
2. <strong>City</strong> Council adopts:<br />
a. Budgets and Budget Policies<br />
b. Appropriation limit<br />
c. Redevelopment administration support agreement<br />
d. Fee Increases<br />
28
POLICY & PROCEDURE<br />
1. PURPOSE<br />
CITY OF CONCORD<br />
Number:<br />
Authority:<br />
Effective:<br />
Revised:<br />
Reviewed:<br />
Initiating Dept.:<br />
BUDGET APPROPRIATION TRANSFER CONTROLS<br />
31<br />
Res. 05-76<br />
4-02-73<br />
10-25-05<br />
2005<br />
FI<br />
To provide a procedure allowing for efficient and cost effective transfers <strong>of</strong> budgeted funds between<br />
<strong>City</strong> programs, capital projects and line item accounts.<br />
2. POLICY<br />
The <strong>City</strong> Council recognizes the benefit <strong>of</strong> adopting a policy for the processing <strong>of</strong> budget transfers<br />
that not only provides for strong internal financial controls, but also encourages improved accountability<br />
and budgetary estimates from Department Heads. An integral part <strong>of</strong> the process should be<br />
increased responsiveness, cost effectiveness and elimination <strong>of</strong> redundant tasks.<br />
3. BUDGET TRANSFER CATEGORIES<br />
3.1 Department Groups<br />
Budget amounts which are assigned to a specific organizational function consisting <strong>of</strong> programs<br />
related in nature or purpose.<br />
3.11 Examples: Departments covered by this section include such functions as <strong>City</strong> Management,<br />
<strong>City</strong> Attorney, Human Resources, Finance, Information Technology, Community<br />
& Recreation Services, Public Works – Maintenance Services, Public Works-<br />
Engineering Services, Planning & Economic Development, Building & Neighborhood<br />
Services and Police Services.<br />
3.2 Program Groups<br />
Budget amounts which are assigned to a specific organizational function within a department<br />
directed to attaining specific purposes or objectives.<br />
3.21 Examples: Programs covered by this section include such functions as <strong>City</strong> Council,<br />
Recruitment and Selection, Network Systems, Finance Administration, Sports and<br />
Events, Traffic Operations, Design, Police Operations, Planning, Housing, etc.<br />
3.3 Projects<br />
Budget amounts assigned to projects approved by the <strong>City</strong> Council. Projects are classified<br />
into two general categories; Capital Projects and Other Projects. Capital Projects are projects<br />
related to <strong>City</strong> infrastructure assets. Other Projects are projects not related to <strong>City</strong> infrastructure<br />
assets.<br />
3.31 Capital Projects consist <strong>of</strong> Specific Projects and Master Projects.<br />
3.311 Specific Projects are one-time projects. An example is the construction <strong>of</strong> a new<br />
police facility which becomes a <strong>City</strong> asset.<br />
32
POLICY & PROCEDURE NO. 31<br />
3.312 Master Projects are related to programs that receive annual funding for a particular<br />
purpose, such as street rehabilitation or building maintenance. The programs<br />
are implemented through specific projects. The schedule for implementing specific<br />
projects is based on the prioritization criteria established by the appropriate<br />
department. An example <strong>of</strong> a Master Project is “Arterial/collector Street Overlay/Pavement<br />
Management System”. An example <strong>of</strong> a specific project is “Willow<br />
Pass Pavement Rehabilitation.<br />
3.32 Other Projects are not related to infrastructure asset. An example would be the California<br />
Symphony production.<br />
3.4 Group Appropriation and Accounts<br />
Budgeted amounts within programs which are categorized by nature or purpose within four<br />
groups:<br />
Personnel Services (Wages & Benefits)<br />
Materials and Supplies<br />
Fixed Expenses<br />
Capital Outlay<br />
3.41 Examples: Line item accounts addressed in this section include but are not limited to<br />
Overtime, Office Supplies, Meetings and Conferences, Small Equipment, etc.<br />
3.5 Appropriations <strong>of</strong> Money Received for Specific Purposes<br />
Money received for specific purposes requires the establishment <strong>of</strong> an appropriation and<br />
revenue account <strong>of</strong> equal value. Purposes include a study for a possible or pending improvement<br />
or to construct a possible or pending improvement or other designated purposes.<br />
3.51 Example: A developer payment to fund a traffic study.<br />
4. PROCEDURE – LEVEL AND TYPES OF BUDGET TRANSFERS<br />
4.1 General<br />
4.11 All transfers <strong>of</strong> appropriations are to be processed through the Finance Director for<br />
certification as to availability <strong>of</strong> the budget appropriation, for transfer and account correctness<br />
and to ensure that the new use <strong>of</strong> funds remains consistent with underlying<br />
authority.<br />
4.12 Department Heads shall ensure that Performance Based Budgeting (PBB) objectives<br />
are maintained on all transfers <strong>of</strong> appropriations.<br />
4.13 All transfers <strong>of</strong> appropriations affecting Personnel Services type accounts require the<br />
approval <strong>of</strong> the Human Resources Director.<br />
4.14 The <strong>City</strong> Manager may add requirements that may abrogate any or all <strong>of</strong> the authority<br />
delegated to Department Heads under this policy.<br />
33
POLICY & PROCEDURE NO. 31<br />
4.2 Program Group Appropriation Transfers (Accounts)<br />
4.21 These transfers are between the groups defined in Paragraph 3.2. In addition to the<br />
requirements stated in Section 4.1, the following approvals are required:<br />
4.22 <strong>City</strong> Council approval is not required for program group transfers.<br />
4.23 Program group transfers <strong>of</strong> Personnel services type accounts within the same fund<br />
and department require Department Head and <strong>City</strong> Manager approval.<br />
4.24 Program group transfers <strong>of</strong> Personnel services type accounts between funds within<br />
the same department require Department Head and <strong>City</strong> Manager approval.<br />
4.25 Program group transfers <strong>of</strong> Materials and Supplies type accounts within the same<br />
fund and department require Department Head approval.<br />
4.26 Program group transfers <strong>of</strong> Materials and Supplies type accounts between funds<br />
within the same department require Department Head and <strong>City</strong> Manager approval.<br />
4.27 Department Heads may approve requests within their department’s budget to convert<br />
operating line item accounts into project accounts provided no addition is made to the<br />
original appropriation approved by the <strong>City</strong> Council and no changes are made to the<br />
funding source or purpose for which the appropriation was originally made.<br />
4.28 Department Heads may spend more than is budgeted in a line item account provided<br />
the budget for the entire program is not exceeded in total.<br />
4.29 Department Heads may substitute the purchase <strong>of</strong> a capital equipment item for another<br />
originally approved during the budget process provided the cost <strong>of</strong> the substitute<br />
item is less than or equal to the amount approved by the <strong>City</strong> Council. Items<br />
greater than that amount require the approval <strong>of</strong> the <strong>City</strong> Manager.<br />
4.3 Department Appropriation Transfers<br />
These transfers are between the departments defined in Paragraph 3.1. In addition to the requirements<br />
stated in Section 4.1, the following approvals are required:<br />
4.31 Department Heads may transfer budget appropriations between departments. The<br />
approval <strong>of</strong> all Department Heads involved in the transfer is required.<br />
4.32 Department budget appropriation transfers between departments require the approval<br />
<strong>of</strong> the <strong>City</strong> Manager.<br />
4.4 Appropriations <strong>of</strong> Money Received for Specific Purpose<br />
These <strong>of</strong>fsetting budget adjustments are defined in Paragraph 3.5<br />
4.41 Offsetting budget appropriation adjustments required as a result <strong>of</strong> the receipt <strong>of</strong><br />
money for specific purposes require Department Head approval.<br />
4.42 Budget appropriation adjustments greater than the money received for specific purposes<br />
require <strong>City</strong> Manager and <strong>City</strong> Council approval.<br />
34
POLICY & PROCEDURE NO. 31<br />
4.5 Project Appropriation Transfers<br />
Paragraph 3.3 describes these transfers.<br />
4.51 All Project appropriation transfers require <strong>City</strong> Manager approval.<br />
4.52 Additional appropriations <strong>of</strong> $20,000 or more for projects require <strong>City</strong> Council approval.<br />
4.53 Transfer <strong>of</strong> savings on a project <strong>of</strong> $20,000 or more to another project requires <strong>City</strong><br />
Council approval.<br />
4.54 Any unspent funds on a completed Project will be returned to reserves at year-end.<br />
4.6 Special Revenue Appropriation<br />
4.61 Budget appropriations based on funds provided by donations, contributions or special<br />
grants.<br />
4.62 The special revenue appropriation is limited to the exact amount received or to be received.<br />
4.63 The <strong>City</strong> Manager must approve special revenue budget appropriations.<br />
4.64 Budget appropriations engendered by grants, donations or contributions require <strong>City</strong><br />
Council approval.<br />
35
POLICY & PROCEDURE<br />
BUDGET AND FISCAL POLICIES<br />
CITY OF CONCORD<br />
Number:<br />
Authority:<br />
Effective:<br />
Revised:<br />
Reviewed:<br />
Initiating Dept.:<br />
129<br />
Res. 06-47<br />
6/23/98<br />
6/27/06<br />
2006<br />
CM<br />
1. PURPOSE<br />
To guide <strong>City</strong> budget decisions toward maintaining long-term financial stability, to ensure that basic<br />
<strong>City</strong> services are delivered, and to protect past and future investments in the <strong>City</strong>’s infrastructure<br />
and facilities.<br />
2. ADOPTION AND REVIEW<br />
A set <strong>of</strong> policies were originally adopted in 1995 with the initiation <strong>of</strong> long-term financial planning<br />
for the <strong>City</strong>. The policies set a course to achieve financial stability. With implementation <strong>of</strong> the<br />
original policies, financial stability for the <strong>City</strong> has been attained and this document revised to<br />
establish a more comprehensive approach to budget and fiscal policies to ensure that the <strong>City</strong><br />
maintains its financial stability long into the future. Each year at the time the <strong>City</strong> budget is<br />
considered, the <strong>City</strong> Council shall review the Budget and Fiscal Policies and conduct a review <strong>of</strong><br />
the proposed budget for consistency with these Budget and Fiscal Policies.<br />
3. POLICIES<br />
3.1 10-Year Financial Planning<br />
3.11 <strong>City</strong> Manager will present a budget (Capital and Operating) that is balanced over the<br />
10-year planning period for all funds.<br />
3.12 Utilize the 10-Year Plan as the basis for making long-range financial planning<br />
decisions.<br />
3.13 Maintain contingency reserves equal to 10% <strong>of</strong> designated operating expenses for<br />
the General Fund and the Enterprise funds.<br />
3.14 Maintain a capital and operational fund to address unforecasted needs.<br />
3.15 Develop and maintain a revenue monitoring and forecasting system to assist in trend<br />
analysis and revenue forecasting for the 10-year planning period.<br />
3.16 Document all assumptions for revenue and expenditure forecasts each year.<br />
3.17 Establish a financial plan for the Redevelopment Agency that ensures a positive cash<br />
balance at the end <strong>of</strong> the life <strong>of</strong> the Agency.<br />
3.18 Seek reimbursement for State and Federal mandated programs and projects.<br />
3.19 Conduct periodic audits for sales tax (point-<strong>of</strong>-sale), franchises and concessions, and<br />
transient occupancy tax (TOT).<br />
3.110 Carefully review and discourage grants that may expand or add services without<br />
reliable replacement revenue after the grant period ends.<br />
3.111 Maintain an aggressive collection system for all accounts receivable.<br />
3.112 Be alert to potential development <strong>of</strong> new revenue sources.<br />
36
POLICY & PROCEDURE NO. 129<br />
3.2 Performance-Based Budgeting (PBB)<br />
3.21 Establish the PBB as the <strong>City</strong> Council’s service delivery policy document.<br />
3.22 Establish a PBB that measures service levels, efficiency and effectiveness.<br />
3.23 Follow the principles <strong>of</strong> outcome management in utilizing the PBB.<br />
3.24 Ensure all costs (direct and indirect) are charged against each program budget.<br />
3.25 Measure work efficiency and effectiveness to ensure an optimal allocation <strong>of</strong> human<br />
and fiscal resources to budget approved services and programs.<br />
3.26 Ensure all operating programs have measurable performance objectives which<br />
identify the service and level <strong>of</strong> service, and the resources required to accomplish the<br />
objectives.<br />
3.27 Complete year-end reports and audits to measure the work accomplished against<br />
what was planned at the beginning <strong>of</strong> the fiscal year and evaluate future service<br />
levels.<br />
3.3 Capital Improvement Program (CIP)<br />
3.31 Develop a 10-year plan for CIP.<br />
3.32 Seek grants for needed capital projects which can <strong>of</strong>fset use <strong>of</strong> other <strong>City</strong> funds,<br />
which can then be utilized for other needed projects.<br />
3.33 Maintain capital improvements to the level required to adequately protect the <strong>City</strong>’s<br />
capital investment and to minimize future maintenance and replacement costs.<br />
3.34 Include resources required to maintain and operate new capital improvements<br />
commencing the year the project is completed and continuing through the balance <strong>of</strong><br />
the 10-Year Plan.<br />
3.35 Ensure capital budgets contain all costs to complete the project (design, right-<strong>of</strong>-way,<br />
construction, inspection, contract management, contingency).<br />
3.36 Ensure all proposed projects in the 10-Year Plan have a viable source <strong>of</strong> funding for<br />
both construction and maintenance.<br />
3.37 Fund projects proposed for Enterprise programs by revenues derived from user fees.<br />
3.37 Encourage pay-as-you-go financing <strong>of</strong> capital improvements where feasible.<br />
3.4 Internal Service Funds<br />
3.41 Maintain Internal Service Funds for Workers’ Compensation, Risk Management,<br />
Storm Water, Fleet Maintenance and Replacement, Technology Maintenance and<br />
Replacement (including all computer/s<strong>of</strong>tware and communications equipment),<br />
Building Maintenance and Replacement and Miscellaneous/Office Equipment<br />
Maintenance and Replacement.<br />
3.42 Maintain a 10-year financial plan for all Internal Service Funds.<br />
3.43 Include cost <strong>of</strong> operation, maintenance and replacement in the 10-year financial<br />
plans.<br />
37
POLICY & PROCEDURE NO. 129<br />
3.44 All costs (operation, maintenance and replacement) associated with each Internal<br />
Service Fund will be charged to the appropriate user department.<br />
3.45 Maintain equipment and facilities to the level required to adequately protect the <strong>City</strong>’s<br />
investment and to minimize future maintenance and replacement costs.<br />
3.5 Enterprise Funds<br />
3.51 Maintain a 10-year financial plan for all Enterprise Funds.<br />
3.52 All costs associated with providing administrative support (finance, personnel, legal,<br />
etc.) shall be charged to the appropriate Enterprise Fund.<br />
3.53 Periodically review market driven enterprise operations for partnerships, sponsorships<br />
and other mutually beneficial business development opportunities.<br />
3.54 The cost <strong>of</strong> each enterprise shall be completely <strong>of</strong>fset by user charges and fees<br />
derived from the enterprise activity. Costs shall include operating, maintenance,<br />
capital, debt service, contingency and administrative costs.<br />
3.55 Periodically review and adjust user fees in order to avoid large one-time fee<br />
increases. For Golf the review should include the market established for similar<br />
services.<br />
3.56 Periodically review concession agreements, lease agreements and all other revenue<br />
generating agreements in order to determine if the <strong>City</strong> is receiving a return that<br />
reflects the market for similar agreements.<br />
3.6 Investment Policies/Financial Practices<br />
3.61 Maintain an Investment Policy consistent with established regulations and guidelines.<br />
Said policy is to be reviewed each year by the <strong>City</strong> Council.<br />
3.62 The Investment Policy shall address safety, liquidity and yield.<br />
3.63 Limit use <strong>of</strong> debt to minimize future commitment <strong>of</strong> the fiscal resources <strong>of</strong> the <strong>City</strong> and<br />
its taxpayers.<br />
3.64 Debt payment should not exceed the anticipated useful life <strong>of</strong> an improvement, and in<br />
no case should it exceed 30 years.<br />
3.65 Maintain accounting systems and financial management practices in accordance with<br />
generally accepted accounting principles, so as to result in an unqualified opinion<br />
from the <strong>City</strong>’s independent auditor.<br />
3.7 Review and Adopt a Performance Based Budget<br />
3.71 The budget will be adopted as shown in the operating and Performance Based<br />
Budget document annually.<br />
3.72 Full review <strong>of</strong> revenue and expenditures assumptions and preparation <strong>of</strong> the Capital<br />
Improvement Program and Ten-Year Plans on all funds will be done annually.<br />
3.73 The <strong>City</strong> Council will hold public hearings and formally approve a budget for the <strong>City</strong><br />
annually.<br />
38
POLICY & PROCEDURE NO. 129<br />
3.8 Reserve Funds<br />
3.81 An aggregate reserve, in addition to the 10% operating contingency, will be<br />
established and maintained at a level not less than equal to 20% <strong>of</strong> the General Fund<br />
total operating budget. The reserve shall be determined to be fully funded when 20%<br />
<strong>of</strong> the General Fund operating budget can be maintained as the reserve projected<br />
balance at the end <strong>of</strong> each fiscal year and funded within the approved General Fund<br />
Ten-Year Plan.<br />
3.82 Reserve funds will have four sub-accounts: the Economic Contingency Reserve, the<br />
Unforecasted Reserve, the Capital/Maintenance Reserve, and the Benefits Reserve.<br />
3.83 Reserve funds will be built and replenished as necessary to maintain full funding <strong>of</strong><br />
the minimum reserve through regular annual contributions at least equal to 4% <strong>of</strong> the<br />
General Fund operating budget. The <strong>City</strong> Council will annually review and approve<br />
the distribution <strong>of</strong> reserve contributions among the four sub-accounts as part <strong>of</strong> the<br />
budget process.<br />
3.84 The <strong>City</strong> Council may act to override the individual purposes <strong>of</strong> some or all <strong>of</strong> the four<br />
sub-account reserves in the face <strong>of</strong> a major economic crisis <strong>of</strong> calamitous dimensions<br />
and draw on reserves to maintain the <strong>City</strong>’s fiscal stability. In such a case the Council<br />
will take formal action determining that multiple adverse factors exist that warrant this<br />
exceptional use <strong>of</strong> one or more <strong>of</strong> the sub-account reserve funds.<br />
3.85 The Economic Contingency Reserve is to be made available by Council appropriation<br />
to meet unanticipated needs caused by State or Federal redirection <strong>of</strong> <strong>City</strong> resources,<br />
general economic downturns, or reductions in operating revenues.<br />
3.86 The Unforecasted Reserve is to be made available by Council appropriation to<br />
continue services if State, Federal or other grant funding sources are lost, and to<br />
<strong>of</strong>fset the costs <strong>of</strong> unanticipated, unfunded governmental mandates.<br />
3.87 The Capital/Maintenance Reserve is to be made available by Council appropriation to<br />
meet unanticipated, unscheduled and or unprogrammed capital and maintenance<br />
needs <strong>of</strong> <strong>City</strong> infrastructure and facilities. This reserve is intended to be used for<br />
major capital repair where facility failure, unexpected hazards, or destruction <strong>of</strong> <strong>City</strong><br />
property has occurred and where repair or replacement is not planned within the<br />
established capital, operations or internal replacement funds. The threshold for work<br />
meeting this intent will be the same dollar amount as the threshold set for inclusion <strong>of</strong><br />
projects in the <strong>City</strong> Capital Improvement Program.<br />
In exceptional circumstances and where adequate funding sources are not available,<br />
the <strong>City</strong> Council may consider appropriation <strong>of</strong> Capital/Maintenance Reserve funds<br />
for a new capital improvement. When making such an appropriation, the <strong>City</strong> Council<br />
will first determine that the maintenance and operating costs <strong>of</strong> the new project can<br />
be fully supported in the Ten-Year Plan in accordance with Policy 3.33.<br />
3.88 The Benefits Reserve Fund is available to support unplanned costs and obligations <strong>of</strong><br />
existing employment benefits. The Benefits Reserve is not intended for use to<br />
enhance benefits negotiated through the collective bargaining process that require<br />
<strong>City</strong> Council approval.<br />
39
Article XIII B <strong>of</strong> the State Constitution and subsequent implementation legislation imposes that the<br />
<strong>City</strong> <strong>of</strong> <strong>Concord</strong> limit each fiscal year's appropriations <strong>of</strong> the proceeds <strong>of</strong> taxes to the amount <strong>of</strong><br />
such appropriations in Fiscal Year 1978-79 as adjusted per California Per Capita Income and the<br />
County <strong>of</strong> Contra Costa's annual population growth. Government Code Section 37200 requires that<br />
the appropriation limit and the total appropriations subject to limitation be published in the annual<br />
budget. The <strong>City</strong>'s limitation is calculated every year and it is established by a resolution <strong>of</strong> the<br />
<strong>City</strong> Council as a part <strong>of</strong> the Annual Operating Budget. Resolution No. 07-36 was approved on<br />
June 19, 2007 establishing the <strong>City</strong> <strong>of</strong> <strong>Concord</strong>'s appropriation limit.<br />
Accordingly:<br />
Annual Appropriation Limit<br />
<strong>City</strong> <strong>of</strong> <strong>Concord</strong> Spending Limit Calculation Fiscal Year 2007-2008<br />
Appropriations subject to limit<br />
Fiscal Year 2007-2008 Revenues (all funds) $ 88,515,915<br />
Less: Non proceeds <strong>of</strong> tax (25,489,109)<br />
Less: Exclusions (3,075,507)<br />
Plus User Fees in excess <strong>of</strong> costs -<br />
Total appropriations subject to limit $ 59,951,299<br />
Appropriation limit<br />
Fiscal Year 2006-2007 appropriation limit $ 113,861,254<br />
A = Cost <strong>of</strong> living adjustment - CPI<br />
(Based on change in California per capita income)<br />
1.0442<br />
B = Population adjustment<br />
(Based on Contra Costa County's population growth change)<br />
1.0113<br />
Change Factor = (A multiplied by B) 1.05599946<br />
Increase in appropriation limit 6,376,169<br />
Fiscal Year 2007-2008 appropriation limit $ 120,237,423<br />
Remaining appropriation capacity (deficit) $ 60,286,124<br />
Available capacity as a percent <strong>of</strong> appropriation limit 50.14%<br />
Computation <strong>of</strong> Legal Debt Margin<br />
June 30, 2007<br />
(amounts expressed in thousands)<br />
Assessed Valuation:<br />
Assessed Value: $ 12,581,573<br />
Add: Exempt real property 556,508<br />
Total Assessed Value $ 13,138,081<br />
Debt Applicable to Limitation<br />
Total Bonded Debt $<br />
-<br />
Less amount available for repayment <strong>of</strong> General Obligation Debt -<br />
Total Debt Applicable to Limitation $<br />
-<br />
Legal Debt Margin:<br />
Debt Limitation - 15% <strong>of</strong> total assessed value $ 1,970,712<br />
Less total debt applicable to limitation -<br />
Legal Debt Margin $ 1,970,712
<strong>City</strong> <strong>of</strong> <strong>Concord</strong><br />
General Fund<br />
Ten Year Projection<br />
For the Year Ending June 30, 2008<br />
2007-08 2008-09 2009-10 2010-11 2011-12 2012-13 2013-14 2014-15 2015-16 2016-17<br />
Fund Balance 7/01 $ 9,913,563 $ 8,361,883 $ 8,043,293 $ 8,505,552 $ 8,811,740 $ 9,110,430 $ 9,448,685 $ 9,771,305 $ 10,068,709 $ 10,440,622<br />
Add:<br />
Revenues $ 76,777,312 $ 79,759,818 $ 82,717,028 $ 85,455,671 $ 88,605,702 $ 91,706,718 $ 95,055,804 $ 98,299,727 $ 102,246,516 $ 106,011,180<br />
Less:<br />
Operating Expenditures $ 77,397,379 $ 79,256,085 $ 81,546,827 $ 84,489,143 $ 87,644,202 $ 90,703,109 $ 93,865,209 $ 97,131,649 $ 101,001,148 $ 104,742,013<br />
Revenue Over(Under)<br />
Expenditures $ (620,067) $ 503,733 $ 1,170,201 $ 966,528 $ 961,500 $ 1,003,609 $ 1,190,595 $ 1,168,078 $ 1,245,368 $ 1,269,167<br />
10% Contingency Reserve $ 7,739,738 $ 7,925,609 $ 8,154,683 $ 8,448,914 $ 8,764,420 $ 9,070,311 $ 9,386,521 $ 9,713,165 $ 10,100,115 $ 10,474,201<br />
Less:<br />
Capital Improvement Projects (CIP) $ 731,613 $ 622,323 $ 507,942 $ 460,340 $ 462,810 $ 465,354 $ 467,975 $ 470,674 $ 473,455 $ 476,319<br />
Other Financing Sources:<br />
Intra-fund Transfers In $ - $ - $ - $ - $ - $ - $ - $ - $ - $<br />
-<br />
Intra-fund Transfers Out 200,000 200,000 200,000 200,000 200,000 200,000 400,000 400,000 400,000 400,000<br />
Total Intra-fund Transfers $ (200,000) $ (200,000) $ (200,000) $ (200,000) $ (200,000) $ (200,000) $ (400,000) $ (400,000) $ (400,000) $ (400,000)<br />
Fund Balance 6/30 $ 622,145 $ 117,684 $ 350,869 $ 362,826 $ 346,010 $ 378,374 $ 384,784 $ 355,544 $ 340,507 $ 359,269<br />
Notes:<br />
Meets all standards contained in the Budget and Fiscal Policies adopted by the Council. This policy can be found on page 36.<br />
Revenues:<br />
Major revenue projections based on FY2006-07 estimated and inflated 3% to 4% based on historical trends.<br />
Fee based revenues in Building, Engineering, Planning and Police increased 3% over the planning period.<br />
Operating Expenditures:<br />
Salaries and benefits have been budgeted per current labor agreements adjusted for step increases and assuming a full staffing level.<br />
FY2007-08 includes 3 positions that will be eliminated in subsequent years.<br />
Employee benefits expenses for medical insurance and retirement reflect recent higher than CPI increases.<br />
Operating and maintenance costs for new capital projects are included throughout this plan. Details <strong>of</strong> those costs are located in the Capital Projects section <strong>of</strong> this budget document..<br />
Employee post-retirement health expenses includes adjustment for 25-Year amortization <strong>of</strong> accrued OPEB liability.<br />
Non-labor operating expenditures for FY 2008 and the remainder <strong>of</strong> the 10-Year planning period, depending on the category, include increases between 2 and 3% for inflation.<br />
Operational programs include internal service fund charges for vehicles, computer and <strong>of</strong>fice equipment, buildings, workers' compensation and liability.<br />
Intrafund Transfers: Includes contributions to unforecasted and maintenance and capital reserves.
87<br />
<strong>City</strong> <strong>of</strong> <strong>Concord</strong><br />
General Fund Operating & Capital Expenditures by Department<br />
Total Operating and Capital Expeditures<br />
$78,328,992<br />
Police<br />
50.9%<br />
Public Works<br />
12.4%<br />
June 30, 2008<br />
<strong>City</strong> Attorney<br />
2.0% <strong>City</strong> Management<br />
4.5%<br />
Planning & Economic<br />
Development<br />
2.6%<br />
Building, Engineering &<br />
Neighborhood Services<br />
7.9%<br />
Finance<br />
7.3%<br />
Human Resources<br />
2.4%<br />
Community &<br />
Recreation Services<br />
10.0%
<strong>City</strong> <strong>of</strong> <strong>Concord</strong><br />
General Fund<br />
Summary <strong>of</strong> Program Expenditures<br />
For Year Ending June 30, 2008<br />
Salaries Operating Fixed Other Totals<br />
& Benefits Expenditures Charges Financing<br />
Uses<br />
BUILDING, ENGINEERING & NEIGHBORHOOD SERVICES<br />
Administration $ 361,364 $ 92,594 $ 174,395<br />
$ 628,353<br />
Engineering Services 1,063,225 74,483 452,977<br />
1,590,685<br />
Building 1,499,829 553,198 394,132<br />
2,447,159<br />
Multi-Family Inspection Program 337,456 10,584 56,094<br />
404,134<br />
Neighborhood Preservation 829,534 51,430 232,552<br />
- 1,113,516<br />
Total Building, Engineering & N.S. $ 4,091,408 $ 782,289 $ 1,310,150 $ - $ 6,183,847<br />
CITY ATTORNEY $ 1,070,997 $ 392,872 $ 118,579 $ - $ 1,582,448<br />
CITY MANAGEMENT<br />
<strong>City</strong> Council $ 190,782 $ 105,255 $ 78,970<br />
$ 375,007<br />
<strong>City</strong> Management 1,053,915 196,440 81,853<br />
1,332,208<br />
Administrative Services 863,045 210,812 571,938<br />
1,645,795<br />
Franchise Management 58,185 32,591 1,800<br />
- 92,576<br />
Total <strong>City</strong> Management $ 2,165,927 $ 545,098 $ 734,561 $ - $ 3,445,586<br />
COMMUNITY & RECREATION SERVICES<br />
Administration $ 280,517 $ 177,075 $ 180,188<br />
$ 637,780<br />
Camp <strong>Concord</strong> 283,262 225,978 179,310<br />
688,550<br />
Facility Operations and Programs 1,551,562 774,524 934,553 $ 99,713 3,360,352<br />
Sports and Events 131,233 210,894 15,721<br />
357,848<br />
Youth Services 454,050 59,079 720,248<br />
1,233,377<br />
Senior & Special Recreation Services 454,670 198,240 299,988<br />
952,898<br />
Community Services - 174,044<br />
-<br />
- 174,044<br />
Total Community & Recreation $ 3,155,294 $ 1,819,834 $ 2,330,008 $ 99,713 $ 7,404,849<br />
continued
<strong>City</strong> <strong>of</strong> <strong>Concord</strong><br />
General Fund<br />
Summary <strong>of</strong> Program Expenditures<br />
For Year Ending June 30, 2008<br />
Salaries Operating Fixed Other Totals<br />
& Benefits Expenditures Charges Financing<br />
Uses<br />
FINANCE<br />
Administration $ 301,129 $ 7,996 $ 92,208<br />
$ 401,333<br />
Financial Analysis & Reporting 628,579 122,694 151,715<br />
902,988<br />
Disbursements 539,096 8,129 195,011<br />
742,236<br />
Budget & Financial Planning 342,548 9,464 61,506<br />
413,518<br />
Purchasing & Materials Management 385,537 17,507 243,366<br />
646,410<br />
<strong>City</strong> Treasury 257,461 19,214 103,631<br />
- 380,306<br />
Revenue Generation 340,796 14,746 105,812<br />
- 461,354<br />
Total Department Expenditures $ 2,795,146 $ 199,750 $ 953,249 $ - $ 3,948,145<br />
FINANCE - NON-DEPARTMENTAL<br />
Miscellaneous Payments $ - $ 1,596,951 $ -<br />
$ 1,596,951<br />
Capital Projects -<br />
-<br />
- $ 731,613 731,613<br />
Reserve Funds -<br />
-<br />
- 200,000 200,000<br />
Total Finance $ 2,795,146 $ 1,796,701 $ 953,249 $ 931,613 $ 6,476,709<br />
HUMAN RESOURCES<br />
Employee Relations $ 441,906 $ 156,785 $ 78,667<br />
$ 677,358<br />
Recruitment and Selection 144,835 37,292 31,807<br />
213,934<br />
Risk Management 63,469 167,570 18,603<br />
249,642<br />
Benefit Administration 240,001 53,311 36,607<br />
329,919<br />
Organizational Training and Development 75,983 53,697 11,402<br />
141,082<br />
Classification and Compensation 193,537 10,716 22,804<br />
- 227,057<br />
Total Human Resources $ 1,159,731 $ 479,371 $ 199,890 $ - $ 1,838,992<br />
continued
<strong>City</strong> <strong>of</strong> <strong>Concord</strong><br />
General Fund<br />
Summary <strong>of</strong> Program Expenditures<br />
For Year Ending June 30, 2008<br />
Salaries Operating Fixed Other Totals<br />
& Benefits Expenditures Charges Financing<br />
Uses<br />
PLANNING AND ECONOMIC DEVELOPMENT<br />
Administration $ 160,216 $ 5,556 $ 40,631<br />
$ 206,403<br />
Planning 1,470,869 47,840 315,359<br />
1,834,068<br />
Economic Development & Housing -<br />
-<br />
-<br />
-<br />
-<br />
Total Planning and Economic Development $ 1,631,085 $ 53,396 $ 355,990 $ - $ 2,040,471<br />
POLICE DEPARTMENT<br />
Office <strong>of</strong> the Chief <strong>of</strong> Police $ 702,155 $ 62,914 $ 85,835<br />
$ 850,904<br />
Administrative Services 4,568,273 1,162,622 1,084,022<br />
6,814,917<br />
Field Operations 19,227,992 1,054,350 2,368,673<br />
22,651,015<br />
Support Operations 7,706,394 618,790 1,175,518<br />
- 9,500,702<br />
Total Police Department $ 32,204,814 $ 2,898,676 $ 4,714,048 $ - $ 39,817,538<br />
PUBLIC WORKS<br />
Administration $ 511,620 $ 44,213 $ 87,191<br />
$ 643,024<br />
Transportation 1,343,852 350,043 364,957<br />
2,058,852<br />
Parks Services, Street Trees and Medians 4,017,122 1,590,351 998,068<br />
6,605,541<br />
Graffiti Removal 181,220 20,175 29,740<br />
- 231,135<br />
Total Public Works $ 6,053,814 $ 2,004,782 $ 1,479,956 $ - $ 9,538,552<br />
GENERAL FUND TOTALS $ 54,328,216 $ 10,773,019 $ 12,196,431 $ 1,031,326 $<br />
78,328,992
POLICE<br />
DEPARTMENT<br />
52%<br />
PLANNING AND<br />
ECONOMIC<br />
DEVELOPMENT<br />
3%<br />
HUMAN RESOURCES<br />
2%<br />
FINANCE<br />
7%<br />
COMMUNITY &<br />
RECREATION<br />
SERVICES<br />
9%<br />
<strong>City</strong> <strong>of</strong> <strong>Concord</strong><br />
General Fund<br />
Comparision <strong>of</strong> Expenditures by Department<br />
For Year Ending June 30, 2008<br />
PUBLIC WORKS<br />
12%<br />
CAPITAL PROJECTS<br />
1%<br />
BUILDING,<br />
ENGINEERING &<br />
NEIGHBORHOOD<br />
SERVICES<br />
8%<br />
CITY ATTORNEY<br />
2%<br />
CITY MANAGEMENT<br />
4%<br />
BUILDING, ENGINEERING & NEIGHBORHOOD SERVICES $ 6,183,847<br />
CITY ATTORNEY 1,582,448<br />
CITY MANAGEMENT 3,445,586<br />
COMMUNITY & RECREATION SERVICES 7,404,849<br />
FINANCE 5,745,096<br />
HUMAN RESOURCES 1,838,992<br />
PLANNING AND ECONOMIC DEVELOPMENT 2,040,471<br />
POLICE DEPARTMENT 39,817,538<br />
PUBLIC WORKS 9,538,552<br />
CAPITAL PROJECTS 731,613<br />
GENERAL FUND TOTALS $ 78,328,992
<strong>City</strong> <strong>of</strong> <strong>Concord</strong><br />
General Fund<br />
Expenditures by Program<br />
For Year Ending June 30, 2008<br />
Actual Actual Actual Budget Adopted Projected Projected Projected Projected Projected Projected Projected Projected Projected<br />
2003-04 2004-05 2005-06 2006-07 2007-08 2008-09 2009-10 2010-11 2011-12 2012-13 2013-14 2014-15 2015-16 2016-17<br />
BUILDING, ENGINEERING & NEIGHBORHOOD SERVICES<br />
Administration $ 141,228 $ 173,268 $ 446,322 $ 484,644 $ 628,353 $ 648,568 $ 666,257 $ 687,309 $ 709,147 $ 729,994 $ 753,404 $ 777,620 $ 802,166 $ 827,533<br />
Engineering Services 1,009,285 1,130,399 1,278,302 974,190 1,590,685 1,641,793 1,761,775 1,837,111 1,899,699 1,908,717 1,973,979 2,040,864 2,121,275 2,203,658<br />
Building 1,558,671 1,589,439 1,806,079 1,891,215 2,447,159 2,517,985 2,486,572 2,562,175 2,640,456 2,714,581 2,798,233 2,884,804 2,974,234 3,066,850<br />
Multi-Family Inspection Program 293,493 265,522 228,630 324,866 404,134 418,409 430,662 445,327 460,502 474,871 491,072 507,826 525,154 543,089<br />
Neighborhood Preservation 527,047 892,207 829,394 894,301 1,113,516 1,153,135 1,186,807 1,227,295 1,269,206 1,308,824 1,353,605 1,399,936 1,447,789 1,497,348<br />
Total Building, Engineering & N.S. $ 3,529,724 $ 4,050,835 $ 4,588,727 $ 4,569,216 $ 6,183,847 $ 6,379,890 $ 6,532,073 $ 6,759,217 $ 6,979,010 $ 7,136,987 $ 7,370,293 $ 7,611,050 $ 7,870,618 $ 8,138,478<br />
BUILDING & NEIGHBORHOOD SERVICES<br />
Administration $ 208,212 $ 284,473 $ 102,597 $ - $ - $ - $ - $ - $ - $ - $ - $ - $ - $<br />
-<br />
Total Building & Neighborhood Serv. $ 208,212 $ 284,473 $ 102,597 $ - $ - $ - $ - $ - $ - $ - $ - $ - $ - $<br />
-<br />
CITY ATTORNEY $ 2,009,199 $ 1,104,394 $ 1,483,487 $ 1,554,004 $ 1,582,448 $ 1,635,904 $ 1,681,786 $ 1,738,043 $ 1,796,221 $ 1,850,468 $ 1,912,462 $ 1,976,529 $ 2,042,721 $ 2,111,206<br />
CITY MANAGEMENT<br />
<strong>City</strong> Council $ 279,449 $ 298,266 $ 300,809 $ 357,247 $ 375,007 $ 440,011 $ 451,350 $ 464,615 $ 478,306 $ 491,846 $ 506,339 $ 521,269 $ 537,617 $ 553,274<br />
<strong>City</strong> Management 1,212,125 1,361,494 1,241,766 1,284,528 1,332,208 1,357,808 1,416,770 1,443,193 1,515,010 1,537,786 1,614,261 1,644,794 1,726,352 1,759,237<br />
Administrative Services 1,115,789 1,243,974 1,185,143 1,387,644 1,645,795 1,807,988 1,751,831 1,921,927 1,868,866 2,045,775 1,989,790 2,182,007 2,123,056 2,327,493<br />
Franchise Management 79,369 97,084 89,489 96,126 92,576 95,684 98,381 101,649 105,028 108,198 111,803 115,523 119,362 123,333<br />
Total <strong>City</strong> Management $ 2,686,732 $ 3,000,818 $ 2,817,207 $ 3,125,545 $ 3,445,586 $ 3,701,491 $ 3,718,332 $ 3,931,384 $ 3,967,210 $ 4,183,605 $ 4,222,193 $ 4,463,593 $ 4,506,387 $ 4,763,337<br />
COMMUNITY & RECREATION SERVICES<br />
Administration $ 751,766 $ 996,122 $ 767,990 $ 699,936 $ 637,780 $ 658,137 $ 676,465 $ 697,500 $ 719,267 $ 740,422 $ 763,683 $ 787,715 $ 812,249 $ 837,583<br />
Camp <strong>Concord</strong> 419,573 489,746 474,339 528,636 688,550 709,644 729,637 751,516 774,078 796,484 820,436 845,133 870,603 896,866<br />
Facility Operations and Programs 1,640,486 2,155,503 2,670,062 2,748,316 3,360,352 3,462,890 3,560,062 3,666,579 3,780,948 3,791,153 3,909,410 4,031,405 4,157,241 4,287,118<br />
Sports and Events 299,476 310,467 327,797 346,563 357,848 369,259 379,942 391,799 404,041 416,112 429,126 442,557 456,418 470,726<br />
Youth Services 1,030,441 1,094,017 738,115 775,978 1,233,377 1,272,803 1,310,616 1,351,781 1,394,261 1,436,642 1,481,821 1,528,427 1,576,513 1,626,154<br />
Senior & Special Recreation Services 559,163 639,431 674,574 795,388 952,898 984,134 1,013,310 1,045,632 1,079,004 1,111,992 1,147,518 1,184,197 1,222,058 1,261,162<br />
Community Services 234,275 253,115 161,899 168,975 174,044 179,265 184,643 190,182 195,887 201,764 207,817 214,052 220,474 227,088<br />
Total Community & Recreation $ 4,935,180 $ 5,938,401 $ 5,814,776 $ 6,063,792 $ 7,404,849 $ 7,636,132 $ 7,854,675 $ 8,094,989 $ 8,347,486 $ 8,494,569 $ 8,759,811 $ 9,033,486 $ 9,315,556 $ 9,606,697<br />
FINANCE<br />
Administration $ 254,252 $ 326,740 $ 274,136 $ 349,942 $ 401,333 $ 415,228 $ 426,803 $ 441,166 $ 456,049 $ 469,879 $ 485,793 $ 502,257 $ 519,177 $ 536,692<br />
Financial Analysis & Reporting 606,886 563,262 706,399 759,270 902,988 934,207 961,097 993,728 1,027,483 1,059,162 1,095,153 1,132,369 1,170,838 1,210,649<br />
Disbursements 436,434 489,532 528,533 572,914 742,236 700,057 721,443 746,832 773,126 798,190 826,321 855,454 885,607 916,864<br />
Budget & Financial Planning 290,076 346,051 300,403 332,179 413,518 427,850 439,778 454,845 470,435 484,740 501,367 518,566 536,345 554,755<br />
Purchasing & Materials Management 448,649 481,597 503,802 556,944 646,410 674,187 693,542 716,500 740,235 762,843 788,134 814,263 841,362 869,258<br />
<strong>City</strong> Treasury 284,756 300,837 299,430 325,680 380,306 394,364 406,143 420,131 434,626 448,430 463,933 479,984 496,598 513,816<br />
Revenue Generation 256,056 281,040 282,761 345,784 461,354 478,652 493,100 510,375 528,272 545,260 564,404 584,232 604,752 625,973<br />
Non-Departmental Miscellaneous Payments 711,998 571,944 654,640 1,727,548 1,596,951 982,816 1,194,790 1,342,458 1,488,527 2,230,537 2,647,935 2,790,730 3,583,933 3,977,555<br />
Total Finance $ 3,289,107 $ 3,361,003 $ 3,550,104 $ 4,970,261 $ 5,545,096 $ 5,007,361 $ 5,336,696 $ 5,626,035 $ 5,918,753 $ 6,799,041 $ 7,373,040 $ 7,677,855 $ 8,638,612 $ 9,205,562<br />
continued
<strong>City</strong> <strong>of</strong> <strong>Concord</strong><br />
General Fund<br />
Expenditures by Program<br />
For Year Ending June 30, 2008<br />
Actual Actual Actual Budget Adopted Projected Projected Projected Projected Projected Projected Projected Projected Projected<br />
2003-04 2004-05 2005-06 2006-07 2007-08 2008-09 2009-10 2010-11 2011-12 2012-13 2013-14 2014-15 2015-16 2016-17<br />
HUMAN RESOURCES<br />
Employee Relations $ 1,139,226 $ 378,909 $ 457,273 $ 918,718 $ 677,358 $ 699,264 $ 717,954 $ 740,863 $ 764,542 $ 786,599 $ 811,799 $ 837,830 $ 864,692 $ 892,464<br />
Recruitment and Selection 244,321 327,268 278,374 215,853 213,934 220,958 226,996 234,311 241,872 248,966 257,009 265,322 273,909 282,792<br />
Risk Management 363,018 341,296 318,001 198,185 249,642 257,325 264,688 272,762 281,087 289,345 298,190 307,309 316,708 326,402<br />
Benefits Administration 1,019,966 115,682 203,189 262,315 329,919 340,598 349,558 360,729 372,276 382,940 395,245 407,954 421,084 434,668<br />
Organizational Training and Development 69,022 83,953 52,214 139,664 141,082 145,225 148,853 153,196 157,676 161,888 166,632 171,528 176,569 181,769<br />
Classification and Compensation 124,471 99,667 178,793 201,920 227,057 235,040 241,650 250,021 258,681 266,626 275,870 285,434 295,324 305,566<br />
Total Human Resources $ 2,960,024 $ 1,346,775 $ 1,487,844 $ 1,936,655 $ 1,838,992 $ 1,898,410 $ 1,949,699 $ 2,011,882 $ 2,076,134 $ 2,136,364 $ 2,204,745 $ 2,275,377 $ 2,348,286 $ 2,423,661<br />
PLANNING AND ECONOMIC DEVELOPMENT<br />
Administration $ 205,760 $ 269,803 $ 262,005 $ 241,712 $ 206,403 $ 213,642 $ 219,697 $ 227,213 $ 234,992 $ 242,204 $ 250,506 $ 259,093 $ 267,965 $ 277,156<br />
Planning 1,313,585 1,332,708 1,251,782 1,520,362 1,834,068 1,794,497 1,845,836 1,909,903 1,976,237 2,038,125 2,108,980 2,182,319 2,258,153 2,336,719<br />
Economic Development & Housing - 59,675<br />
-<br />
-<br />
-<br />
-<br />
-<br />
-<br />
-<br />
-<br />
-<br />
-<br />
-<br />
-<br />
Total Planning and Economic Dev. $ 1,519,345 $ 1,662,186 $ 1,513,787 $ 1,762,074 $ 2,040,471 $ 2,008,139 $ 2,065,533 $ 2,137,116 $ 2,211,229 $ 2,280,329 $ 2,359,486 $ 2,441,412 $ 2,526,118 $ 2,613,875<br />
POLICE DEPARTMENT<br />
Office <strong>of</strong> the Chief <strong>of</strong> Police $ 1,248,859 $ 1,137,245 $ 1,215,835 $ 1,315,068 $ 850,904 $ 879,940 $ 903,230 $ 933,791 $ 965,406 $ 993,781 $ 1,027,452 $ 1,062,268 $ 1,098,258 $ 1,135,509<br />
Administrative Services 3,249,365 5,374,906 5,807,991 6,567,919 6,814,917 7,003,189 7,202,874 7,438,608 8,032,292 8,019,036 8,174,216 8,442,557 8,743,067 9,006,153<br />
Field Operations 16,249,087 19,990,253 20,317,602 21,404,435 22,651,015 23,402,427 24,041,599 24,862,642 25,712,576 26,508,540 27,416,073 28,331,590 29,300,538 30,303,777<br />
Support Operations 8,111,805 8,102,547 8,363,703 8,790,268 9,500,702 9,840,661 10,115,496 10,463,652 10,824,086 11,154,725 11,539,536 11,937,745 12,349,382 12,775,719<br />
Total Police Department $ 28,859,116 $ 34,604,951 $ 35,705,131 $ 38,077,690 $ 39,817,538 $ 41,126,217 $ 42,263,199 $ 43,698,693 $ 45,534,360 $ 46,676,082 $ 48,157,277 $ 49,774,160 $ 51,491,245 $ 53,221,158<br />
PUBLIC WORKS<br />
Administration $ 684,707 $ 874,993 $ 946,172 $ 855,597 $ 643,024 $ 665,639 $ 684,422 $ 707,764 $ 731,937 $ 754,366 $ 780,198 $ 806,926 $ 834,485 $ 863,024<br />
Transportation 1,581,046 1,688,971 1,813,800 1,949,836 2,058,852 2,129,063 2,190,209 2,262,870 2,337,257 2,409,687 2,489,207 2,571,422 2,655,993 2,743,469<br />
Parks Services, Street Trees and Medians 5,291,757 5,153,659 5,360,204 6,092,392 6,605,541 6,828,333 7,023,596 7,266,170 7,480,961 7,709,680 7,955,308 8,209,072 8,470,449 8,740,600<br />
Graffiti Removal/Lease Management 139,266 172,205 197,794 245,689 231,135 239,506 246,607 254,980 263,644 271,931 281,189 290,767 300,678 310,946<br />
Total Public Works $ 7,696,776 $ 7,889,828 $ 8,317,970 $ 9,143,514 $ 9,538,552 $ 9,862,541 $ 10,144,834 $ 10,491,784 $ 10,813,799 $ 11,145,664 $ 11,505,902 $ 11,878,187 $ 12,261,605 $ 12,658,039<br />
INTRA FUND TRANSFERS OUT<br />
Reserve Funds $ 2,960,115 $ 100,000 $ 1,512,944 $ 200,000 $ 200,000 $ 200,000 $ 200,000 $ 200,000 $ 200,000 $ 200,000 $ 400,000 $ 400,000 $ 400,000 $ 400,000<br />
Capital Improvement Projects 2,106,681 1,307,215 1,731,378 906,658 731,613 622,323 507,942 460,340 462,810 465,354 467,975 470,674 473,455 476,319<br />
Total Intra Fund Transfers Out $ 5,066,796 $ 1,407,215 $ 3,244,322 $ 1,106,658 $ 931,613 $ 822,323 $ 707,942 $ 660,340 $ 662,810 $ 665,354 $ 867,975 $ 870,674 $ 873,455 $ 876,319<br />
GENERAL FUND TOTALS $ 62,760,211 $ 64,650,879 $ 68,625,952 $ 72,309,409 $ 78,328,992 $ 80,078,408 $ 82,254,769 $ 85,149,483 $ 88,307,012 $ 91,368,463 $ 94,733,184 $ 98,002,323 $ 101,874,603 $<br />
105,618,332
Millions<br />
$45<br />
$40<br />
$35<br />
$30<br />
$25<br />
$20<br />
$15<br />
$10<br />
$5<br />
$0<br />
CITY OF CONCORD MAJOR GENERAL FUND TAX REVENUE BY TYPE<br />
ACTUAL AND PROJECTED<br />
1998 1999 2000 2001 2002 2003 2004 2005 2006 2007 2008 2009 2010 2011 2012 2013 2014 2015 2016 2017<br />
Property Tax Sales Tax Transient Occupancy Tax Franchise Tax Business License Tax<br />
Fiscal Property Sales Transient Franchise Business<br />
Year Tax Tax Occupancy Tax Tax License Tax Total<br />
1998 $6,788,131 $20,305,068 $1,433,414 $2,197,537 $2,076,812 $32,800,962<br />
1999 7,334,299 21,538,765 1,484,983 2,320,171 2,180,838 34,859,056<br />
2000 7,754,533 27,201,612 1,587,366 2,413,327 2,154,257 41,111,095<br />
2001 8,373,732 27,094,748 1,993,080 2,533,097 2,289,256 42,283,913<br />
2002 9,415,843 26,502,378 1,786,852 2,838,336 2,573,401 43,116,810<br />
2003 10,320,110 28,089,988 1,630,747 2,950,503 2,836,339 45,827,687<br />
2004 10,743,130 28,377,531 1,528,836 3,256,347 2,815,574 46,721,418<br />
2005 16,154,746 28,893,867 1,629,388 3,368,778 3,153,959 53,200,738<br />
2006 18,681,188 27,832,962 1,834,582 3,347,905 3,107,600 54,804,237<br />
2007 19,404,755 29,860,540 1,613,000 3,618,400 3,320,000 57,816,695<br />
2008 22,527,669 30,504,210 1,661,390 3,830,426 3,419,600 61,943,295<br />
2009 23,652,298 31,571,857 1,711,232 3,920,491 3,522,189 64,378,067<br />
2010 24,833,088 32,676,873 1,762,569 4,013,905 3,627,854 66,914,289<br />
2011 26,072,845 33,820,564 1,815,446 4,360,793 3,736,689 69,806,337<br />
2012 27,374,514 35,004,284 1,869,909 4,461,286 3,848,789 72,558,782<br />
2013 28,741,186 36,229,434 1,926,006 4,565,521 3,964,253 75,426,400<br />
2014 30,176,111 37,497,464 1,983,786 4,673,641 4,083,181 78,414,183<br />
2015 31,682,696 38,809,875 2,043,300 4,539,728 4,205,676 81,281,275<br />
2016 33,264,522 40,168,220 2,104,599 4,896,218 4,331,846 84,765,405<br />
2017 $ 34,925,346 $ 41,574,107 $2,167,737 $5,006,655 $4,461,801 $88,135,646<br />
Actual shown through Fiscal Year 2006 and Planned through Fiscal Year 2017. Source: <strong>City</strong> <strong>Concord</strong> Financial Statements<br />
In Fiscal Year 2002 the <strong>City</strong> restated sales tax revenues in accordance with GASB33.
SALES TAX<br />
49%<br />
PROPERTY TAX<br />
36%<br />
<strong>City</strong> <strong>of</strong> <strong>Concord</strong><br />
General Fund Revenue<br />
Comparison <strong>of</strong> Tax Revenue by Source<br />
For the Fiscal Year Ending June 30, 2008<br />
TRANSIENT<br />
OCCUPANCY<br />
(Hotel Tax)<br />
3%<br />
FRANCHISE FEES<br />
6%<br />
BUSINESS LICENSE<br />
FEES<br />
5%<br />
MOTOR VEHICLE IN-<br />
LIEU<br />
1%<br />
PROPERTY TAX $ 22,527,669<br />
SALES TAX 30,504,210<br />
TRANSIENT OCCUPANCY 1,661,390<br />
FRANCHISE FEES 3,830,426<br />
BUSINESS LICENSE FEES 3,419,600<br />
MOTOR VEHICLE IN-LIEU 875,000<br />
$ 62,818,295
<strong>City</strong> <strong>of</strong> <strong>Concord</strong><br />
General Fund<br />
Comparison <strong>of</strong> Revenues by Source<br />
For the Fiscal Year Ending June 30, 2008<br />
Actual Actual Actual Budget Adopted Projected Projected Projected Projected Projected Projected Projected Projected Projected<br />
2003-04 2004-05 2005-06 2006-07 2007-08 2008-09 2009-10 2010-11 2011-12 2012-13 2013-14 2014-15 2015-16 2016-17<br />
TAXES<br />
Property $ 9,739,079 $ 16,154,746 $ 18,681,188 $ 19,404,755 $ 22,527,669 $ 23,652,298 $ 24,833,088 $ 26,072,845 $ 27,374,514 $ 28,741,186 $ 30,176,111 $ 31,682,696 $ 33,264,522 $ 34,925,346<br />
Sales 28,377,531 28,893,867 27,832,962 29,860,540 30,504,210 31,571,857 32,676,873 33,820,564 35,004,284 36,229,434 37,497,464 38,809,875 40,168,220 41,574,107<br />
Transient Occupancy Tax 1,528,836 1,629,388 1,836,002 1,613,000 1,661,390 1,711,232 1,762,569 1,815,446 1,869,909 1,926,006 1,983,786 2,043,300 2,104,599 2,167,737<br />
Business License 2,817,343 3,153,959 3,107,600 3,320,000 3,419,600 3,522,189 3,627,854 3,736,689 3,848,789 3,964,253 4,083,181 4,205,676 4,331,846 4,461,801<br />
Franchise 3,256,347 3,368,778 3,347,905 3,618,400 3,830,426 3,920,491 4,013,905 4,360,793 4,461,286 4,565,521 4,673,641 4,539,728 4,896,218 5,006,655<br />
Total Taxes $ 45,719,136 $ 53,200,738 $ 54,805,657 $ 57,816,695 $ 61,943,295 $ 64,378,067 $ 66,914,289 $ 69,806,337 $ 72,558,782 $ 75,426,400 $ 78,414,183 $ 81,281,275 $ 84,765,405 $ 88,135,646<br />
LICENSES AND PERMITS<br />
Building Permits $ 1,152,804 $ 1,094,720 $ 1,145,417 $ 1,095,000 $ 1,127,850 $ 1,161,686 $ 1,196,537 $ 1,076,883 $ 1,109,189 $ 1,142,465 $ 1,176,739 $ 1,212,041 $ 1,248,402 $ 1,285,854<br />
Plumbing Permits 93,262 104,213 112,409 104,000 107,120 110,334 113,644 102,280 105,348 108,508 111,763 115,116 118,569 122,126<br />
Mechanical Permits 92,012 84,430 109,732 84,000 86,520 89,116 91,789 82,610 85,088 87,641 90,270 92,978 95,767 98,640<br />
Electrical Permits 119,949 110,411 144,953 110,000 113,300 116,699 120,200 108,180 111,425 114,768 118,211 121,757 125,410 129,172<br />
Other 82,331 144,293 158,642 157,764 180,497 185,912 191,489 188,383 194,033 199,854 205,851 212,027 218,388 224,940<br />
Total Licenses and Permits $ 1,540,358 $ 1,538,067 $ 1,671,153 $ 1,550,764 $ 1,615,287 $ 1,663,747 $ 1,713,659 $ 1,558,336 $ 1,605,083 $ 1,653,236 $ 1,702,834 $ 1,753,919 $ 1,806,536 $ 1,860,732<br />
FINES AND FORFEITTURES<br />
Vehicle Code & Parking $ 447,419 $ 575,372 $ 567,769 $ 581,863 $ 446,569 $ 459,966 $ 473,765 $ 487,978 $ 502,618 $ 517,696 $ 533,227 $ 549,224 $ 565,700 $ 582,671<br />
Neighborhood Services 62,436 95,765 127,223 58,000 59,740 61,533 63,379 65,280 67,238 69,255 71,332 73,472 69,151 69,268<br />
Other -<br />
- 92,605<br />
-<br />
-<br />
-<br />
-<br />
-<br />
-<br />
-<br />
-<br />
-<br />
-<br />
-<br />
Total Fines and Forfeittures $ 509,855 $ 671,137 $ 787,597 $ 639,863 $ 506,309 $ 521,499 $ 537,144 $ 553,258 $ 569,856 $ 586,951 $ 604,559 $ 622,696 $ 634,851 $ 651,939<br />
USE OF MONEY AND PROPERTY<br />
Investment Earnings $ 179,176 $ 695,874 $ 965,027 $ 753,367 $ 778,398 $ 778,398 $ 803,398 $ 803,398 $ 803,436 $ 803,476 $ 803,517 $ 803,588 $ 803,588 $ 803,588<br />
Property Rentals 300,386 317,984 363,645 364,696 370,190 375,794 381,510 387,340 393,287 399,353 405,540 411,851 418,288 424,854<br />
Total Use <strong>of</strong> Money and Property $ 479,562 $ 1,013,858 $ 1,328,672 $ 1,118,063 $ 1,148,588 $ 1,154,192 $ 1,184,908 $ 1,190,738 $ 1,196,723 $ 1,202,829 $ 1,209,057 $ 1,215,439 $ 1,221,876 $ 1,228,442<br />
INTERGOVERNMENTAL<br />
Motor Vehicle In-Lieu $ 5,684,928 $ 2,825,429 $ 858,124 $ 696,000 $ 875,000 $ 905,625 $ 937,322 $ 970,128 $ 1,004,082 $ 1,039,225 $ 1,075,598 $ 1,113,244 $ 1,152,208 $ 1,192,535<br />
Off-Highway Vehicle Tax 4,080 4,441 1,903 1,800 1,800 1,800 1,800 1,800 1,800 1,800 1,800 1,800<br />
1,800 1,800<br />
State Mandated Costs -<br />
608 266,277<br />
-<br />
-<br />
-<br />
-<br />
-<br />
-<br />
-<br />
-<br />
-<br />
-<br />
-<br />
Police Officers Standards&Training (POST) 30,140 62,771 86,648 53,045 54,636 56,275 57,963 59,702 61,493 63,338 65,238 67,195 69,211 71,287<br />
Citizens Option for Public Safety (COPS) 186,055 183,386 180,069 180,069 180,069 180,069 180,069 180,069 180,069 180,069 180,069 180,069 180,069 180,069<br />
Other Grants 2,909<br />
- 10,022<br />
-<br />
-<br />
-<br />
-<br />
-<br />
-<br />
-<br />
-<br />
-<br />
-<br />
-<br />
Total Intergovernmental $ 5,908,112 $ 3,076,635 $ 1,403,043 $ 930,914 $ 1,111,505 $ 1,143,769 $ 1,177,154 $ 1,211,699 $ 1,247,444 $ 1,284,432 $ 1,322,705 $ 1,362,308 $ 1,403,288 $ 1,445,691<br />
continued
<strong>City</strong> <strong>of</strong> <strong>Concord</strong><br />
General Fund<br />
Comparison <strong>of</strong> Revenues by Source<br />
For the Fiscal Year Ending June 30, 2008<br />
Actual Actual Actual Budget Adopted Projected Projected Projected Projected Projected Projected Projected Projected Projected<br />
2003-04 2004-05 2005-06 2006-07 2007-08 2008-09 2009-10 2010-11 2011-12 2012-13 2013-14 2014-15 2015-16 2016-17<br />
CURRENT SERVICES<br />
<strong>City</strong> Management $ 40,877 $ 44,979 $ 109,952 $ 42,100 $ 47,000 $ 51,180 $ 52,559 $ 53,980 $ 55,443 $ 56,950 $ 58,503 $ 60,102 $ 61,749 $ 63,445<br />
Finance Department 18,136 11,983 13,230 12,657 12,917 13,185 13,461 13,745 14,037 14,338 14,648 14,968 15,297 15,636<br />
CR&S-Summer Camp 500,986 557,042 491,895 557,036 518,885 534,301 550,180 566,536 583,382 600,734 618,606 637,014 655,974 675,503<br />
CR&S-Aquatics 128,487 232,718 257,567 247,488 254,913 262,560 270,438 278,552 286,908 295,515 304,380 313,512 322,917 332,604<br />
CR&S-Facility Rental 632,262 705,638 817,518 723,595 850,135 867,689 885,770 904,394 923,576 943,334 963,685 984,645 1,006,235 1,028,472<br />
CR&S-Youth & Family Services 416,021 436,291 495,445 504,246 609,530 627,457 645,920 664,937 684,525 704,701 725,482 746,887 768,933 791,640<br />
CR&S-League Fees 293,738 301,412 313,367 333,598 340,753 350,976 361,505 372,350 383,520 395,026 406,876 419,082 431,655 444,606<br />
CR&S-Senior Services 126,510 157,716 149,162 164,000 177,000 182,700 188,586 194,665 200,943 207,428 214,125 221,043 228,187 235,566<br />
Public Works-Special Event Services -<br />
- 4,223<br />
-<br />
-<br />
-<br />
-<br />
-<br />
-<br />
-<br />
-<br />
-<br />
-<br />
-<br />
BE&NS-Engineering 1,004,017 1,473,431 2,003,918 1,048,300 1,079,749 1,112,140 1,145,505 1,030,957 1,061,886 1,093,742 1,126,554 1,160,350 1,195,160 1,231,016<br />
BE&NS-Building 641,688 776,399 1,003,481 770,000 1,208,100 1,234,743 1,262,185 1,167,967 1,193,406 1,219,609 1,246,597 1,274,396 1,303,028 1,332,519<br />
BE&NS-Neighborhood Services 215,756 152,608 190,636 246,060 253,172 260,498 268,044 275,815 283,820 292,065 300,557 309,304 318,313 327,592<br />
Public Safety Services 893,211 828,421 640,079 637,608 642,709 659,290 676,369 693,959 712,078 730,739 749,961 769,758 790,151 811,156<br />
Planning 339,574 436,073 534,576 327,784 307,472 316,697 326,202 335,988 346,069 356,451 367,143 378,158 389,504 401,189<br />
Total Current Services $ 5,251,263 $ 6,114,711 $ 7,025,049 $ 5,614,472 $ 6,302,335 $ 6,473,416 $ 6,646,724 $ 6,553,845 $ 6,729,593 $ 6,910,632 $ 7,097,117 $ 7,289,219 $ 7,487,103 $ 7,690,944<br />
INTERFUND SERVICE CHARGES<br />
Golf Course Enterprise $ 374,881 $ 71,635 $ 380 $ 391,579 $ 279,680 $ 285,967 $ 338,366 $ 289,057 $ 316,150 $ 291,338 $ 337,411 $ 310,598 $ 364,304 $ 338,327<br />
Sewer Enterprise 1,965,935 2,160,491 2,333,511 1,577,662 1,632,768 1,667,471 1,702,918 1,739,124 1,776,105 1,813,879 1,852,462 1,891,872 1,932,127 1,973,245<br />
Redevelopment Agency 970,076 1,008,879 1,184,376 1,295,948 1,293,696 1,319,571 1,345,963 1,372,881 1,400,339 1,428,346 1,456,913 1,486,052 1,515,772 1,546,087<br />
Stormwater 326,161 341,207 356,856 383,130 398,455 406,424 414,552 422,843 431,300 439,926 448,725 457,700 466,854 476,191<br />
Maintenance Districts -<br />
-<br />
-<br />
- 197,470 203,394 209,496 215,781 222,254 228,922 235,790 242,864 250,150 257,655<br />
Total Interfund Service Charges $ 3,637,053 $ 3,582,212 $ 3,875,123 $ 3,648,319 $ 3,802,069 $ 3,882,827 $ 4,011,295 $ 4,039,686 $ 4,146,148 $ 4,202,411 $ 4,331,301 $ 4,389,086 $ 4,529,207 $ 4,591,505<br />
OTHER REVENUES<br />
Other $ 87,851 $ 151,053 $ 293,455 $ 130,479 $ 181,597 $ 170,995 $ 155,525 $ 160,191 $ 164,998 $ 169,948 $ 175,047 $ 180,297 $ 185,707 $ 191,278<br />
Sale <strong>of</strong> Real/Personal Property 3,523 6,979<br />
- 10,000 10,000 10,000 10,000 10,000 10,000 10,000 10,000 10,000 10,000 10,000<br />
Total Other Revenues $ 91,374 $ 158,032 $ 293,455 $ 140,479 $ 191,597 $ 180,995 $ 165,525 $ 170,191 $ 174,998 $ 179,948 $ 185,047 $ 190,297 $ 195,707 $ 201,278<br />
OTHER FINANCING SOURCES<br />
Graffitti $ 14,759 $ 15,054 $ 15,506 $ 15,971 $ 16,450 $ 16,944 $ 17,452 $ 17,976 $ 18,515 $ 19,070 $ 19,642 $ 20,231 $ 20,838 $ 21,463<br />
Traffic Safety Management 17,195 7,959 5,398 4,000 4,000 4,000 4,000 4,000 4,000 4,000 4,000 4,000<br />
4,000 4,000<br />
Metroplex/Parklands/Other 244,017 814,517 673,157 306,404 135,877 340,362 344,878 349,605 354,560 236,809 165,359 171,257 177,705 179,540<br />
Reserve Funds 100,476 150,000 200,000 200,000<br />
-<br />
-<br />
-<br />
-<br />
-<br />
-<br />
-<br />
-<br />
-<br />
-<br />
Total Other Financing Sources $ 376,447 $ 987,530 $ 894,061 $ 526,375 $ 156,327 $ 361,306 $ 366,330 $ 371,581 $ 377,075 $ 259,879 $ 189,001 $ 195,488 $ 202,543 $ 205,003<br />
TOTAL GENERAL FUND $ 63,513,160 $ 70,342,920 $ 72,083,810 $ 71,985,944 $ 76,777,312 $ 79,759,818 $ 82,717,028 $ 85,455,671 $ 88,605,702 $ 91,706,718 $ 95,055,804 $ 98,299,727 $ 102,246,516 $<br />
106,011,180
TAXES<br />
82%<br />
<strong>City</strong> <strong>of</strong> <strong>Concord</strong><br />
General Fund Revenue<br />
Comparison <strong>of</strong> Revenue by Source<br />
For the Year Ending June 30, 2008<br />
INTERGOVERNMENTAL<br />
1%<br />
OTHER REVENUES<br />
1%<br />
INTERFUND CHARGES<br />
5%<br />
REVENUES FROM USE<br />
OF MONEY<br />
1%<br />
LICENSES AND PERMITS<br />
2%<br />
CURRENT SERVICES<br />
8%<br />
TAXES $ 61,943,295<br />
INTERGOVERNMENTAL 1,111,505<br />
INTERFUND CHARGES 3,802,069<br />
REVENUES FROM USE OF MONEY 1,148,588<br />
LICENSES AND PERMITS 1,615,287<br />
CURRENT SERVICES 6,302,335<br />
OTHER REVENUES 854,233<br />
$ 76,777,312
<strong>City</strong> <strong>of</strong> <strong>Concord</strong><br />
General Fund Reserve Funds<br />
Ten Year Projection<br />
For the Year Ending June 30, 2008<br />
2007-08 2008-09 2009-10 2010-11 2011-12 2012-13 2013-14 2014-15 2015-16 2016-17<br />
Benefits Reserve<br />
Fund Balance 7/01 $ 825,684 $ 854,583 $ 888,767 $ 1,138,205 $ 1,400,115 $ 1,675,121 $ 1,963,877 $ 2,267,071 $ 2,585,424 $ 2,919,696<br />
Interest Earnings $ 28,899 $ 34,183 $ 49,438 $ 61,910 $ 75,006 $ 88,756 $ 103,194 $ 118,354 $ 134,271 $ 150,985<br />
Fund Transfers<br />
Inter-Fund Transfers In $ - $ - $ 200,000 $ 200,000 $ 200,000 $ 200,000 $ 200,000 $ 200,000 $ 200,000 $ 200,000<br />
Transfers Out -<br />
-<br />
-<br />
-<br />
-<br />
-<br />
-<br />
-<br />
-<br />
-<br />
Total Intra-Fund Transfers $ - $ - $ 200,000 $ 200,000 $ 200,000 $ 200,000 $ 200,000 $ 200,000 $ 200,000 $ 200,000<br />
Fund Balance 6/30 $ 854,583 $ 888,767 $ 1,138,205 $ 1,400,115 $ 1,675,121 $ 1,963,877 $ 2,267,071 $ 2,585,424 $ 2,919,696 $ 3,270,680<br />
Economic Contingency<br />
2007-08 2008-09 2009-10 2010-11 2011-12 2012-13 2013-14 2014-15 2015-16 2016-17<br />
Fund Balance 7/01 $ 11,512,802 $ 11,512,802 $ 11,512,802 $ 11,512,802 $ 11,512,802 $ 11,512,802 $ 11,512,802 $ 11,512,802 $ 11,512,802 $ 11,512,802<br />
Interest Earnings $ - $ - $ - $ - $ - $ - $ - $ - $ - $ -<br />
Intra-Fund Transfers<br />
Transfers In $ - $ - $ - $ - $ - $ - $ - $ - $ - $ -<br />
Transfers Out -<br />
-<br />
-<br />
-<br />
-<br />
-<br />
-<br />
-<br />
-<br />
-<br />
Total Intra-Fund Transfers $ - $ - $ - $ - $ - $ - $ - $ - $ - $ -<br />
Fund Balance 6/30 $ 11,512,802 $ 11,512,802 $ 11,512,802 $ 11,512,802 $ 11,512,802 $ 11,512,802 $ 11,512,802 $ 11,512,802 $ 11,512,802 $<br />
11,512,802
Unforcasted Reserve<br />
<strong>City</strong> <strong>of</strong> <strong>Concord</strong><br />
General Fund Reserve Funds<br />
Ten Year Projection<br />
For the Year Ending June 30, 2008<br />
2007-08 2008-09 2009-10 2010-11 2011-12 2012-13 2013-14 2014-15 2015-16 2016-17<br />
Fund Balance 7/01 $ 1,801,043 $ 1,901,043 $ 2,001,043 $ 2,101,043 $ 2,201,043 $ 2,301,043 $ 2,401,043 $ 2,601,043 $ 2,801,043 $ 3,001,043<br />
Interest Earnings $ - $ - $ - $ - $ - $ - $ - $ - $ - $ -<br />
Intra-Fund Transfers<br />
Transfers In $ 100,000 $ 100,000 $ 100,000 $ 100,000 $ 100,000 $ 100,000 $ 200,000 $ 200,000 $ 200,000 $ 200,000<br />
Transfers Out -<br />
-<br />
-<br />
-<br />
-<br />
-<br />
-<br />
-<br />
-<br />
-<br />
Total Intra-Fund Transfers $ 100,000 $ 100,000 $ 100,000 $ 100,000 $ 100,000 $ 100,000 $ 200,000 $ 200,000 $ 200,000 $ 200,000<br />
Fund Balance 6/30 $ 1,901,043 $ 2,001,043 $ 2,101,043 $ 2,201,043 $ 2,301,043 $ 2,401,043 $ 2,601,043 $ 2,801,043 $ 3,001,043 $ 3,201,043<br />
Maintenance & Capital<br />
2007-08 2008-09 2009-10 2010-11 2011-12 2012-13 2013-14 2014-15 2015-16 2016-17<br />
Fund Balance 7/01 $ 1,500,000 $ 1,600,000 $ 1,700,000 $ 1,800,000 $ 1,900,000 $ 2,000,000 $ 2,100,000 $ 2,300,000 $ 2,500,000 $ 2,700,000<br />
Interest Earnings $ - $ - $ - $ - $ - $ - $ - $ - $ - $ -<br />
Intra-Fund Transfers<br />
Transfers In $ 100,000 $ 100,000 $ 100,000 $ 100,000 $ 100,000 $ 100,000 $ 200,000 $ 200,000 $ 200,000 $ 200,000<br />
Transfers Out -<br />
-<br />
-<br />
-<br />
-<br />
-<br />
-<br />
-<br />
-<br />
-<br />
Total Intra-Fund Transfers $ 100,000 $ 100,000 $ 100,000 $ 100,000 $ 100,000 $ 100,000 $ 200,000 $ 200,000 $ 200,000 $ 200,000<br />
Fund Balance 6/30 $ 1,600,000 $ 1,700,000 $ 1,800,000 $ 1,900,000 $ 2,000,000 $ 2,100,000 $ 2,300,000 $ 2,500,000 $ 2,700,000 $<br />
2,900,000
<strong>City</strong> <strong>of</strong> <strong>Concord</strong><br />
Summary <strong>of</strong> Population, General Fund Adopted Budgets<br />
and Net Assessed Values<br />
For Year Ending June 30, 2008<br />
Year Population Adopted Net Population Budget<br />
Budget Assessed Increase Increase<br />
Values<br />
1997-1998 113,400<br />
1998-1999 114,500<br />
1999-2000 121,780<br />
2000-2001 123,272<br />
2001-2002 123,935<br />
2002-2003 124,655<br />
2003-2004 124,856<br />
2004-2005 124,798<br />
2005-2006 124,463<br />
2006-2007 125,203<br />
$ 44,801,294 $ 5,766,362 1.4% 3.2%<br />
46,628,329<br />
49,496,183<br />
58,464,438<br />
59,071,610<br />
69,422,375<br />
60,336,793<br />
64,965,066<br />
68,712,606<br />
72,309,409<br />
2007-2008 * $ 78,328,992<br />
5,954,815<br />
6,289,379<br />
6,762,369<br />
7,396,628<br />
7,905,764<br />
8,578,526<br />
10,272,699<br />
11,289,315<br />
1.0% 4.1%<br />
6.4% 6.2%<br />
1.2% 18.1%<br />
0.5% 1.0%<br />
0.6% 17.5%<br />
0.2% -13.1%<br />
0.0% 7.7%<br />
-0.3% 5.8%<br />
$ 12,581,573 0.6% 5.2%<br />
ASSESSED VALUATIONS<br />
(in $1,000) 2003-04 2004-05 2005-06 2006-07<br />
Land $ 3,620,266 $ 4,023,336 $ 4,546,994 $ 5,242,291<br />
Improvements 6,048,715 6,385,317 6,848,922 7,486,126<br />
Personal Property 377,439<br />
349,699 429,359 409,664<br />
$ 10,046,420 $ 10,758,352 $ 11,825,275 $ 13,138,081<br />
Exemptions:<br />
Redevelopment $ 1,144,591 $ 172,343 $ 170,714 $ 168,059<br />
Other 323,303<br />
313,309 365,246 388,449<br />
Net Total $ 8,578,526 $ 10,272,700 $ 11,289,315 $ 12,581,573<br />
* Information not available until October, 2007
Billions<br />
$14<br />
$13<br />
$12<br />
$11<br />
$10<br />
$9<br />
$8<br />
$7<br />
$6<br />
$5<br />
$4<br />
<strong>City</strong> <strong>of</strong> <strong>Concord</strong><br />
Assessed and Estimated Value <strong>of</strong> all Property<br />
Last Ten Fiscal Years<br />
1998 1999 2000 2001 2002 2003 2004 2005 2006 2007<br />
Secured Property Unsecured Property<br />
Total Estimated Total<br />
Fiscal Secured Unsecured Assessed Full Market Direct<br />
Year Property Property Valuation (a) Valuation (a) Tax Rate (b)<br />
1998 $ 6,303,510,032 $ 403,046,960 $ 6,706,556,992 $ 6,706,556,992 1%<br />
1999 6,607,185,481 399,320,065 7,006,505,546 7,006,505,546 1%<br />
2000 7,027,092,078 408,400,178 7,435,492,256 7,435,492,256 1%<br />
2001 7,493,043,008 444,462,619 7,937,505,627 7,937,505,627 1%<br />
2002 8,178,122,205 520,828,043 8,698,950,248 8,698,950,248 1%<br />
2003 8,765,865,678 537,720,228 9,303,585,906 9,303,585,906 1%<br />
2004 9,485,673,075 560,749,296 10,046,422,371 10,046,422,371 1%<br />
2005 10,250,194,759 508,157,337 10,758,352,096 10,758,352,096 1%<br />
2006 11,249,270,301 576,005,523 11,825,275,824 11,825,275,824 1%<br />
2007 $ 12,022,446,652 $ 559,125,468 $ 12,581,572,120 $ 12,581,572,120 1%<br />
2008 *<br />
* Source: Contra Costa County Auditor-Controller's Office and information not available until October, 2007.<br />
(a) The state constitution requires property to be assessed at one hundred percent <strong>of</strong> the most<br />
recent purchase price, plus an increment <strong>of</strong> no more than two percent annually, plus any local<br />
over-rides. These values are considered to be full market values.<br />
(b) California cities do not set their own direct tax rate. The constitution establishes the rate at 1% and<br />
allocates a portion <strong>of</strong> that amount, by annual calculation, to all the taxing entities within a tax rate area.<br />
The <strong>City</strong> <strong>of</strong> <strong>Concord</strong> encompasses more than 15 tax rate areas.
Thousands<br />
$25,000<br />
$24,000<br />
$23,000<br />
$22,000<br />
$21,000<br />
$20,000<br />
$19,000<br />
$18,000<br />
$17,000<br />
$16,000<br />
$15,000<br />
$14,000<br />
Property Tax Levies and Collections<br />
Last Ten Fiscal Years<br />
1997 1998 1999 2000 2001 2002 2003 2004 2005 2006<br />
Tax Levy and Collections<br />
Percent Value <strong>of</strong><br />
<strong>of</strong> Total <strong>City</strong> Property<br />
Total General Fund Debt Service Redevelopment Total Tax Subject to<br />
Fiscal Secured Tax Fund Tax Agency Fund Tax Collections Local<br />
Year Tax Levy Collections Collections Tax Collections Collections to Tax Levy Tax Rate<br />
1997 16,271,924 6,529,582<br />
- 9,742,342 16,271,924 100.00% 6,643,935,928<br />
1998 16,054,020 6,788,131<br />
- 9,265,889 16,054,020 100.00% 6,706,556,992<br />
1999 17,378,653 7,334,299<br />
- 10,044,354 17,378,653 100.00% 7,006,505,546<br />
2000 18,539,359 7,754,533<br />
- 10,784,826 18,539,359 100.00% 7,435,492,886<br />
2001 18,978,753 8,373,732<br />
- 10,605,020 18,978,752 100.00% 7,937,505,627<br />
2002 20,874,360 9,415,843<br />
- 11,458,517 20,874,360 100.00% 8,698,950,248<br />
2003 22,268,670 10,320,110<br />
- 11,948,560 22,268,670 100.00% 9,303,585,906<br />
2004 23,117,284 10,743,130<br />
- 12,374,154 23,117,284 100.00% 10,046,422,371<br />
2005 21,710,945 (A) 10,652,549<br />
- 11,058,396 (A) 21,710,945 100.00% 10,758,352,096<br />
2006 $ 23,202,024 (A) $ 11,773,593 $ - $ 11,428,431 (A) $ 23,202,024 100.00% 11,825,275,824<br />
2007 * $ 12,581,572,120<br />
* Source: Contra Costa County Auditor-Controller’s Office and the <strong>City</strong> <strong>of</strong> <strong>Concord</strong>’s Finance Department. Information available in October, 2007.<br />
Note: A reserve is established by the County <strong>of</strong> Contra Costa under Revenue and Taxation Code Section 4701-4716 to cover all secured<br />
delinquencies, thus providing the <strong>City</strong> <strong>of</strong> <strong>Concord</strong> with 100% collection <strong>of</strong> its annual tax levy.<br />
(A) Tax collections in FY2005 and FY2006 are net <strong>of</strong> pass-thru payment and educational revenue augmentation fund withholding.<br />
Billions<br />
$13<br />
$12<br />
$11<br />
$10<br />
$9<br />
$8<br />
$7<br />
$6<br />
1997 1998 1999 2000 2001 2002 2003 2004 2005 2006<br />
Value <strong>of</strong> Property
ACCOUNTING BASIS<br />
CITY OF CONCORD<br />
DEPARTMENTAL SUMMARIES<br />
ALL FUNDING SOURCES<br />
FOR YEAR ENDING JUNE 30, 2008<br />
All governmental fund type annual operating budgets are adopted on a basis <strong>of</strong> accounting consistent<br />
with generally accepted accounting principles except for the Capital Improvement Program/Transportation<br />
Improvement Program (CIP/TIP) projects which are reviewed annually and adopted on a project by<br />
project basis.<br />
Basis <strong>of</strong> accounting refers to when revenues and expenditures or expenses are recognized and reported<br />
in the financial statements, regardless <strong>of</strong> the measurement focus applied. All governmental and agency<br />
funds are accounted for using the modified accrual basis <strong>of</strong> accounting. Revenues are recognized when<br />
they become measurable and available as net current assets. Measurable means the amount <strong>of</strong> the<br />
transaction can be determined and is available, i.e., collectible within the current period or soon enough<br />
thereafter (generally sixty days) to be used to pay liabilities <strong>of</strong> the current period. Amounts which could<br />
not be measured or were not available were not accrued as revenue in the current year.<br />
Those revenues susceptible to accrual are sales and franchise taxes, interest revenue and some charges<br />
for services. Fines, licenses and permits revenues are not susceptible to accrual because they are<br />
generally not measurable until received. Long-term notes receivable have been <strong>of</strong>fset with an entry to<br />
deferred revenue or a reservation <strong>of</strong> fund balance to reflect interest and principal, respectively, and the<br />
fact that these revenues are not currently available.<br />
Expenditures are generally recognized under the modified accrual basis <strong>of</strong> accounting when the related<br />
fund liability is incurred. Exceptions to this general rule include accumulated unpaid vacation, sick pay<br />
and other employee amounts which are accrued in the general long-term obligation account group, and<br />
principal and interest on general long-term debt which is recognized when due. Financial resources<br />
usually are appropriated in other funds for transfer to a debt service fund in the period in which maturing<br />
debt principal and interest must be paid. Such amounts thus are not current liabilities <strong>of</strong> the debt service<br />
fund, as their settlement will not require expenditure <strong>of</strong> existing fund assets.<br />
All proprietary funds, the internal service funds, and the pension trust fund are budgeted for using the<br />
accrual basis <strong>of</strong> accounting. Their revenues are recognized when they are earned and their expenses<br />
are recognized when they are incurred. Depreciation and amortization are not reflected in the budget.<br />
PROGRAM STRUCTURE<br />
A number <strong>of</strong> Departments have reconfigured their program structure from the prior year as a result <strong>of</strong><br />
developing their Performance-Based Budgets. As such, prior year comparisons cannot be made in the<br />
individual program summaries. For those individual programs, a N/A (not applicable) is noted in the prior<br />
year columns.<br />
The material in this section is intended to assist the reader by giving an overall summary <strong>of</strong> each<br />
Department’s expenditures and personnel allocations proposed for FY 07/08 as compared to what was<br />
budgeted in the four preceding fiscal years. Comparisons are made at the Department level and include<br />
all funding sources.<br />
A brief summary is given if the proposed budget contains any significant changes for the prior year that<br />
affect expenditures and personnel. Rental charges for equipment and facilities are now proportionately<br />
assigned to each Department as an expense. Also expensed to each Department are the operational<br />
costs for each Internal Service Fund. These charges are shown under the “Fixed Charges” category. The<br />
total operational and replacement expense is <strong>of</strong>fset equally by revenue to the appropriate Internal Service<br />
Fund.<br />
Operations for the Internal Service Funds are shown in the appropriate Departmental Summary. The<br />
Information Technology Replacement Fund is shown in the Information Technology Department and<br />
includes computers and peripherals, telecommunications and other <strong>of</strong>fice equipment. The Building<br />
Maintenance and Fleet Replacement Funds are included with the Maintenance Services Department.<br />
59
CITY OF CONCORD<br />
DEPARTMENTAL SUMMARIES<br />
FUND STRUCTURE<br />
FOR YEAR ENDING JUNE 30, 2008<br />
GOVERNMENTAL FUNDS<br />
Governmental funds are accounting segregations <strong>of</strong> financial resources. Expendable assets are<br />
assigned to various governmental funds according to the purposes for which they may or must be used;<br />
current liabilities are assigned to the fund from which they are to be paid and the difference between<br />
governmental fund assets and liabilities is referred to as “Fund Balance”.<br />
• General Fund - This is the main operating fund <strong>of</strong> the <strong>City</strong>. It is used to account for all financial<br />
resources not required to be accounted for in another fund. The major revenue sources for this fund<br />
are property taxes, sales taxes, franchise fees, motor vehicle in-lieu fees, interest income, fines and<br />
charges for services. Expenditures are made for public safety, parks, recreation and general<br />
governmental operations.<br />
• Special Revenue Funds - To account for the proceeds <strong>of</strong> specific revenue sources (other than<br />
expendable trusts or for major capital projects) that are legally restricted to expenditure for specified<br />
purposes. The <strong>City</strong> maintains eight Special Revenue Funds.<br />
1. State Gas Tax - Revenue apportioned to the <strong>City</strong> from State-collected gasoline taxes and<br />
expended for construction and maintenance <strong>of</strong> city streets.<br />
2. Storm Water Management - To account for the activities necessary to comply with the Federal<br />
Clean Water Act.<br />
3. Maintenance Districts - Revenue from assessments on property owners within the districts<br />
expended for street lighting and landscape maintenance within these areas.<br />
4. Art in Public Places - Fees collected from new construction permits expended for the purchase<br />
and installation <strong>of</strong> art objects in the <strong>City</strong>. This fee has been rescinded and the funds available are<br />
earmarked in the Capital Improvement Program for a specific project.<br />
5. Traffic System Management (TSM) - Monies from in-lieu Parking fees expended for <strong>of</strong>f-street<br />
parking facilities, mass transit equipment and TSM projects.<br />
6. RDA Housing Set-Aside - Tax increment allocations set aside for the purpose <strong>of</strong> increasing or<br />
improving the <strong>City</strong>’s supply <strong>of</strong> low or moderate income housing.<br />
7. Monument Community Partnership - Monies from partnership between the Contra Costa First 5<br />
children and Monument Community Partnership.<br />
8. Housing & Community Services - Monies from the Department <strong>of</strong> Housing and Urban<br />
Development expended for programs to assist low and moderate-income residents. Developer’s<br />
fees support the <strong>City</strong>’s childcare program.<br />
• Debt Service Funds - To account for the accumulation <strong>of</strong> resources for, and the payment <strong>of</strong>, general<br />
long-term debt principal and interest. The <strong>City</strong> maintains the following types <strong>of</strong> Debt Service Funds.<br />
1. Tax Allocation Bonds - Accounts for accumulation <strong>of</strong> property taxes for payment <strong>of</strong> principal and<br />
interest on the Redevelopment Agency tax allocation bonds.<br />
2. Revenue Bonds - Accounts for payment <strong>of</strong> principal and interest <strong>of</strong> the Police Facility, Parking<br />
Structure and the Performing Arts Structure.<br />
3. Certificates <strong>of</strong> Participation - Accounts for transfers from the General Fund for payment <strong>of</strong><br />
principal and interest on Association <strong>of</strong> bay Area Government (ABAG) certificates <strong>of</strong> participation.<br />
4. Assessment Districts - Accounts for accumulation <strong>of</strong> special assessment taxes for payment <strong>of</strong><br />
principal and interest on special assessment bonds.<br />
• Capital Projects Funds -To account for financial resources to be used for the acquisition or<br />
construction <strong>of</strong> major capital facilities (other than those financed by proprietary fund and trust funds).<br />
The <strong>City</strong> maintains nine Capital Project Funds.<br />
1. Measure C - Accounts for transportation improvements funded by 19% <strong>of</strong> the ½% sales tax<br />
approved by Contra Costa voters in 1988.<br />
2. Measure C I-680 - Accounts for highway improvements funded by 81% <strong>of</strong> the ½% sales tax<br />
approved by Contra Costa voters in 1988.<br />
60
CITY OF CONCORD<br />
DEPARTMENTAL SUMMARIES<br />
FUND STRUCTURE<br />
FOR YEAR ENDING JUNE 30, 2008<br />
• Capital Projects Funds Continued<br />
3. Developer Fees for Parkland Zones - Accounts for fees collected from developers expended for<br />
parks and recreational areas.<br />
4. Developer Fees for Off-Site Street Improvement Program (O.S.I.P.) - Accounts for fees collected<br />
from developers expended for General Plan street improvements.<br />
5. Developer Fees for Storm Drain Zones/Traffic Mitigation - Account for fees collected from<br />
developers expended for storm drains and traffic mitigation.<br />
6. Federal Street Assistance - Accounts for approved capital projects funded by Federal<br />
Government revenues.<br />
7. Traffic Congestion Relief - Accounts for sales tax revenues used for local streets and roads<br />
construction projects.<br />
8. Assessment Districts - Accounts for specific public improvements such as streets, sewers, storm<br />
drains, or sidewalks or other amenities funded by special assessments against benefited<br />
properties.<br />
9. General Reimbursable Projects Fund - Accounts for the costs <strong>of</strong> acquisition and construction <strong>of</strong><br />
general purpose public facilities that are reimbursable from grants or from General Fund<br />
transfers.<br />
PROPRIETARY FUNDS<br />
Proprietary funds account for <strong>City</strong> operations financed and operated in a manner to a private business<br />
enterprise. The intent <strong>of</strong> the <strong>City</strong> is that the cost <strong>of</strong> providing goods and services be financed primarily<br />
through user charges.<br />
• Enterprise Funds - To account for operations that are financed and operated in a manner similar to<br />
private business enterprises. The intent <strong>of</strong> the governing body is that the cost (expenses, including<br />
depreciation) <strong>of</strong> providing goods or services to the general public on a continuing basis be financed or<br />
recovered through user charges. The <strong>City</strong> operates two Enterprise Funds.<br />
1. Golf Course Fund - Accounts for activities associated with the development, operations, and<br />
maintenance <strong>of</strong> the Diablo Creek Golf Course.<br />
2. Sewer Fund - Accounts for activities associated with sewage transmission and treatment.<br />
INTERNAL SERVICE FUNDS<br />
To account for the financing <strong>of</strong> goods or services provided by one department to other departments <strong>of</strong> the<br />
governmental unit on a cost reimbursement basis. The <strong>City</strong> maintains six Internal Service Funds.<br />
1. Worker’s Compensation Fund - Accounts for worker’s compensation expenses.<br />
2. Risk Management/Liability Fund - Provides for the uninsured portion <strong>of</strong> claims and judgments.<br />
3. Post Retirement Healthcare - Accounts for contributions and benefits paid in relation to the Post-<br />
Retirement Health Care Program.<br />
4. Fleet Maintenance Fund - Accounts for the replacement, maintenance and operations <strong>of</strong> <strong>City</strong><br />
licensed vehicles and motorized equipment.<br />
5. Information Technology Equipment Fund - Accounts for the replacement, maintenance and<br />
operations <strong>of</strong> computers and peripherals, network systems, telecommunications, data base<br />
systems and <strong>of</strong>fice equipment.<br />
6. Building Maintenance Fund - Accounts for the replacement, maintenance and operations for<br />
facility upkeep and custodial services.<br />
FIDUCIARY FUNDS<br />
To account for assets held by the <strong>City</strong> as a trustee agent for other governmental units, private<br />
organizations, other or individuals. The Employee Retirement System Trust Fund, the only Fiduciary fund<br />
<strong>of</strong> the <strong>City</strong>, accounts for accumulation <strong>of</strong> resources to be used for retirement annuity payments at<br />
appropriate amounts and times in the future.<br />
61
CITY OF CONCORD<br />
FUND BALANCE SUMMARY BY FUND<br />
FOR THE YEAR ENDING JUNE 30, 2008<br />
Estimated Estimated<br />
Fund Balance Transfers<br />
Fund Balance<br />
07/01/2007 Revenues Expenditures In Out 06/30/2008<br />
GENERAL FUND $ 9,913,563 $ 76,773,312 $ 77,500,666 $ 4,000 $ 828,326 $ 8,361,883<br />
SPECIAL REVENUE FUNDS<br />
Gas Tax $ 504,802 $ 2,285,502 $ 2,472,040 $ - $ - $ 318,264<br />
Storm Water Management 1,292,063 1,995,780 1,995,483<br />
-<br />
- 1,292,360<br />
Maintenance Districts 1,208,616 1,632,592 1,582,980<br />
-<br />
- 1,258,228<br />
Art in Public Places 10,487<br />
2,000<br />
-<br />
-<br />
-<br />
12,487<br />
Traffic Safety -<br />
-<br />
-<br />
-<br />
-<br />
-<br />
Traffic System Management 608,191<br />
4,000<br />
47,658<br />
-<br />
4,000 560,533<br />
RDA Housing Set-Aside 845,326 185,555 3,226,519 2,917,583<br />
- 721,945<br />
Monument Community Partnership $9,351 2,000<br />
-<br />
-<br />
-<br />
11,351<br />
Housing & Community Services 815,712 1,170,939 1,256,147<br />
-<br />
- 730,504<br />
Total Special Revenue $ 5,294,548 $ 7,278,368 $ 10,580,827 $ 2,917,583 $ 4,000 $ 4,905,672<br />
DEBT SERVICE FUNDS<br />
RDA Tax Allocation Bonds $ 4,665,837 $ 180,000 $ 6,376,571 $ 6,421,131<br />
$ 4,890,397<br />
RDA Revenue Bonds 758,535<br />
15,000<br />
689,340 689,340<br />
773,535<br />
RDA Parking Structure Bonds 756,969<br />
13,000<br />
738,691 738,691<br />
769,969<br />
<strong>Concord</strong> Pavilion Revenue Bonds 1,808,540 1,776,710 1,776,710<br />
-<br />
1,808,540<br />
Assessment Districts 173,804<br />
40,303<br />
40,303<br />
-<br />
173,804<br />
Certifications <strong>of</strong> Participation 67,691<br />
1,500<br />
98,213 96,713<br />
-<br />
67,691<br />
Total Debt Service $ 8,231,376 $ 2,026,513 $ 9,719,828 $ 7,945,875 $ - $ 8,483,936<br />
CAPITAL PROJECTS FUNDS<br />
Measure C $ 496,734 $ 1,566,136 $ 1,482,395 $ - $ - $ 580,475<br />
Measure C I-680 -<br />
-<br />
-<br />
-<br />
-<br />
-<br />
Developers' Fees Parkland 415,473 718,704 1,032,000<br />
-<br />
- 102,177<br />
Developers' Fees O.S.I.P. - 3,862,235 1,368,848<br />
-<br />
- 2,493,387<br />
Developers' Fees Storm Drain/TM 273,176<br />
50,393<br />
-<br />
-<br />
- 323,569<br />
Federal Street Assistance -<br />
-<br />
-<br />
-<br />
-<br />
-<br />
Traffic Congest. Relief/Prop. 1B 909,746<br />
3,513<br />
913,259<br />
-<br />
-<br />
-<br />
Assessment Districts -<br />
-<br />
-<br />
-<br />
-<br />
-<br />
General Reimbursable Projects - 7,063,330 7,794,943 731,613<br />
-<br />
-<br />
Total Capital $ 2,095,129 $ 13,264,311 $ 12,591,445 $ 731,613 $ - $ 3,499,608<br />
ENTERPRISE FUNDS<br />
Sewer $ 12,797,675 $ 18,397,549 $ 21,835,873 $ - $ - $ 9,359,351<br />
Golf Course 55,146 2,326,838 2,234,082<br />
-<br />
- 147,902<br />
Total Enterprise $ 12,852,821 $ 20,724,387 $ 24,069,955 $ - $ - $ 9,507,253<br />
INTERNAL SERVICE FUNDS<br />
Workers' Compensation $ 6,541,584 $ 2,248,082 $ 1,648,153 $ - $ - $ 7,141,513<br />
Risk Management/ Liability 1,550,269 1,413,132 1,472,630<br />
-<br />
- 1,490,771<br />
Post Retirement Healthcare 15,017,484 2,522,275 2,144,181<br />
-<br />
- 15,395,578<br />
Fleet Maintenance 517,121 2,769,451 2,142,886<br />
-<br />
- 1,143,686<br />
Information Technology 2,168,825 6,075,224 6,185,097<br />
-<br />
- 2,058,952<br />
Building Maintenance 516,151 4,264,312 4,169,811<br />
-<br />
- 610,652<br />
Total Internal Service $ 26,311,434 $ 19,292,476 $ 17,762,758 $ - $ - $ 27,841,152<br />
FIDUCIARY FUNDS<br />
Pension Trust $ 51,668,151 $ 4,884,200 $ 4,809,200 $ - $ - $ 51,743,151<br />
REDEVELOPMENT AGENCY $ 7,579,531 $ 15,234,486 $ 9,375,445 $ - $ 10,766,745 $ 2,671,827<br />
TOTAL CITY $ 123,946,553 $ 159,478,053 $ 166,410,124 $ 11,599,071 $ 11,599,071 $ 117,014,482
CITY OF CONCORD<br />
REVENUE SUMMARY BY FUND (INCLUDES TRANSFERS IN)<br />
FOR THE YEAR ENDING JUNE 30, 2008<br />
Adopted Adopted<br />
Actual Actual Actual Budget Budget<br />
2003-04 2004-05 2005-06 2006-07 2007-08<br />
GENERAL FUND $ 64,067,455 $ 70,385,876 $ 72,060,572 $ 71,785,944 $ 76,777,312<br />
SPECIAL REVENUE FUNDS<br />
Gas Tax $ 2,341,754 $ 2,348,210 $ 2,363,710 $ 2,411,108 $ 2,285,502<br />
Storm Water Management 1,947,222 2,000,738 2,134,261 1,992,499 1,995,780<br />
Maintenance Districts 1,396,287 1,415,776 1,410,154 1,423,057 1,632,592<br />
Art in Public Places 731<br />
1,932<br />
4,066<br />
2,000<br />
2,000<br />
Traffic Safety 155,457<br />
-<br />
-<br />
-<br />
-<br />
Traffic System Management 17,194<br />
7,959<br />
5,398<br />
4,000<br />
4,000<br />
RDA Housing Set-Aside 2,617,026 2,742,954 2,848,618 2,801,915 3,103,138<br />
Monument Community Partnership - 665,059 388,940<br />
-<br />
2,000<br />
Housing & Community Services 3,111,070 1,729,562 1,788,776 1,182,629 1,170,939<br />
Total Special Revenue $ 11,586,741 $ 10,912,190 $ 10,943,923 $ 9,817,208 $ 10,195,951<br />
DEBT SERVICE FUNDS<br />
RDA Tax Allocation Bonds $ 80,796,182 $ 1,842,244 $ 3,452,277 $ 6,697,831 $ 6,601,131<br />
RDA Revenue Bonds 602,618 669,613 705,148 701,845 704,340<br />
RDA Parking Structure Bonds 749,353 750,136 748,501 750,092 751,691<br />
<strong>Concord</strong> Pavilion Revenue Bonds 1,760,739 1,796,730 1,793,998 1,778,060 1,776,710<br />
Assessment Districts 603,648 100,377 277,771<br />
-<br />
40,303<br />
Certifications <strong>of</strong> Participation 106,230<br />
97,485 103,356<br />
98,359<br />
98,213<br />
Total Debt Service $ 84,618,770 $ 5,256,585 $ 7,081,051 $ 10,026,187 $ 9,972,388<br />
CAPITAL PROJECTS FUNDS<br />
Measure C $ 2,734,849 $ 1,429,148 $ 1,506,407 $ 1,499,360 $ 1,566,136<br />
Measure C I-680 369,510 397,125 436,543 1,020,000<br />
-<br />
Developers' Fees Parkland 570,495 401,943 1,602,942 3,013,826 718,704<br />
Developers' Fees O.S.I.P. 1,152,962 1,080,146 1,547,556 4,148,870 3,862,235<br />
Developers' Fees Storm Drain/TM 18,962 108,535 279,758 116,871<br />
50,393<br />
Federal Street Assistance 443,605<br />
- 110,245<br />
-<br />
-<br />
Traffic Congestion Relief 1,167<br />
2,112 1,486,554<br />
-<br />
3,513<br />
Assessment Districts 512<br />
449<br />
809<br />
-<br />
-<br />
General Reimbursable Projects 3,589,789 4,597,414 3,530,546 6,120,982 7,794,943<br />
Total Capital $ 8,881,851 $ 8,016,872 $ 10,501,360 $ 15,919,909 $ 13,995,924<br />
ENTERPRISE FUNDS<br />
Sewer $ 14,884,155 $ 15,312,366 $ 18,847,152 $ 16,519,724 $ 18,397,549<br />
Golf Course 1,814,642 1,672,696 1,568,905 1,818,710 2,326,838<br />
Total Enterprise $ 16,698,797 $ 16,985,062 $ 20,416,057 $ 18,338,434 $ 20,724,387<br />
INTERNAL SERVICE FUNDS<br />
Workers' Compensation $ 1,369,537 $ 2,507,030 $ 2,115,969 $ 2,113,464 $ 2,248,082<br />
Risk Management/ Liability 1,005,137 1,316,268 1,765,043 1,363,729 1,413,132<br />
Post Retirement Healthcare 990,177 1,508,077 12,382,870 1,743,278 2,522,275<br />
Fleet Maintenance 1,137,994 2,017,768 2,218,904 2,140,447 2,769,451<br />
Information Technology 2,963,449 4,661,597 3,527,020 3,519,910 6,075,224<br />
Building Maintenance 3,484,783 11,253,537 4,864,423 4,229,732 4,264,312<br />
Total Internal Service $ 10,951,077 $ 23,264,277 $ 26,874,229 $ 15,110,560 $ 19,292,476<br />
FIDUCIARY FUNDS<br />
Pension Trust $ 3,493,456 $ 3,396,251 $ 4,304,530 $ 4,875,000 $ 4,884,200<br />
REDEVELOPMENT AGENCY $ 13,022,754 $ 14,011,972 $ 14,455,228 $ 14,107,870 $ 15,234,486<br />
TOTAL CITY $ 213,320,901 $ 152,229,085 $ 166,636,950 $ 159,981,112 $ 171,077,124
CITY OF CONCORD<br />
EXPENDITURES SUMMARY BY FUND (INCLUDES TRANSFERS OUT)<br />
FOR THE YEAR ENDING JUNE 30, 2008<br />
Adopted Adopted<br />
Actual Actual Actual Budget Budget<br />
2003-04 2004-05 2005-06 2006-07 2007-08<br />
GENERAL FUND<br />
SPECIAL REVENUE FUNDS<br />
$ 63,516,147 $ 65,506,114 $ 79,593,816 $ 72,109,409 $ 78,328,992<br />
Gas Tax $ 1,996,308 $ 2,175,055 $ 1,923,977 $ 2,491,147 $ 2,472,040<br />
Storm Water Management 1,699,739 2,134,840 1,758,934 1,982,201 1,995,483<br />
Maintenance Districts 1,192,975 2,590,753 1,080,867 1,524,738 1,582,980<br />
Art in Public Places -<br />
-<br />
-<br />
-<br />
-<br />
Traffic Safety 189,411<br />
-<br />
-<br />
-<br />
-<br />
Traffic System Management 106,061<br />
72,735<br />
40,330<br />
50,809<br />
51,658<br />
RDA Housing Set-Aside 1,329,726 1,158,628 1,305,374 3,028,242 3,226,519<br />
Monument Community Partnership - 334,928 709,720<br />
-<br />
-<br />
Housing & Community Services 3,049,397 1,514,781 1,608,464 1,440,420 1,256,147<br />
Total Special Revenue<br />
DEBT SERVICE FUNDS<br />
$ 9,563,617 $ 9,981,720 $ 8,427,666 $ 10,517,557 $ 10,584,827<br />
RDA Tax Allocation Bonds $ 88,920,056 $ 4,666,712 $ 6,392,675 $ 6,367,146 $ 6,376,571<br />
RDA Revenue Bonds 701,898 692,854 695,862 686,845 689,340<br />
RDA Parking Structure Bonds 747,779 744,325 745,539 737,092 738,691<br />
<strong>Concord</strong> Pavilion Revenue Bonds 1,779,720 1,777,821 1,781,148 1,778,060 1,776,710<br />
Assessment Districts 645,579 564,537 593,967<br />
-<br />
40,303<br />
Certifications <strong>of</strong> Participation 97,367<br />
99,621<br />
98,973<br />
98,359<br />
98,213<br />
Total Debt Service<br />
CAPITAL PROJECTS FUNDS<br />
$ 92,892,399 $ 8,545,870 $ 10,308,164 $ 9,667,502 $ 9,719,828<br />
Measure C $ 1,148,832 $ 2,004,014 $ 1,054,169 $ 1,533,360 $ 1,482,395<br />
Measure C I-680 332,903 375,253 436,542 1,020,000<br />
-<br />
Developers' Fees Parkland 272,825 263,980 1,339,270 2,435,000 1,032,000<br />
Developers' Fees O.S.I.P. 2,637,859 601,972 2,165,485 4,270,403 1,368,848<br />
Developers' Fees Storm Drain/TM 72,844<br />
4,080<br />
95,449 287,368<br />
-<br />
Federal Street Assistance 298,861<br />
-<br />
4,610<br />
-<br />
-<br />
Traffic Congestion Relief 119,084<br />
61,706<br />
55,906<br />
- 913,259<br />
Assessment Districts 59,455<br />
- 203,145<br />
-<br />
-<br />
General Reimbursable Projects 3,747,993 4,024,293 5,602,673 6,120,982 7,794,943<br />
Total Capital<br />
ENTERPRISE FUNDS<br />
$ 8,690,656 $ 7,335,298 $ 10,957,249 $ 15,667,113 $ 12,591,445<br />
Sewer $ 16,536,922 $ 17,880,681 $ 18,850,426 $ 18,496,932 $ 21,835,873<br />
Golf Course 1,841,338 1,776,241 1,637,795 1,808,041 2,234,082<br />
Total Enterprise<br />
INTERNAL SERVICE FUNDS<br />
$ 18,378,260 $ 19,656,922 $ 20,488,221 $ 20,304,973 $ 24,069,955<br />
Workers' Compensation $ 2,853,932 $ 2,236,665 $ 1,498,064 $ 1,502,001 $ 1,648,153<br />
Risk Management/ Liability 560,852 1,727,582 1,305,706 1,581,267 1,472,630<br />
Post Retirement Healthcare 1,006,874 1,262,880 1,483,181 1,554,656 2,144,181<br />
Fleet Maintenance 2,099,164 2,209,830 2,327,692 2,394,822 2,142,886<br />
Information Technology 3,029,322 3,475,080 3,510,335 3,616,797 6,185,097<br />
Building Maintenance 4,903,135 5,403,351 5,335,420 4,092,081 4,169,811<br />
Total Internal Service<br />
FIDUCIARY FUNDS<br />
$ 14,453,279 $ 16,315,388 $ 15,460,398 $ 14,741,624 $ 17,762,758<br />
Pension Trust $ 4,696,682 $ 4,700,176 $ 4,685,086 $ 4,800,000 $ 4,809,200<br />
REDEVELOPMENT AGENCY $ 16,131,969 $ 10,860,271 $ 14,578,498 $ 16,611,847 $ 20,142,190<br />
TOTAL CITY $ 228,323,009 $ 142,901,759 $ 164,499,098 $ 164,420,025 $ 178,009,195
OPERATING EXPENDITURES SUMMARY BY ORGANIZATION<br />
FOR THE YEAR ENDING JUNE 30, 2008<br />
Adopted Adopted<br />
Actual Actual Actual Budget Budget<br />
2003-04 2004-05 2005-06 2006-07 2007-08<br />
General Government:<br />
Building and Neighborhood Services (1) $ 247,463 $ 330,347 $ 312,644 $ - $<br />
-<br />
Building, Engineering & Neighborhood 3,969,128 4,196,896 4,741,979 4,733,762 6,341,313<br />
<strong>City</strong> Attorney 2,029,487 1,114,271 1,516,083 1,554,004 1,582,448<br />
<strong>City</strong> Management 2,686,732 3,000,818 2,817,207 3,125,545 3,445,586<br />
Community & Recreation Services 5,868,938 7,482,459 7,232,649 7,373,926 8,879,863<br />
Finance 3,309,787 3,383,324 3,577,873 4,998,978 4,710,501<br />
Reserve Funds-Intra Fund Transfers 2,860,115<br />
- 900,000 200,000 200,000<br />
General Fund Capital Projects 2,106,681 1,307,215 1,731,378 906,658 731,613<br />
Human Resources 3,104,224 1,485,197 1,524,275 1,977,419 1,898,974<br />
Information Technology 2,093,757 2,183,532 2,612,976 2,901,973 5,089,217<br />
Planning and Economic Development 17,107,122 10,974,442 13,481,115 17,790,509 18,491,461<br />
Police 29,944,607 35,478,630 35,438,021 38,077,690 39,817,538<br />
Public Works 15,983,215 16,537,795 17,236,606 18,285,037 20,154,366<br />
Storm Water Management 1,521,649 1,558,495 1,758,935 1,802,001 1,995,483<br />
Total General Government $ 92,832,905 $ 89,033,421 $ 94,881,741 $ 103,727,502 $ 113,338,363<br />
Enterprise Funds:<br />
Golf Course Enterprise $ 1,646,328 $ 1,586,305 $ 1,470,527 $ 1,769,565 $ 1,697,557<br />
Sewer Enterprise 12,491,705 13,839,718 14,834,521 14,624,142 15,287,979<br />
Total Enterprise Fund $ 14,138,033 $ 15,426,023 $ 16,305,048 $ 16,393,707 $ 16,985,536<br />
Total Operating Budget by Organization $ 106,970,938 $ 104,459,444 $ 111,186,789 $ 120,121,209 $ 130,323,899<br />
Add:<br />
Capital Improvement Projects (2) $ 23,762,990 $ 25,196,269 $ 38,319,059 $ 29,831,314 $ 33,156,268<br />
Debt Service Payment 92,892,399 8,545,870 10,308,164 9,667,502 9,719,828<br />
Pension Trust 4,696,682 4,700,176 4,685,086 4,800,000 4,809,200<br />
Total Organization $ 228,323,009 $ 142,901,759 $ 164,499,098 $ 164,420,025 $ 178,009,195<br />
(1) In January, 2006, Building & Neighborhood Services programs were transferred to other <strong>City</strong> departments.<br />
(2) Not all Capital Improvement Projects, Debt Service payments and book depreciation were included in the<br />
the department's operating budget.
Adopted Adopted<br />
Actual Actual Actual Budget Budget<br />
2003-04 2004-05 2005-06 2006-07 2007-08<br />
Expenditures<br />
Personnel:<br />
Full-time $ 2,123,679 $ 1,973,638 $ 1,988,263 $ 2,124,350 $ 2,171,441<br />
Part-time 224,217 156,006 406,882<br />
73,579 328,662<br />
Overtime 17,827<br />
17,345<br />
41,844<br />
10,851<br />
13,158<br />
Benefits 972,468 1,332,703 1,488,587 1,585,133 1,712,889<br />
Total Salaries and Benefits $ 3,338,191 $ 3,479,692 $ 3,925,576 $ 3,793,913 $ 4,226,150<br />
Operating Expenses $ 311,714 $ 276,501 $ 330,648 $ 482,770 $ 782,289<br />
Fixed Charges:<br />
Fleet $ 27,224 $ 78,610 $ 81,371 $ 89,602 $ 129,480<br />
Information Technology 234,129 279,919 278,450 251,182 984,799<br />
Buildings 49,212<br />
56,957<br />
67,181<br />
72,812<br />
67,070<br />
Risk Mgmt./Liability -<br />
25,217<br />
58,753<br />
43,483 151,525<br />
Total Fixed Charges $ 310,565 $ 440,703 $ 485,755 $ 457,079 $ 1,332,874<br />
Other Financing Uses 8,658<br />
<strong>City</strong> <strong>of</strong> <strong>Concord</strong><br />
Departmental Budget Summary<br />
All Funding Sources<br />
For the Year Ending June 30, 2008<br />
Building, Engineering & Neighborhood Services<br />
Total Expenditures $ 3,969,128 $ 4,196,896 $ 4,741,979 $ 4,733,762 $ 6,341,313<br />
Funding Sources<br />
General Fund $ 3,529,724 $ 4,050,835 $ 4,588,727 $ 4,569,216 $ 6,183,847<br />
C.D.B.G. 109,611 126,000 118,952 124,995 105,769<br />
RDA Set Aside 329,793<br />
20,061<br />
34,300<br />
39,551<br />
51,697<br />
$ 3,969,128 $ 4,196,896 $ 4,741,979 $ 4,733,762 $ 6,341,313<br />
Personnel Allocation<br />
Full-time 47.00 47.00 47.00 45.00 44.00<br />
Part-time (FTE) 1.9 2.61 2.61 2.88 4.9<br />
Note: Positions shown here are allocated to this department but may charge to other departments or capital projects and may<br />
and do not show as a FTE on the Department's Program Summary.<br />
Significant Changes<br />
2003-04 Reduced FY' 04 operating budget by over $100,000 (7.8% savings) by eliminating one vacant<br />
Construction Inspector position and reducing consultant costs.<br />
2004-05 Reduced overtime and operating expenses for a total savings <strong>of</strong> $77,453. Benefit increases reflect<br />
higher costs to fund PERS retirement, health insurance, post-retirement medical, and workers'<br />
compensation.<br />
2005-06 Full-time includes one position considered overfilled by attrition plan. Benefits increase reflects<br />
higher costs for health and dental insurance, workers compensation and PERS retirement.<br />
2006-07 The Engineering department was expanded to include the Building, Multi-Family Housing & Neighborhood<br />
Preservation programs in FY2005/06. Full-time reflects the attrition reduction <strong>of</strong> two positions.<br />
Operating Expenses reflect the use <strong>of</strong> outside consultants in the Building program and higher building rent.<br />
Benefits increases reflect higher costs for health insurance and PERS retirement.<br />
2007-08 Full-time includes one position considered overfilled by attrition plan and the transfer <strong>of</strong> one position<br />
to the finance department. Part-time includes additional project management, pr<strong>of</strong>essional, technical and<br />
clerical help needed. Benefits increase reflect higher costs for health and dental insurances and PERS<br />
retirement. Fixed charges reflect adjustment to include actual services and/or equipment provided by<br />
internal service funds.<br />
-<br />
-<br />
-<br />
-
Adopted Adopted<br />
Actual Actual Actual Budget Budget<br />
2003-04 2004-05 2005-06 2006-07 2007-08<br />
Expenditures<br />
Personnel:<br />
Full-time $ 582,018 $ 612,219 $ 626,942 $ 715,817 $ 724,548<br />
Part-time -<br />
-<br />
742<br />
-<br />
-<br />
Overtime -<br />
-<br />
-<br />
-<br />
-<br />
Benefits 192,064 279,534 295,882 372,742 346,449<br />
Total Salaries and Benefits $ 774,082 $ 891,753 $ 923,566 $ 1,088,559 $ 1,070,997<br />
Operating Expenses $ 1,168,519 $ 136,517 $ 507,445 $ 381,765 $ 392,872<br />
Fixed Charges:<br />
Fleet<br />
Information Technology $ 33,297 $ 40,077 $ 38,990 $ 34,079 $ 60,012<br />
Buildings 38,604 43,844 43,946 47,406 55,609<br />
Risk Mgmt./Liability -<br />
2,080<br />
2,136<br />
2,195<br />
2,958<br />
Total Fixed Charges $ 71,901 $ 86,001 $ 85,072 $ 83,680 $ 118,579<br />
Other Financing Uses 14,985<br />
<strong>City</strong> <strong>of</strong> <strong>Concord</strong><br />
Departmental Budget Summary<br />
All Funding Sources<br />
For the Year Ending June 30, 2008<br />
<strong>City</strong> Attorney<br />
Total Expenditures $ 2,029,487 $ 1,114,271 $ 1,516,083 $ 1,554,004 $ 1,582,448<br />
Funding Sources<br />
General Fund $ 2,009,199 $ 1,104,394 $ 1,483,486 $ 1,554,004 $ 1,582,448<br />
RDA Set Aside 20,288<br />
9,877 32,597<br />
-<br />
-<br />
RDA Tax Increment -<br />
-<br />
-<br />
-<br />
-<br />
$ 2,029,487 $ 1,114,271 $ 1,516,083 $ 1,554,004 $ 1,582,448<br />
Personnel Allocation<br />
Full-time 6.00 6.00 6.00 6.00 6.00<br />
Part-time (FTE) 0.16 0.05 0.13 0 0<br />
Note: Positions shown here are allocated to this department but may charge to other departments or capital projects and may<br />
not show as a FTE on the Department's Program Summary.<br />
Significant Changes<br />
2003-04 Reduced operating budget by $15,110 or approximately 1.2% <strong>of</strong> operating budget in staff time and<br />
operating expenditures.<br />
2004-05 Moved liability from <strong>City</strong> Attorney to an internal service fund. Each department and/or fund is<br />
charged a fee based on a formula which includes number <strong>of</strong> personnel, vehicles and prior claims.<br />
Benefit increases reflect higher costs to fund PERS retirement, health insurance premiums, postretirement<br />
medical, and workers' compensation. Reduced part-time for a $3,500 savings.<br />
2005-06 Benefits increase reflects higher costs for health and dental insurance and PERS retirement.<br />
Includes projected increase in need for part-time clerical services.<br />
2006-07 Full-time increase reflects the revaluation <strong>of</strong> certain positions. Benefits increase reflects higher<br />
costs for health insurance and PERS retirement.<br />
2007-08 Benefits decrease reflects changes in health and dental plan coverage options by department staff.<br />
Fixed charges reflect adjustment to include actual services and/or equipment provided by<br />
internal service funds.<br />
-<br />
-<br />
-<br />
-
Adopted Adopted<br />
Actual Actual Actual Budget Budget<br />
2003-04 2004-05 2005-06 2006-07 2007-08<br />
Expenditures<br />
Personnel:<br />
Full-time $ 1,284,411 $ 1,288,984 $ 1,126,075 $ 1,262,201 $ 1,374,930<br />
Part-time 12,076<br />
16,517<br />
16,871<br />
25,874<br />
25,880<br />
Overtime 14,943<br />
9,622<br />
3,318<br />
-<br />
-<br />
Benefits 478,621 642,035 652,109 738,141 765,117<br />
Total Salaries and Benefits $ 1,790,051 $ 1,957,158 $ 1,798,373 $ 2,026,216 $ 2,165,927<br />
Operating Expenses $ 432,319 $ 486,747 $ 465,173 $ 592,834 $ 545,098<br />
Fixed Charges:<br />
Fleet $ 640 $ 2,683 $ 2,761 $ 2,721 $ 4,071<br />
Information Technology 297,592 365,361 383,676 322,785 571,917<br />
Buildings 137,630 158,537 157,966 171,479 146,876<br />
Risk Mgmt./Liability -<br />
9,012<br />
9,258<br />
9,510<br />
11,697<br />
Total Fixed Charges $ 435,862 $ 535,593 $ 553,661 $ 506,495 $ 734,561<br />
Other Financing Uses 28,500<br />
<strong>City</strong> <strong>of</strong> <strong>Concord</strong><br />
Departmental Budget Summary<br />
All Funding Sources<br />
For the Year Ending June 30, 2008<br />
<strong>City</strong> Management<br />
21,320<br />
Total Expenditures $ 2,686,732 $ 3,000,818 $ 2,817,207 $ 3,125,545 $ 3,445,586<br />
Funding Sources<br />
General Fund $ 2,686,732 $ 3,000,818 $ 2,817,207 $ 3,125,545 $ 3,445,586<br />
Personnel Allocation<br />
Full-time 25.00 24.00 21.00 21.00 21.00<br />
Part-time (FTE) 0.06 0.74 0.74 0.9 0.9<br />
Note: Positions shown here are allocated to this department but may charge to other departments or capital projects and may<br />
show as a FTE on the Department's Program Summary.<br />
Significant Changes<br />
2003-04 Department reduced budget by $108,837 (about 3.8%) by eliminating a vacant Senior Administrative<br />
Analyst position and by reducing various operating costs without reducing services.<br />
2004-05 Budget was reduced by eliminating one position less increased part-time coverage for a<br />
total reduction <strong>of</strong> $40,545. Benefit increases reflect higher costs to fund PERS retirement, health<br />
insurance, post-retirement medical, and workers' compensation.<br />
2005-06 Budget includes the reduction <strong>of</strong> one position per <strong>City</strong> attrition plan and transfer <strong>of</strong> two positions<br />
to Information Technology. Operating expenses are lower due to reduced supply requirements during<br />
non-election year. Benefits increase reflects higher costs for health and dental insurance and<br />
PERS retirement.<br />
2006-07 Benefits increase reflects higher costs for health insurance and PERS retirement.<br />
Operating expenses higher due to supply requirements during an election year.<br />
2007-08 Benefits increase reflect higher costs for health and dental insurances and PERS retirement. Operating<br />
expenses are lower due to reduced supply requirements during non-election year partially <strong>of</strong>fset by increases<br />
to meetings & conferences. Fixed charges reflect adjustment to include actual services and/or equipment<br />
provided by internal service funds.<br />
-<br />
-<br />
-
Adopted Adopted<br />
Actual Actual Actual Budget Budget<br />
2003-04 2004-05 2005-06 2006-07 2007-08<br />
Expenditures<br />
Personnel:<br />
Full-time $ 1,248,533 $ 1,446,576 $ 1,289,623 $ 1,409,570 $ 1,450,787<br />
Part-time 850,772 1,187,024 1,222,627 1,463,440 1,754,100<br />
Overtime 25,919<br />
14,881<br />
6,728<br />
-<br />
-<br />
Benefits 683,863 937,705 906,677 1,019,264 1,078,401<br />
Total Salaries and Benefits $ 2,809,087 $ 3,586,186 $ 3,425,655 $ 3,892,274 $ 4,283,288<br />
Operating Expenses $ 1,942,463 $ 2,438,968 $ 2,328,760 $ 1,928,820 $ 2,142,493<br />
Fixed Charges:<br />
Fleet $ 22,274 $ 47,341 $ 48,164 $ 55,166 $ 60,855<br />
Computer/Equipment 200,144 233,464 248,413 225,825 645,132<br />
Buildings 798,829 941,094 935,088 1,023,382 1,579,539<br />
Liability - 140,816 144,659 148,600<br />
67,090<br />
Total Fixed Charges $ 1,021,247 $ 1,362,715 $ 1,376,324 $ 1,452,973 $ 2,352,616<br />
Other Financing Uses 96,141<br />
<strong>City</strong> <strong>of</strong> <strong>Concord</strong><br />
Departmental Budget Summary<br />
All Funding Sources<br />
For the Year Ending June 30, 2008<br />
Community & Recreation Services<br />
94,590<br />
101,910<br />
99,859<br />
101,466<br />
Total Expenditures $ 5,868,938 $ 7,482,459 $ 7,232,649 $ 7,373,926 $ 8,879,863<br />
Funding Sources<br />
General Fund $ 4,935,180 $ 5,938,401 $ 5,814,776 $ 6,063,792 $ 7,404,849<br />
C.D.B.G. 499,394 517,096 529,701 453,004 451,563<br />
GF Reimbursable Project 374,364 632,034 602,040 792,130 968,451<br />
First Five - 334,928 209,903<br />
-<br />
-<br />
Child Care 60,000<br />
60,000<br />
76,229<br />
65,000<br />
55,000<br />
$ 5,868,938 $ 7,482,459 $ 7,232,649 $ 7,373,926 $ 8,879,863<br />
Personnel Allocation<br />
Full-time 22.00 24.00 21.00 20.00 20.00<br />
Part-time (FTE) 44.35 77.63 69.68 72.62 79.11<br />
Note: Positions shown here are allocated to this department but charge to other departments or capital projects<br />
and may not show as a FTE on the Department's Program Summary.<br />
Significant Changes<br />
2003-04 Budget includes a new grant program with MDUSD, part-time reductions and revenue enhancements in the<br />
Recreation Division. Expenditure reductions and revenue enhancements results in a $206,600 savings.<br />
2004-05 Eliminated 1 full-time position and reduced operational expenses for a total savings <strong>of</strong> $44,000.<br />
Benefits increases reflect higher costs to fund PERS retirement, health insurance, and workers' comp.<br />
2005-06 Budget includes the reduction <strong>of</strong> one position per <strong>City</strong> attrition plan. During FY2004-05 Parks &<br />
Facilities maintenance duties were transferred to Public Works. Benefits increase reflects higher<br />
costs for health and dental insurance and PERS retirement.<br />
2006-07 This department was expanded to include the Community Services program in FY2005/06. Full-Time<br />
reflects the transfer <strong>of</strong> the recreation utility worker to Public Works. Part-time reflects the additional<br />
requirements <strong>of</strong> the community services and facilities & operations programs. Benefits increase<br />
reflects higher costs for health insurance and PERS retirement. Operating expenses include the higher<br />
cost energy utilities and more use <strong>of</strong> contractors for fee based programs.<br />
2007-08 Part-time reflects the additional assistance needed to support expanding fee based programs. Benefits<br />
increases reflects higher costs for health and dental insurances and PERS retirement. Operating expenses<br />
include increases in supplies, meetings & conferences, staff development and more use <strong>of</strong> contractors for<br />
fee based programs. Fixed charges show adjustment to include actual services and/or equipment provided<br />
by internal service funds.
<strong>City</strong> <strong>of</strong> <strong>Concord</strong><br />
Departmental Budget Summary<br />
All Funding Sources<br />
For the Year Ending June 30, 2008<br />
Finance<br />
Adopted Adopted<br />
Actual Actual Actual Budget Budget<br />
2003-04 2004-05 2005-06 2006-07 2007-08<br />
Expenditures<br />
Personnel:<br />
Full-time $ 1,492,489 $ 1,482,578 $ 1,510,036 $ 1,702,431 $ 1,796,290<br />
Part-time 30,936 19,761 37,148<br />
-<br />
-<br />
Overtime 2,048 19,844<br />
6,924<br />
-<br />
-<br />
Benefits 618,803 754,112 808,341 1,011,387 998,856<br />
Total Salaries and Benefits $ 2,144,276 $ 2,276,295 $ 2,362,449 $ 2,713,818 $ 2,795,146<br />
Operating Expenses $ 792,512 $ 535,684 $ 588,301 $ 761,941 $ 962,106<br />
Fixed Charges:<br />
Fleet $ 571 $ 5,939 $ 6,226 $ 5,463 $ 6,591<br />
Information Technology 181,131 217,971 211,480 601,103 732,751<br />
Buildings 191,297 336,256 397,933 904,856 188,899<br />
Risk Mgmt./Liability - 11,179 11,484<br />
11,797<br />
25,008<br />
Total Fixed Charges $ 372,999 $ 571,345 $ 627,123 $ 1,523,219 $ 953,249<br />
Total Department Expenditures $ 3,309,787 $ 3,383,324 $ 3,577,873 $ 4,998,978 $ 4,710,501<br />
Other Financing Uses<br />
Fund Transfers Out $ 100,000 $ 100,000 $ 612,944 $ - $ 834,595<br />
Reserve Funds 2,860,115<br />
- 900,000 200,000 200,000<br />
Capital Projects 2,106,681 1,307,215 1,731,378 906,658 731,613<br />
Total Other Financing Uses $ 5,066,796 $ 1,407,215 $ 3,244,322 $ 1,106,658 $ 1,766,208<br />
Total Expenditures $ 8,376,583 $ 4,790,539 $ 6,822,195 $ 6,105,636 $ 6,476,709<br />
Funding Sources<br />
General Fund $ 8,355,903 $ 4,768,218 $ 6,794,426 $ 6,076,919 $ 6,476,709<br />
C.D.B.G. 20,680 22,321 27,767<br />
28,717<br />
-<br />
$ 8,376,583 $ 4,790,539 $ 6,822,193 $ 6,105,636 $ 6,476,709<br />
Personnel Allocation<br />
Full-time 26.00 26.00 26.00 26.00 27.00<br />
Part-time (FTE) 1.49 1.5 1.50<br />
Note: Positions shown here are allocated to this department but charge to other departments or capital projects<br />
and may not show as a FTE on the Department's Program Summary.<br />
Significant Changes<br />
2003-04 Convention and Visitors Bureau budget reduced $27,159 from that projected due to funding agreement with Contra<br />
Costa County. Added reserve funds to cover increasing benefits costs, downturn in the economy and possible loss <strong>of</strong><br />
State and/or Federal funding.<br />
2004-05 Reserve funds have reached the required 20% <strong>of</strong> expenditures and continued funding has been moved out one year.<br />
Department reduced operating expenditures by decreasing contractual services, travel, conferences, and vehicles for a<br />
total savings <strong>of</strong> $8,140. Benefit increase reflects higher costs to fund PERS retirement, health insurance, post-retirement<br />
medical, and workers' compensation. Funding for the Convention and Visitors Bureau has been reduced by $50,000.<br />
2005-06 Added $200,000 to Unforecasted and $200,000 to Maintenance & Capital reserve funds. In-lieu <strong>of</strong> reducing department<br />
by one position per attrition plan, part-time salaries and benefits were eliminated. Salaries reflect the upward revaluation<br />
several department positions. Benefits increase can be attributed to higher costs for health and dental insurance and PERS<br />
retirement. Operating expenses include an increase for auditing special revenue contracts, the elimination <strong>of</strong> $191,405 in<br />
funding for the Convention and Visitors Bureau and a transfer <strong>of</strong> $512,944 to the post retirement health benefit fund.<br />
2006-07 Benefits increase reflects higher costs for health insurance and PERS retirement. Operating expenses include the 47%<br />
increase in cost for animal control services and the restatement <strong>of</strong> additional contributions to the post retirement health<br />
benefit fund. Fixed charges include increases necessary to internal service fund charges primarily due to higher building<br />
maintenance and information technology costs.<br />
2007-08 Full-time includes the transfer <strong>of</strong> one position from BE&NS to the Finance department. Benefits decrease reflects changes<br />
in health and dental plan coverage options by department staff. Operating expenses include the 14% increase in cost for<br />
animal control services. Fixed charges show adjustment to eliminate the inclusion <strong>of</strong> unassigned internal service fund<br />
fees to this department and the actual services and/or equipment provided by internal service funds. Other financing<br />
includes General Fund support provided to Golf Course operations, Maintenance Districts & CIP projects.
<strong>City</strong> <strong>of</strong> <strong>Concord</strong><br />
Departmental Budget Summary<br />
All Funding Sources<br />
For the Year Ending June 30, 2008<br />
Human Resources<br />
Adopted Adopted<br />
Actual Actual Actual Budget Budget<br />
2003-04 2004-05 2005-06 2006-07 2007-08<br />
Expenditures<br />
Personnel:<br />
Full-time $ 666,220 $ 547,037 $ 549,308 $ 762,963 $ 805,772<br />
Part-time 14,711<br />
13,722<br />
4,041<br />
-<br />
-<br />
Overtime -<br />
-<br />
3,415<br />
-<br />
Benefits 244,673 263,501 347,016 424,405 401,339<br />
Total Salaries and Benefits $ 925,604 $ 824,260 $ 900,365 $ 1,187,368 $ 1,207,111<br />
Operating Expenses $ 1,469,568 $ 529,779 $ 495,490 $ 400,889 $ 479,371<br />
Fixed Charges:<br />
Fleet $ - $ - $ - $ - $<br />
-<br />
Information Technology 85,464 101,423<br />
98,540<br />
83,886 164,476<br />
Buildings 23,588<br />
26,789<br />
26,853<br />
28,968<br />
44,117<br />
Risk Mgmt./Liability 600,000<br />
2,946<br />
3,027 276,308<br />
3,899<br />
Total Fixed Charges $ 709,052 $ 131,158 $ 128,420 $ 389,162 $ 212,492<br />
Total Expenditures $ 3,104,224 $ 1,485,197 $ 1,524,275 $ 1,977,419 $ 1,898,974<br />
Funding Resources<br />
General Fund $ 2,960,024 $ 1,346,775 $ 1,487,844 $ 1,936,655 $ 1,838,992<br />
Post Retirement Health 80,351<br />
63,963<br />
1,839<br />
-<br />
-<br />
Workers' Compensation 63,849<br />
74,459<br />
34,592<br />
40,764<br />
59,982<br />
$ 3,104,224 $ 1,485,197 $ 1,524,275 $ 1,977,419 $ 1,898,974<br />
Personnel Allocation<br />
Full-time 9.00 8.00 8.00 9.00 9.00<br />
Part-time (FTE) 0.00 0.00<br />
Note: Positions shown here are allocated to this department but charge to other departments or capital projects<br />
and may not show as a FTE on the Department's Program Summary.<br />
Significant Changes<br />
2003-04 Reduction <strong>of</strong> $92,248 comprised <strong>of</strong> training programs and part-time staffing cuts; as well as<br />
reduction in recruitment and selection expenditures.<br />
2004-05 Funding for post-retirement medical has been removed from this department and distributed to all<br />
departments as a percentage <strong>of</strong> salary. Department eliminated one position and reduced several<br />
operating expenses for at total savings <strong>of</strong> $102,389. Benefit increases reflect higher costs to fund<br />
PERS retirement, health insurance, post-retirement medical, and workers' compensation.<br />
2005-06 The department was restructured to be managed by a Director instead <strong>of</strong> an Asst. <strong>City</strong> Manager<br />
and two positions were upgraded to reflect additional responsibilities. Benefits increase can be<br />
attributed to higher costs for health and dental insurance and PERS retirement.<br />
2006-07 An analyst position was added to the department. Benefit increases can be attributed to<br />
higher costs for health insurance and PERS retirement. Fixed charges reflect the transfer <strong>of</strong> funds<br />
for the judgment obligation bond debt service from the General Fund to the Liability Insurance<br />
Internal Service Fund.<br />
2007-08 Benefits decrease reflects changes in health and dental plan coverage options by department staff.<br />
Operating expenses include the increased costs for property insurance. Fixed charges show adjustment<br />
eliminating the inclusion <strong>of</strong> unassigned internal service fund fees to this department and the actual<br />
services and/or equipment provided by internal service funds.
<strong>City</strong> <strong>of</strong> <strong>Concord</strong><br />
Departmental Budget Summary<br />
All Funding Sources<br />
For the Year Ending June 30, 2008<br />
Information Technology<br />
Adopted Adopted<br />
Actual Actual Actual Budget Budget<br />
2003-04 2004-05 2005-06 2006-07 2007-08<br />
Expenditures<br />
Personnel:<br />
Full-time $ 809,628 $ 846,975 $ 788,541 $ 1,063,295 $ 1,410,760<br />
Part-time 30,267<br />
29,101<br />
35,884<br />
62,745 119,726<br />
Overtime 26,135<br />
61,894<br />
61,432<br />
49,890<br />
60,790<br />
Benefits 318,189 480,493 461,056 610,809 826,145<br />
Total Salaries and Benefits $ 1,184,219 $ 1,418,463 $ 1,346,913 $ 1,786,739 $ 2,417,421<br />
Operating Expenses $ 733,978 $ 587,977 $ 1,087,799 $ 935,419 $ 2,599,552<br />
Fixed Charges:<br />
Fleet $ - $ - $ - $ - $<br />
-<br />
Information Technology 130,040 129,739 129,751 130,092<br />
-<br />
Buildings 45,520<br />
47,353<br />
48,513<br />
49,723<br />
60,278<br />
Risk Mgmt./Liability -<br />
-<br />
-<br />
-<br />
11,966<br />
Total Fixed Charges $ 175,560 $ 177,092 $ 178,264 $ 179,815 $ 72,244<br />
Total Expenditures $ 2,093,757 $ 2,183,532 $ 2,612,976 $ 2,901,973 $ 5,089,217<br />
Funding Sources<br />
Information Tech. ISF $ 2,093,757 $ 2,183,532 $ 2,612,976 $ 2,901,973 $ 5,089,217<br />
General Fund -<br />
-<br />
-<br />
-<br />
-<br />
$ 2,093,757 $ 2,183,532 $ 2,612,976 $ 2,901,973 $ 5,089,217<br />
Personnel Allocation<br />
Full-time 12.00 12.00 14.00 14.00 18.00<br />
Part-time (FTE) 1.55 1.33 0.81 1.33 1.99<br />
Note: Positions shown here are allocated to this department but charge to other departments or capital projects<br />
and may not show as a FTE on the Department's Program Summary.<br />
Significant Changes<br />
2003-04 Budget reductions in the amount <strong>of</strong> $11,276 or one-half <strong>of</strong> the operating budget. Reduced<br />
annual maintenance costs $11,000 by retiring several pieces <strong>of</strong> equipment. The balance from<br />
consultant or contractor services. The increase in part-time is <strong>of</strong>fset by consultant services.<br />
2004-05 Benefit increases reflect higher costs to fund PERS retirement, health insurance, post-retirement,<br />
and workers' compensation. Department added the maintenance agreement for new financial system.<br />
2005-06 Operating expense increase due to the transfer <strong>of</strong> various hardware and s<strong>of</strong>tware maintenance<br />
agreements from other departments to information technology. Includes the transfer <strong>of</strong> two positions<br />
from <strong>City</strong> Management, Web Coordinator & Programmer. Benefits increase can be attributed to<br />
higher costs for health and dental insurance and PERS retirement.<br />
2006-07 Full-time increase reflects the revaluation <strong>of</strong> certain positions. Part-time & over-time reflect the<br />
increased need for technology services. Benefits increase indicates the higher costs for health<br />
insurance and PERS retirement.<br />
2007-08 The information technology department duties were expanded to provide all the information technology<br />
support required by the Police department. Full-time includes the transfer <strong>of</strong> four positions from the<br />
Police department. Part-time & over-time reflect the increased need for technology services. Benefit<br />
increases include the transfer <strong>of</strong> four positions and the higher costs for health and dental insurances and<br />
PERS retirement. Operating expenses include the transfer <strong>of</strong> information technology expenses previously<br />
included in the Police department and increased costs for contracts & agreements, contract consultants<br />
and the East Bay Regional Communication System agreement.
<strong>City</strong> <strong>of</strong> <strong>Concord</strong><br />
Departmental Budget Summary<br />
All Funding Sources<br />
For the Year Ending June 30, 2008<br />
Planning and Economic Development<br />
Adopted Adopted<br />
Actual Actual Actual Budget Budget<br />
2003-04 2004-05 2005-06 2006-07 2007-08<br />
Expenditures<br />
Personnel:<br />
Full-time $ 1,974,704 $ 1,920,775 $ 1,789,942 $ 2,036,640 $ 2,100,986<br />
Part-time 50,171<br />
46,185<br />
39,525<br />
75,670<br />
60,914<br />
Overtime 26,599<br />
31,779<br />
18,097<br />
42,381<br />
33,047<br />
Benefits 714,259 989,696 925,449 1,164,109 1,163,875<br />
Total Salaries and Benefits $ 2,765,733 $ 2,988,435 $ 2,773,013 $ 3,318,800 $ 3,358,822<br />
Operating Expenses $ 1,434,719 $ 1,096,136 $ 1,822,520 $ 1,714,631 $ 1,869,575<br />
Fixed Charges:<br />
Fleet $ 10,556 $ 8,965 $ 10,913 $ 11,096 $ 10,721<br />
Information Technology 184,912 201,785 205,186 200,523 634,330<br />
Buildings 156,195<br />
28,329<br />
28,183<br />
29,980 157,487<br />
Risk Mgmt./Liability -<br />
13,865<br />
14,244<br />
31,503<br />
20,032<br />
Total Fixed Charges $ 351,663 $ 252,944 $ 258,526 $ 273,102 $ 822,570<br />
Other Financing Uses $ 12,555,007 $ 6,636,927 $ 8,627,056 $ 12,483,976 $ 12,440,494<br />
Total Expenditures $ 17,107,122 $ 10,974,442 $ 13,481,115 $ 17,790,509 $ 18,491,461<br />
Funding Sources<br />
General Fund $ 1,519,345 $ 1,662,186 $ 1,513,787 $ 1,762,074 $ 2,040,471<br />
RDA Set Aside 859,900 938,936 1,112,606 1,479,812 1,718,324<br />
Housing Assistance 1,023<br />
6,846<br />
14,432<br />
28,217<br />
61,920<br />
Housing Conservation 178,747 176,400 166,532 230,229 148,076<br />
RDA Programs 14,548,107 8,190,074 10,673,758 14,290,177 14,522,670<br />
$ 17,107,122 $ 10,974,442 $ 13,481,115 $ 17,790,509 $ 18,491,461<br />
Personnel Allocation<br />
Full-time 28.00 28.00 27.00 25.00 26.00<br />
Part-time (FTE) 2 1.19 1.43 1.68 1.22<br />
Note: Positions shown here are allocated to this department but charge to other departments or capital projects<br />
and may not show as a FTE on the Department's Program Summary.<br />
Significant Changes<br />
2003-04 General Fund includes various budget reductions for a total <strong>of</strong> $12,000 and elimination <strong>of</strong><br />
one Planner position. This plan includes future savings <strong>of</strong> $95,196 through the elimination <strong>of</strong> one<br />
Assistant Planner position in FY'06. Redevelopment Fund includes repayment <strong>of</strong> ERAF-Educational<br />
Educational Revenue Augment Fund <strong>of</strong> $3,379,292 as requested by the State. An increase in capital<br />
projects funding <strong>of</strong> approximately $300,000. Also includes funding in the amount <strong>of</strong> $1,000,000 for the<br />
implementation <strong>of</strong> the RDA Strategic Plan and $400,000 for the initiation <strong>of</strong> the new RDA area.<br />
$400,000 for the initiation <strong>of</strong> the new RDA area.<br />
2004-05 Funding for two downtown foot beat <strong>of</strong>ficers and 50% <strong>of</strong> Downtown Coordinator moved from RDA to<br />
General Fund. Department reduced operating expenses in the amount <strong>of</strong> $11,400. Benefit increases<br />
reflect higher costs to fund PERS retirement, health insurance, post-retirement medical and<br />
workers' compensation.<br />
2005-06 Budget includes the reduction <strong>of</strong> one <strong>of</strong> three positions per <strong>City</strong> attrition plan. Two other positions are<br />
included in salaries and benefits as overfills. Other Financing reflects the savings achieved ($1.2 million)<br />
from a 2004 refinancing <strong>of</strong> certain Tax Allocation Bonds. Benefits increase reflects higher costs for<br />
health and dental insurance and PERS retirement.<br />
2006-07 This department was expanded to include the Housing Services program in FY2005/06. Full-Time<br />
reflects the attrition reduction <strong>of</strong> one position and the reassignment <strong>of</strong> one position due to the FY2005-06<br />
reorganization. Benefits increase reflects higher costs for health insurance and PERS retirement.<br />
Operating expenses include additional contractual services for business development. Other financing<br />
includes adjustment for latest cost allocation plan.<br />
2007-08 Full-time positions include the addition <strong>of</strong> a Community Services Officer for the Downtown District and<br />
one position included as an overfill. Operating expenses include interfund billing for legal services. Fixed<br />
charges show adjustment to include actual services and/or equipment provided by internal service funds.
<strong>City</strong> <strong>of</strong> <strong>Concord</strong><br />
Departmental Budget Summary<br />
All Funding Sources<br />
For the Year Ending June 30, 2008<br />
Police<br />
Adopted Adopted<br />
Actual Actual Actual Budget Budget<br />
2003-04 2004-05 2005-06 2006-07 2007-08<br />
Expenditure<br />
Personnel:<br />
Full-time $ 15,629,442 $ 15,929,720 $ 15,767,011 $ 16,899,508 $ 17,735,258<br />
Part-time 622,897 713,998 505,673 803,746 852,722<br />
Overtime 1,120,580 1,255,202 1,367,299 1,208,888 1,516,937<br />
Benefits 8,011,971 11,188,183 11,329,980 11,646,513 12,099,897<br />
Total Salaries and Benefits $ 25,384,890 $ 29,087,103 $ 28,969,963 $ 30,558,655 $ 32,204,814<br />
Operating Expenses $ 2,333,826 $ 2,567,933 $ 2,549,467 $ 3,131,305 $ 2,898,676<br />
Fixed Charges:<br />
Fleet $ 462,385 $ 1,033,217 $ 1,124,109 $ 1,167,807 $ 1,223,081<br />
Information Technology 783,606 1,234,177 1,307,035 1,274,244 1,560,317<br />
Buildings 979,900 1,130,069 1,093,531 1,214,407 1,437,758<br />
Risk Mgmt./Liability - 390,125 393,916 411,689 492,892<br />
Total Fixed Charges $ 2,225,891 $ 3,787,588 $ 3,918,591 $ 4,068,147 $ 4,714,048<br />
Other Financing Uses $ - $ 36,006 $ - $ 319,583 $<br />
-<br />
Total Expenditures $ 29,944,607 $ 35,478,630 $ 35,438,021 $ 38,077,690 $ 39,817,538<br />
Funding Sources<br />
General Fund $ 28,859,116 $ 34,604,951 $ 35,431,692 $ 38,077,690 $ 39,817,538<br />
Proposition 172 516,860 623,253<br />
6,331<br />
-<br />
-<br />
Supplemental Law Enforcemen 348,781 250,426<br />
-<br />
-<br />
-<br />
RDA Programs 219,850<br />
-<br />
-<br />
-<br />
-<br />
$ 29,944,607 $ 35,478,630 $ 35,438,023 $ 38,077,690 $ 39,817,538<br />
Personnel Allocation<br />
Full-time 227.00 226.00 226.00 223.00 219.00<br />
Part-time (FTE) 22.59 28.86 21.69 23.41 23.06<br />
Note: Positions shown here are allocated to this department but charge to other departments or capital projects<br />
and do not show as a FTE on the Department's Program Summary.<br />
2003-04 Eliminated $287,769 from the budget by eliminating vacant Communication Center Manager position,<br />
exchanging one sworn <strong>of</strong>ficer for one Crime Scene Analyst position; also reduced the operating<br />
budgets for telephone, materials and staff development. Proposed plan includes funding for the<br />
Master Police Officer program.<br />
2004-05 Eliminated one DARE <strong>of</strong>ficer and one sergeant, added two programmers and reduced operations for<br />
a total savings <strong>of</strong> $349,380. Benefit increases reflect higher costs to fund PERS retirement, health<br />
insurance, post-retirement medical, and workers' compensation.<br />
2005-06 Budget includes the reduction <strong>of</strong> two <strong>of</strong> three positions per <strong>City</strong> attrition plan. One other position is<br />
included in salaries and benefits as an overfill. Benefits increase reflects higher costs for health<br />
and dental insurance and PERS retirement. Salaries reflect the upward revaluation <strong>of</strong> the police<br />
chief position.<br />
2006-07 Full-time includes the attrition reduction <strong>of</strong> one position, revaluation <strong>of</strong> dispatchers and the results <strong>of</strong><br />
differential pay study. Benefits increase reflects higher costs <strong>of</strong> health insurance and PERS retirement.<br />
Operating expenses reflect additional contractual services and the higher cost <strong>of</strong> energy utilities.<br />
2007-08 Full-time includes reductions for the transfer <strong>of</strong> four positions to the Information Technology department,<br />
increases for the latest differential pay study and increases reflecting current staff pr<strong>of</strong>essional pay salary<br />
achievements. Part-time and over-time reflect the increased need for police services. Operating expense<br />
reductions are primarily due to the transfer <strong>of</strong> informational technology related expenditures to the<br />
information technology department <strong>of</strong>fset partially by increased costs <strong>of</strong> staff development. Fixed charges<br />
show adjustment to include actual services and/or equipment provided by internal service funds.
<strong>City</strong> <strong>of</strong> <strong>Concord</strong><br />
Departmental Budget Summary<br />
All Funding Sources<br />
For the Year Ending June 30, 2008<br />
Public Works<br />
Adopted Adopted<br />
Actual Actual Actual Budget Budget<br />
2003-04 2004-05 2005-06 2006-07 2007-08<br />
Expenditures<br />
Personnel:<br />
Full-time $ 5,029,983 $ 4,573,314 $ 4,728,690 $ 5,437,678 $ 5,456,551<br />
Part-time 933,242 916,474 950,472 1,013,946 1,023,470<br />
Overtime 178,599 159,628 193,211 162,105 167,683<br />
Benefits 2,061,204 2,841,829 3,295,655 3,768,587 3,765,143<br />
Total Salaries and Benefits $ 8,203,028 $ 8,491,245 $ 9,168,028 $ 10,382,316 $ 10,412,847<br />
Operating Expenses $ 6,564,979 $ 6,575,408 $ 6,497,743 $ 6,294,319 $ 7,163,065<br />
Fixed Charges:<br />
Fleet $ 258,563 $ 442,701 $ 471,757 $ 500,371 $ 911,567<br />
Information Technology 210,880 244,705 254,168 229,445 514,905<br />
Buildings 539,159 589,380 646,028 677,886 482,223<br />
Risk Mgmt./Liability - 186,397 191,484 196,700 468,289<br />
Total Fixed Charges $ 1,008,602 $ 1,463,183 $ 1,563,437 $ 1,604,402 $ 2,376,984<br />
Other Financing Uses $ 206,606 $ 7,959 $ 7,398 $ 4,000 $ 201,470<br />
Total Expenditures $ 15,983,215 $ 16,537,795 $ 17,236,606 $ 18,285,037 $ 20,154,366<br />
Funding Sources<br />
General Fund $ 7,696,776 $ 7,889,828 $ 8,317,970 $ 9,143,514 $ 9,538,552<br />
State Gas Tax 1,069,380 1,098,997 1,230,270 1,253,494 1,714,707<br />
State Gas Tax-Prop 111 759,474 453,581 693,707 636,647 612,048<br />
Street Lighting 871,500 1,055,333 767,120 908,431 923,438<br />
Traffic Systems Mgmt. 295,473<br />
72,736<br />
40,329<br />
50,809<br />
51,658<br />
Measure C Local 653,532 878,398 697,007 796,187 1,255,874<br />
Fleet Maintenance 1,240,596 1,417,543 1,636,962 1,592,822 1,842,886<br />
Maintenance Districts 321,475 335,423 313,748 477,694 659,542<br />
Building Maintenance Fund 3,075,009 3,335,956 3,539,493 3,425,439 3,555,661<br />
$ 15,983,215 $ 16,537,795 $ 17,236,606 $ 18,285,037 $ 20,154,366<br />
Personnel Allocation<br />
Full-time 103.00 109.00 95.00 99.00 99.00<br />
Part-time (FTE) 42.10 37.46 26.60 38.72 39.20<br />
Note: Positions shown here are allocated to this department but charge to other departments or capital projects<br />
and do not show as a FTE on the Department's Program Summary.<br />
Significant Changes<br />
2003-04 Reduced consultant services and electrical expenses. Eliminated vacant Transportation Program<br />
Coordinator position. Re-organized the Parks Division after retirement <strong>of</strong> several full-time staff and<br />
reduced part-time staff to generate a net savings <strong>of</strong> $175,000. These actions added entry-level positions.<br />
Reduced overall operating budget by $244,192.<br />
2004-05 Eliminated 11 full-time positions, added seasonal and reduced operating expenses for a savings<br />
<strong>of</strong> $658,000. Benefit increases reflect higher costs to fund PERS retirement, health<br />
insurance, post-retirement medical, and workers' compensation.<br />
2005-06 Added one position to assist with maintenance <strong>of</strong> street light system purchased from Pacific Gas and<br />
Electric. Includes transfer <strong>of</strong> 2 positions from Community & Recreation Services. Benefits increase<br />
can be attributed to higher cost for medical and dental insurance workers' compensation and PERS<br />
retirement. Salaries reflect the upward revaluation <strong>of</strong> several positions.<br />
2006-07 Full-Time includes the transfer <strong>of</strong> the recreation utility worker from Community & Recreation. Benefits<br />
increase reflects higher costs for health insurance and PERS retirement. Operating expenses include<br />
the higher costs for fuel and energy utilities.<br />
2007-08 Salaries & Benefits reflect cost savings engendered by the realignment <strong>of</strong> management positions and<br />
changes in health and dental plan coverage options by department staff. Operating expenses are higher<br />
primarily due to higher costs <strong>of</strong> contracts involving petroleum based construction products. Fixed charges<br />
show adjustment to include actual services and/or equipment provided by internal service funds.
<strong>City</strong> <strong>of</strong> <strong>Concord</strong><br />
Departmental Budget Summary<br />
All Funding Sources<br />
For the Year Ending June 30, 2008<br />
Storm Water Management<br />
Adopted Adopted<br />
Actual Actual Actual Budget Budget<br />
2003-04 2004-05 2005-06 2006-07 2007-08<br />
Expenditures<br />
Personnel:<br />
Full-time $ 436,804 $ 472,255 $ 493,141 $ 466,972 $ 484,792<br />
Part-time 5,472<br />
1,009<br />
8,877<br />
-<br />
-<br />
Overtime 18,833 10,131 21,268 24,675 25,318<br />
Benefits 182,158 276,929 340,610 304,102 312,196<br />
Total Salaries and Benefits $ 643,267 $ 760,324 $ 863,896 $ 795,749 $ 822,306<br />
Operating Expenses $ 444,939 $ 347,951 $ 427,357 $ 510,484 $ 523,639<br />
Fixed Charges:<br />
Fleet $ 96,147 $ 97,613 $ 99,151 $ 100,683 $ 172,482<br />
Information Technology 11,135 11,400 11,675 11,955 47,409<br />
Risk Mgmt./Liability -<br />
-<br />
-<br />
- 31,192<br />
Total Fixed Charges $ 107,282 $ 109,013 $ 110,826 $ 112,638 $ 251,083<br />
Other Financing Uses $ 326,161 $ 341,207 $ 356,856 $ 383,130 $ 398,455<br />
Total Expenditures $ 1,521,649 $ 1,558,495 $ 1,758,935 $ 1,802,001 $ 1,995,483<br />
Funding Sources<br />
General Fund $ - $ - $ - $ - $<br />
-<br />
Storm Water Parcel Tax 1,521,649 1,558,495 1,758,935 1,802,001 1,995,483<br />
$ 1,521,649 $ 1,558,495 $ 1,758,935 $ 1,802,001 $ 1,995,483<br />
Personnel Allocation<br />
Full-time 4.00 4.00 4.00 4.00 4.00<br />
Part-time (FTE) 0.70<br />
Note: Positions shown here are allocated to this department but contain charges from other departments and do not<br />
show as a FTE on the Department's Program Summary.<br />
Significant Changes<br />
2003-04 Reduced contractual services. Eliminated part-time assistance. Reduced overall operating expenses<br />
by $59,248.<br />
2004-05 Reduced operating expenses for a savings <strong>of</strong> $75,107. Benefit increases reflect higher costs to fund<br />
PERS retirement, health insurance, post-retirement medical and workers' compensation.<br />
2005-06 Benefits increase can be attributed to higher cost for medical and dental insurance, workers'<br />
compensation and PERS retirement.<br />
2006-07 Benefits increase can be attributed to higher cost for medical insurance and PERS retirement.<br />
2007-08 Fixed charges show adjustment to include actual services and/or equipment provided by<br />
internal service funds.
<strong>City</strong> <strong>of</strong> <strong>Concord</strong><br />
Departmental Budget Summary<br />
All Funding Sources<br />
For the Year Ending June 30, 2008<br />
Golf Course<br />
Adopted Adopted<br />
Actual Actual Actual Budget Budget<br />
2003-04 2004-05 2005-06 2006-07 2007-08<br />
Expenditures<br />
Personnel:<br />
Full-time $ 320,193 $ 303,707 $ 180,498 $ 41,573 $ 42,333<br />
Part-time 157,137 175,102 104,924<br />
-<br />
-<br />
Overtime 9,683<br />
9,115<br />
9,466<br />
-<br />
-<br />
Benefits 143,369 184,424 116,344 21,194 22,038<br />
Total Salaries and Benefits $ 630,382 $ 672,348 $ 411,232 $ 62,767 $ 64,371<br />
Operating Expenses $ 890,990 $ 783,464 $ 931,655 $ 1,447,871 $ 1,367,982<br />
Fixed Charges:<br />
Fleet $ 18,551 $ 18,867 $ 19,219 $ - $ -<br />
Information Technology 4,306<br />
4,396<br />
4,489<br />
4,584 31,207<br />
Risk Mgmt./Liability - 22,617 23,235 42,404 15,462<br />
Total Fixed Charges $ 22,857 $ 45,880 $ 46,943 $ 46,988 $ 46,669<br />
Other Financing Uses $ 102,099 $ 84,613 $ 80,697 $ 211,939 $ 218,535<br />
Total Expenditures $ 1,646,328 $ 1,586,305 $ 1,470,527 $ 1,769,565 $ 1,697,557<br />
Funding Sources<br />
User Fees $ 1,646,328 $ 1,586,305 $ 1,470,527 $ 1,769,565 $ 1,697,557<br />
Personnel Allocation<br />
Full-time 5.00 5.00 5.00 0.00 0.00<br />
Part-time (FTE) 5.58 5.54 6.06 0.00 0.00<br />
Note: Positions shown here are allocated to this department but charge to other departments or capital projects<br />
and do not show as a FTE on the Department's Program Summary.<br />
Significant Changes<br />
2003-04 Reflects decrease in the reimbursement <strong>of</strong> General Fund Services due to revised projections for<br />
golf rounds.<br />
2004-05 Reduced operating expenses and increased part-time for a net savings <strong>of</strong> $15,823. Benefit<br />
increases reflect higher costs to fund PERS retirement, health insurance, post-retirement<br />
medical, and workers' compensation.<br />
2005-06 Benefits increase can be attributed to higher cost for medical and dental insurance, workers'<br />
compensation and PERS retirement. In order to remain solvent, the beginning fund balance<br />
in the 10-Year Plan includes a $157,000 transfer from the General Fund and a $80,000 reduction<br />
in fees for reimbursable services.<br />
2006-07 Reduction in Salaries & Benefits can be attributed to implementation <strong>of</strong> maintenance contract<br />
effective Jan. 2006. Operating expenses include the maintenance contract, reduction in judgment<br />
obligation bond debt service transfer and reduction in cost allocation plan assignment to provide<br />
for zero end <strong>of</strong> year fund balance.<br />
2007-08 Operating expenses include cost allocation plan assignment to provide for zero end <strong>of</strong> year fund<br />
balance. Fixed charges show adjustment to include actual services and/or equipment provided by<br />
internal service funds.
<strong>City</strong> <strong>of</strong> <strong>Concord</strong><br />
Departmental Budget Summary<br />
All Funding Sources<br />
For the Year Ending June 30, 2008<br />
Sewer Enterprise<br />
Adopted Adopted<br />
Actual Actual Actual Budget Budget<br />
2003-04 2004-05 2005-06 2006-07 2007-08<br />
Expenditures<br />
Personnel:<br />
Full-time $ 507,308 $ 590,877 $ 597,431 $ 622,454 $ 639,792<br />
Part-time 3,735<br />
4,286<br />
5,000<br />
-<br />
-<br />
Overtime 46,448<br />
50,827<br />
38,873<br />
61,982<br />
54,204<br />
Benefits 258,652 364,095 453,174 437,750 440,504<br />
Total Salaries and Benefits $ 816,143 $ 1,010,085 $ 1,094,478 $ 1,122,186 $ 1,134,500<br />
Operating Expenses $ 11,015,501 $ 12,193,010 $ 13,070,452 $ 12,394,301 $ 12,565,274<br />
Fixed Charges:<br />
Fleet $ 105,499 $ 107,583 $ 109,771 $ 111,954 $ 132,039<br />
Information Technology 15,939<br />
16,536<br />
16,746<br />
17,165<br />
43,809<br />
Buildings -<br />
-<br />
-<br />
-<br />
35,233<br />
Risk Mgmt./Liability -<br />
30,330<br />
31,157 142,006<br />
42,486<br />
Total Fixed Charges $ 121,438 $ 154,449 $ 157,674 $ 271,125 $ 253,567<br />
Other Financing Uses $ 538,623 $ 482,174 $ 511,917 $ 836,530 $ 1,334,638<br />
Total Expenditures $ 12,491,705 $ 13,839,718 $ 14,834,521 $ 14,624,142 $ 15,287,979<br />
Funding Sources<br />
Sewer Service Fees $ 12,491,705 $ 13,839,718 $ 14,834,521 $ 14,624,142 $ 15,287,979<br />
Personnel Allocation<br />
Full-time 9.00 9.00 9.00 9.00 9.00<br />
Part-time (FTE) 0.23 0.23<br />
Note: Positions shown here are allocated to this department but contain charges from other departments which are<br />
reflected as a FTE on the Department's Program Summary.<br />
Significant Changes<br />
2003-04 Reflects increased Central Sanitary District's Facility Expansion Costs. Includes first full year <strong>of</strong> the<br />
Phase I bond payment for Concrete Trunk Sewer Main replacement rehabilitation. Reduced budget<br />
by $33,049.<br />
2004-05 Reduced operating expenses for a savings <strong>of</strong> $34,803. Benefit increases reflect higher costs to<br />
fund PERS retirement, health insurance, post-retirement medical, workers' compensation.<br />
2005-06 Operating expense reflects Central Sanitary District increased operating costs for treatment.<br />
Benefits increase can be attributed to higher cost for medical and dental insurance, workers'<br />
compensation and PERS retirement.<br />
2006-07 Benefits increase can be attributed to higher cost for medical insurance and PERS retirement.<br />
Operating expenses reflect Central Sanitary District increased operating costs for treatment, updated<br />
cost allocation plan overhead assignment and transfer <strong>of</strong> judgment obligation bond debt service to<br />
the Liability Internal Service Fund service fee.<br />
2007-08 Fixed charges show adjustment to include actual services and/or equipment provided by<br />
internal service funds.
General Fund<br />
77%<br />
General Fund<br />
79%<br />
General Fund & Enterprises<br />
Budgeted Capital & Operating Expenditures<br />
June 30, 2008<br />
Golf Course<br />
2%<br />
Sewer<br />
21%<br />
General Fund & Enterprises<br />
Total Revenues<br />
June 30, 2008<br />
Golf Course<br />
2%<br />
Sewer<br />
19%<br />
Total Capital & Operating Budget<br />
General Fund $ 78,328,992<br />
Sewer 21,835,873<br />
Golf Course 2,234,082<br />
Total $ 102,398,947<br />
Total Revenues<br />
General Fund $ 76,777,312<br />
Sewer 18,397,549<br />
Golf Course 2,326,838<br />
Total $ 97,501,699
<strong>City</strong> <strong>of</strong> <strong>Concord</strong><br />
Operating Budgets<br />
For the General Fund and the Enterprise Funds<br />
General Sewer Golf<br />
Fund Operations Course Total<br />
ESTIMATED FUND BALANCE<br />
AS OF JUNE 30, 2007 $ 9,913,563 $ 12,797,675 $ 55,146 $ 22,766,384<br />
REVENUES<br />
Taxes $ 61,943,295<br />
$ 61,943,295<br />
Licenses & Permits 1,615,287<br />
1,615,287<br />
Fines & Forfeitures 506,309<br />
506,309<br />
Use <strong>of</strong> Money & Property 1,148,588 381,079 3,492 1,533,159<br />
Intergovernmental 1,111,505<br />
1,111,505<br />
Service Charges 10,104,404 18,016,470 2,323,346 30,444,220<br />
Other 191,597<br />
-<br />
- 191,597<br />
Total Revenues $ 76,620,985 $ 18,397,549 $ 2,326,838 $ 97,345,372<br />
EXPENDITURES<br />
Salaries & Benefits $ 54,328,216 $ 1,134,500 $ 64,371 $ 55,527,087<br />
Operating Expenditures 10,773,019 12,565,274 1,367,982 24,706,275<br />
Fixed Charges 12,196,431 253,567 46,669 12,496,667<br />
Total Expenditures $ 77,297,666 $ 13,953,341 $ 1,479,022 $ 92,730,029<br />
OTHER FINANCING SOURCES & (USES)<br />
Transfers In (Inter & Intra) $ 156,327<br />
$ 156,327<br />
Transfers Out (Inter & Intra) (299,713)<br />
(299,713)<br />
Lease/Bond Payment - (1,334,638) (218,535) (1,553,173)<br />
Total Other Financing Sources and Uses $ (143,386) $ (1,334,638) $ (218,535) $ (1,696,559)<br />
Revenues and Other Financing Sources<br />
Over (Under) Expenditures $ (820,067) $ 3,109,570 $ 629,281 $ 2,918,784<br />
Less: 10% Contingency Reserve $ 7,739,738 $ 1,323,644 $ 147,902 $ 9,211,284<br />
CAPITAL IMPROVEMENT PROJECTS $ 731,613 $ 6,547,894 $ 536,525 $ 7,816,032<br />
ESTIMATED FUND BALANCE<br />
AT JUNE 30, 2008 $ 622,145 $ 8,035,707 $ - $<br />
8,657,852
For the entertainment <strong>of</strong> <strong>Concord</strong>’s residents and the surrounding areas, The Sleep<br />
Train Pavilion at <strong>Concord</strong> hosts a vast variety <strong>of</strong> concerts and events throughout the<br />
course <strong>of</strong> their season. In 1996 the Pavilion was remodeled and upgraded for the<br />
convenience and pleasure <strong>of</strong> all the people who take part in one or more <strong>of</strong> the premier<br />
experiences <strong>of</strong>fered each year. The Sleep Train Pavilion also contracts with the Mt.<br />
Diablo Unified School District to host all <strong>of</strong> the high schools commencement exercises.<br />
On April 11, 2006, the <strong>City</strong> Council approved an agreement with Live Nation Inc., to<br />
assume the management and operation <strong>of</strong> the Sleep Train Pavilion at <strong>Concord</strong> through<br />
December 31, 2008.<br />
106
Diablo Creek Golf Course <strong>of</strong>fers a<br />
beautifully maintained and aesthetically<br />
pleasing 18- hole course. The course<br />
provides a high quality golf experience<br />
for its customers.<br />
196
The Communion Bridge<br />
dedication plaque<br />
recognizes twenty years <strong>of</strong><br />
friendship between the<br />
<strong>City</strong> <strong>of</strong> <strong>Concord</strong> and our<br />
Sister <strong>City</strong> Kitakami.<br />
The Library is the home<br />
<strong>of</strong> the <strong>City</strong> <strong>of</strong> <strong>Concord</strong>’s<br />
half <strong>of</strong> the Communion<br />
Bridge. The other half <strong>of</strong><br />
the bridge is located in<br />
Kitakami, Japan, our<br />
Sister <strong>City</strong>.<br />
216
To provide<br />
effective and<br />
efficient police<br />
services to the<br />
<strong>City</strong> <strong>of</strong> <strong>Concord</strong><br />
24 hours a day,<br />
the <strong>City</strong> has<br />
erected a new<br />
facility and three<br />
Field Offices in<br />
the Northern,<br />
Southern and<br />
Valley Districts.<br />
232
CITY OF CONCORD<br />
SPECIAL REVENUE FUNDS<br />
FOR THE YEAR ENDING JUNE 30, 2008<br />
Special Revenue Funds are used to account for revenue sources that are restricted by law or<br />
administrative action for a specific purpose. The <strong>City</strong> <strong>of</strong> <strong>Concord</strong> has the following Special Revenue<br />
Funds:<br />
State Gas Tax – Revenue apportioned to the <strong>City</strong> from State collected gasoline taxes. Funds are<br />
to be used for construction and maintenance <strong>of</strong> <strong>City</strong> Streets.<br />
Storm Water Management -To account for activities necessary to comply with the Federal Clean<br />
Water Act.<br />
Maintenance Districts - Revenue from property tax and annual assessments against property<br />
owners within districts used for maintenance.<br />
<strong>City</strong>wide Street Lighting District – Formed in 1988 for the purpose <strong>of</strong> funding the<br />
installation and maintenance <strong>of</strong> public lighting facilities in public places. In 2005, the <strong>City</strong><br />
consummated the purchase <strong>of</strong> the street lighting system from the local utility and<br />
included its operations in this district.<br />
Downtown Landscape Maintenance District – Formed in 1983 to maintain and service<br />
landscaping in the public places <strong>of</strong> the downtown area.<br />
Pine Hollow Landscape Maintenance District – Formed in 1986 to maintain and service<br />
landscaping in the public places <strong>of</strong> the Pine Hollow subdivision.<br />
Landscaping & Lighting District #3 – This district is comprised <strong>of</strong> four subdivisions,<br />
Kirkwood, Ygnacio Woods, Balhan and Valley Terrace.<br />
Art in Public Places – To account for fees applied to new construction and expended for the<br />
purchase and installation <strong>of</strong> art objects in the <strong>City</strong>. This fee is no longer assessed.<br />
Traffic System Management (TSM) - Monies from in-lieu parking fees used for traffic system<br />
management facilities.<br />
Redevelopment Agency Housing Set-Aside - Funds from the <strong>Concord</strong> Redevelopment Agency<br />
used to support low and moderate income housing.<br />
Monument Community Partnership - Monies for capital projects resulting from the partnership<br />
between the Contra Costa First 5 children and Monument community partnership.<br />
Housing & Community Services – Monies received from the Federal Department <strong>of</strong> Housing and<br />
Urban Development and other sources used for development <strong>of</strong> jobs and suitable housing for<br />
low-income residents.<br />
Housing Assistance – Funds from the <strong>Concord</strong> Redevelopment Agency and developers'<br />
contributions used for low-income housing loans.<br />
Community Development Block Grant (CDBG) – Monies received from the Department <strong>of</strong><br />
Housing & Urban Development used for programs assisting low and moderate income<br />
residents.<br />
Housing Conservation – Funds from CDBG and repayments <strong>of</strong> previous loans used for<br />
loans rehabilitating housing.<br />
Childcare – Monies from developers’ fees committed to the <strong>Concord</strong> Childcare program.<br />
291
CITY OF CONCORD<br />
SPECIAL REVENUE FUNDS<br />
FOR THE YEAR ENDING JUNE 30, 2008<br />
State Storm Water Maintenance<br />
Fund Gas Tax Management Districts<br />
FUND BALANCE<br />
AS OF JULY 1, 2007<br />
$ 504,802 $ 1,292,063 $ 1,208,616<br />
REVENUE<br />
Taxes $ - $ 1,951,330 $ 1,388,686<br />
Use <strong>of</strong> Money & Property 26,502<br />
44,450<br />
45,836<br />
Intergovernmental<br />
Fees<br />
2,259,000<br />
Other -<br />
-<br />
198,070<br />
Total Revenues $ 2,285,502 $ 1,995,780 $ 1,632,592<br />
APPROPRIATIONS<br />
Operating $ 2,345,847 $ 1,995,483 $ 1,496,096<br />
Capital Projects<br />
Contractual Services<br />
Loan/Rebates<br />
126,193<br />
-<br />
-<br />
Incidental Expenses -<br />
-<br />
86,884<br />
Total Expenditures $ 2,472,040 $ 1,995,483 $ 1,582,980<br />
OTHER FINANCING SOURCES (USES)<br />
Transfer In -<br />
-<br />
Transfer Out -<br />
-<br />
-<br />
Total Other Financing Sources (Uses) $ - $ - $<br />
-<br />
Excess (Deficiency) <strong>of</strong> Revenues and<br />
Other Financing Sources over/(under)<br />
expenditures and Other Financing (186,538)<br />
297<br />
49,612<br />
FUND BALANCE - 6/30 $ 318,264 $ 1,292,360 $ 1,258,228<br />
OPERATING CONTINGENCY RESERVE<br />
(Included in fund balance)<br />
$ - $ 199,548 $ 138,552<br />
PROJECT CARRYOVER<br />
(These numbers represent projects which have<br />
been allocated in prior years but have not<br />
been spent as <strong>of</strong> June 30, 2007) $ 1,093,834 $ 378,709 $<br />
-
Other<br />
Traffic Monument Housing &<br />
Art in System RDA Housing Community Community<br />
Public Places Management Set Aside Partnership Services<br />
$ 10,487 $ 608,191 $ 845,326 $ 9,351 $ 815,712<br />
$ - $ - $ - $ - $<br />
-<br />
2,000<br />
4,000<br />
35,555<br />
2,000<br />
10,500<br />
1,057,689<br />
25,000<br />
-<br />
-<br />
150,000<br />
-<br />
77,750<br />
$ 2,000 $ 4,000 $ 185,555 $ 2,000 $ 1,170,939<br />
$ - $ 47,658 $ 1,634,783 $ - $ 527,303<br />
-<br />
100,000<br />
233,819<br />
191,736<br />
295,025<br />
1,300,000<br />
200,000<br />
-<br />
-<br />
-<br />
-<br />
-<br />
$ - $ 47,658 $ 3,226,519 $ - $ 1,256,147<br />
$ 2,917,583<br />
-<br />
- $ (4,000)<br />
-<br />
-<br />
-<br />
$ - $ (4,000) $ 2,917,583 $ - $<br />
-<br />
2,000<br />
CITY OF CONCORD<br />
SPECIAL REVENUE FUNDS<br />
FOR THE YEAR ENDING JUNE 30, 2008<br />
(47,658)<br />
(123,381)<br />
2,000<br />
(85,208)<br />
$ 12,487 $ 560,533 $ 721,945 $ 11,351 $ 730,504<br />
$ - $ - $ - $ - $<br />
-<br />
$ 106,627 $ - $ 1,140,646 $ - $ 177,623
<strong>City</strong> <strong>of</strong> <strong>Concord</strong><br />
Special Revenue Fund<br />
State Gas Tax Fund<br />
Ten Year Projection<br />
For the Year Ending June 30, 2008<br />
2007-08 2008-09 2009-10 2010-11 2011-12 2012-13 2013-14 2014-15 2015-16 2016-17<br />
FUND BALANCE - 7/1 $ 504,802 $ 318,264 $ 916,461 $ 1,333,608 $ 1,123,705 $ 817,851 $ 863,363 $ 754,858 $ 528,088 $ 277,479<br />
Add Revenues:<br />
Intergovernmental $ 2,259,000 $ 2,237,000 $ 2,282,000 $ 2,282,000 $ 2,282,000 $ 2,282,000 $ 2,282,000 $ 2,282,000 $ 2,282,000 $ 2,282,000<br />
Use <strong>of</strong> Money & Property 26,502 33,820 48,333 42,285 32,087 33,033 29,619 22,137 13,689 7,777<br />
Total Revenue $ 2,285,502 $ 2,270,820 $ 2,330,333 $ 2,324,285 $ 2,314,087 $ 2,315,033 $ 2,311,619 $ 2,304,137 $ 2,295,689 $ 2,289,777<br />
Less Appropriations:<br />
Operating $ 2,345,847 $ 1,640,004 $ 1,895,937 $ 2,517,323 $ 2,603,469 $ 2,253,457 $ 2,397,300 $ 2,508,299 $ 2,523,911 $ 2,437,673<br />
Capital Projects 126,193 32,619 17,248 16,865 16,471 16,065 22,823 22,609 22,386 22,608<br />
Total Appropriations $ 2,472,040 $ 1,672,623 $ 1,913,185 $ 2,534,188 $ 2,619,940 $ 2,269,522 $ 2,420,123 $ 2,530,908 $ 2,546,297 $ 2,460,281<br />
Excess (Deficiency) <strong>of</strong> Revenue<br />
Over (Under) Expenditures $ (186,538) $ 598,197 $ 417,148 $ (209,903) $ (305,853) $ 45,511 $ (108,504) $ (226,771) $ (250,608) $ (170,504)<br />
FUND BALANCE - 6/30 $ 318,264 $ 916,461 $ 1,333,608 $ 1,123,705 $ 817,851 $ 863,363 $ 754,858 $ 528,088 $ 277,479 $ 106,976<br />
Notes:<br />
Meets all standards contained in the Budget and Fiscal Policy adopted by the <strong>City</strong> Council. This policy can be found on page 36.<br />
Appropriations:<br />
Salaries and benefits have been budgeted per current labor agreements adjusted for step increases and assuming a full staffing level.<br />
Employee benefits expenses for medical insurance and retirement reflect recent higher than CPI increases and post retirement health includes amortization <strong>of</strong> OPEB accrued liability over 25-Year term.<br />
Non-labor operating expenditures for FY 2008 and the remainder <strong>of</strong> the 10-Year planning period, depending on the category, include increases between 2% and 3% for inflation.<br />
Operational programs include internal service fund charges for vehicles, computer and <strong>of</strong>fice equipment, buildings, workers' compensation and liability.
Housing Housing<br />
Assistance Conservation CDBG Childcare Total<br />
FUND BALANCE - 7/1 $ 421,425 $ 226,539 $ 19,391 $ 148,357 $ 815,712<br />
REVENUES<br />
Use <strong>of</strong> Money & Property $ 7,500 $ - $ - $ 3,000 $ 10,500<br />
Grants 248,076 809,613<br />
1,057,689<br />
Fees 25,000<br />
25,000<br />
Other 2,750<br />
75,000<br />
-<br />
-<br />
77,750<br />
Total Revenues $ 10,250 $ 323,076 $ 809,613 $ 28,000 $ 1,170,939<br />
APPROPRIATIONS<br />
Operating $ 61,920 $ 148,076 $ 317,307 $ - $ 527,303<br />
Contracting Services 240,025<br />
55,000 295,025<br />
Capital Projects 233,819<br />
233,819<br />
Loan/Rebates -<br />
200,000<br />
-<br />
- 200,000<br />
Total Expenditures $ 61,920 $ 348,076 $ 791,151 $ 55,000 $ 1,256,147<br />
OTHER FINANCING SOURCES (USES)<br />
Transfer in $ - $ - $ - $ - $<br />
-<br />
Transfer out<br />
Total Other Financing<br />
-<br />
-<br />
-<br />
-<br />
-<br />
Sources (Uses) $ - $ - $ - $ - $<br />
-<br />
Excess (Deficiency) <strong>of</strong> Revenues over<br />
(under) expenditures and Other<br />
Financing Source (Uses) (51,670)<br />
CITY OF CONCORD<br />
SPECIAL REVENUE FUNDS<br />
HOUSING & COMMUNITY SERVICES<br />
FOR THE YEAR ENDING JUNE 30, 2008<br />
(25,000)<br />
18,462<br />
(27,000)<br />
(85,208)<br />
FUND BALANCE - 6/30 $ 369,755 $ 201,539 $ 37,853 $ 121,357 $ 730,504
<strong>City</strong> <strong>of</strong> <strong>Concord</strong><br />
Special Revenue Fund<br />
RDA Housing Set-Aside Fund<br />
Ten Year Projection<br />
For The Year Ending June 30, 2008<br />
2007-08 2008-09 2009-10 2010-11 2011-12 2012-13 2013-14 2014-15 2015-16 2016-17<br />
Fund Balance 7/01 $ 845,326 $ 721,945 $ 661,533 $ 730,698 $ 932,621 $ 1,205,464 $ 1,639,524 $ 2,224,578 $ 2,770,487 $ 3,526,871<br />
Add Revenues:<br />
Low & Moderate Income Housing Set-Aside $ 2,917,583 $ 3,033,468 $ 3,152,830 $ 3,334,841 $ 3,501,782 $ 3,701,581 $ 3,888,877 $ 4,085,238 $ 4,329,121 $ 4,593,650<br />
Use <strong>of</strong> Money & Property 35,555 36,931 46,152 52,764 64,344 81,585 106,442 134,026 165,789 209,852<br />
Scheduled Loan Repayment-Principal & Interest 150,000 150,000 150,000 150,000 150,000 150,000 150,000 150,000 150,000 150,000<br />
Total Revenues $ 3,103,138 $ 3,220,399 $ 3,348,982 $ 3,537,605 $ 3,716,126 $ 3,933,166 $ 4,145,319 $ 4,369,264 $ 4,644,910 $ 4,953,502<br />
Less Appropriations:<br />
Operating Expenditures:<br />
Salary / Staff Dev / Supplies $ 997,615 $ 1,029,890 $ 1,056,661 $ 1,089,341 $ 1,123,115 $ 1,154,681 $ 1,190,688 $ 1,306,450 $ 1,266,536 $ 1,304,003<br />
Consultant/Contract Services 191,736 198,808 206,119 213,675 221,486 229,559 237,902 168,003 255,438 264,648<br />
<strong>City</strong> Provided Admin. & General Services<br />
Housing Programs:<br />
313,503 319,773 326,168 332,691 339,345 346,132 353,055 360,116 367,318 374,664<br />
Multi-Family Rental Rehab 150,000 150,000 150,000 150,000 150,000 150,000 150,000 250,000 250,000 250,000<br />
Multi-Family Acquisition Rehab 250,000 250,000 250,000 250,000 250,000 250,000 250,000 300,000 300,000 300,000<br />
Single Family Rehab - Housing Conservation 750,000 750,000 700,000 700,000 700,000 700,000 700,000 750,000 750,000 750,000<br />
Building Inspection 51,697 53,533 55,044 56,948 58,920 60,733 62,836 65,015 67,266 69,600<br />
First-Time Homebuyer Program Loans 100,000 100,000 100,000 100,000 100,000 100,000 100,000 100,000 100,000 50,000<br />
Fair Housing Counseling 140,000 144,200 148,526 152,982 157,571 162,298 167,167 172,182 177,347 182,667<br />
Plaza Tower Repayment 131,968 134,607 137,299 140,045 142,846 145,703 148,617 151,589 154,621 157,713<br />
New Construction 100,000 100,000 100,000 100,000 150,000 150,000 150,000 150,000 150,000 150,000<br />
Exterior Enhancement Programs 50,000 50,000 50,000 50,000 50,000 50,000 50,000 50,000 50,000 50,000<br />
Total Appropriations $ 3,226,519 $ 3,280,811 $ 3,279,817 $ 3,335,682 $ 3,443,283 $ 3,499,106 $ 3,560,265 $ 3,823,355 $ 3,888,526 $ 3,903,295<br />
Excess (Deficiency) <strong>of</strong> Revenue Sources<br />
Over (Under) Expenditures $ (123,381) $ (60,412) $ 69,165 $ 201,923 $ 272,843 $ 434,060 $ 585,054 $ 545,909 $ 756,384 $ 1,050,207<br />
Fund Balance - 6/30 $ 721,945 $ 661,533 $ 730,698 $ 932,621 $ 1,205,464 $ 1,639,524 $ 2,224,578 $ 2,770,487 $ 3,526,871 $ 4,577,078<br />
Notes:<br />
Meets all standards contained in the Budget and Fiscal Policy adopted by the <strong>City</strong> Council. This policy can be found on page 36.<br />
Appropriations:<br />
Salaries and benefits have been budgeted per current labor agreements adjusted for step increases and assuming a full staffing level.<br />
Employee benefits expenses for medical insurance and retirement reflect recent higher than CPI increases and post retirement health includes amortization <strong>of</strong> OPEB accrued liability over 25-Year term.<br />
Non-labor operating expenditures for FY 2008 and the remainder <strong>of</strong> the 10-Year planning period, depending on the category, include increases between 2% and 3% for inflation.<br />
Operational programs include internal service fund charges for vehicles, information technology, buildings, workers' compensation and liability.
<strong>City</strong> <strong>of</strong> <strong>Concord</strong><br />
Special Revenue Fund<br />
Street Lighting Maintenance District<br />
Ten Year Projection<br />
For the Year Ending June 30, 2008<br />
2007-08 2008-09 2009-10 2010-11 2011-12 2012-13 2013-14 2014-15 2015-16 2016-17<br />
Fund Balance 7/01 $ 582,942 $ 726,575 $ 849,767 $ 958,357 $ 1,041,547 $ 991,164 $ 910,513 $ 796,113 $ 645,218 $ 454,924<br />
Add Revenues:<br />
Taxes $ 1,044,549 $ 1,044,549 $ 1,044,549 $ 1,044,549 $ 1,044,549 $ 1,044,549 $ 1,044,549 $ 1,044,549 $ 1,044,549 $ 1,044,549<br />
Use <strong>of</strong> Money & Property 22,522 30,909 44,101 48,778 49,578 46,382 41,625 35,154 26,833 16,513<br />
Total Revenue $ 1,067,071 $ 1,075,458 $ 1,088,650 $ 1,093,327 $ 1,094,127 $ 1,090,931 $ 1,086,174 $ 1,079,703 $ 1,071,382 $ 1,061,062<br />
Less Appropriations:<br />
Street Lighting (Electricity) $ 600,000 $ 618,000 $ 636,540 $ 655,636 $ 675,305 $ 695,564 $ 716,431 $ 737,924 $ 760,062 $ 782,864<br />
Street Lighting (Consult./Contract) 26,265 27,053 27,865 28,701 29,562 30,449 31,362 32,303 33,272 34,270<br />
Street Lighting (Personnel) 206,383 214,411 220,795 228,837 237,176 244,871 253,802 263,057 272,647 282,600<br />
Street Lighting (Supplies) 20,808 21,224 21,648 22,081 22,523 22,973 23,432 23,901 24,379 24,867<br />
Assessment Engineering 16,500 16,830 17,167 17,510 17,860 18,217 18,581 18,953 19,332 19,719<br />
County Collection Fees 32,640 33,293 33,959 34,638 35,331 36,038 36,759 37,494 38,244 39,009<br />
Other Fixed Charges 20,842 21,455 22,086 22,734 23,403 24,095 24,807 25,541 26,290 27,060<br />
Loan Repayment w/Interest -<br />
-<br />
-<br />
- 103,350 99,375 95,400 91,425 87,450 83,475<br />
Total Expenditures $ 923,438 $ 952,266 $ 980,060 $ 1,010,137 $ 1,144,510 $ 1,171,582 $ 1,200,574 $ 1,230,598 $ 1,261,676 $ 1,293,864<br />
Revenues Over (Under) $ 143,633 $ 123,192 $ 108,590 $ 83,190 $ (50,383) $ (80,651) $ (114,400) $ (150,895) $ (190,294) $ (232,802)<br />
Contingency Reserve $ 92,344 $ 95,227 $ 98,006 $ 101,014 $ 104,116 $ 107,221 $ 110,517 $ 113,917 $ 117,423 $ 121,039<br />
Fund Balance 6/30 $ 634,231 $ 754,540 $ 860,351 $ 940,533 $ 887,048 $ 803,292 $ 685,596 $ 531,301 $ 337,501 $ 101,083<br />
Notes:<br />
Meets all standards contained in the Budget and Fiscal Policies adopted by Council. This statement can be found on page 36.<br />
Street Light system purchased for $1,200,000 in 2005. A loan from Traffic System Mgmt. Fund <strong>of</strong> $477,000 to be repaid with interest over a 6 year period beginning in FY2011-12.<br />
The balance <strong>of</strong> $723,00 has been set aside from the Street Light District.<br />
Appropriations:<br />
Salaries and benefits have been budgeted per current labor agreements adjusted for step increases and assuming a full staffing level.<br />
Employee benefits expenses for medical insurance and retirement reflect recent higher than CPI increases and post retirement health includes amortization <strong>of</strong> OPEB accrued liability over 25-Year term.<br />
Non-labor operating expenditures for FY 2008 and the remainder <strong>of</strong> the 10-Year planning period, depending on the category, include increases between 2% and 3% for inflation.<br />
Includes internal service fund charges for vehicles, information technology, workers' compensation & liability.<br />
Contingency Reserve is a 10% <strong>of</strong> total appropriations.
<strong>City</strong> <strong>of</strong> <strong>Concord</strong><br />
Special Revenue Fund<br />
Downtown Landscape Maintenance District<br />
Ten Year Projection<br />
For the Year Ending June 30, 2008<br />
2007-08 2008-09 2009-10 2010-11 2011-12 2012-13 2013-14 2014-15 2015-16 2016-17<br />
Fund Balance 7/01 $ 286,747 $ 187,908 $ 75,883 $ (50,088) $ (187,096) $ (334,853) $ (493,234) $ (663,055) $ (844,683) $ (1,038,497)<br />
Add Revenues:<br />
Taxes $ 207,454 $ 207,454 $ 207,454 $ 207,454 $ 207,454 $ 207,454 $ 207,454 $ 207,454 $ 207,454 $ 207,454<br />
Other Revenues 197,470 203,394 209,495 215,780 222,254 228,921 235,789 242,863 250,149 257,654<br />
Use <strong>of</strong> Money & Property 8,164 5,172 629<br />
-<br />
-<br />
-<br />
-<br />
-<br />
-<br />
-<br />
Total Revenue $ 413,088 $ 416,020 $ 417,578 $ 423,234 $ 429,708 $ 436,375 $ 443,243 $ 450,317 $ 457,603 $ 465,108<br />
Less Appropriations:<br />
Landscape Maintenance $ 347,681 $ 358,944 $ 369,448 $ 380,993 $ 392,915 $ 404,747 $ 417,433 $ 430,528 $ 444,042 $ 457,998<br />
Gas & Electricity 6,180 6,365 6,556 6,753 6,956 7,165 7,380 7,601 7,829 8,064<br />
Water & Miscellaneous 32,665 33,645 34,654 35,694 36,765 37,868 39,004 40,174 41,379 42,620<br />
<strong>City</strong> Provided Admin. & General Services 99,043 102,014 105,074 108,226 111,473 114,817 118,262 121,810 125,464 129,228<br />
Assessment Engineering 6,500 6,630 6,763 6,898 7,036 7,177 7,321 7,467 7,616 7,768<br />
County Collection Fees 714 728 743 758 773 788 804 820<br />
836<br />
837<br />
Postage & Mailing 541 557 574 591 609 627 646 665<br />
685<br />
706<br />
Other Fixed Charges 18,603 19,162 19,737 20,329 20,938 21,567 22,214 22,880 23,566 24,273<br />
Total Expenditures $ 511,927 $ 528,045 $ 543,549 $ 560,242 $ 577,465 $ 594,756 $ 613,064 $ 631,945 $ 651,417 $ 671,494<br />
Revenues Over (Under)<br />
Appropriations $ (98,839) $ (112,025) $ (125,971) $ (137,008) $ (147,757) $ (158,381) $ (169,821) $ (181,628) $ (193,814) $ (206,386)<br />
Contingency Reserve $ 31,446 $ 32,465 $ 33,405 $ 34,446 $ 35,521 $ 36,584 $ 37,728 $ 38,908 $ 40,127 $ 41,384<br />
Fund Balance 6/30 $ 156,462 $ 43,418 $ (83,493) $ (221,542) $ (370,374) $ (529,818) $ (700,783) $ (883,591) $ (1,078,624) $ (1,286,267)<br />
Notes:<br />
Meets all standards contained in the Budget and Fiscal Policies adopted by Council. This statement can be found on page 36.<br />
Other revenues provided by General Fund Support.<br />
Appropriations:<br />
Salaries and benefits have been budgeted per current labor agreements adjusted for step increases and assuming a full staffing level.<br />
Employee benefits expenses for medical insurance and retirement reflect recent higher than CPI increases and post retirement health includes amortization <strong>of</strong> OPEB accrued liability over 25-Year term.<br />
Non-labor operating expenditures for FY 2008 and the remainder <strong>of</strong> the 10-Year planning period, depending on the category, include increases between 2% and 3% for inflation.<br />
Includes internal service fund charges for information technology and workers' compensation.<br />
Contingency Reserve is a 10% <strong>of</strong> total appropriations before Departmental Overheads and <strong>City</strong> Provided Admin. & General Services.
<strong>City</strong> <strong>of</strong> <strong>Concord</strong><br />
Special Revenue Fund<br />
Pine Hollow Landscape Maintenance District<br />
Ten Year Projections<br />
For the Year Ending June 30, 2008<br />
2007-08 2008-09 2009-10 2010-11 2011-12 2012-13 2013-14 2014-15 2015-16 2016-17<br />
Fund Balance 7/01 $ 150,140 $ 142,011 $ 133,674 $ 126,159 $ 116,317 $ 104,741 $ 91,303 $ 75,871 $ 58,301 $ 38,442<br />
Add Revenues:<br />
Taxes $ 61,677 $ 61,677 $ 61,677 $ 61,677 $ 61,677 $ 61,677 $ 61,677 $ 61,677 $ 61,677 $ 61,677<br />
Use <strong>of</strong> Money & Property 8,444 9,609 11,946 11,171 11,029 10,798 10,474 10,049 9,516 8,868<br />
Total Revenue $ 70,121 $ 71,286 $ 73,623 $ 72,848 $ 72,706 $ 72,475 $ 72,151 $ 71,726 $ 71,193 $ 70,545<br />
Less Appropriations:<br />
Landscape Contract $ 20,156 $ 20,450 $ 20,859 $ 21,276 $ 21,702 $ 22,136 $ 22,579 $ 23,031 $ 23,492 $ 23,962<br />
Landscape Extra Work 15,000 15,300 15,606 15,918 16,236 16,561 16,892 17,230 17,575 17,927<br />
Contract Administration 1,327 1,354 1,381 1,409 1,437 1,466 1,495 1,525 1,556 1,587<br />
Gas & Electricity 899 926 954 983 1,012 1,042 1,073 1,105 1,138 1,172<br />
Capital Replacement Reserve 15,575 15,575 15,575 15,575 15,575 15,575 15,575 15,575 15,575 15,575<br />
Water & Miscellaneous 21,432 22,075 22,737 23,419 24,122 24,846 25,591 26,359 27,150 27,965<br />
Assessment Engineering 3,000 3,060 3,121 3,183 3,247 3,312 3,378 3,446 3,515 3,585<br />
Printing, Publishing & Mailing 453 467 481 495 510 525 541 557 574 591<br />
County Collection Fees 408 416 424 432 441 450 459 468 477 487<br />
Total Expenditures $ 78,250 $ 79,623 $ 81,138 $ 82,690 $ 84,282 $ 85,913 $ 87,583 $ 89,296 $ 91,052 $ 92,851<br />
Revenues Over (Under)<br />
Appropriations $ (8,129) $ (8,337) $ (7,515) $ (9,842) $ (11,576) $ (13,438) $ (15,432) $ (17,570) $ (19,859) $ (22,306)<br />
Contingency Reserve $ 7,825 $ 7,962 $ 8,114 $ 8,269 $ 8,428 $ 8,591 $ 8,758 $ 8,930 $ 9,105 $ 9,285<br />
Fund Balance 6/30 $ 134,186 $ 125,712 $ 118,045 $ 108,048 $ 96,313 $ 82,712 $ 67,113 $ 49,371 $ 29,337 $ 6,851<br />
Notes:<br />
Meets all standards contained in the Budget and Fiscal Policies adopted by Council. This statement can be found on page 36.<br />
Appropriations:<br />
Salaries and benefits have been budgeted per current labor agreements adjusted for step increases and assuming a full staffing level.<br />
Employee benefits expenses for medical insurance and retirement reflect recent higher than CPI increases and post retirement health includes amortization <strong>of</strong> OPEB accrued liability over 25-Year term.<br />
Non-labor operating expenditures for FY 2008 and the remainder <strong>of</strong> the 10-Year planning period, depending on the category, include increases between 2% and 3% for inflation.<br />
Includes internal service fund charges for workers' compensation.<br />
Contingency Reserve is a 10% <strong>of</strong> total appropriations.
<strong>City</strong> <strong>of</strong> <strong>Concord</strong><br />
Special Revenue Fund<br />
Landscape & Lighting Maintenance District No. 3<br />
Ten Year Projection<br />
For the Year Ending June 30, 2008<br />
2007-08 2008-09 2009-10 2010-11 2011-12 2012-13 2013-14 2014-15 2015-16 2016-17<br />
Fund Balance 7/01 $ 188,787 $ 201,734 $ 213,275 $ 225,851 $ 237,442 $ 247,957 $ 257,297 $ 265,357 $ 272,031 $ 277,200<br />
Add Revenues:<br />
Taxes $ 75,006 $ 75,240 $ 75,481 $ 75,729 $ 75,985 $ 76,248 $ 76,519 $ 76,798 $ 77,086 $ 77,382<br />
Other Revenues 600 618 637 656 675 696 717 738 760 783<br />
Use <strong>of</strong> Money & Property 6,706 8,125 10,695 11,284 11,823 12,306 12,730 13,089 13,377 13,589<br />
Total Revenue $ 82,312 $ 83,983 $ 86,813 $ 87,669 $ 88,483 $ 89,250 $ 89,966 $ 90,625 $ 91,223 $ 91,754<br />
Less Appropriations:<br />
Landscape Contract $ 22,405 $ 23,993 $ 24,503 $ 25,023 $ 25,555 $ 26,100 $ 26,657 $ 27,225 $ 27,805 $ 28,397<br />
Landscape Extra Work 3,045 3,352 3,419 3,487 3,556 3,627 3,700 3,774 3,850 3,927<br />
Landscape Supplies 1,020 1,040 1,061 1,082 1,104 1,126 1,149 1,172 1,195 1,219<br />
Water 32,629 33,608 34,616 35,655 36,725 37,827 38,962 40,131 41,335 42,575<br />
Gas & Electricity 1,980 2,039 2,101 2,164 2,229 2,295 2,365 2,436 2,510 2,586<br />
Capital Replacement Reserve 3,000 3,000 3,000 3,000 3,000 3,000 3,000 3,000 3,000 3,000<br />
Assessment Engineering 3,000 3,061 3,123 3,186 3,250 3,315 3,381 3,448 3,518 3,589<br />
Printing, Publishing & Mailing 1,148 1,182 1,217 1,253 1,290 1,328 1,367 1,407 1,448 1,491<br />
County Collection Fees 538 549 560 572 584 596 608 620 633 646<br />
Other Fixed Charges 600 618 637 656 675 696 717 738 760 783<br />
Total Expenditures $ 69,365 $ 72,442 $ 74,237 $ 76,078 $ 77,968 $ 79,910 $ 81,906 $ 83,951 $ 86,054 $ 88,213<br />
Revenues Over (Under)<br />
Appropriations $ 12,947 $ 11,541 $ 12,576 $ 11,591 $ 10,515 $ 9,340 $ 8,060 $ 6,674 $ 5,169 $ 3,541<br />
Contingency Reserve $ 6,937 $ 7,244 $ 7,424 $ 7,608 $ 7,797 $ 7,991 $ 8,191 $ 8,395 $ 8,605 $ 8,821<br />
Fund Balance 6/30 $ 194,797 $ 206,031 $ 218,427 $ 229,834 $ 240,160 $ 249,306 $ 257,166 $ 263,636 $ 268,595 $ 271,920<br />
Notes:<br />
Meets all standards contained in the Budget and Fiscal Policies adopted by Council. This statement can be found on page 36.<br />
Other revenues provided by General Fund Support.<br />
Appropriations:<br />
Salaries and benefits have been budgeted per current labor agreements adjusted for step increases and assuming a full staffing level.<br />
Employee benefits expenses for medical insurance and retirement reflect recent higher than CPI increases and post retirement health includes amortization <strong>of</strong> OPEB accrued liability over 25-Year term.<br />
Non-labor operating expenditures for FY 2008 and the remainder <strong>of</strong> the 10-Year planning period, depending on the category, include increases between 2% and 3% for inflation.<br />
Includes internal service fund charges for information technology and workers' compensation.<br />
Contingency Reserve is a 10% <strong>of</strong> total appropriations.
<strong>City</strong> <strong>of</strong> <strong>Concord</strong><br />
Special Revenue Fund<br />
Storm Water Fund<br />
Ten Year Projection<br />
For the Year Ending June 30, 2008<br />
2007-08 2008-09 2009-10 2010-11 2011-12 2012-13 2013-14 2014-15 2015-16 2016-17<br />
Fund Balance - 7/01 $ 1,292,063 $ 1,292,360 $ 1,294,468 $ 1,249,205 $ 1,152,650 $ 987,719 $ 752,646 $ 438,119 $ 37,943 $ (444,154)<br />
Add Revenues:<br />
Taxes - Parcel Fees $ 1,951,330 $ 1,953,330 $ 1,955,330 $ 1,957,330 $ 1,959,330 $ 1,961,330 $ 1,963,330 $ 1,965,330 $ 1,967,330 $ 1,969,330<br />
Use <strong>of</strong> Money & Property 44,450 44,491 49,876 58,582 52,204 42,448 29,043 11,611<br />
-<br />
-<br />
Total Revenues $ 1,995,780 $ 1,997,821 $ 2,005,206 $ 2,015,912 $ 2,011,534 $ 2,003,778 $ 1,992,373 $ 1,976,941 $ 1,967,330 $ 1,969,330<br />
Less Appropriations:<br />
Operations $ 985,615 $ 1,011,898 $ 1,037,489 $ 1,065,093 $ 1,093,495 $ 1,121,869 $ 1,151,911 $ 1,182,806 $ 1,214,443 $ 1,246,975<br />
Prop 218 Vote 60,000<br />
-<br />
-<br />
-<br />
-<br />
-<br />
-<br />
-<br />
-<br />
-<br />
Drainage System 469,376 486,124 500,430 517,448 535,059 551,807 570,613 590,069 610,194 631,030<br />
Street Cleaning 480,492 497,691 512,550 529,926 547,911 565,175 584,376 604,242 624,790 646,068<br />
Total Appropriations $ 1,995,483 $ 1,995,713 $ 2,050,469 $ 2,112,467 $ 2,176,465 $ 2,238,851 $ 2,306,900 $ 2,377,117 $ 2,449,427 $ 2,524,073<br />
Excess (Deficiency) <strong>of</strong> Revenue<br />
Over (Under) Expenditures $ 297 $ 2,108 $ (45,263) $ (96,555) $ (164,931) $ (235,073) $ (314,527) $ (400,176) $ (482,097) $ (554,743)<br />
Less Reserves <strong>of</strong> 10 Percent $ 199,548 $ 199,571 $ 205,047 $ 211,247 $ 217,647 $ 223,885 $ 230,690 $ 237,712 $ 244,943 $ 252,407<br />
Less Capital Projects:<br />
Drainage Improvement -<br />
CCCWP Requirements -<br />
Total Capital Projects -<br />
-<br />
-<br />
-<br />
-<br />
-<br />
-<br />
-<br />
-<br />
-<br />
Fund Balance 6/30 $ 1,092,812 $ 1,094,897 $ 1,044,158 $ 941,403 $ 770,072 $ 528,761 $ 207,429 $ (199,769) $ (689,097) $ (1,251,304)<br />
Notes:<br />
Meets all standards contained in the Budget and Fiscal Policies adopted by Council. This statement can be found on page 36.<br />
Appropriations:<br />
Salaries and benefits have been budgeted per current labor agreements adjusted for step increases and assuming a full staffing level.<br />
Employee benefits expenses for medical insurance and retirement reflect recent higher than CPI increases. Post-retirement health expenses include adjustment for 25-Year amortization <strong>of</strong> accrued OPEB liability.<br />
Non-labor operating expenditures for FY 2008 and the remainder <strong>of</strong> the 10-Year planning period, depending on the category, include increases between 2% and 3% for inflation.<br />
Includes internal service fund charges for vehicles, information technology, workers' compensation and liability.<br />
Contingency Reserve is a 10% <strong>of</strong> total appropriations.<br />
-<br />
-<br />
-<br />
-<br />
-<br />
-<br />
-<br />
-<br />
-<br />
-<br />
-<br />
-<br />
-<br />
-<br />
-<br />
-<br />
-<br />
-
Employees <strong>of</strong><br />
the Street<br />
Maintenance<br />
Division are<br />
hard at work<br />
resurfacing<br />
one <strong>of</strong> the<br />
<strong>City</strong>’s streets.<br />
302<br />
The Storm Drain Maintenance<br />
Division shines the most in the winter<br />
months monitoring and diverting the<br />
rain water run<strong>of</strong>f to keep the streets<br />
from flooding.<br />
This is one <strong>of</strong> the vehicles used by the<br />
Street Sweeping Division <strong>of</strong> the Public<br />
Works Department to keep the <strong>City</strong>’s<br />
streets sparkling and free <strong>of</strong> debris.
CITY OF CONCORD<br />
DEBT SERVICE FUNDS<br />
FOR THE YEAR ENDING JUNE 30, 2008<br />
Debt Service Funds are used to account for accumulation <strong>of</strong> resources for payment <strong>of</strong> interest and<br />
principal on the <strong>City</strong>'s general bond debt. Debt Service Funds include:<br />
TAX ALLOCATION BONDS<br />
Redevelopment Agency Fund - Accounts for the accumulation <strong>of</strong> property taxes for payment <strong>of</strong> interest<br />
and principal on the Redevelopment Agency tax allocation bonds issued in 2004.<br />
REVENUE BONDS<br />
Police Facilities Revenue Bonds - To account for the accumulation <strong>of</strong> lease revenue for payment <strong>of</strong><br />
interest and principal on the Police Facility lease revenue bonds issued in 1993 by the Redevelopment<br />
Agency.<br />
Parking Structure Revenue Bonds - To account for the accumulation <strong>of</strong> resources for payment <strong>of</strong> interest<br />
and principal on the Parking Structure lease revenue bonds issued in 2001 by the Redevelopment<br />
Agency.<br />
Performing Arts Revenue Bonds - To account for the accumulation <strong>of</strong> revenue provided by Bill Graham<br />
Presents (a subsidiary <strong>of</strong> Clear Channel) for payment <strong>of</strong> interest and principal on the Pavilion lease<br />
revenue bonds issued in 1995.<br />
CERTIFICATES OF PARTICIPATION<br />
ABAG Fund - To account for transfers <strong>of</strong> revenue from the General Fund for payment <strong>of</strong> interest and<br />
principal on Association <strong>of</strong> Bay Area Governments (ABAG) certificates <strong>of</strong> participation.<br />
ASSESSMENT DISTRICTS<br />
Assessment Districts Fund - To account for the accumulation <strong>of</strong> special assessment taxes for payment <strong>of</strong><br />
special assessment bond interest and principal.<br />
303
Annual debt service requirements to maturity for long-term debt, including interest payments, are as follow:<br />
YEAR ENDING JUNE 30<br />
Tax<br />
Revenue<br />
Bonds<br />
Certificates<br />
Allocation Redevelopment Parking <strong>Concord</strong> <strong>of</strong><br />
Bonds Agency Structure Pavilion Participation Total<br />
2007-08 $ 6,376,571 $ 689,340 $ 738,691 $ 1,776,710 $ 98,213 $ 9,679,525<br />
2008-09 6,429,771<br />
2009-10 6,348,771<br />
2010-11 6,354,171<br />
2011-12 6,348,671<br />
2012-13 6,342,271<br />
2013-14 6,339,671<br />
2014-15 6,337,774<br />
2015-16 6,329,888<br />
2016-17 6,315,585<br />
CITY OF CONCORD<br />
DEBT SERVICE FUNDS<br />
FOR THE YEAR ENDING JUNE 30, 2008<br />
685,406<br />
685,194<br />
688,800<br />
686,225<br />
687,469<br />
682,631<br />
686,281<br />
683,588<br />
684,450<br />
739,691<br />
739,361<br />
738,021<br />
740,641<br />
741,966<br />
736,956<br />
740,581<br />
737,425<br />
737,675<br />
1,779,446<br />
1,776,856<br />
1,777,528<br />
1,773,256<br />
1,773,628<br />
1,777,820<br />
1,775,420<br />
1,776,016<br />
1,773,990<br />
97,684<br />
96,775<br />
95,484<br />
98,622<br />
-<br />
-<br />
-<br />
-<br />
-<br />
9,731,998<br />
9,646,957<br />
9,654,004<br />
9,647,415<br />
9,545,334<br />
9,537,078<br />
9,540,056<br />
9,526,917<br />
9,511,700<br />
Thereafter $ 37,828,361 $ 2,047,544 $ 4,438,793 $ 7,098,540 $ - $ 51,413,238<br />
Total $ 101,351,505 $ 8,906,928 $ 11,829,801 $ 24,859,210 $ 486,778 $ 147,434,222<br />
Funding Sources:<br />
Tax Allocation Bonds are paid by the incremental property taxes received by the Redevelopment Agency<br />
Capital Projects Fund.<br />
Redevelopment Agency and Parking Structure Revenue Bonds are paid by the lease revenue received by the<br />
Redevelopment Agency Capital Project Fund.<br />
<strong>Concord</strong> Pavilion Revenue Bonds will continue to be paid from operating revenues as part <strong>of</strong> the<br />
management agreement between the <strong>City</strong> <strong>of</strong> <strong>Concord</strong> and Bill Graham Enterprises, Inc.<br />
Certificates <strong>of</strong> Participation are paid by General Fund revenues ($98,213) in the ABAG Debt Service Fund.
Redevelopment Agency Tax Allocation Bonds<br />
CITY OF CONCORD<br />
TAX ALLOCATION BONDS<br />
FOR THE YEAR ENDING JUNE 30, 2008<br />
Resolution 04-430 <strong>of</strong> the <strong>City</strong> <strong>of</strong> <strong>Concord</strong> and Resolution 04-667 <strong>of</strong> the Redevelopment Agency<br />
<strong>of</strong> the <strong>City</strong> <strong>of</strong> <strong>Concord</strong> approved the Issuance <strong>of</strong> Tax Allocation Bonds by The Redevelopment<br />
Agency to defease the 1988 Current Interest Term Bonds, and the 1993 Subordinate Term<br />
Bonds.<br />
Principal Borrowed<br />
Series 2004 $ 72,310,000<br />
Payment Required Principal Interest Total<br />
Series 2004 $ 3,390,000 $ 2,986,571 $ 6,376,571<br />
Total $ 3,390,000 $ 2,986,571 $ 6,376,571<br />
Principal Outstanding as <strong>of</strong> June 30, 2008<br />
Series 2004 $ 65,445,000<br />
-<br />
Total $<br />
65,445,000
Redevelopment Agency Revenue Bonds<br />
Redevelopment Agency Lease Revenue Bonds were issued in 1993 to finance a portion <strong>of</strong> the<br />
Police Facilities Project leased by the <strong>City</strong>.<br />
Principal Borrowed<br />
Series 1993 $ 9,700,000<br />
Payment Required Principal Interest Total<br />
Series 1993 $ 360,000 $ 329,340 $ 689,340<br />
Principal Outstanding as <strong>of</strong> June 30, 2008<br />
Series 1993 $ 6,100,000<br />
Redevelopment Agency Parking Structure Bonds<br />
Redevelopment Agency Lease Revenue Bonds were issued in 2001 to finance the Todos<br />
Santos Parking Center in the downtown area.<br />
Principal Borrowed<br />
Series 2001 $ 9,580,000<br />
Payment Required Principal Interest Total<br />
Series 2001 $ 350,000 $ 388,691 $ 738,691<br />
Principal Outstanding as <strong>of</strong> June 30, 2008<br />
Series 2001 $ 7,670,000<br />
Performing Arts Center Lease Revenue Bonds<br />
CITY OF CONCORD<br />
REVENUE BONDS<br />
FOR THE YEAR ENDING JUNE 30, 2008<br />
Performing Arts Center Lease Revenue Bonds were issued in 1995 to finance a portion <strong>of</strong> the<br />
renovation and expansion <strong>of</strong> <strong>Concord</strong> Pavilion leased by the <strong>City</strong>.<br />
Principal Borrowed<br />
Series 1995 $ 18,700,000<br />
Payment Required Principal Interest Total<br />
Series 1995 $ 585,000 $ 1,191,710 $ 1,776,710<br />
Principal Outstanding as <strong>of</strong> June 30, 2008<br />
Series 1995 $ 14,170,000
<strong>City</strong> <strong>of</strong> <strong>Concord</strong> Certificates <strong>of</strong> Participation<br />
ABAG 41 - Certificates <strong>of</strong> Participation were issued in 1998 to fund Diablo Creek Golf<br />
Course improvements (Enterprise Fund) and to defease outstanding ABAG 23 Certificates <strong>of</strong><br />
Participation (Debt Service Fund) for renovation <strong>of</strong> Centre <strong>Concord</strong>.<br />
Principal Borrowed<br />
ABAG 41 - Centre <strong>Concord</strong> $ 810,000<br />
ABAG 41 - Diablo Creek Golf Course 2,750,000<br />
Total ABAG 41 $ 3,560,000<br />
Payment Required Principal Interest Total<br />
ABAG 41 - Centre <strong>Concord</strong> $ 85,000 $ 13,213 $ 98,213<br />
ABAG 41 - Diablo Creek Golf Course 120,000 93,535 $ 213,535<br />
Total $ 205,000 $ 106,748 $ 311,748<br />
Principal Outstanding as <strong>of</strong> June 30, 2008<br />
CITY OF CONCORD<br />
CERTIFICATES OF PARTICIPATION<br />
FOR THE YEAR ENDING JUNE 30, 2008<br />
ABAG 41 - Centre <strong>Concord</strong> $ 365,000<br />
ABAG 41 - Diablo Creek Golf Course 1,780,000<br />
Total principal outstanding - ABAG 41 $ 2,145,000
Special Assessment Districts within the <strong>City</strong> have issued debt repayable out <strong>of</strong> special assessments levied on property.<br />
Under the terms <strong>of</strong> the special assessment bond indentures, the <strong>City</strong> is obligated to be the purchaser <strong>of</strong> last resort <strong>of</strong><br />
<strong>of</strong> property on which any delinquent special assessments have been levied.<br />
Assessment Districts<br />
Balance<br />
July 1, 2006<br />
ASSETS - Cash and Investments $ 166,510<br />
LIABILITIES - Payable $ 166,510<br />
$1,000,000<br />
$800,000<br />
$600,000<br />
$400,000<br />
$200,000<br />
$0<br />
Source: <strong>City</strong> <strong>of</strong> <strong>Concord</strong> Financial Statements<br />
CITY OF CONCORD<br />
SPECIAL ASSESSMENT DISTRICTS DEBT<br />
FOR THE YEAR ENDING JUNE 30, 2008<br />
SPECIAL ASSESSMENT<br />
BILLINGS AND COLLECTIONS<br />
LAST TEN FISCAL YEARS<br />
1998 1999 2000 2001 2002 2003 2004 2005 2006 2007<br />
Special Assessment Billings and Collections<br />
Fiscal Special Assessment<br />
Year Billings and Collections<br />
1998 $ 697,638<br />
1999 693,220<br />
2000 711,774<br />
2001 701,531<br />
2002 648,564<br />
2003 628,420<br />
2004 587,663<br />
2005 99,623<br />
2006 75,021<br />
2007 $ 72,523
COMPUTATION OF DIRECT AND<br />
OVERLAPPING BONDED DEBT<br />
June 30, 2008 (1)<br />
Percentage Amount<br />
Net Applicable Applicable<br />
Debt to <strong>City</strong> <strong>of</strong> to <strong>City</strong> <strong>of</strong><br />
JURISDICTION Outstanding <strong>Concord</strong> <strong>Concord</strong><br />
2005-06 Assessed Valuation, Direct and Overlapping Bonded Debt $ 11,825,275,824<br />
Mt. Diablo Unified School District Community Facilities District No. 1 $ 73,115,000 42.161% $ 30,826,015<br />
Bay Area Rapid Transit District 100,000,000<br />
Mt. Diablo Unified School District 226,885,000<br />
East Bay Regional Park District 111,170,000<br />
Contra Costa County Reassessment District 4,585,000<br />
Contra Costa County General Fund Obligations 301,770,000<br />
Contra Costa County Pension Obligations 537,005,000<br />
Contra Costa County Board <strong>of</strong> Education Certificates <strong>of</strong> Participation 1,310,000<br />
Contra Costa County Fire Protection District Pension Obligations 129,900,000<br />
Contra Costa Community College District 115,000,000<br />
Contra Costa Community College District Certificates <strong>of</strong> Participation 1,215,000<br />
Mt. Diablo Unified School District Certificates <strong>of</strong> Participation 6,310,000<br />
2.830% 2,830,000<br />
42.161% 95,656,985<br />
4.140% 4,602,438<br />
7.513% 344,471<br />
8.939% 26,975,220<br />
8.939% 48,002,877<br />
8.939% 117,101<br />
19.309% 25,082,391<br />
8.956% 10,299,400<br />
8.956% 108,815<br />
42.161% 2,660,359<br />
TOTAL OVERLAPPING BONDED DEBT $ 1,608,265,000<br />
$ 247,506,072<br />
<strong>City</strong> <strong>of</strong> <strong>Concord</strong> 1915 Act Bonds 277,000<br />
<strong>City</strong> <strong>of</strong> <strong>Concord</strong> General Obligations 32,995,000<br />
<strong>City</strong> <strong>of</strong> <strong>Concord</strong> Judgment Obligations 3,130,000<br />
100.000% 277,000<br />
100.000% 32,995,000<br />
100.000% 3,130,000<br />
TOTAL DIRECT AND OVERLAPPING BONDED DEBT $ 1,644,667,000 (2) $ 283,908,072<br />
(1) Actual through June 30, 2006.<br />
(2) Excludes tax and revenue anticipation notes, revenue, mortgage revenue and tax allocation bonds and non-bonded capital lease obligations.<br />
Ratios to Assessed Valuation: Direct Debt %.31%-Total Gross Debt % 1.22%.<br />
SOURCE: California Municipal Statistics, Inc.
Thousands<br />
$25,000<br />
$24,000<br />
$23,000<br />
$22,000<br />
$21,000<br />
$20,000<br />
$19,000<br />
$18,000<br />
$17,000<br />
$16,000<br />
$15,000<br />
$14,000<br />
Property Tax Levies and Collections<br />
Last Ten Fiscal Years<br />
1997 1998 1999 2000 2001 2002 2003 2004 2005 2006<br />
Tax Levy and Collections<br />
Percent Value <strong>of</strong><br />
<strong>of</strong> Total <strong>City</strong> Property<br />
Total General Fund Debt Service Redevelopment Total Tax Subject to<br />
Fiscal Secured Tax Fund Tax Agency Fund Tax Collections Local<br />
Year Tax Levy Collections Collections Tax Collections Collections to Tax Levy Tax Rate<br />
1997 16,271,924 6,529,582<br />
- 9,742,342 16,271,924 100.00% 6,643,935,928<br />
1998 16,054,020 6,788,131<br />
- 9,265,889 16,054,020 100.00% 6,706,556,992<br />
1999 17,378,653 7,334,299<br />
- 10,044,354 17,378,653 100.00% 7,006,505,546<br />
2000 18,539,359 7,754,533<br />
- 10,784,826 18,539,359 100.00% 7,435,492,886<br />
2001 18,978,753 8,373,732<br />
- 10,605,020 18,978,752 100.00% 7,937,505,627<br />
2002 20,874,360 9,415,843<br />
- 11,458,517 20,874,360 100.00% 8,698,950,248<br />
2003 22,268,670 10,320,110<br />
- 11,948,560 22,268,670 100.00% 9,303,585,906<br />
2004 23,117,284 10,743,130<br />
- 12,374,154 23,117,284 100.00% 10,046,422,371<br />
2005 21,710,945 (A) 10,652,549<br />
- 11,058,396 (A) 21,710,945 100.00% 10,758,352,096<br />
2006 $ 23,202,024 (A) $ 11,773,593 $ - $ 11,428,431 (A) $ 23,202,024 100.00% 11,825,275,824<br />
2007 * $ 12,581,572,120<br />
* Source: Contra Costa County Auditor-Controller’s Office and the <strong>City</strong> <strong>of</strong> <strong>Concord</strong>’s Finance Department. Information available in October, 2007.<br />
Note: A reserve is established by the County <strong>of</strong> Contra Costa under Revenue and Taxation Code Section 4701-4716 to cover all secured<br />
delinquencies, thus providing the <strong>City</strong> <strong>of</strong> <strong>Concord</strong> with 100% collection <strong>of</strong> its annual tax levy.<br />
(A) Tax collections in FY2005 and FY2006 are net <strong>of</strong> pass-thru payment and educational revenue augmentation fund withholding.<br />
Billions<br />
$13<br />
$12<br />
$11<br />
$10<br />
$9<br />
$8<br />
$7<br />
$6<br />
1997 1998 1999 2000 2001 2002 2003 2004 2005 2006<br />
Value <strong>of</strong> Property
CITY OF CONCORD<br />
CAPITAL PROJECTS FUNDS<br />
FOR THE YEAR ENDING JUNE 30, 2008<br />
Capital Projects Funds are used to account for resources used for the acquisition and construction <strong>of</strong><br />
capital facilities or major capital equipment, except for capital facilities financed by Proprietary or Special<br />
Revenue Funds. Capital Projects Funds include:<br />
Measure C/Measure C I-680/Measure J – Accounts for transportation improvements funded by Contra<br />
Costa County’s ½% sales tax. Measure C was approved in 1988 and Measure J in 2004. Measure C<br />
authorizes the ½% sales tax through 2009 and Measure J continues the ½% sales tax in 2010 and<br />
beyond.<br />
Special Developers Fund - To account for capital projects within the <strong>City</strong> funded by various fees collected<br />
from developers.<br />
Parkland Fee – Residential developers are responsible for providing park land and recreation<br />
sources for <strong>Concord</strong>’s citizens (Chapter 3 (2), Article IV <strong>of</strong> the <strong>City</strong> <strong>Concord</strong> Municipal Code.<br />
Off-site Street Improvement Program (OSIP) – the method used by the <strong>City</strong> to fund base-level<br />
General Plan street improvements.<br />
Storm Drain Zones/Traffic Mitigation – The ongoing development <strong>of</strong> real property in the city has<br />
placed a serious demand upon existing storm drains and certain streets. In order to provide an<br />
equitable manner <strong>of</strong> apportionment <strong>of</strong> the cost <strong>of</strong> future development <strong>of</strong> these facilities, the city<br />
has established local drainage areas and traffic mitigation areas.<br />
Federal Street Assistance Fund - To account for approved capital projects funded by federal revenues.<br />
Intermodal Surface Transportation Efficiency Act (ISTEA) – Federal monies signed into law in<br />
1991 that calls for broad changes in the way transportation decisions are made. ISTEA<br />
emphasizes diversity and balance <strong>of</strong> transportation modes as well as the preservation <strong>of</strong> existing<br />
systems before the construction <strong>of</strong> new facilities.<br />
Transportation Equity Act for the 21 st Century (TEA-21) – The most recent Federal highway<br />
funding program for streets and roads.<br />
Traffic Congestion Relief - Accounts for sales tax revenues used for local streets and roads construction<br />
projects.<br />
Proposition 1B (LSR) - Accounts for projects financed by the State <strong>of</strong> California Transportation Bond Act<br />
passed in 2006. It includes a Local Streets and Roads (LSR) component to help relieve traffic<br />
congestion, facilitate movement <strong>of</strong> goods, improve air quality, and enhance safety and security <strong>of</strong> the<br />
transportation system.<br />
Assessment Districts - Accounts for specific public improvements such as streets, sewers, storm drains,<br />
or sidewalks or other amenities funded by special assessments against benefited properties.<br />
General Reimbursable Projects – Accounts for projects financed by grants, donations, or reimbursed to<br />
the <strong>City</strong> from developers and for General Fund transfers expended for acquisition and construction <strong>of</strong><br />
general purpose public facilities and improvements.<br />
311
CITY OF CONCORD<br />
CAPITAL PROJECTS FUNDS<br />
FOR THE YEAR ENDING JUNE 30, 2008<br />
Measure Measure C Dev Fees Dev. Fees<br />
Fund C I-680 Parkland O.S.I.P.<br />
FUND BALANCE<br />
AS OF JULY 1, 2007 $ 496,734 $ - $ 415,473 $<br />
-<br />
REVENUES<br />
Taxes $ - $ - $ 690,704 $ 3,764,031<br />
Use <strong>of</strong> Money & Property 22,136<br />
-<br />
28,000<br />
98,204<br />
Intergovernmental 1,544,000<br />
-<br />
-<br />
-<br />
Other -<br />
-<br />
-<br />
-<br />
Total Revenues $ 1,566,136 $ - $ 718,704 $ 3,862,235<br />
EXPENDITURES<br />
Capital Projects $ 1,482,395 $ - $ 1,032,000 $ 1,368,848<br />
Other -<br />
-<br />
-<br />
-<br />
Total Expenditures $ 1,482,395 $ - $ 1,032,000 $ 1,368,848<br />
OTHER FINANCING SOURCES (USES)<br />
Transfer In/Proceeds from Debt $ - $ - $ - $<br />
-<br />
Transfer Out -<br />
-<br />
-<br />
-<br />
Total Other Financing<br />
Sources (Uses) $ - $ - $ - $<br />
-<br />
Excess (Deficiency) <strong>of</strong> Revenues and<br />
Other Financing Sources over<br />
(under) expenditures and Other<br />
Financing Uses 83,741<br />
-<br />
(313,296)<br />
2,493,387<br />
FUND BALANCE JUNE 30, 2008 $ 580,475 $ - $ 102,177 $ 2,493,387<br />
PROJECT CARRYOVER<br />
(These numbers represent funds which have been allocated but<br />
have not been spent as June 30,2007<br />
$ 787,048 $ 1,158,128 $ 162,023 $<br />
2,920,367
CITY OF CONCORD<br />
CAPITAL PROJECTS FUNDS<br />
FOR THE YEAR ENDING JUNE 30, 2008<br />
Traffic General<br />
Storm Drain Federal Congest. Relief Assessment Reimbursable<br />
& Traffic Mit. Grants & Prop 1B (LSR) Districts Projects<br />
$ 273,176 $ - $ 909,746 $ - $<br />
-<br />
$ 35,000 $ - $ - $ - $<br />
-<br />
15,393<br />
-<br />
3,513<br />
-<br />
-<br />
-<br />
-<br />
-<br />
-<br />
7,063,330<br />
-<br />
-<br />
-<br />
-<br />
-<br />
$ 50,393 $ - $ 3,513 $ - $ 7,063,330<br />
$ - $ - $ 913,259 $ - $ 7,794,943<br />
-<br />
-<br />
-<br />
-<br />
-<br />
$ - $ - $ 913,259 $ - $ 7,794,943<br />
$ - $ - $ - $ - $ 731,613<br />
-<br />
-<br />
-<br />
-<br />
-<br />
$ - $ - $ - $ - $ 731,613<br />
50,393<br />
-<br />
(909,746)<br />
$ 323,569 $ - $ - $ - $<br />
-<br />
$ 133,065 $ - $ - $ - $<br />
6,325,776<br />
-<br />
-
Measure C<br />
2007-08 2008-09 2009-10 2010-11 2011-12 2012-13 2013-14 2014-15 2015-16 2016-17<br />
Fund Balance - 7/1 $ 496,734 $ 580,475 $ 946,126 $ - $ - $ - $ - $ - $ - $<br />
-<br />
Add Revenues<br />
Intergovernmental $ 1,544,000 $ 1,598,040 $ - $ - $ - $ - $ - $ - $ - $<br />
-<br />
Use <strong>of</strong> Money & Property 22,136 22,911 2,500<br />
-<br />
-<br />
-<br />
-<br />
-<br />
-<br />
-<br />
Total Revenues $ 1,566,136 $ 1,620,951 $ 2,500 $ - $ - $ - $ - $ - $ - $<br />
-<br />
Less Appropriations<br />
Capital Projects $ 1,482,395 $ 1,255,300 $ 947,685 $ - $ - $ - $ - $ - $ - $<br />
-<br />
Total Appropriations $ 1,482,395 $ 1,255,300 $ 947,685 $ - $ - $ - $ - $ - $ - $<br />
-<br />
Excess (Deficiency) <strong>of</strong> Revenues<br />
Over (Under) Expenditures 83,741<br />
365,651<br />
(945,185)<br />
Fund Balance - 6/30 $ 580,475 $ 946,126 $ - $ - $ - $ - $ - $ - $ - $<br />
-<br />
Measure J<br />
-<br />
-<br />
2007-08 2008-09 2009-10 2010-11 2011-12 2012-13 2013-14 2014-15 2015-16 2016-17<br />
Fund Balance - 7/1 $ - $ - $ - $ 584,805 $ 685,608 $ 816,402 $ 496,705 $ 411,766 $ 374,439 $ 286,018<br />
Add Revenues<br />
Intergovernmental $ - $ - $ 1,653,971 $ 1,711,860 $ 1,771,775 $ 1,833,787 $ 1,897,970 $ 1,964,399 $ 2,033,153 $ 2,104,313<br />
Use <strong>of</strong> Money & Property -<br />
- 20,882 24,844 29,302 19,001 15,952 14,708 11,836 3,881<br />
Total Revenues $ - $ - $ 1,674,853 $ 1,736,704 $ 1,801,077 $ 1,852,788 $ 1,913,922 $ 1,979,107 $ 2,044,989 $ 2,108,194<br />
Less Appropriations<br />
Capital Projects $ - $ - $ 1,090,048 $ 1,635,901 $ 1,670,284 $ 2,172,485 $ 1,998,861 $ 2,016,433 $ 2,133,410 $ 2,349,937<br />
Total Appropriations $ - $ - $ 1,090,048 $ 1,635,901 $ 1,670,284 $ 2,172,485 $ 1,998,861 $ 2,016,433 $ 2,133,410 $ 2,349,937<br />
Excess (Deficiency) <strong>of</strong> Revenues<br />
Over (Under) Expenditures -<br />
-<br />
584,805<br />
CITY OF CONCORD<br />
CAPITAL PROJECTS FUNDS<br />
100,803<br />
Fund Balance - 6/30 $ - $ - $ 584,805 $ 685,608 $ 816,402 $ 496,705 $ 411,766 $ 374,439 $ 286,018 $ 44,276<br />
130,793<br />
-<br />
(319,697)<br />
-<br />
(84,939)<br />
-<br />
(37,326)<br />
-<br />
(88,421)<br />
-<br />
(241,743)
Developer Fees Traffic Mitigation<br />
2007-08 2008-09 2009-10 2010-11 2011-12 2012-13 2013-14 2014-15 2015-16 2016-17<br />
Fund Balance - 7/1 $ 1,561 $ 1,623 $ 2,696 $ 3,764 $ 9,402 $ 14,594 $ 15,178 $ 15,178 $ 15,178 $ 15,178<br />
Add Revenues<br />
Intergovernmental $ - $ 63,000 $ 60,000 $ 343,000 $ 301,000 $ - $ - $ - $ - $<br />
-<br />
Use <strong>of</strong> Money & Property 62<br />
1,073 1,068 5,639 5,192<br />
584<br />
-<br />
-<br />
-<br />
-<br />
Total Revenues $ 62 $ 64,073 $ 61,068 $ 348,639 $ 306,192 $ 584 $ - $ - $ - $<br />
-<br />
Less Appropriations<br />
Capital Projects $ - $ 63,000 $ 60,000 $ 343,000 $ 301,000 $ - $ - $ - $ - $<br />
-<br />
Total Appropriations $ - $ 63,000 $ 60,000 $ 343,000 $ 301,000 $ - $ - $ - $ - $<br />
-<br />
Excess (Deficiency) <strong>of</strong> Revenues<br />
Over (Under) Expenditures 62<br />
1,073<br />
1,068<br />
5,639<br />
Fund Balance - 6/30 $ 1,623 $ 2,696 $ 3,764 $ 9,402 $ 14,594 $ 15,178 $ 15,178 $ 15,178 $ 15,178 $ 15,178<br />
Developer Fees Parkland<br />
5,192<br />
2007-08 2008-09 2009-10 2010-11 2011-12 2012-13 2013-14 2014-15 2015-16 2016-17<br />
Fund Balance - 7/1 $ 415,473 $ 102,177 $ 2,393,802 $ 1,605,802 $ 1,146,802 $ 831,802 $ 639,802 $ 583,802 $ 548,802 $ 536,802<br />
Add Revenues<br />
Licenses & Permits $ 690,704 $ 3,975,625 $ 151,000 $ 704,000 $ 740,000 $ 686,000 $ 707,000 $ 728,000 $ 750,000 $ 772,000<br />
Use <strong>of</strong> Money & Property 28,000 66,000 61,000 47,000 34,000 22,000 37,000 37,000 38,000 68,000<br />
Total Revenues $ 718,704 $ 4,041,625 $ 212,000 $ 751,000 $ 774,000 $ 708,000 $ 744,000 $ 765,000 $ 788,000 $ 840,000<br />
Less Appropriations<br />
GF Repayment $ - $ 200,000 $ 200,000 $ 200,000 $ 200,000 $ 100,000 $ - $ - $ - $<br />
-<br />
Capital Projects 1,032,000 1,550,000 800,000 1,010,000 889,000 800,000 800,000 800,000 800,000 800,000<br />
Total Appropriations $ 1,032,000 $ 1,750,000 $ 1,000,000 $ 1,210,000 $ 1,089,000 $ 900,000 $ 800,000 $ 800,000 $ 800,000 $ 800,000<br />
Excess (Deficiency) <strong>of</strong> Revenues<br />
Over (Under) Expenditures (313,296)<br />
2,291,625<br />
(788,000)<br />
CITY OF CONCORD<br />
CAPITAL PROJECTS FUNDS<br />
(459,000)<br />
Fund Balance - 6/30 $ 102,177 $ 2,393,802 $ 1,605,802 $ 1,146,802 $ 831,802 $ 639,802 $ 583,802 $ 548,802 $ 536,802 $ 576,802<br />
(315,000)<br />
584<br />
(192,000)<br />
-<br />
(56,000)<br />
-<br />
(35,000)<br />
-<br />
(12,000)<br />
-<br />
40,000
Developer Fees OSIP<br />
2007-08 2008-09 2009-10 2010-11 2011-12 2012-13 2013-14 2014-15 2015-16 2016-17<br />
Fund Balance - 7/1 $ - $ 2,493,387 $ 2,376,663 $ 2,235,959 $ 1,300,098 $ 1,421,992 $ 1,776,049 $ 2,089,549 $ 2,321,080 $ 2,575,803<br />
Add Revenues<br />
Licenses & Permits $ 3,764,031 $ 2,153,666 $ 1,706,330 $ 936,000 $ 1,068,000 $ 1,100,000 $ 1,133,000 $ 1,168,000 $ 1,203,000 $ 1,239,000<br />
Use <strong>of</strong> Money & Property 98,204 104,463 95,317 63,600 58,276 68,320 79,784 88,893 97,716 107,167<br />
Total Revenues $ 3,862,235 $ 2,258,129 $ 1,801,647 $ 999,600 $ 1,126,276 $ 1,168,320 $ 1,212,784 $ 1,256,893 $ 1,300,716 $ 1,346,167<br />
Less Appropriations<br />
Capital Projects $ 1,368,848 $ 2,374,853 $ 1,942,351 $ 1,935,461 $ 1,004,382 $ 814,263 $ 899,284 $ 1,025,362 $ 1,045,993 $ 1,075,572<br />
Total Appropriations $ 1,368,848 $ 2,374,853 $ 1,942,351 $ 1,935,461 $ 1,004,382 $ 814,263 $ 899,284 $ 1,025,362 $ 1,045,993 $ 1,075,572<br />
Excess (Deficiency) <strong>of</strong> Revenues<br />
Over (Under) Expenditures 2,493,387<br />
(116,724)<br />
(140,704)<br />
(935,861)<br />
Fund Balance - 6/30 $ 2,493,387 $ 2,376,663 $ 2,235,959 $ 1,300,098 $ 1,421,992 $ 1,776,049 $ 2,089,549 $ 2,321,080 $ 2,575,803 $ 2,846,398<br />
Developer Fees Storm Drain<br />
121,894<br />
354,057<br />
313,500<br />
231,531<br />
254,723<br />
2007-08 2008-09 2009-10 2010-11 2011-12 2012-13 2013-14 2014-15 2015-16 2016-17<br />
Fund Balance - 7/1 $ 271,615 $ 321,946 $ 375,528 $ 432,539 $ 493,166 $ 557,603 $ 626,059 $ 698,748 $ 775,900 $ 857,753<br />
Add Revenues<br />
Licenses & Permits $ 35,000 $ 35,700 $ 36,414 $ 37,142 $ 37,885 $ 38,643 $ 39,416 $ 40,204 $ 41,008 $ 41,828<br />
Use <strong>of</strong> Money & Property 15,331 17,882 20,597 23,484 26,553 29,812 33,274 36,948 40,845 44,979<br />
Total Revenues $ 50,331 $ 53,582 $ 57,011 $ 60,626 $ 64,438 $ 68,455 $ 72,689 $ 77,152 $ 81,853 $ 86,807<br />
Less Appropriations<br />
Capital Projects $ - $ - $ - $ - $ - $ - $ - $ - $ - $<br />
-<br />
Total Appropriations $ - $ - $ - $ - $ - $ - $ - $ - $ - $<br />
-<br />
Other Financing Sources<br />
Proceeds from Debt Issuance $ - $ - $ - $ - $ - $ - $ - $ - $ - $<br />
-<br />
Excess (Deficiency) <strong>of</strong> Revenues<br />
Over (Under) Expenditures 50,331<br />
53,582<br />
57,011<br />
CITY OF CONCORD<br />
CAPITAL PROJECTS FUNDS<br />
60,626<br />
Fund Balance - 6/30 $ 321,946 $ 375,528 $ 432,539 $ 493,166 $ 557,603 $ 626,059 $ 698,748 $ 775,900 $ 857,753 $ 944,560<br />
64,438<br />
68,455<br />
72,689<br />
77,152<br />
81,853<br />
270,595<br />
86,807
General Fund Reimbursables Projects<br />
2007-08 2008-09 2009-10 2010-11 2011-12 2012-13 2013-14 2014-15 2015-16 2016-17<br />
Fund Balance - 7/1 $ - $ - $ - $ - $ - $ - $ - $ - $ - $<br />
-<br />
Add Revenues<br />
Intergovernmental $ 7,063,330 $ 2,954,701 $ 850,590 $ 876,108 $ 3,777,417 $ 929,463 $ 957,347 $ 986,067 $ 1,015,649 $ 1,046,119<br />
Use <strong>of</strong> Money & Property -<br />
-<br />
-<br />
-<br />
-<br />
-<br />
-<br />
-<br />
-<br />
-<br />
Total Revenues $ 7,063,330 $ 2,954,701 $ 850,590 $ 876,108 $ 3,777,417 $ 929,463 $ 957,347 $ 986,067 $ 1,015,649 $ 1,046,119<br />
Less Appropriations<br />
Capital Projects $ 7,063,330 $ 2,954,701 $ 850,590 $ 876,108 $ 3,777,417 $ 929,463 $ 957,347 $ 986,067 $ 1,015,649 $ 1,046,119<br />
Total Appropriations $ 7,063,330 $ 2,954,701 $ 850,590 $ 876,108 $ 3,777,417 $ 929,463 $ 957,347 $ 986,067 $ 1,015,649 $ 1,046,119<br />
Excess (Deficiency) <strong>of</strong> Revenues<br />
Over (Under) Expenditures -<br />
-<br />
-<br />
Fund Balance - 6/30 $ - $ - $ - $ - $ - $ - $ - $ - $ - $<br />
-<br />
General Fund Projects<br />
-<br />
-<br />
2007-08 2008-09 2009-10 2010-11 2011-12 2012-13 2013-14 2014-15 2015-16 2016-17<br />
Fund Balance - 7/1 $ - $ - $ - $ - $ - $ - $ - $ - $ - $<br />
-<br />
Add Revenues<br />
Intergovernmental $ - $ - $ - $ - $ - $ - $ - $ - $ - $<br />
-<br />
Use <strong>of</strong> Money & Property -<br />
-<br />
-<br />
-<br />
-<br />
-<br />
-<br />
-<br />
-<br />
-<br />
Total Revenues $ - $ - $ - $ - $ - $ - $ - $ - $ - $<br />
-<br />
Less Appropriations<br />
Capital Projects $ 731,613 $ 622,323 $ 507,942 $ 460,340 $ 462,810 $ 465,354 $ 467,975 $ 470,674 $ 473,455 $ 476,319<br />
Total Appropriations $ 731,613 $ 622,323 $ 507,942 $ 460,340 $ 462,810 $ 465,354 $ 467,975 $ 470,674 $ 473,455 $ 476,319<br />
Other Financing Sources<br />
Transfers In $ 731,613 $ 622,323 $ 507,942 $ 460,340 $ 462,810 $ 465,354 $ 467,975 $ 470,674 $ 473,455 $ 476,319<br />
Excess (Deficiency) <strong>of</strong> Revenues<br />
Over (Under) Expenditures -<br />
-<br />
CITY OF CONCORD<br />
CAPITAL PROJECTS FUNDS<br />
-<br />
Fund Balance - 6/30 $ - $ - $ - $ - $ - $ - $ - $ - $ - $<br />
-<br />
-<br />
-<br />
-<br />
-<br />
-<br />
-<br />
-<br />
-<br />
-<br />
-<br />
-<br />
-
2007-08 2008-09 2009-10 2010-11 2011-12 2012-13 2013-14 2014-15 2015-16 2016-17<br />
Measure C I-680<br />
Measure J Major Streets<br />
Fund Balance - 7/1 $ - $ - $ - $ - $ - $ - $ - $ - $ - $<br />
-<br />
Add Revenues<br />
Intergovernmental $ - $ 1,000,000 $ 2,000,000 $ 9,000,000 $ - $ - $ - $ - $ - $<br />
-<br />
Use <strong>of</strong> Money & Property -<br />
-<br />
-<br />
-<br />
-<br />
-<br />
-<br />
-<br />
-<br />
-<br />
Total Revenues $ - $ 1,000,000 $ 2,000,000 $ 9,000,000 $ - $ - $ - $ - $ - $<br />
-<br />
Less Appropriations<br />
Capital Projects $ - $ 1,000,000 $ 2,000,000 $ 9,000,000 $ - $ - $ - $ - $ - $<br />
-<br />
Total Appropriations $ - $ 1,000,000 $ 2,000,000 $ 9,000,000 $ - $ - $ - $ - $ - $<br />
-<br />
Excess (Deficiency) <strong>of</strong> Revenues<br />
Over (Under) Expenditures -<br />
-<br />
-<br />
Fund Balance - 6/30 $ - $ - $ - $ - $ - $ - $ - $ - $ - $<br />
-<br />
ISTEA/TEA Federal Grants<br />
-<br />
-<br />
2007-08 2008-09 2009-10 2010-11 2011-12 2012-13 2013-14 2014-15 2015-16 2016-17<br />
Fund Balance - 7/1 $ - $ - $ - $ - $ - $ - $ - $ - $ - $<br />
-<br />
Add Revenues<br />
Intergovernmental $ - $ 500,000 $ - $ 500,000 $ - $ 500,000 $ - $ 500,000 $ - $ 500,000<br />
Use <strong>of</strong> Money & Property -<br />
-<br />
-<br />
-<br />
-<br />
-<br />
-<br />
-<br />
-<br />
-<br />
Total Revenues $ - $ 500,000 $ - $ 500,000 $ - $ 500,000 $ - $ 500,000 $ - $ 500,000<br />
Less Appropriations<br />
Capital Projects $ - $ 500,000 $ - $ 500,000 $ - $ 500,000 $ - $ 500,000 $ - $ 500,000<br />
Total Appropriations $ - $ 500,000 $ - $ 500,000 $ - $ 500,000 $ - $ 500,000 $ - $ 500,000<br />
Other Financing Sources<br />
Transfers In $ - $ - $ - $ - $ - $ - $ - $ - $ - $<br />
-<br />
Excess (Deficiency) <strong>of</strong> Revenues<br />
Over (Under) Expenditures -<br />
-<br />
CITY OF CONCORD<br />
CAPITAL PROJECTS FUNDS<br />
-<br />
Fund Balance - 6/30 $ - $ - $ - $ - $ - $ - $ - $ - $ - $<br />
-<br />
-<br />
-<br />
-<br />
-<br />
-<br />
-<br />
-<br />
-<br />
-<br />
-<br />
-<br />
-
Traffic Congestion Relief<br />
2007-08 2008-09 2009-10 2010-11 2011-12 2012-13 2013-14 2014-15 2015-16 2016-17<br />
Fund Balance - 7/1 $ 909,746 $ - $ - $ - $ - $ - $ - $ - $ - $<br />
-<br />
Add Revenues<br />
Intergovernmental $ - $ 1,277,938 $ - $ - $ - $ - $ - $ - $ - $<br />
-<br />
Use <strong>of</strong> Money & Property 3,513<br />
8,702<br />
-<br />
-<br />
`<br />
-<br />
-<br />
-<br />
-<br />
-<br />
-<br />
Total Revenues $ 3,513 $ 1,286,640 $ - $ - $ - $ - $ - $ - $ - $<br />
-<br />
Less Appropriations<br />
Capital Projects $ 913,259 $ 1,286,640 $ - $ - $ - $ - $ - $ - $ - $<br />
-<br />
Total Appropriations $ 913,259 $ 1,286,640 $ - $ - $ - $ - $ - $ - $ - $<br />
-<br />
Excess (Deficiency) <strong>of</strong> Revenues<br />
Over (Under) Expenditures (909,746)<br />
-<br />
-<br />
Fund Balance - 6/30 $ - $ - $ - $ - $ - $ - $ - $ - $ - $<br />
-<br />
Prop. 1B LSR<br />
-<br />
-<br />
2007-08 2008-09 2009-10 2010-11 2011-12 2012-13 2013-14 2014-15 2015-16 2016-17<br />
Fund Balance - 7/1 $ - $ - $ 211,603 $ 485,697 $ 385,309 $ 164,714 $ 86,338 $ 219,317 $ 84,198 $ 212,307<br />
Add Revenues<br />
Intergovernmental $ - $ 960,000 $ 480,000 $ 251,400 $ 251,400 $ 251,400 $ 251,400 $ 251,400 $ 251,400 $ 251,600<br />
Use <strong>of</strong> Money & Property - 11,008 17,558 14,890 8,005 4,616 8,058 4,832 7,845 2,365<br />
Total Revenues $ - $ 971,008 $ 497,558 $ 266,290 $ 259,405 $ 256,016 $ 259,458 $ 256,232 $ 259,245 $ 253,965<br />
Less Appropriations<br />
Capital Projects $ - $ 759,405 $ 223,464 $ 366,678 $ 480,000 $ 334,392 $ 126,479 $ 391,351 $ 131,136 $ 466,272<br />
Total Appropriations $ - $ 759,405 $ 223,464 $ 366,678 $ 480,000 $ 334,392 $ 126,479 $ 391,351 $ 131,136 $ 466,272<br />
Excess (Deficiency) <strong>of</strong> Revenues<br />
Over (Under) Expenditures -<br />
211,603<br />
274,094<br />
CITY OF CONCORD<br />
CAPITAL PROJECTS FUNDS<br />
(100,388)<br />
Fund Balance - 6/30 $ - $ 211,603 $ 485,697 $ 385,309 $ 164,714 $ 86,338 $ 219,317 $ 84,198 $ 212,307 $<br />
-<br />
(220,595)<br />
-<br />
(78,376)<br />
-<br />
132,979<br />
-<br />
(135,119)<br />
-<br />
128,109<br />
-<br />
(212,307)
CITY OF CONCORD<br />
CAPITAL PROJECTS FUNDS<br />
FOR THE YEAR ENDING JUNE 30, 2008<br />
A detailed description <strong>of</strong> each capital project is in the Capital Improvement Program (CIP) budget. Project<br />
description identifies the funding source(s), future operating costs, prior and future appropriations, and<br />
any new revenues. The indexes located in the back <strong>of</strong> the CIP budget document will direct you to the<br />
description page via project number or name.<br />
Projects have been prioritized in accordance to the <strong>City</strong>'s Mission, Visions and Values criteria: (1) public<br />
safety, (2) neighborhood preservation and enhancement, (3) revenue enhancement, (4) infrastructure<br />
preservation-enhancement.<br />
The projects listed below are the new allocations for Fiscal Year 2008 only.<br />
DEVELOPER FEES<br />
These include projects paid for by Off-site Street Improvement Program (OSIP), Parkland Dedication Fees<br />
Traffic Mitigation and Storm Drain Fees<br />
OSIP<br />
Project #1024, Annual CIP/TIP Management Program $ 110,048<br />
Funds the annual development <strong>of</strong> the CIP/TIP Budget.<br />
Project #1951, <strong>City</strong>-wide Traffic Improvements 915,000<br />
Provides <strong>City</strong>wide traffic and street improvements.<br />
Project #2012, <strong>Concord</strong> Blvd/Farm Bureau Rd. 28,000<br />
Improves and enhances pedestrian connectivity to five schools.<br />
Project #2053, 'Waterworld Parkway Bridge over Walnut Creek 100,000<br />
Construct a two-lane bridge over Walnut Creek connecting Waterworld Parkway with<br />
Meridian Park Boulevard<br />
Project #2055, Traffic Signal Retiming Program 75,000<br />
Re-times signals to maintain optimum traffic flow.<br />
Project #2057, <strong>Concord</strong> Ave @ Diamond Blvd Intersection Improvements<br />
Configures the right-turn lane from intersection which will reduce accidents. $ 140,800<br />
Parkland Fees<br />
Project #1288, Meadow Homes Spray Park $ 600,000<br />
Project will demolish the existing pool and concrete deck, and construct a spray ground.<br />
Project #1843, Newhall Park Landscaping Improvements 7,000<br />
Replaces landscaping required as a mitigation measure by the Dept. <strong>of</strong> Fish & Game.<br />
Project #2046, Recurring Parks Facilities Costs Programs 200,000<br />
Maintains park facilities that are gradually deteriorating with age and use.<br />
Project #2080, Replace Ro<strong>of</strong> at Diablo Creek Golf Course Clubhouse 100,000<br />
Replaces the Golf Course Clubhouse ro<strong>of</strong> and gutters which are in significant disrepair.<br />
Project #2081, Pave Loop Road at Camp <strong>Concord</strong> 40,000<br />
Pave approximately 1600 feet <strong>of</strong> existing dirt road at Camp <strong>Concord</strong>.<br />
Project #2082, Park Signage 85,000<br />
Project will provide uniform, identifiable park signage.<br />
General Fund Projects<br />
General Fund Capital Reserves contributed toward:<br />
Project #1016, Senior Transportation $ 38,200<br />
To provide transportation geared towards the needs <strong>of</strong> seniors.<br />
Project #1095, Groundwater Monitoring at <strong>City</strong> Corporation Yard 50,000<br />
To insure that the <strong>City</strong> continues to meet environmental requirements.<br />
Project #1103, <strong>City</strong> Government Channel Programming & Support 75,353<br />
Provides funding for the <strong>City</strong> government channel and related educational and public<br />
cable television programming.<br />
Project #1221, New NPDES Requirements 75,000<br />
Cost requirements mandated in the Contra Costa clean water program.<br />
Project #2010, Police Prosecutor 100,000<br />
Maintain and increase ability to track and prosecute persons in the community that<br />
negatively affect quality <strong>of</strong> life issues.<br />
Project #2040, Drainage Studies 15,000<br />
Project funds studies as necessary to determine solutions to drainage complaints.<br />
Project #2078, Pavilion Debt Service $ 378,060<br />
The annual bond debt service payment by BGP was reduced from $1.778 million to<br />
$1.4 million. This reduction generated a shortfall. The project will cover the shortfall and<br />
will maintain the operation <strong>of</strong> the Pavilion as a performing arts facility.
Projects which have new grant funding are:<br />
Measure C<br />
Project #1028, Traffic Calming $ 120,000<br />
Implements two neighborhood traffic calming programs per year.<br />
Project #1037, Light Emitting Diode (LED) Signal Lamps Upgrading Program 32,500<br />
Project will improve minimum intensity levels for signal indications.<br />
* Project #1199, Street Maintenance 94,040<br />
Provides annual street maintenance to <strong>City</strong> streets.<br />
Project #1361, Transpac Work Program 66,950<br />
Funds TRANSPAC Administration Budget.<br />
* Project #1405, Maintenance Patch Paving 627,000<br />
Patch localized failed pavement areas.<br />
Project #1510, Street Surface Seal Program (Slurry and Cape Seals) & Stripping 472,036<br />
Provides annual slurry seal and cape seal program.<br />
* Project #1853, Street Maintenance Crack Sealing $ 60,589<br />
Conducts maintenance programs as determined by <strong>Concord</strong>'s Pavement Management<br />
System.<br />
Traffic Congestion Relief (AB2928)<br />
Project #1363, Arterial/Collector Street Overlay/Pavement Management System $ 513,259<br />
Provides well-maintained roads to facilitate transportation <strong>of</strong> residents.<br />
Project #2023, Landana Sidewalk Improvements 65,000<br />
Project will improve pedestrian connectivity to two schools.<br />
Project #2363, Arterial/Collector Street Overlay/Pavement Implementation $ 400,000<br />
Designs and constructs projects per the Street Overlay Pavement Management System.<br />
Other Fees, Grants and Donations<br />
CITY OF CONCORD<br />
CAPITAL PROJECTS FUNDS<br />
FOR THE YEAR ENDING JUNE 30, 2008<br />
Cable Franchise Fees<br />
Project #2019 Public-Educational-Government Cable Television Capital Support $ 986,393<br />
Franchise fees used for Public-Educational and Government (PEG) cable television<br />
broadcast services to be delivered to the public.<br />
Contra Costa County<br />
Project #1854, Seismic Retr<strong>of</strong>it <strong>of</strong> the Marsh Dr Bridge $ 180,000<br />
Project will bring the existing Marsh Drive Bridge to current seismic standards.<br />
Developers Reimbursable<br />
Project #1239, The Alameda Utility Undergrounding, Clayton Rd. to Cordova Way $ 30,000<br />
Project will eliminate visual clutter and enhance safety by undergrounding overhead<br />
utilities when possible.<br />
Project #2054 Arnold Industrial Way/Laura Alice Way/Peralta Dr. Traffic Signal 199,500<br />
Constructs a traffic signal at the intersection <strong>of</strong> Arnold Industrial Way/Laura Alice Way/<br />
Peralta Dr to enhance safety <strong>of</strong> traffic flow and pedestrians crossing the street.<br />
Federal Highway Administration<br />
Project #2034, Ygnacio Valley Rd Landslide $ 895,674<br />
To repair 1,000 feet <strong>of</strong> damaged roadway brought on by severe winter storms.<br />
Regional Bicycle and Pedestrian<br />
Project #2054, <strong>Concord</strong> Boulevard Sidewalk (Farm Bureau Road to Sixth Street) $ 800,000<br />
Project will construct a 6-foot sidewalk with curb, gutter and pavement . The pavement<br />
will be widened to accommodate on-street parking and bicycle lanes.<br />
Rule 20 A<br />
Project #1228, Utility Undergrounding Project $ 801,763<br />
Project will eliminate visual clutter and enhance safety by undergrounding overhead<br />
utilities when possible.<br />
Project #1239, The Alameda Utility Undergrounding, Clayton Rd. to Cordova Way $ 300,000<br />
Project will eliminate visual clutter and enhance safety by undergrounding overhead<br />
utilities when possible.<br />
* Appropriation included as operating expense in Performance Based Budget
CITY OF CONCORD<br />
CAPITAL PROJECTS FUNDS<br />
FOR THE YEAR ENDING JUNE 30, 2008<br />
State Transportation Improvement Program STIP<br />
Project #2363, Arterial/Collector Street Overlay/Pavement Implementation $ 540,000<br />
Designs and constructs projects per the Street Overlay Pavement Management System.<br />
Transportation Development Act TDA Grant<br />
Project #2024, Mesa Street Trail Improvements $ 130,000<br />
The project will construct 950 linear feet <strong>of</strong> a new trail along Mesa Street. The grant funds<br />
will be used to add streetlights and sidewalk repairs.<br />
Transportation for Livable Community TLC Grant<br />
Project #2064, Monument Blvd. and Meadow Ln. Pedestrian Improvements $ 1,200,000<br />
This project will improve pedestrian connectivity, provide access to local transit system,<br />
enhance pedestrian safety and revitalize the Monument Corridor.<br />
Project #2072, Implementation <strong>of</strong> Urban Design Plan for Monument Blvd. Corridor $ 1,000,000<br />
Constructs pedestrian improvements at three intersections along Monument Blvd.
Police Department<br />
14%<br />
<strong>City</strong> <strong>of</strong> <strong>Concord</strong><br />
General Fund<br />
Capital Expenditures by Department<br />
June 30, 2008<br />
Communty Recreation<br />
57%<br />
Public Works<br />
17%<br />
Building, Engineering<br />
& Neighborhood<br />
Services<br />
2%<br />
<strong>City</strong> Management<br />
10%
<strong>City</strong> <strong>of</strong> <strong>Concord</strong><br />
General Fund<br />
Capital Project Ten-Year Projection<br />
For the Year Ending June 30, 2008<br />
PJ # Project Name 2007-08 2008-09 2009-10 2010-11 2011-12 2012-13 2013-14 2014-15 2015-16 2016-17 Total<br />
General Fund Projects<br />
1016 Senior Transportation<br />
Groundwater Monitoring at <strong>City</strong><br />
$ 38,200 $ 28,000 $ 28,000 $ 28,000 $ 28,000 $ 28,000 $ 28,000 $ 28,000 $ 28,000 $ 28,000 $ 290,200<br />
1095 Corporation Yard<br />
<strong>City</strong> Government Channel Programming &<br />
50,000<br />
-<br />
-<br />
-<br />
-<br />
-<br />
-<br />
-<br />
-<br />
- 50,000<br />
1103 Support 75,353 77,613 79,942 82,340 84,810 87,354 89,975 92,674 95,455 98,319 863,835<br />
1164 Innovation Program - 50,000 50,000<br />
-<br />
-<br />
-<br />
-<br />
-<br />
-<br />
- 100,000<br />
1221 New NPDES Requirements 75,000 75,000 150,000 150,000 150,000 150,000 150,000 150,000 150,000 150,000 1,350,000<br />
2010 Community Prosecutor 100,000<br />
-<br />
-<br />
-<br />
-<br />
-<br />
-<br />
-<br />
-<br />
- 100,000<br />
2040 Drainage Studies 15,000 15,000<br />
-<br />
-<br />
-<br />
-<br />
-<br />
-<br />
-<br />
- 30,000<br />
2078 Pavilion Debt Service 378,060 376,710 200,000 200,000 200,000 200,000 200,000 200,000 200,000 200,000 2,354,770<br />
GENERAL FUND PROJECT TOTAL $ 731,613 $ 622,323 $ 507,942 $ 460,340 $ 462,810 $ 465,354 $ 467,975 $ 470,674 $ 473,455 $ 476,319 $ 5,138,805
Operating Costs:<br />
Project # 2007-08 2008-09 2009-10 2010-11 2011-12 2012-13 2013-14 2014-15 2015-16 2016-17 Total<br />
Highlands Park Restroom 1167 $ - $ - $ - $ - $ 4,727 $ 4,869 $ 5,015 $ 5,165 $ 5,320 $ 5,480 $ 30,576<br />
Commerce Bridge at Pine Creek 1761 -<br />
Implementation <strong>of</strong> Urban Design Plan 2072 -<br />
Treat Blvd./Oakgrove Plaza Signal 2015 -<br />
Bates Avenue TS-402 -<br />
<strong>City</strong> <strong>of</strong> <strong>Concord</strong><br />
Capital Project's Operating & Maintenance Costs<br />
For the Year Ending June 30, 2008<br />
4,326<br />
-<br />
772<br />
-<br />
4,456<br />
-<br />
796<br />
-<br />
Total Operating Cost $ - $ 5,098 $ 5,252 $ 6,229 $ 11,143 $ 17,273 $ 18,092 $ 18,635 $ 19,194 $ 19,769 $ 120,682<br />
4,589<br />
-<br />
820<br />
820<br />
9,454<br />
-<br />
844<br />
845<br />
9,738<br />
5,797<br />
869<br />
869<br />
10,030<br />
5,971<br />
1,195<br />
896<br />
10,331<br />
6,150<br />
1,231<br />
923<br />
10,641<br />
6,335<br />
1,268<br />
951<br />
10,960<br />
6,525<br />
1,306<br />
979<br />
74,524<br />
30,777<br />
9,101<br />
6,282
The <strong>City</strong> <strong>of</strong> <strong>Concord</strong> is pleased to provide safe, aesthetically pleasing parks designed<br />
to meet the diverse needs for active and passive recreation and leisure activities.<br />
Ellis Lake Park<br />
326<br />
Todos Santos Park<br />
Todos Santos Plaza<br />
Courtyard
CITY OF CONCORD<br />
ENTERPRISE FUNDS<br />
FOR THE YEAR ENDING JUNE 30, 2008<br />
Enterprise Funds are used to account for the <strong>City</strong> Of <strong>Concord</strong> operations that are financed and<br />
operated like private business enterprises. Use <strong>of</strong> this type <strong>of</strong> fund permits user charges to<br />
finance or recover all costs, including depreciation, <strong>of</strong> providing the enterprise’s services to the<br />
general public on a continuing basis. Enterprise funds include:<br />
Golf Course Fund – To account for activities associated with the development, operations, and<br />
maintenance <strong>of</strong> the Diablo Creek Golf Course.<br />
Sewer Fund – Accounts for activities pertaining to sewage transmission and treatment.<br />
327
Fees<br />
64.5%<br />
Maintenance<br />
66%<br />
<strong>City</strong> <strong>of</strong> <strong>Concord</strong><br />
Golf Course<br />
Revenues and Expenses<br />
For the Year Ending June 30, 2008<br />
Revenue by Source<br />
Expenses by Program<br />
Other & Interest<br />
25.4%<br />
Debt Service<br />
15%<br />
Rentals<br />
8.9%<br />
Merchandise<br />
1.2%<br />
Operations<br />
19%
<strong>City</strong> <strong>of</strong> <strong>Concord</strong><br />
Golf Course<br />
Ten Year Projection<br />
For the Year Ending June 30, 2008<br />
Fee Inc. Fee Inc. Fee Inc. Fee Inc. Fee Inc.<br />
2007-08 2008-09 2009-10 2010-11 2011-12 2012-13 2013-14 2014-15 2015-16 2016-17<br />
Fund Balance 7/01 $ 55,146 $ 147,902 $ 156,869 $ 165,372 $ 166,553 $ 174,417 $ 175,524 $ 183,861 $ 185,023 $ 194,344<br />
Add Revenues:<br />
Fees $ 1,501,759 $ 1,501,759 $ 1,576,847 $ 1,576,847 $ 1,655,689 $ 1,655,689 $ 1,738,473 $ 1,738,473 $ 1,825,396 $ 1,825,396<br />
Rentals 206,784 210,723 218,555 222,733 231,001 235,434 244,162 248,865 258,079 263,068<br />
Merchandise Sales 28,278 29,126 30,000 30,900 31,827 32,782 33,765 34,778 35,821 36,896<br />
Other Revenues 586,525 50,000 239,042 148,390 50,000 50,000 50,000 50,000 50,000 50,000<br />
Interest 3,492 5,976 7,860 8,096 8,316 8,535 8,765 8,997 9,252 9,514<br />
Total Revenues $ 2,326,838 $ 1,797,584 $ 2,072,304 $ 1,986,966 $ 1,976,833 $ 1,982,440 $ 2,075,165 $ 2,081,113 $ 2,178,548 $ 2,184,874<br />
Operating Expenditures<br />
Operations $ 274,150 $ 339,606 $ 345,026 $ 378,128 $ 400,819 $ 406,976 $ 413,666 $ 420,564 $ 427,605 $ 434,862<br />
General Fund Admin. Srvs. 288,651 294,424 300,312 306,318 312,444 318,693 325,067 331,568 338,200 344,964<br />
General Fund Subsidy (8,971) (8,457) 38,054 (17,261) 3,706 (27,355) 12,344 (20,970) 26,105 (6,637)<br />
Maintenance 925,192 943,118 970,324 998,344 1,027,202 1,056,924 1,087,536 1,119,064 1,151,534 1,183,941<br />
Debt Service 218,535 219,926 221,043 221,866 224,798 226,095 228,215 229,725 225,783 226,375<br />
Total Expenditures $ 1,697,557 $ 1,788,617 $ 1,874,759 $ 1,887,395 $ 1,968,969 $ 1,981,333 $ 2,066,828 $ 2,079,951 $ 2,169,227 $ 2,183,505<br />
Net Income (Loss) $ 629,281 $ 8,967 $ 197,545 $ 99,571 $ 7,864 $ 1,107 $ 8,337 $ 1,162 $ 9,321 $ 1,369<br />
10 % Contingency Reserves $ 147,902 $ 156,869 $ 165,372 $ 166,553 $ 174,417 $ 175,524 $ 183,861 $ 185,023 $ 194,344 $ 195,713<br />
Less Capital Expenses:<br />
Projects $ 536,525 $ - $ 189,042 $ 98,390 $ - $ - $ - $ - $ - $ -<br />
Capital Projects Reserve - -<br />
-<br />
-<br />
-<br />
-<br />
-<br />
-<br />
-<br />
-<br />
Total Capital Expenses $ 536,525 $ - $ 189,042 $ 98,390 $ - $ - $ - $ - $ - $ -<br />
Fund Balance 6/30 $ - $ - $ - $ - $ - $ - $ - $ - $ - $ -<br />
Notes:<br />
Meets all standards contained in the Budget and Fiscal Policies adopted by the Council. This policy can be found on page 36.<br />
Revenues:<br />
Fees increases proposed for the years indicated based on a market study done by staff and Head Golf Pr<strong>of</strong>essional<br />
Miscellaneous revenues includes zero interest loans received from the General fund for capital projects and Valley Crest Maintenance Agreement capital reimburserment.<br />
Operating Expenditures:<br />
Maintenance Expenditures reflect Valley Crest Maintenance Contract.<br />
Cost Allocation Plan expenditures included in operations have been adjusted to provide for zero end-<strong>of</strong>-year fund balance.<br />
Salaries and benefits have been budgeted per current labor agreements adjusted for step increases and assuming a full staffing level.<br />
Employee benefits expenses for medical insurance and retirement reflect recent higher than CPI increases.<br />
Employee post-retirement health expenses assumes 25-Year amortization <strong>of</strong> accrued liability and contributions for prior period employee populations.<br />
Non-labor operating expenditures for FY 2008 and the remainder <strong>of</strong> the 10-Year planning period, depending on the category, include increases between 2% and 3% for inflation.<br />
Operating expenditures include repayment <strong>of</strong> capital project loans and internal service fund charges for information technology, workers' compensation and risk liability.<br />
Debt Service engendered by parking lot expansion, entry-way landscaping, new irrigation system, and cart path, greens and bathroom rehabilitation.
Service Fees<br />
93%<br />
Facility Operations<br />
41.8%<br />
Maintenance &<br />
Operations<br />
18.9%<br />
<strong>City</strong> <strong>of</strong> <strong>Concord</strong><br />
Sewer Enterprise<br />
Revenues and Expenses<br />
For the Year Ending June 30, 2008<br />
Revenues by Source<br />
Expenses by Program<br />
Household<br />
Hazardous Waste<br />
2.1%<br />
Connection Fees<br />
5%<br />
Interest<br />
2%<br />
Capital Projects<br />
30.0%<br />
Bond & Note<br />
Payments<br />
7.2%
Page 1 <strong>of</strong> 2<br />
Sewer Enterprise<br />
Twenty Year Projection<br />
for the Year Ending June 30, 2008<br />
Fee Inc $36 Fee Inc $36 Fee Inc $36 Fee Inc $36<br />
2007-08 2008-09 2009-10 2010-11 2011-12 2012-13 2013-14 2014-15 2015-16 2016-17<br />
Fund Balance 7/01 $ 12,797,675 $ 9,359,351 $ 5,269,076 $ 6,335,427 $ 6,869,486 $ 6,495,484 $ 5,181,062 $ 5,396,809 $ 6,526,281 $ 6,535,038<br />
Add Revenues:<br />
Sewer Service Fees $ 17,016,470 $ 17,050,503 $ 19,124,604 $ 19,162,853 $ 19,201,179 $ 19,239,581 $ 21,318,060 $ 23,400,696 $ 23,447,497 $ 23,494,392<br />
Sewer Connection Fees 1,000,000 1,030,000 1,060,900 1,092,727 1,125,509 1,159,274 1,194,052 1,229,874 1,266,770 1,304,773<br />
Interest 381,079 286,832 283,037 322,071 325,975 284,794 257,997 290,807 318,569 298,260<br />
Loan Repayment -<br />
-<br />
-<br />
-<br />
-<br />
- 150,000 200,000 200,000 200,000<br />
Total Revenues $ 18,397,549 $ 18,367,335 $ 20,468,541 $ 20,577,651 $ 20,652,663 $ 20,683,649 $ 22,920,109 $ 25,121,377 $ 25,232,836 $ 25,297,425<br />
Less Expenditures:<br />
Maintenance & Operations $ 4,116,436 $ 4,216,867 $ 4,067,599 $ 4,165,122 $ 4,271,145 $ 4,376,371 $ 4,491,160 $ 4,614,741 $ 4,719,324 $ 4,834,762<br />
Animal Control Notes Payable 248,000<br />
-<br />
-<br />
-<br />
-<br />
-<br />
-<br />
-<br />
-<br />
-<br />
Household Hazardous Waste 468,905 482,972 497,461 512,385 527,757 543,589 559,897 576,694 593,995 605,875<br />
Rehab Bond Payment-Priority 1<br />
Bond Paymnt-Gravity Connection<br />
834,638 832,650 834,655 835,126 834,186 836,776 833,070 833,189 836,903 834,406<br />
In Lieu <strong>of</strong> Pumping To CCCSD<br />
Payment to CCCSD:<br />
500,000 995,000 995,000 995,000 995,000 995,000 995,000 995,000 995,000 995,000<br />
Operations 9,120,000 9,511,000 9,950,000 10,546,000 11,055,000 11,588,000 12,157,000 12,722,000 13,345,378 13,999,302<br />
Total Appropriations $ 15,287,979 $ 16,038,489 $ 16,344,715 $ 17,053,633 $ 17,683,088 $ 18,339,736 $ 19,036,127 $ 19,741,624 $ 20,490,600 $ 21,269,345<br />
Net Income(Loss) $ 3,109,570 $ 2,328,846 $ 4,123,826 $ 3,524,018 $ 2,969,575 $ 2,343,913 $ 3,883,982 $ 5,379,753 $ 4,742,236 $ 4,028,080<br />
10% Contingency Reserves $ 1,323,644 $ 1,372,787 $ 1,401,760 $ 1,471,112 $ 1,532,615 $ 1,596,437 $ 1,664,816 $ 1,733,674 $ 1,806,470 $ 1,883,406<br />
Reserve for Capital Projects:<br />
<strong>City</strong> Projects $ 140,894 $ 145,121 $ 149,475 $ 153,959 $ 158,577 $ 163,335 $ 168,235 $ 173,281 $ 178,479 $ 183,834<br />
Capital Facility Contingency 200,000 200,000 200,000 200,000 200,000 200,000 200,000 200,000 200,000 200,000<br />
CCCSD Capital Projects 6,207,000 6,074,000 2,708,000 2,636,000 2,985,000 3,295,000 3,300,000 3,877,000 4,355,000 4,485,650<br />
Total Capital Projects $ 6,547,894 $ 6,419,121 $ 3,057,475 $ 2,989,959 $ 3,343,577 $ 3,658,335 $ 3,668,235 $ 4,250,281 $ 4,733,479 $ 4,869,484<br />
Fund Balance 6/30 $ 8,035,707 $ 3,896,289 $ 4,933,667 $ 5,398,374 $ 4,962,869 $ 3,584,625 $ 3,731,993 $ 4,792,607 $ 4,728,568 $ 3,810,228<br />
Notes:<br />
Meets all standards contained in the Budget and Fiscal Policy adopted by Council. This policy can be found on page 36.<br />
Revenues:<br />
Sewer service fees include a growth factor <strong>of</strong> .002.<br />
Proposed rate increases required to finance a multi-million dollar sewer main rehabilitation project & gravity connection project.<br />
Expenditures:<br />
Includes project costs as proposed in the CIP budget.<br />
Salaries and benefits have been budgeted per current labor agreements adjusted for step increases and assuming a full staffing level.<br />
Employee benefits expenses for medical insurance and retirement reflect recent higher than CPI increases and post retirement health assumes 25-Year amortization <strong>of</strong> accrued liability.<br />
Non-labor operating expenditures for FY 2008 and the remainder <strong>of</strong> the 20-Year planning period, depending on the category, include increases between 2% and 3% for inflation.<br />
Operating expenditures include internal service fund charges for vehicles, information technology, buildings, workers' compensation and risk liability.<br />
Rehabilitation bond repayment per Bond Debt Service schedule including fiscal charges.<br />
CCCSD operations payments based CCCSD's ten year assumptions, including GASB No. 45 adjustment, with a CPI applied to Fiscal Year 2017 through Fiscal Year 2027: 3% Facility and 4.9% Operations.<br />
Includes project costs as proposed in the CIP budget using pay-as-you-go for CCCSD Capital Projects.
Page 2 <strong>of</strong> 2<br />
Sewer Enterprise<br />
Twenty Year Projection<br />
for the Year Ending June 30, 2008<br />
Fee Inc $36 Fee Inc $36 Fee Inc $36 Fee Inc $36 Fee Inc $36<br />
2017-18 2018-19 2019-20 2020-21 2021-22 2022-23 2023-24 2024-25 2025-26 2026-27<br />
Fund Balance 7/01 $ 5,693,634 $ 5,776,653 $ 4,904,840 $ 5,078,691 $ 6,309,941 $ 6,512,730 $ 5,586,355 $ 5,514,215 $ 6,289,378 $ 5,806,072<br />
Add Revenues:<br />
Sewer Service Fees $ 25,581,381 $ 25,632,544 $ 27,723,809 $ 29,819,257 $ 29,878,896 $ 29,938,654 $ 32,038,531 $ 34,142,608 $ 34,210,893 $ 34,279,315<br />
Sewer Connection Fees 1,343,916 1,384,233 1,425,760 1,468,533 1,512,589 1,557,967 1,604,706 1,652,847 1,702,432 1,753,505<br />
Interest 279,763 260,524 243,501 277,772 312,748 295,100 270,746 287,893 295,011 237,786<br />
Loan Repayment -<br />
-<br />
-<br />
-<br />
-<br />
-<br />
-<br />
-<br />
-<br />
-<br />
Total Revenues $ 27,205,060 $ 27,277,301 $ 29,393,070 $ 31,565,562 $ 31,704,233 $ 31,791,721 $ 33,913,983 $ 36,083,348 $ 36,208,336 $ 36,270,606<br />
Less Expenditures:<br />
Maintenance & Operations $ 4,979,805 $ 5,129,199 $ 5,283,075 $ 5,441,567 $ 5,604,814 $ 5,772,958 $ 5,946,147 $ 6,124,531 $ 6,308,267 $ 6,497,515<br />
Animal Control Notes Payable -<br />
-<br />
-<br />
-<br />
-<br />
-<br />
-<br />
-<br />
-<br />
-<br />
Household Hazardous Waste 617,993 630,353 642,960 655,819 668,935 682,314 695,960 709,879 724,077 738,559<br />
Rehab Bond Payment-Priority 1<br />
Bond Paymnt-Gravity Connection<br />
834,406 835,860 836,029 834,873 837,352 838,761 838,666 837,332 839,612 839,912<br />
In Lieu <strong>of</strong> Pumping To CCCSD<br />
Payment to CCCSD:<br />
995,000 995,000 995,000 995,000 995,000 995,000 995,000 995,000 995,000 995,000<br />
Operations 14,685,268 15,404,846 16,159,683 16,951,507 17,782,131 18,653,455 19,567,474 20,526,280 21,532,068 22,587,139<br />
Total Appropriations $ 22,112,472 $ 22,995,258 $ 23,916,747 $ 24,878,766 $ 25,888,232 $ 26,942,488 $ 28,043,247 $ 29,193,022 $ 30,399,024 $ 31,658,125<br />
NET INCOME(LOSS) $ 5,092,588 $ 4,282,043 $ 5,476,323 $ 6,686,796 $ 5,816,001 $ 4,849,233 $ 5,870,736 $ 6,890,326 $ 5,809,312 $ 4,612,481<br />
10% Contingency Reserves $ 1,966,507 $ 2,053,405 $ 2,144,276 $ 2,239,307 $ 2,338,695 $ 2,442,641 $ 2,551,362 $ 2,665,081 $ 2,784,034 $ 2,908,465<br />
Reserve for Capital Projects:<br />
<strong>City</strong> Projects $ 189,349 $ 195,029 $ 200,880 $ 206,906 $ 213,113 $ 219,506 $ 226,091 $ 232,874 $ 239,860 $ 247,056<br />
Capital Facility Contingency 200,000 200,000 200,000 200,000 200,000 200,000 200,000 200,000 200,000 200,000<br />
CCCSD Capital Projects 4,620,220 4,758,827 4,901,592 5,048,640 5,200,099 5,356,102 5,516,785 5,682,289 5,852,758 6,028,341<br />
Total Capital Projects $ 5,009,569 $ 5,153,856 $ 5,302,472 $ 5,455,546 $ 5,613,212 $ 5,775,608 $ 5,942,876 $ 6,115,163 $ 6,292,618 $ 6,475,397<br />
Fund Balance 6/30 $ 3,810,146 $ 2,851,435 $ 2,934,415 $ 4,070,634 $ 4,174,035 $ 3,143,714 $ 2,962,853 $ 3,624,297 $ 3,022,038 $<br />
1,034,691
CITY OF CONCORD<br />
INTERNAL SERVICE FUNDS<br />
FOR THE YEAR ENDING JUNE 30, 2008<br />
Internal Service Funds are used to finance and account for goods and/or services provided by<br />
one <strong>City</strong> department to other <strong>City</strong> departments on a fee for service basis. The <strong>City</strong> <strong>of</strong> <strong>Concord</strong><br />
has the following internal service funds:<br />
Workers' Compensation Fund - Accounts for workers' compensation expenses.<br />
Risk Management/Liability Fund - To account for the non-reimbursable portion <strong>of</strong> insurance<br />
claims and judgments.<br />
Post Retirement Healthcare Benefits Fund - Accounts for the contributions and benefits paid<br />
in relation to the Post-Retirement Health Care Program.<br />
Fleet Maintenance Replacement Fund - Accumulates resources to fund the operations and<br />
replacement <strong>of</strong> <strong>City</strong> licensed vehicles and motorized equipment.<br />
Information Technology Replacement Fund - Accumulates resources to fund the operations<br />
and replacement <strong>of</strong> computers, s<strong>of</strong>tware and <strong>of</strong>fice equipment used by <strong>City</strong> staff.<br />
Building Maintenance Replacement Fund - Accumulates resources required to maintain <strong>City</strong><br />
facilities. Also includes facility upkeep, repair and custodial services.<br />
333
CITY OF CONCORD<br />
WORKERS' COMPENSATION (FUND 610)<br />
TEN-YEAR PROJECTION<br />
FOR THE YEAR ENDING JUNE 30, 2008<br />
2007-08 2008-09 2009-10 2010-11 2011-12 2012-13 2013-14 2014-15 2015-16 2016-17<br />
Fund Balance 7/01 $ 6,541,584 $ 7,141,513 $ 6,944,675 $ 7,393,484 $ 7,844,961 $ 8,297,174 $ 8,748,205 $ 9,195,417 $ 9,636,126 $ 10,067,343<br />
Add Revenues:<br />
Interest $ 235,336 $ 291,886 $ 354,589 $ 376,547 $ 398,589 $ 420,619 $ 442,527 $ 464,184 $ 485,450 $ 506,173<br />
Service Fees 2,012,746 2,073,117 2,135,304 2,199,360 2,265,335 2,333,287 2,403,282 2,475,376 2,549,628 2,626,108<br />
Total Revenue $ 2,248,082 $ 2,365,003 $ 2,489,893 $ 2,575,907 $ 2,663,924 $ 2,753,906 $ 2,845,809 $ 2,939,560 $ 3,035,078 $ 3,132,281<br />
Less Appropriations:<br />
Operations $ 166,287 $ 170,549 $ 174,511 $ 178,940 $ 183,490 $ 187,924 $ 192,719 $ 197,644 $ 202,708 $ 207,913<br />
Med. Benefits/Pmts. 1,273,930 1,377,118 1,445,974 1,518,273 1,594,187 1,673,896 1,757,591 1,845,471 1,937,745 2,034,632<br />
Insurance 207,936 214,174 220,599 227,217 234,034 241,055 248,287 255,736 263,408 271,310<br />
Total Appropriations $ 1,648,153 $ 1,761,841 $ 1,841,084 $ 1,924,430 $ 2,011,711 $ 2,102,875 $ 2,198,597 $ 2,298,851 $ 2,403,861 $ 2,513,855<br />
Revenue Over (Under)<br />
Appropriations 599,929<br />
603,162<br />
648,809<br />
651,477<br />
Reserve for Liability on<br />
Open Claims $ 5,958,260 $ 6,315,756 $ 6,694,701 $ 7,096,383 $ 7,522,166 $ 7,973,496 $ 8,451,906 $ 8,959,020 $ 9,496,561 $ 10,066,355<br />
Other Finance Source<br />
Transfers In $ - $ - $ - $ - $ - $ - $ - $ - $ - $<br />
-<br />
Transfers Out - 800,000 200,000 200,000 200,000 200,000 200,000 200,000 200,000 200,000<br />
Fund Balance 6/30 $ 1,183,253 $ 628,919 $ 698,783 $ 748,578 $ 775,008 $ 774,709 $ 743,511 $ 677,106 $ 570,782 $ 419,414<br />
Notes:<br />
Interest rate @ 3.5% FY2007-2008, 4% FY2009, 5% FY2010-2016.<br />
Operations expenditures inflated using the same factors used in the General Fund 10-Year Plan.<br />
Insurance inflated @ 3% per year.<br />
Medical benefits/payments for FY2008 estimated to be FY2007 estimated inflated by compromised Health rates.<br />
Reserves for Liability based on open claims per FY05 CAFR inflated at 6% per year.<br />
Transfer In during FY 2005 from the Liability Fund repaid in FY 2009.<br />
Transfer Out beginning FY2010 to Benefits Reserve.<br />
Includes adjustment to service fees set at approximately 75% <strong>of</strong> State Fund Rate.<br />
652,213<br />
651,031<br />
647,212<br />
640,709<br />
631,217<br />
618,426
CITY OF CONCORD<br />
LIABILITY FUND (620)<br />
TEN-YEAR PROJECTION<br />
FOR THE YEAR ENDING JUNE 30, 2008<br />
2007-08 2008-09 2009-10 2010-11 2011-12 2012-13 2013-14 2014-15 2015-16 2016-17<br />
Fund Balance 7/01 $ 1,550,269 $ 1,490,771 $ 2,241,441 $ 2,219,533 $ 2,182,287 $ 2,129,824 $ 2,058,923 $ 1,973,267 $ 1,862,674 $ 2,158,006<br />
Add Revenues:<br />
Interest $ 68,636 $ 92,118 $ 132,737 $ 131,657 $ 129,817 $ 127,261 $ 123,752 $ 119,496 $ 113,831 $ 128,433<br />
Service Fees 1,344,496 1,373,486 1,403,191 1,432,630 1,463,799 1,498,240 1,533,056 1,569,197 1,600,578 1,632,590<br />
Total Revenue $ 1,413,132 $ 1,465,604 $ 1,535,928 $ 1,564,287 $ 1,593,616 $ 1,625,501 $ 1,656,808 $ 1,688,693 $ 1,714,409 $ 1,761,023<br />
Less Appropriations:<br />
Debt Service $ 439,378 $ 440,225 $ 439,903 $ 438,530 $ 436,078 $ 437,387 $ 432,329 $ 435,830 $ - $ -<br />
Premium Payments 510,280 525,588 541,356 557,597 574,325 591,555 609,302 627,581 646,408 665,800<br />
Claims and Judgments 522,972 549,121 576,577 605,406 635,676 667,460 700,833 735,875 772,669 811,302<br />
Total Appropriations $ 1,472,630 $ 1,514,934 $ 1,557,836 $ 1,601,533 $ 1,646,079 $ 1,696,402 $ 1,742,464 $ 1,799,286 $ 1,419,077 $ 1,477,102<br />
Revenue Over (Under)<br />
Appropriations (59,498)<br />
(49,330)<br />
(21,908)<br />
(37,246)<br />
(52,463)<br />
(70,901)<br />
(85,656)<br />
(110,593)<br />
Liability on<br />
Open Claims $ 777,295 $ 800,614 $ 824,632 $ 849,371 $ 874,852 $ 901,098 $ 928,131 $ 955,975 $ 984,654 $ 1,014,194<br />
Other Finance Source<br />
Transfers In $ - $ 800,000 $ - $ - $ - $ - $ - $ - $ - $ -<br />
Transfers Out -<br />
-<br />
-<br />
-<br />
-<br />
-<br />
-<br />
-<br />
-<br />
-<br />
Total Other Finance Source $ - $ 800,000 $ - $ - $ - $ - $ - $ - $ - $ -<br />
Fund Balance 6/30 $ 713,476 $ 1,440,827 $ 1,394,901 $ 1,332,916 $ 1,254,972 $ 1,157,825 $ 1,045,136 $ 906,699 $ 1,173,352 $ 1,427,733<br />
Notes:<br />
Premium Payments based on insurance broker provided estimates inflated @ 3%.<br />
Claims and Judgements based on previous 10-Year Plan inflated @5%.<br />
JPA ERMA Assessment and Retrospective Premium credit assumed to net to zero.<br />
Liability on open claims based on actuarial inflated @ 3%.<br />
Final debt service payment scheduled for FY 2015.<br />
Transfer to Workers' Compensation Fund repaid in FY 2009.<br />
295,332<br />
283,921
<strong>City</strong> <strong>of</strong> <strong>Concord</strong><br />
Post Retirement Healthcare (OPEB) Obligation<br />
Ten Year Projection (7% Discount Rate/25 Year Amortization)<br />
For the Year Ending June 30, 2008<br />
2007-08 2008-09 2009-10 2010-11 2011-12 2012-13 2013-14 2014-15 2015-16 2016-17<br />
Fund Balance 7/01 $ 15,017,484 $ 15,395,578 $ 15,803,507 $ 16,232,689 $ 16,732,914 $ 17,270,935 $ 17,794,331 $ 18,353,890 $ 18,941,437 $ 19,517,968<br />
Add Revenues:<br />
Interest $ 1,028,461 $ 1,055,042 $ 1,083,350 $ 1,114,779 $ 1,149,889 $ 1,185,782 $ 1,222,404 $ 1,261,195 $ 1,300,560 $ 1,338,855<br />
Service Fees 1,493,814 1,796,349 2,115,691 2,452,578 2,807,774 3,182,074 3,576,305 3,991,326 4,428,030 4,887,344<br />
Total Revenue $ 2,522,275 $ 2,851,391 $ 3,199,041 $ 3,567,357 $ 3,957,663 $ 4,367,856 $ 4,798,709 $ 5,252,521 $ 5,728,590 $ 6,226,199<br />
Less Appropriations:<br />
Benefit Payments $ 2,135,000 $ 2,433,000 $ 2,758,000 $ 3,054,000 $ 3,405,000 $ 3,828,000 $ 4,221,000 $ 4,645,000 $ 5,130,000 $ 5,646,000<br />
Administrative Costs 9,181 10,462 11,859 13,132 14,642 16,460 18,150 19,974 22,059 24,278<br />
Total Appropriations $ 2,144,181 $ 2,443,462 $ 2,769,859 $ 3,067,132 $ 3,419,642 $ 3,844,460 $ 4,239,150 $ 4,664,974 $ 5,152,059 $ 5,670,278<br />
Revenue Over (Under)<br />
Appropriations $ 378,094 $ 407,929 $ 429,182 $ 500,225 $ 538,021 $ 523,396 $ 559,559 $ 587,547 $ 576,531 $ 555,921<br />
Net OPEB Obligation $ 3,877,600 $ 7,637,579 $ 11,258,348 $ 14,774,483 $ 18,136,723 $ 21,278,980 $ 24,237,346 $ 26,987,093 $ 29,473,684 $ 31,672,773<br />
Other Funding Sources<br />
General Fund Transfer $ - $ - $ - $ - $ - $ - $ - $ - $ - $<br />
-<br />
Total Other Funding $ - $ - $ - $ - $ - $ - $ - $ - $ - $<br />
-<br />
Fund Balance 6/30 $ 11,517,978 $ 8,165,928 $ 4,974,341 $ 1,958,431 $ (865,788) $ (3,484,649) $ (5,883,456) $ (8,045,656) $ (9,955,716) $ (11,598,884)<br />
Notes:<br />
Includes Service Fees used in the FY2008 10-Year Plan.<br />
Interest rate used is 7.0% and 25 Year Accrued Liability Amortization Period.<br />
Projected benefits costs are per OPEB actuarial report.<br />
Net OPEB obligation was based on 16.1% <strong>of</strong> budgeted salaries less benefit payments. Calculated on cumulative basis.<br />
Current OPEB funding including transfers is at 4.0% FY08, 4.67% FY09, 5.34% FY10, 6.01% FY11, 6.68% FY12, 7.35% FY13, 8.02% FY14, 8.69% FY15 & 9.36% FY16, 10.03% FY17.<br />
FY2007/08 beginning fund balance includes $3.64 million transfer from General, Redevelopment & Housing Special Revenue Funds.
CITY OF CONCORD<br />
FLEET<br />
OPERATIONS (FUND 633)<br />
FOR THE YEAR ENDING JUNE 30, 2008<br />
2007-08 2008-09 2009-10 2010-11 2011-12 2012-13 2013-14 2014-15 2015-16 2016-17<br />
Fund Balance 7/01 $ 204,645 $ 165,516 $ 128,343 $ 99,600 $ 73,799 $ 51,225 $ 35,389 $ 23,690 $ 16,508 $ 14,331<br />
Add Revenues:<br />
Interest $ 6,366 $ 5,762 $ 5,560 $ 4,229 $ 3,049 $ 2,113 $ 1,441 $ 980 $ 752 $ 778<br />
Service Fees 1,707,391 1,758,612 1,811,370 1,865,712 1,921,683 1,979,331 2,038,710 2,099,873 2,162,869 2,227,754<br />
Other Revenues 90,000 92,700 95,481 98,345 101,295 104,334 107,464 110,688 114,009 117,429<br />
Total Revenue $ 1,803,757 $ 1,857,074 $ 1,912,411 $ 1,968,286 $ 2,026,027 $ 2,085,778 $ 2,147,615 $ 2,211,541 $ 2,277,630 $ 2,345,961<br />
Less Appropriations:<br />
Fleet Maintenance $ 1,842,886 $ 1,894,247 $ 1,941,154 $ 1,994,087 $ 2,048,601 $ 2,101,614 $ 2,159,314 $ 2,218,723 $ 2,279,807 $ 2,342,727<br />
Total Appropriations $ 1,842,886 $ 1,894,247 $ 1,941,154 $ 1,994,087 $ 2,048,601 $ 2,101,614 $ 2,159,314 $ 2,218,723 $ 2,279,807 $ 2,342,727<br />
Revenues Over (Under)<br />
Appropriations (39,129)<br />
(37,173)<br />
(28,743)<br />
(25,801)<br />
Other Financing Sources<br />
Other Transfer $ - $ - $ - $ - $ - $ - $ - $ - $ - $ -<br />
Transfers In (Out)-Replace. -<br />
-<br />
-<br />
-<br />
-<br />
-<br />
-<br />
-<br />
-<br />
-<br />
Total Financing Sources(Uses) $ - $ - $ - $ - $ - $ - $ - $ - $ - $ -<br />
Fund Balance 6/30 $ 165,516 $ 128,343 $ 99,600 $ 73,799 $ 51,225 $ 35,389 $ 23,690 $ 16,508 $ 14,331 $ 17,565<br />
Notes:<br />
Meets all standards contained in the Budget and Fiscal Policy adopted by Council. This policy can be found on page 36.<br />
Includes additional other revenues in FY2008 for new maintenance contracts.<br />
Salaries and benefits have been budgeted per current labor agreements adjusted for step increases and assuming a full staffing level.<br />
Employee benefits expenses for medical insurance and retirement reflect recent higher than CPI increases. Post-retirement health expenses include adjustment for 25-Year amortization <strong>of</strong> accrued OPEB liability.<br />
Non-labor operating expenditures for FY 2008 and the remainder <strong>of</strong> the 10-Year planning period, depending on the category, include increases between 2% and 3% for inflation.<br />
Includes internal service fund charges for workers' compensation, liability, information technology and buildings.<br />
(22,574)<br />
(15,836)<br />
(11,699)<br />
(7,182)<br />
(2,177)<br />
3,234
CITY OF CONCORD<br />
FLEET<br />
REPLACEMENT (FUND 633)<br />
FOR THE YEAR ENDING JUNE 30, 2008<br />
2007-08 2008-09 2009-10 2010-11 2011-12 2012-13 2013-14 2014-15 2015-16 2016-17<br />
Fund Balance 7/01 $ 312,476 $ 978,170 $ 885,617 $ 846,314 $ 825,268 $ 770,813 $ 516,586 $ 328,481 $ 514,935 $ 729,890<br />
Add:<br />
Interest $ 22,198 $ 36,545 $ 42,242 $ 40,770 $ 38,929 $ 31,400 $ 20,611 $ 20,571 $ 30,362 $ 44,698<br />
Service Fees 943,496 971,802 1,000,955 1,030,984 1,061,916 1,093,773 1,126,584 1,160,383 1,195,193 1,231,051<br />
Total Revenue $ 965,694 $ 1,008,347 $ 1,043,197 $ 1,071,754 $ 1,100,845 $ 1,125,173 $ 1,147,195 $ 1,180,954 $ 1,225,555 $ 1,275,749<br />
Less:<br />
Police Field Operations $ - $ 294,800 $ 101,900 $ 350,700 $ 322,300 $ 413,400 $ 524,900 $ 224,000 $ 320,200 $ 508,500<br />
Police Support Operations - 74,000 74,300 80,200 137,500 146,300 83,600 22,100 26,000 114,800<br />
Police Administration -<br />
- 38,200 19,700 58,600 30,100<br />
- 44,200<br />
- 70,500<br />
Parks, Trees, Medians & Open Space - 450,800 180,000 82,500 57,000 338,300 243,300 249,100 60,900<br />
-<br />
Sewer Enterprise -<br />
- 254,600 13,100 147,000<br />
- 234,300 211,600<br />
-<br />
-<br />
Stormwater Management - 24,800 168,200 173,700 165,400 35,000<br />
-<br />
- 186,200<br />
-<br />
Street Maintenance - 25,800 53,000 200,400 25,900 41,900<br />
- 19,700 83,600 105,800<br />
Building, Engineering & Neigh. Services - 74,000 55,200 50,200 58,600 155,200 64,500 39,400<br />
-<br />
-<br />
Fleet Pool Vehicles & Emergency Rpl. 300,000<br />
- 42,600 17,500<br />
- 18,500<br />
- 131,600 183,700<br />
-<br />
Building Maint. & Custodial - 42,300 49,800 50,200 74,900 82,400 59,900<br />
-<br />
- 61,300<br />
Transportation - 64,900<br />
-<br />
- 20,300 68,400 65,000<br />
- 150,000 42,000<br />
Community & Recreation - 25,800 45,600 54,600 25,900 49,900 29,900 30,700<br />
-<br />
-<br />
Graffiti Removal - 23,700<br />
-<br />
- 43,900<br />
-<br />
-<br />
-<br />
-<br />
-<br />
Materials Management -<br />
-<br />
-<br />
-<br />
-<br />
- 29,900<br />
-<br />
-<br />
-<br />
Housing -<br />
-<br />
-<br />
- 18,000<br />
-<br />
- 22,100<br />
-<br />
-<br />
Administrative Services -<br />
- 19,100<br />
-<br />
-<br />
-<br />
-<br />
-<br />
-<br />
-<br />
Total Replacement $ 300,000 $ 1,100,900 $ 1,082,500 $ 1,092,800 $ 1,155,300 $ 1,379,400 $ 1,335,300 $ 994,500 $ 1,010,600 $ 902,900<br />
Appropriation 665,694<br />
Contingency Reserve 18,000<br />
(92,553)<br />
66,054<br />
(39,303)<br />
64,950<br />
(21,046)<br />
65,568<br />
Other Financing Sources<br />
Other Funding Sources $ - $ - $ - $ - $ - $ - $ - $ - $ - $ -<br />
Transfers In (Out)-Operations -<br />
-<br />
-<br />
-<br />
-<br />
-<br />
-<br />
-<br />
-<br />
-<br />
Total Financing Sources(Uses) $ - $ - $ - $ - $ - $ - $ - $ - $ - $ -<br />
Fund Balance 6/30 $ 960,170 $ 819,563 $ 781,364 $ 759,700 $ 701,495 $ 433,822 $ 248,363 $ 455,265 $ 669,254 $ 1,048,565<br />
Notes:<br />
Analysis <strong>of</strong> used and usefulness <strong>of</strong> current inventory indicates that the replacement schedule can<br />
be pushed one year. As a result, in FY 2007-08 only emergency replacement <strong>of</strong> inventory is planned.<br />
(54,455)<br />
69,318<br />
(254,227)<br />
82,764<br />
(188,105)<br />
80,118<br />
186,454<br />
59,670<br />
214,955<br />
60,636<br />
372,849<br />
54,174
CITY OF CONCORD<br />
INFORMATION TECHNOLOGY<br />
OPERATIONS (FUND 634)<br />
FOR THE YEAR ENDING JUNE 30, 2008<br />
2007-08 2008-09 2009-10 2010-11 2011-12 2012-13 2013-14 2014-15 2015-16 2016-17<br />
Fund Balance 7/01 $ 1,375,965 $ 1,167,393 $ 940,081 $ 976,621 $ 1,009,746 $ 1,038,581 $ 1,073,291 $ 1,102,623 $ 1,125,513 $ 1,140,918<br />
Add Revenues:<br />
Interest $ 43,743 $ 41,323 $ 46,749 $ 48,448 $ 49,959 $ 51,509 $ 53,071 $ 54,345 $ 55,279 $ 55,814<br />
Service Fees 4,836,902 4,982,006 5,131,467 5,285,413 5,443,975 5,607,295 5,775,514 5,948,777 6,127,243 6,311,055<br />
Total Revenue $ 4,880,645 $ 5,023,329 $ 5,178,216 $ 5,333,861 $ 5,493,934 $ 5,658,804 $ 5,828,585 $ 6,003,122 $ 6,182,522 $ 6,366,869<br />
Less Appropriations:<br />
Operations $ 676,488 $ 699,009 $ 718,957 $ 742,454 $ 766,744 $ 789,927 $ 815,820 $ 842,580 $ 870,171 $ 898,699<br />
Network, Telecomm & Training 2,084,681 2,152,726 1,961,336 2,024,047 2,088,810 2,152,289 2,221,252 2,292,473 2,366,000 2,441,978<br />
System, Programs & GIS 1,220,595 1,263,213 1,300,493 1,344,086 1,389,168 1,432,434 1,480,549 1,530,298 1,581,730 1,634,946<br />
Police Services Operations 855,240 883,480 908,677 937,936 968,164 997,231 1,029,419 1,062,668 1,097,003 1,132,498<br />
East Bay Regional Comm. Sys. 252,213 252,213 252,213 252,213 252,213 252,213 252,213 252,213 252,213 252,213<br />
Total Appropriations $ 5,089,217 $ 5,250,641 $ 5,141,676 $ 5,300,736 $ 5,465,099 $ 5,624,094 $ 5,799,253 $ 5,980,232 $ 6,167,117 $ 6,360,334<br />
Revenues Over (Under)<br />
Appropriations (208,572)<br />
(227,312)<br />
36,540<br />
33,125<br />
Other Funding Sources<br />
Other Transfer $ - $ - $ - $ - $ - $ - $ - $ - $ - $ -<br />
Transfer to/from Replacement -<br />
-<br />
-<br />
-<br />
-<br />
-<br />
-<br />
-<br />
-<br />
-<br />
Total Other Funding Sources $ - $ - $ - $ - $ - $ - $ - $ - $ - $ -<br />
Fund Balance 6/30 $ 1,167,393 $ 940,081 $ 976,621 $ 1,009,746 $ 1,038,581 $ 1,073,291 $ 1,102,623 $ 1,125,513 $ 1,140,918 $ 1,147,453<br />
Notes:<br />
Notes:<br />
Meets all standards contained in the Budget and Fiscal Policy adopted by Council. This policy can be found on page 36.<br />
Salaries and benefits have been budgeted per current labor agreements adjusted for step increases and assuming a full staffing level.<br />
Includes the transfer <strong>of</strong> four positions from Police Services completely funded by service fees.<br />
Employee benefits expenses for medical insurance and retirement reflect recent higher than CPI increases. Post-retirement health expenses include adjustment for 25-Year amortization <strong>of</strong> accrued OPEB liability.<br />
Non-labor operating expenditures for FY 2008 and the remainder <strong>of</strong> the 10-Year planning period, depending on the category, include increases between 2% and 3% for inflation.<br />
Includes internal service fund charges for workers compensation, liability and buildings.<br />
28,835<br />
34,710<br />
29,332<br />
22,890<br />
15,405<br />
6,535
CITY OF CONCORD<br />
INFORMATION TECHNOLOGY<br />
REPLACEMENT (FUND 634)<br />
FOR THE YEAR ENDING JUNE 30, 2008<br />
2007-08 2008-09 2009-10 2010-11 2011-12 2012-13 2013-14 2014-15 2015-16 2016-17<br />
Fund Balance 7/01 $ 792,860 $ 891,559 $ 1,138,933 $ 1,551,826 $ 2,195,102 $ 2,779,320 $ 3,307,263 $ 2,558,187 $ 3,715,903 $ 2,953,764<br />
Add:<br />
Interest $ 30,260 $ 41,284 $ 67,458 $ 93,218 $ 123,157 $ 150,283 $ 144,889 $ 154,856 $ 164,504 $ 155,948<br />
Service Fees 1,164,319 1,199,249 1,235,229 1,272,285 1,310,457 1,349,773 1,390,261 1,431,971 1,474,923 1,519,179<br />
Total Service Fees $ 1,194,579 $ 1,240,533 $ 1,302,687 $ 1,365,503 $ 1,433,614 $ 1,500,056 $ 1,535,150 $ 1,586,827 $ 1,639,427 $ 1,675,127<br />
Less:<br />
Technology Replacement $ 411,880 $ 811,759 $ 684,794 $ 542,227 $ 669,396 $ 792,113 $ 2,104,226 $ 249,111 $ 721,566 $ 1,083,781<br />
Police CAD/RMS Replace. 500,000<br />
-<br />
-<br />
-<br />
-<br />
-<br />
-<br />
- 1,500,000<br />
-<br />
Video Hard/S<strong>of</strong>tware Equip. 19,000 16,400 40,000 15,000 15,000 15,000 15,000 15,000 15,000 15,000<br />
Police/Maint. Radio Replace. 165,000 165,000 165,000 165,000 165,000 165,000 165,000 165,000 165,000 165,000<br />
Total Replacement $ 1,095,880 $ 993,159 $ 889,794 $ 722,227 $ 849,396 $ 972,113 $ 2,284,226 $ 429,111 $ 2,401,566 $ 1,263,781<br />
Revenue Over (Under)<br />
Appropriation 98,699<br />
247,374<br />
412,893<br />
643,276<br />
584,218<br />
527,943<br />
(749,076)<br />
1,157,716<br />
(762,139)<br />
Other Funding Sources<br />
Other Transfer $ - $ - $ - $ - $ - $ - $ - $ - $ - $ -<br />
Transfer to/from Operations -<br />
-<br />
-<br />
-<br />
-<br />
-<br />
-<br />
-<br />
-<br />
-<br />
Total Other Funding Sources $ - $ - $ - $ - $ - $ - $ - $ - $ - $ -<br />
Contingency Reserve $ 75,000 $ 75,000 $ 75,000 $ 75,000 $ 75,000 $ 75,000 $ 75,000 $ 75,000 $ 75,000 $ 75,000<br />
Fund Balance 6/30 $ 816,559 $ 1,063,933 $ 1,476,826 $ 2,120,102 $ 2,704,320 $ 3,232,263 $ 2,483,187 $ 3,640,903 $ 2,878,764 $<br />
3,290,110<br />
411,346
CITY OF CONCORD<br />
BUILDING<br />
OPERATIONS<br />
FOR THE YEAR ENDING JUNE 30, 2008<br />
2007-08 2008-09 2009-10 2010-11 2011-12 2012-13 2013-14 2014-15 2015-16 2016-17<br />
Fund Balance 7/01 $ 280,921 $ 368,394 $ 445,519 $ 535,387 $ 619,297 $ 696,046 $ 774,376 $ 843,680 $ 902,520 $ 949,533<br />
Add Revenues:<br />
Interest $ 11,168 $ 15,959 $ 23,925 $ 28,163 $ 32,082 $ 35,864 $ 39,465 $ 42,590 $ 45,172 $ 47,133<br />
Service Fees 3,631,966 3,740,924 3,853,151 3,968,745 4,087,807 4,210,445 4,336,757 4,466,857 4,600,863 4,738,888<br />
Total Revenue $ 3,643,134 $ 3,756,883 $ 3,877,076 $ 3,996,908 $ 4,119,889 $ 4,246,309 $ 4,376,222 $ 4,509,447 $ 4,646,035 $ 4,786,021<br />
Less Appropriations:<br />
Building Maintenance $ 2,598,316 $ 2,688,234 $ 2,766,356 $ 2,857,686 $ 2,952,173 $ 3,042,867 $ 3,143,721 $ 3,248,011 $ 3,355,671 $ 3,467,070<br />
Custodial Services 957,345 991,524 1,020,852 1,055,312 1,090,967 1,125,112 1,163,197 1,202,596 1,243,351 1,285,547<br />
Total Appropriations $ 3,555,661 $ 3,679,758 $ 3,787,208 $ 3,912,998 $ 4,043,140 $ 4,167,979 $ 4,306,918 $ 4,450,607 $ 4,599,022 $ 4,752,617<br />
Revenues Over (Under)<br />
Appropriations 87,473<br />
77,125<br />
89,868<br />
83,910<br />
Other Financing Sources<br />
Other Transfer $ - $ - $ - $ - $ - $ - $ - $ - $ - $ -<br />
Transfers In (Out)-Replace. -<br />
-<br />
-<br />
-<br />
-<br />
-<br />
-<br />
-<br />
-<br />
-<br />
Total Financing Sources(Uses) $ - $ - $ - $ - $ - $ - $ - $ - $ - $ -<br />
Fund Balance 6/30 $ 368,394 $ 445,519 $ 535,387 $ 619,297 $ 696,046 $ 774,376 $ 843,680 $ 902,520 $ 949,533 $ 982,937<br />
Notes:<br />
Meets all standards contained in the Budget and Fiscal Policy adopted by Council. This policy can be found on page 36.<br />
Salaries and benefits have been budgeted per current labor agreements adjusted for step increases and assuming a full staffing level.<br />
Employee benefits expenses for medical insurance and retirement reflect recent higher than CPI increases. Post-retirement health expenses include adjustment for 25-Year amortization <strong>of</strong> accrued OPEB liability.<br />
Non-labor operating expenditures for FY 2008 and the remainder <strong>of</strong> the 10-Year planning period, depending on the category, include increases between 2 and 3% for inflation.<br />
Includes internal service fund charges for workers' compensation, vehicles, liability and information technology.<br />
76,749<br />
78,330<br />
69,304<br />
58,840<br />
47,013<br />
33,404
2007-08 2008-09 2009-10 2010-11 2011-12 2012-13 2013-14 2014-15 2015-16 2016-17<br />
Fund Balance 7/01 $ 235,230 $ 242,258 $ 327,161 $ 472,315 $ 408,661 $ 484,202 $ 616,448 $ 764,611 $ 673,750 $ 649,516<br />
Add Revenues:<br />
Interest $ 8,212 $ 11,165 $ 19,499 $ 21,487 $ 21,777 $ 26,845 $ 33,684 $ 35,082 $ 32,275 $ 29,520<br />
Service Fees 612,966 631,354 650,294 669,804 689,899 710,593 731,911 753,871 776,486 799,781<br />
Total Revenue $ 621,178 $ 642,519 $ 669,793 $ 691,291 $ 711,676 $ 737,438 $ 765,595 $ 788,953 $ 808,761 $ 829,301<br />
Less Appropriations:<br />
Capital Project<br />
Building Replacement 614,150 557,616 524,639 754,945 636,135 605,192 617,432 879,814 832,995 918,014<br />
Total Appropriations $ 614,150 $ 557,616 $ 524,639 $ 754,945 $ 636,135 $ 605,192 $ 617,432 $ 879,814 $ 832,995 $ 918,014<br />
Revenues Over (Under)<br />
Expenditures 7,028<br />
Contingency Reserve 60,000<br />
84,903<br />
60,000<br />
CITY OF CONCORD<br />
BUILDING<br />
REPLACEMENT<br />
FOR THE YEAR ENDING JUNE 30, 2008<br />
145,154<br />
60,000<br />
(63,654)<br />
60,000<br />
Other Financing Sources<br />
Other Transfer $ - $ - $ - $ - $ - $ - $ - $ - $ - $ -<br />
Transfers In (Out)-Operations -<br />
-<br />
-<br />
-<br />
-<br />
-<br />
-<br />
-<br />
-<br />
-<br />
Total Financing Sources(Uses) $ - $ - $ - $ - $ - $ - $ - $ - $ - $ -<br />
Fund Balance 6/30 $ 182,258 $ 267,161 $ 412,315 $ 348,661 $ 424,202 $ 556,448 $ 704,611 $ 613,750 $ 589,516 $ 500,803<br />
75,541<br />
60,000<br />
132,246<br />
60,000<br />
148,163<br />
60,000<br />
(90,861)<br />
60,000<br />
(24,234)<br />
60,000<br />
(88,713)<br />
60,000
CITY OF CONCORD<br />
FIDUCIARY FUNDS<br />
FOR THE YEAR ENDING JUNE 30, 2008<br />
Fiduciary Funds - Trust funds are used to account for assets held by the <strong>City</strong> as trustee or agent<br />
for other governmental units, private organizations or individuals. The financial activities <strong>of</strong> these<br />
funds are excluded from the <strong>City</strong>-wide financial statements, but are presented in separate<br />
Fiduciary financial statements. The <strong>City</strong> has only one fiduciary fund.<br />
<strong>City</strong> <strong>of</strong> <strong>Concord</strong> Retirement System Plan - The retirement system is a closed plan and is a<br />
single employer defined benefit pension plan covering all full-time employees <strong>of</strong> the <strong>City</strong><br />
retired prior to June 28, 1999. The plan provides retirement and death benefits for general<br />
and police employees as well as disability benefits for police employees. General employees<br />
are eligible for retirement benefits at age 50, provided the employee has completed 20 years<br />
<strong>of</strong> service or has accumulated contributions in excess <strong>of</strong> $500 and as was employed before<br />
June 30, 1990 or has completed 5 years <strong>of</strong> service and was terminated after July 1, 1991.<br />
Sworn police employees are eligible for retirement at age 50, provided the employee has<br />
completed 20 years <strong>of</strong> service or has accumulated contributions exceeding $500. Retirement<br />
benefits are determined based on the employee’s length <strong>of</strong> service, highest one-year<br />
compensation upon retirement, and age at retirement.<br />
343
Pension*<br />
Trust<br />
FUND BALANCE - EMPLOYEES RETIREMENT<br />
SYSTEM AS JULY 1, 2007 $ 51,668,151<br />
REVENUES<br />
EXPENSES<br />
Contributions $ 1,837,200<br />
Use <strong>of</strong> Money & property 3,047,000<br />
Total Revenues $ 4,884,200<br />
Retirement and other benefits $ 4,779,000<br />
Management and Custodial expenses 30,200<br />
Total Expenses $ 4,809,200<br />
OTHER FINANCING SOURCES<br />
CITY OF CONCORD<br />
FIDUCIARY FUNDS<br />
FOR THE YEAR ENDING JUNE 30, 2008<br />
Transfers out -<br />
Excess <strong>of</strong> Revenues and Other Financing sources 75,000<br />
Over (Under) Expenses<br />
FUND BALANCE - EMPLOYEES RETIREMENT<br />
SYSTEM AS JULY 1, 2008 $ 51,743,151<br />
* Assets shown on this page are for the <strong>City</strong> <strong>of</strong> <strong>Concord</strong> Retirement System. As <strong>of</strong> June 20, 1993,<br />
<strong>Concord</strong> entered the California Public Employees Retirement System (PERS) on a prospective basis. In<br />
May, 1999 the <strong>City</strong> purchased from PERS prior service credit for all active employees. The funds shown on<br />
this page represent funding <strong>of</strong> benefit payments for retirees under the <strong>City</strong> <strong>of</strong> <strong>Concord</strong> Retirement System<br />
and for those terminated employees who have left deposits and will be entitled to retirement benefits.
CITY OF CONCORD<br />
REDEVELOPMENT AGENCY<br />
FOR THE YEAR ENDING JUNE 30, 2008<br />
The Redevelopment Agency (“Agency”) <strong>of</strong> the <strong>City</strong> <strong>of</strong> <strong>Concord</strong> was formed in March <strong>of</strong><br />
1973 for the purpose <strong>of</strong> renovating designated areas within the <strong>City</strong>. The <strong>City</strong> Council<br />
sits as the Governing Board <strong>of</strong> the Agency, which is a component unit <strong>of</strong> the <strong>City</strong> and is<br />
accounted for in the fund established by the <strong>City</strong>. The Agency adopted the<br />
Redevelopment Plan in November 1974. The Plan established the Central <strong>Concord</strong><br />
Redevelopment Project, which includes approximately 670 acres in the <strong>City</strong>’s central<br />
business district.<br />
345
2007-08 2008-09 2009-10 2010-11 2011-12 2012-13 2013-14 2014-15 2015-16 2016-17<br />
Fund Balance 7/01 $ 7,579,531 $ 2,671,827 $ 1,461,550 $ 409,499 $ 284,251 $ 451,397 $ 862,811 $ 987,407 $ 1,357,189 $ 1,950,330<br />
Add Revenues:<br />
Gross Tax Increment $ 14,892,075 $ 15,471,502 $ 16,068,312 $ 16,978,368 $ 17,813,072 $ 18,812,063 $ 19,748,544 $ 20,730,352 $ 21,949,766 $ 23,272,411<br />
Less: Pass Through Payments (796,539) (916,651) (1,040,683) (1,223,539) (1,391,779) (1,592,824) (1,781,833) (2,002,614) (2,273,068) (2,565,404)<br />
Tax Increment Rebates (343,469) (348,729) (354,093) (359,561) (365,136) (370,819) (376,614) (382,309) (388,016) (393,834)<br />
Low & Moderate Income Housing (2,917,583) (3,033,468) (3,152,830) (3,334,842) (3,501,782) (3,701,580) (3,888,876) (4,085,238) (4,329,121) (4,593,650)<br />
Net Tax Increment $ 10,834,484 $ 11,172,654 $ 11,520,706 $ 12,060,426 $ 12,554,375 $ 13,146,840 $ 13,701,221 $ 14,260,191 $ 14,959,561 $ 15,719,523<br />
Use Of Money & Property $ 183,156 $ 87,956 $ 51,791 $ 20,974 $ 21,113 $ 35,225 $ 48,298 $ 60,356 $ 83,842 $ 116,602<br />
Home Depot Ground Lease 910,000 910,000 910,000 1,001,000 1,001,000 1,001,000 1,001,000 1,001,000 1,101,100 1,101,100<br />
Property Sales -<br />
-<br />
-<br />
-<br />
-<br />
-<br />
-<br />
-<br />
-<br />
-<br />
Rentals 46,505 47,900 49,337 50,817 52,341 53,911 55,529 57,195 58,911 27,305<br />
Transfer In (Fry's) 322,041 352,046 383,899 417,701 453,558 491,582 531,891 574,608 619,865 667,797<br />
Other 20,717 20,717 20,717 20,717 15,539<br />
-<br />
-<br />
-<br />
-<br />
-<br />
Subtotal Other Sources $ 1,482,419 $ 1,418,619 $ 1,415,744 $ 1,511,209 $ 1,543,551 $ 1,581,718 $ 1,636,718 $ 1,693,159 $ 1,863,718 $ 1,912,804<br />
Total Revenue $ 12,316,903 $ 12,591,273 $ 12,936,450 $ 13,571,635 $ 14,097,926 $ 14,728,558 $ 15,337,939 $ 15,953,350 $ 16,823,279 $ 17,632,327<br />
Less Appropriations:<br />
Operations $ 3,417,909 $ 3,511,021 $ 3,598,716 $ 3,695,441 $ 3,794,997 $ 3,893,123 $ 3,998,487 $ 4,117,587 $ 4,229,529 $ 4,343,790<br />
Debt Service 7,849,162 7,900,319 7,819,686 7,828,280 7,823,770 7,820,904 7,809,440 7,815,822 7,803,110 7,790,963<br />
Total Appropriations $ 11,267,071 $ 11,411,340 $ 11,418,402 $ 11,523,721 $ 11,618,767 $ 11,714,027 $ 11,807,927 $ 11,933,409 $ 12,032,639 $ 12,134,753<br />
Excess (Deficiency) <strong>of</strong> Revenues<br />
Over (Under) Expenditures 1,049,832<br />
1,179,933<br />
<strong>City</strong> <strong>of</strong> <strong>Concord</strong><br />
Redevelopment Agency<br />
Ten Year Projection<br />
For the Year Ending June 30, 2008<br />
1,518,048<br />
2,047,914<br />
Less Capital Projects<br />
Strategic Plan Projects $ 2,235,000 $ 300,000 $ 400,000 $ 950,000 $ 750,000 $ 1,500,000 $ 2,800,000 $ 3,000,000 $ 3,500,000 $ 4,000,000<br />
Capital Projects 3,384,520 1,721,869 1,769,579 788,508 1,091,163 593,897 55,534 57,200 58,916 60,683<br />
Total Capital Expenses $ 5,619,520 $ 2,021,869 $ 2,169,579 $ 1,738,508 $ 1,841,163 $ 2,093,897 $ 2,855,534 $ 3,057,200 $ 3,558,916 $ 4,060,683<br />
Other Financing Sources (Uses)<br />
Transfers Out $ (15,975) $ (16,295) $ (16,621) $ (16,953) $ (17,292) $ (17,638) $ (17,991) $ (18,351) $ (18,718) $ (19,092)<br />
Fry's Loan Disbursement (322,041) (352,046) (383,899) (417,701) (453,558) (491,582) (531,891) (574,608) (619,865) (667,797)<br />
Total Other Financing Sources (Uses) $ (338,016) $ (368,341) $ (400,520) $ (434,654) $ (470,850) $ (509,220) $ (549,882) $ (592,959) $ (638,583) $ (686,889)<br />
Excess (Deficiency) <strong>of</strong> Revenues and Other<br />
Sources Over (Under) Expenditures<br />
and Other Financing Uses $ (4,907,704) $ (1,210,277) $ (1,052,051) $ (125,248) $ 167,146 $ 411,414 $ 124,596 $ 369,782 $ 593,141 $ 750,002<br />
Fund Balance - 6/30 $ 2,671,827 $ 1,461,550 $ 409,499 $ 284,251 $ 451,397 $ 862,811 $ 987,407 $ 1,357,189 $ 1,950,330 $ 2,700,332<br />
2,479,159<br />
3,014,531<br />
3,530,012<br />
Notes:<br />
Meets all standards contained in the Budget and Fiscal Policies adopted by Council. This statement can be found on page 36.<br />
Revenues:<br />
Tax Increment growth rate is 3% FY 2007-2010, 4% FY 2011-2015 and 5% for FY 2016-2017.<br />
Operations Expenditures:<br />
Salaries and benefits have been budgeted per current labor agreements adjusted for step increases and assuming a full staffing level.<br />
Employee benefits expenses for medical insurance and retirement reflect recent higher than CPI increases and post retirement health includes amortization <strong>of</strong> OPEB accrued liability over 25-Year term.<br />
Non-labor operating expenditures for FY 2008 and the remainder <strong>of</strong> the 10-Year planning period, depending on the category, include increases between 2% and 3% for inflation.<br />
Includes internal service fund charges for building, information technology, workers' compensation and liability.<br />
4,019,941<br />
4,790,640<br />
5,497,574
20,000,000<br />
18,000,000<br />
16,000,000<br />
14,000,000<br />
12,000,000<br />
10,000,000<br />
8,000,000<br />
6,000,000<br />
RDA Comparision <strong>of</strong> Operating Revenue to Operating Expense<br />
2007-08 2008-09 2009-10 2010-11 2011-12 2012-13 2013-14 2014-15 2015-16 2016-17<br />
Net Tax Increment Other Revenue Debt Service Operating Expenditures
Redevelopment projects in past years have left us with the below eye-pleasing complexes<br />
that stand out in our downtown area.<br />
Bank <strong>of</strong><br />
America<br />
Center<br />
Tishman<br />
Building<br />
348<br />
Gateway<br />
Commons
Number <strong>of</strong> Authorized Positions<br />
2005-2006 2006-2007 2007-2008<br />
Budget Budget Budget<br />
Building, Engineering & Neighborhood Services<br />
Administrative Analyst 1.0 1.0 1.0<br />
Administrative Clerk II 2.0 1.0 1.0<br />
Administrative Secretary 1.0 1.0 1.0<br />
Building Inspector 5.0 5.0 4.0<br />
Building Inspector Supervisor 1.0 1.0 1.0<br />
Building Plans Engineer 1.0 1.0 1.0<br />
Capital Improvement Project (CIP) Analyst 1.0 1.0<br />
Chief Building Official 1.0 1.0 1.0<br />
Construction Inspector * 6.0 6.0 6.0<br />
Construction Inspection Supervisor 1.0 1.0 1.0<br />
Director <strong>of</strong> Building Engineering & Neighborhood Services 1.0 1.0 1.0<br />
Neighborhood Preservation Specialist 4.0 3.0 4.0<br />
Neighborhood Preservation Supervisor 2.0 2.0 2.0<br />
Neighborhood Services Manager 1.0 1.0 1.0<br />
Permit Center Technician II 5.0 4.0 4.0<br />
Permit Center Technician III 3.0 5.0 5.0<br />
Public Works Engineer I<br />
Assistant Engineer 1.0 1.0 1.0<br />
Associate Civil Engineer 3.0 3.0 3.0<br />
Senior Building Inspector 3.0 3.0 3.0<br />
Senior Civil Engineer 3.0 3.0 3.0<br />
Senior Construction Inspector 1.0<br />
Total Building, Engineering & Neighborhood Services 47.0 45.0 44.0<br />
<strong>City</strong> Attorney<br />
Assistant <strong>City</strong> Attorney 2.0 2.0 2.0<br />
<strong>City</strong> Attorney 1.0 1.0 1.0<br />
Deputy <strong>City</strong> Attorney 1.0 1.0 1.0<br />
Executive Legal Secretary 1.0 1.0 1.0<br />
Legal Secretary 1.0 1.0 1.0<br />
Total <strong>City</strong> Attorney 6.0 6.0 6.0<br />
<strong>City</strong> Council<br />
Confidential Secretary 1.0 1.0 1.0<br />
Councilmember 3.0 3.0 3.0<br />
Mayor 1.0 1.0 1.0<br />
Vice Mayor 1.0 1.0 1.0<br />
Total <strong>City</strong> Council 6.0 6.0 6.0<br />
<strong>City</strong> Management<br />
Administrative Assistant 1.0 1.0<br />
Administrative Clerk II 2.0 1.0 1.0<br />
Administrative Secretary 1.0 1.0<br />
Administrative Service Coordinator 1.0 1.0<br />
Assistant <strong>City</strong> Manager 1.0 1.0 1.0<br />
<strong>City</strong> Clerk 1.0 1.0 1.0<br />
<strong>City</strong> Manager 1.0 1.0 1.0<br />
Community Relations Manager 1.0 1.0 1.0<br />
Desktop Publishing Specialist 1.0 1.0 1.0<br />
*Includes one overfill position.<br />
CITY OF CONCORD<br />
AUTHORIZED FULL-TIME POSITIONS<br />
BY CLASSIFICATION WITHIN DEPARTMENT<br />
FOR THE YEAR ENDING JUNE 30, 2008
CITY OF CONCORD<br />
AUTHORIZED FULL-TIME POSITIONS<br />
BY CLASSIFICATION WITHIN DEPARTMENT<br />
FOR THE YEAR ENDING JUNE 30, 2008<br />
2005-2006 2006-2007 2007-2008<br />
Budget Budget Budget<br />
<strong>City</strong> Management (Continued)<br />
Deputy <strong>City</strong> Clerk 2.0<br />
Director <strong>of</strong> <strong>City</strong> Management Department 1.0 1.0 1.0<br />
Duplicating/Offset Printing Operator 1.0 1.0 1.0<br />
Executive Assistant-Council/<strong>City</strong> Manager 1.0 1.0 1.0<br />
Printing Services Supervisor 1.0 1.0 1.0<br />
Senior Offset Duplicating Machine Operator 1.0 1.0 1.0<br />
Video Services Coordinator 1.0 1.0 1.0<br />
Total <strong>City</strong> Management 15.0 15.0 15.0<br />
Community & Recreation Services<br />
Administrative Secretary/Assistant 1.0 1.0 1.0<br />
Camp Director 1.0 1.0 1.0<br />
Camp Facility Specialist 1.0 1.0 1.0<br />
Community Services Manager 1.0 1.0 1.0<br />
Director <strong>of</strong> Community & Recreation Services* 1.0 1.0 1.0<br />
Recreation Customer Service Coordinator 1.0 1.0 1.0<br />
Recreation Program Aide 2.0 2.0 2.0<br />
Recreation Program Coordinator Contractual 1.0 1.0 1.0<br />
Recreation Program Coordinator 5.0 5.0 5.0<br />
Recreation Program Manager 4.0 4.0 4.0<br />
Recreation Utility Worker 1.0<br />
Senior Recreation Program Manager 2.0 2.0 2.0<br />
Total Community & Recreation Services 21.0 20.0 20.0<br />
Finance<br />
Account Clerk II ** 5.0 4.0 1.0<br />
Account Clerk III 2.0 3.0 5.0<br />
Accountant I 1.0 1.0 1.0<br />
Accountant II 4.0 4.0 4.0<br />
Accounts Payable Team Leader 1.0 1.0 1.0<br />
Administrative Clerk II 1.0 1.0 1.0<br />
Administrative Clerk III 1.0 1.0<br />
Budget Officer 1.0 1.0 1.0<br />
Buyer 1.0 1.0 1.0<br />
Central Storekeeper 1.0 1.0 1.0<br />
<strong>City</strong> Treasurer 1.0 1.0 1.0<br />
Deputy <strong>City</strong> Treasurer 1.0<br />
Director <strong>of</strong> Finance 1.0 1.0 1.0<br />
Financial Analyst 1.0<br />
Financial Operations Manager 1.0 1.0 1.0<br />
Payroll Specialist 1.0 1.0 1.0<br />
Payroll Technician 1.0 1.0<br />
Purchasing Agent 1.0 1.0 1.0<br />
Revenue Generation Team Leader 1.0 1.0 1.0<br />
Treasury Manager 1.0 1.0<br />
Treasury Technician 1.0 1.0 1.0<br />
Total Finance 26.0 26.0 27.0<br />
*Twenty-five percent <strong>of</strong> this position is funded by the Golf Course Enterprise Fund.<br />
**Includes one overfill position.<br />
Number <strong>of</strong> Authorized Positions
CITY OF CONCORD<br />
AUTHORIZED FULL-TIME POSITIONS<br />
BY CLASSIFICATION WITHIN DEPARTMENT<br />
FOR THE YEAR ENDING JUNE 30, 2008<br />
2005-2006 2006-2007 2007-2008<br />
Budget Budget Budget<br />
Human Resources<br />
Confidential Secretary 1.0 1.0 1.0<br />
Director <strong>of</strong> Human Resources 1.0 1.0 1.0<br />
Employment Services Manager 1.0 2.0<br />
Human Resources Analyst I 1.0 1.0<br />
Human Resources Analyst II 0.0 1.0<br />
Senior Human Resources Analyst 2.0 2.0 1.0<br />
Human Resources Specialist 1.0 1.0<br />
Human Resources Technician II 2.0 2.0 2.0<br />
Risk Manager 1.0<br />
Total Human Resources 8.0 9.0 9.0<br />
Information Technology<br />
Administrative Analyst 1.0<br />
Director <strong>of</strong> Information Technology 1.0 1.0 1.0<br />
GIS Program Supervisor 1.0 1.0 1.0<br />
GIS Technician 1.0 1.0 1.0<br />
Information Systems Technician I 1.0<br />
Information Systems Technician II 1.0 1.0 1.0<br />
Microcomputer Coordinator 1.0 1.0 2.0<br />
Network and Telecommunications System Manager 1.0 1.0 1.0<br />
Network Engineer 1.0 1.0<br />
Programmer 1.0<br />
Senior Network System Engineer 1.0 1.0 1.0<br />
Senior Programmer Analyst 2.0 2.0 3.0<br />
Senior Systems Analyst 1.0 1.0 1.0<br />
Systems & Programming Manager 1.0 1.0 2.0<br />
Telecommunications Coordinator 1.0 1.0<br />
Web Coordinator 1.0 1.0 1.0<br />
Total Information Technology 14.0 14.0 18.0<br />
<strong>Concord</strong> Community Reuse Project<br />
Administrative Assistant 1.0<br />
<strong>Concord</strong> Weapons Station Reuse Director 1.0<br />
<strong>Concord</strong> Weapons Station Reuse Manaager 1.0<br />
Total Naval Weapons Station Reuse 3.0<br />
Planning and Economic Development*<br />
Administrative Assistant 1.0 1.0 1.0<br />
Administrative Clerk III 2.0 2.0 2.0<br />
Administrative Secretary 3.0 3.0 3.0<br />
Assistant Planner 1.0 1.0 1.0<br />
Associate Planner 3.0 3.0<br />
Community Service Officer 1.0<br />
Business Development Manager 1.0 1.0 1.0<br />
Director <strong>of</strong> Planning and Economic Development 1.0 1.0 1.0<br />
Director <strong>of</strong> Building/Neighborhood Services 1.0<br />
Downtown Coordinator 1.0 1.0 1.0<br />
Economic/Redevelopment Manager 1.0 1.0 1.0<br />
Economic/Redevelopment Specialist 2.0 1.0 1.0<br />
Housing Manager 1.0 1.0 1.0<br />
Housing Program Analyst 1.0 1.0 1.0<br />
Housing Rehabilitation Coordinator 1.0 1.0 1.0<br />
Housing Rehabilitation Specialist 1.0 1.0 1.0<br />
Planning Manager 1.0 1.0 1.0<br />
Planning Technician 1.0<br />
Principal Planner 2.0 2.0 2.0<br />
Senior Housing Rehabilitation Specialist 1.0 1.0 1.0<br />
Senior Planner ** 2.0 2.0 4.0<br />
Total Planning and Economic Development 27.0 25.0 26.0<br />
*The Redevelopment Agency funds 7 positions assigned to this department.<br />
**One position is overfill.<br />
Number <strong>of</strong> Authorized Positions
CITY OF CONCORD<br />
AUTHORIZED FULL-TIME POSITIONS<br />
BY CLASSIFICATION WITHIN DEPARTMENT<br />
FOR THE YEAR ENDING JUNE 30, 2008<br />
Number <strong>of</strong> Authorized Positions<br />
2005-2006 2006-2007 2007-2008<br />
Budget Budget Budget<br />
Police Department<br />
Administrative Clerk II 10.0 10.0 10.0<br />
Administrative Clerk III 6.0 5.0 5.0<br />
Administrative Secretary 4.0 4.0 4.0<br />
Chief <strong>of</strong> Police 1.0 1.0 1.0<br />
Community Service Officer 9.0 9.0 9.0<br />
Community Service Officer/Detention 5.0 5.0 5.0<br />
Executive Secretary 1.0 1.0 1.0<br />
Financial Analyst 1.0 1.0 1.0<br />
Forensic Specialist I 3.0 3.0 4.0<br />
Lead Forensic Specialist 2.0 2.0 1.0<br />
Information Systems Technician I 1.0 1.0<br />
Lead Dispatcher 4.0 4.0 4.0<br />
Microcomputer Coordinator 1.0 1.0<br />
Police Captain 3.0 3.0 3.0<br />
Police Dispatcher I 2.0 2.0 2.0<br />
Police Dispatcher II 10.0 10.0 10.0<br />
Police Lieutenant 9.0 9.0 9.0<br />
Police Officer 128.0 127.0 127.0<br />
Police Records Manager 1.0 1.0 1.0<br />
Police Sergeant 18.0 19.0 19.0<br />
Senior Police Crimes Analyst 1.0 1.0 1.0<br />
Senior Programmer Analyst 1.0 1.0<br />
Systems & Programming Manager 1.0 1.0<br />
Violence-Victim Advocate 1.0 1.0 1.0<br />
Youth Violence Prevention Specialist 1.0 1.0 1.0<br />
Total Police 224.0 223.0 219.0
CITY OF CONCORD<br />
AUTHORIZED FULL-TIME POSITIONS<br />
BY CLASSIFICATION WITHIN DEPARTMENT<br />
FOR THE YEAR ENDING JUNE 30, 2008<br />
2005-2006 2006-2007 2007-2008<br />
Budget Budget Budget<br />
Public Works<br />
Administrative Analyst 1.0<br />
Administrative Assistant 1.0 1.0<br />
Administrative Clerk III 3.0 3.0 3.0<br />
Administrative Secretary 1.0 1.0 1.0<br />
Custodian 6.0 6.0 6.0<br />
Director <strong>of</strong> Public Works 1.0 1.0 1.0<br />
Environmental Maintenance Technician 2.0 2.0 2.0<br />
Equipment Maintenance Storekeeper 1.0 1.0<br />
Equipment Mechanic 4.0 4.0 4.0<br />
Facilities Maintenance Supervisor 1.0 1.0<br />
Facilities Maintenance Manager 1.0 1.0 1.0<br />
Fleet Manager 1.0 1.0 1.0<br />
General Laborer 6.0 6.0 6.0<br />
Heavy Equipment Operator 1.0 1.0<br />
Heavy Equipment Operator I 3.0 3.0 4.0<br />
Heavy Equipment Operator II 1.0 1.0 1.0<br />
Horticultural Advisor 1.0 1.0<br />
Infrastructure Maintenance Manager 1.0 1.0 1.0<br />
Landscape Gardener 6.0 6.0 5.0<br />
Lead Custodian 2.0 2.0 2.0<br />
Maintenance Carpenter 3.0 3.0 3.0<br />
Maintenance Electrician 3.0 3.0 3.0<br />
Maintenance Gardener 5.0 5.0 5.0<br />
Maintenance Painter 2.0 2.0 2.0<br />
Maintenance Sprinkler Fitter 1.0 1.0 1.0<br />
Maintenance Team Leader 4.0 4.0 4.0<br />
Maintenance Utility Mechanic 2.0 2.0 2.0<br />
Maintenance Worker I 1.0 1.0 1.0<br />
Maintenance Worker II 11.0 11.0 11.0<br />
Parks and Facilities Maintenance Manager 1.0<br />
Parks & Facilities Scheduling Manager 1.0<br />
Parks Lead Worker 2.0 2.0 3.0<br />
Parks Manager 1.0 1.0 1.0<br />
Public Works Lead Worker 1.0 1.0 2.0<br />
Recreation Utility Worker 1.0 2.0<br />
Senior Construction Inspector 1.0 1.0 1.0<br />
Senior Maintenance Team Leader 7.0 6.0 6.0<br />
Senior Traffic Signal Technician 1.0 1.0<br />
Traffic Signal Technician * 3.0 3.0 3.0<br />
Transportation Manager 1.0 1.0 1.0<br />
Transportation Program Coordinator 2.0 2.0 2.0<br />
Transportation Program Manager II 2.0 2.0 1.0<br />
Tree Lead Worker 1.0 1.0 1.0<br />
Tree Trimmer 2.0 2.0 2.0<br />
Total Public Works** 98.0 99.0 99.0<br />
TOTAL GENERAL CITY AND REDEVELOPMENT AGENCY 492.0 488.0 492.0<br />
*Positions funded mostly by Lighting Districts.<br />
**Some <strong>of</strong> these positions funded by Storm Water Management.<br />
Number <strong>of</strong> Authorized Positions
CITY OF CONCORD<br />
AUTHORIZED FULL-TIME POSITIONS<br />
BY CLASSIFICATION WITHIN DEPARTMENT<br />
FOR THE YEAR ENDING JUNE 30, 2008<br />
2005-2006 2006-2007 2007-2008<br />
Budget Budget Budget<br />
Storm Water Management<br />
Senior Administrative Analyst 1.0 1.0 1.0<br />
Sweeper Operator 3.0 3.0 3.0<br />
Total Storm Water Management 4.0 4.0 4.0<br />
Sewer Enterprise<br />
Public Works Lead Worker - Infrastructure 1.0 1.0 1.0<br />
Maintenance Team Leader 1.0 1.0 1.0<br />
Maintenance Worker II 6.0 6.0 6.0<br />
Pump Station Operator 1.0 1.0 1.0<br />
Total Sewer 9.0 9.0 9.0<br />
Diablo Creek Golf Course *<br />
Golf Course Maintenance Program Manager 1.0<br />
Greens keeper 3.0<br />
Senior Greens keeper 1.0<br />
Total Golf Course 5.0<br />
Number <strong>of</strong> Authorized Positions<br />
TOTAL STORM WATER AND ENTERPRISE FUNDS 18.0 13.0 13.0<br />
GRAND TOTAL CITY 510.0 501.0 505.0<br />
*Golf Course maintenance staff supplanted by outside services maintenance contract 1/2006.
2005-2006<br />
2006-2007<br />
2007-2008<br />
Hours FTE Hours FTE Hours FTE<br />
Building, Engineering & Neighborhood Services<br />
Administrative Support 1,477 0.71 998 0.48 2,995 1.44<br />
Technician 1,040 0.50 1,997 0.96 3,286 1.58<br />
Project Manager 957 0.46 998 0.48 1,456 0.70<br />
Craft Worker 998 0.48 998 0.48 998 0.48<br />
Pr<strong>of</strong>essional 998 0.48 1,456 0.70<br />
Right <strong>of</strong> Way Agent 957 0.46<br />
Total Build., Eng. & Neighborhood 5,429 2.61 5,990 2.88 10,192 4.90<br />
<strong>City</strong> Attorney<br />
Administrative Support 270.4 0.13<br />
<strong>City</strong> Management<br />
Administrative Support 1,456 0.70 1,789 0.86 1,789 0.86<br />
Technician 83 0.04 83 0.04 83 0.04<br />
Total <strong>City</strong> Manager 1,539 0.74 1,872 0.90 1,872 0.90<br />
Community & Recreation Services<br />
Administrative Support 998 0.48 998 0.48<br />
Camp Specialist 16,432 7.90 16,702 8.03 17,139 8.24<br />
Recreation Specialist 128,502 61.78 133,349 64.11 146,411 70.39<br />
Total Community & Recreation Serv. 144,934 69.68 151,050 72.62 164,549 79.11<br />
Finance<br />
Administrative Support<br />
Human Resources<br />
Administrative Support<br />
CITY OF CONCORD<br />
AUTHORIZED PART-TIME HOURS<br />
BY CLASSIFICATION WITHIN DEPARTMENT<br />
FOR THE YEAR ENDING JUNE 30, 2008<br />
Information Technology<br />
Technician 1,581 0.76 2,662 1.28 2,995 1.44<br />
Pr<strong>of</strong>essional 104 0.05 104 0.05 1,144 0.55<br />
Total Information Technology 1,685 0.81 2,766 1.33 4,139 1.99<br />
Planning and Economic Development<br />
Administrative Support 2,475 1.19 1,997 0.96 2,038 0.98<br />
Technician 998 0.48<br />
Pr<strong>of</strong>essional 499 0.24 499 0.24 499 0.24<br />
Total Planning and Economic Dev. 2,974 1.43 3,494 1.68 2,538 1.22
2005-2006<br />
2006-2007<br />
2007-2008<br />
Hours FTE Hours FTE Hours FTE<br />
Police<br />
Administrative Support 2,267 1.09 1,622 0.78<br />
Crime Analyst 1,560 0.75 1,560 0.75 1,560 0.75<br />
Manager <strong>of</strong> Volunteer Services 1,560 0.75 1,581 0.76 1,581 0.76<br />
Public Safety Assistant 39,978 19.22 40,622 19.53 42,224 20.30<br />
Technician 1,622 0.78 2,267 1.09 1,560 0.75<br />
Violence Victim Advocate 1,040 0.50 1,040 0.50 1,040 0.50<br />
Total Police 48,027 23.09 48,693 23.41 47,965 23.06<br />
Public Works<br />
Maintenance Laborer (Parks & Facilities) 71,802 34.52 71,822 34.53 72,821 35.01<br />
Technician 499 0.24 499 0.24 499 0.24<br />
Maintenance Laborer 5,221 2.51 8,216 3.95 8,216 3.95<br />
Total Public Works 77,522 37.27 80,538 38.72 81,536 39.20<br />
TOTAL GENERAL CITY AND REDEVELOPMENT 282,381 135.76 294,403 141.54 312,790 150.38<br />
Storm Water<br />
Community Recreation Specialist<br />
General Laborer<br />
Total Storm Water<br />
Sewer Enterprise<br />
Community Recreation Specialist<br />
CITY OF CONCORD<br />
AUTHORIZED PART-TIME HOURS<br />
BY CLASSIFICATION WITHIN DEPARTMENT<br />
FOR THE YEAR ENDING JUNE 30, 2008<br />
Golf Course *<br />
Recreation Specialist 998 0.48<br />
General Laborer 11,606 5.58<br />
Total Golf Course 12,605 6.06<br />
TOTAL STORM WATER AND ENTERPRISE FUNDS 12,605 6.06<br />
GRAND TOTAL CITY 294,985 141.82 294,403 141.54 312,790 150.38<br />
*Golf Course maintenance staff supplanted by outside services maintenance contract 1/2006.
Glossary <strong>of</strong> Terms<br />
Accrual Basis - A basis <strong>of</strong> accounting in which transactions are recorded when the<br />
underlying event occurs, as opposed to when the cash is received or when the bill is paid.<br />
ADA - Acronym used to denote the American Disabilities Act.<br />
Appropriation – Represents the legal authorization granted by the legislative body (i.e.,<br />
<strong>City</strong> Council) to incur obligations and to make expenditures for specific purposes.<br />
Assessed Valuation - The valuation set upon real estate and certain personal property by<br />
the Assessor as a basis for levying property taxes.<br />
Asset - Resources having monetary value which are owned or held by a government.<br />
Available (Undesignated) Fund Balance - Funds remaining at the end <strong>of</strong> the prior year,<br />
which are available for use in the current year.<br />
Balanced Budget – A budget in which current revenues in combination with current fund<br />
balances equal current expenditures.<br />
Benefits Reserve Fund – Reserve fund intended to support unplanned costs and<br />
obligations determined in the current negotiated employment benefits.<br />
Bond - A written promise to pay a specified sum <strong>of</strong> money (called the face value or<br />
principal amount), at a specified date or dates in the future called the maturity date(s),<br />
together with periodic interest at a specified rate.<br />
BGP – Acronym us to refer to the company known as Bill Graham Presents.<br />
Budget - A plan <strong>of</strong> financial activity for a specified period <strong>of</strong> time (fiscal year or bi-annual)<br />
indicating all estimated revenues and appropriated expenditures for that time period.<br />
Budget Calendar - The schedule <strong>of</strong> key dates followed in the preparation and adoption <strong>of</strong><br />
the <strong>City</strong> budget.<br />
Budgetary Control - The control or management <strong>of</strong> the government finances to keep<br />
expenditures in accordance with the limitations <strong>of</strong> available appropriations and resources.<br />
CALEA – Acronym used to denote the Commission on Accreditation for Law Enforcement.<br />
CalPERS – Acronym used to denote the California Public Employees Retirement System.<br />
Capital Assets - Assets <strong>of</strong> significant value and having a useful life <strong>of</strong> several years.<br />
Capital assets are also called fixed assets.<br />
Capital Budget – A plan <strong>of</strong> proposed capital outlay projects and the means to finance<br />
them.<br />
357
GLOSSARY OF TERMS (cont.)<br />
Capital Improvement Program (CIP) – An appropriation plan for expenditures for capital<br />
outlay projects to be incurred each year over a fixed period <strong>of</strong> years. The <strong>City</strong> <strong>of</strong> <strong>Concord</strong><br />
prepares a ten year CIP.<br />
Capital/Maintenance Reserve – Funds available for Council appropriation to meet<br />
unanticipated and unscheduled capital and maintenance needs <strong>of</strong> <strong>City</strong> infrastructure and<br />
facilities. This reserve is to be used for major capital repair where facility failure, unexpected<br />
hazards or destruction <strong>of</strong> <strong>City</strong> property has occurred and where repair or replacement is not<br />
planned with the established capital, operations, or internal replacement funds.<br />
Capital Outlay – The expenditures for capital projects and equipment with a value <strong>of</strong><br />
$7,500 or more and a useful economic lifetime <strong>of</strong> more than one year; or, assets <strong>of</strong> any<br />
value if the nature <strong>of</strong> the item is such that it must be controlled for custody purposes as a<br />
fixed asset.<br />
Capital Project – A major construction, acquisition, or renovation activity which adds value<br />
to fixed assets or which significantly increases its useful life. Can also be called a capital<br />
improvement.<br />
Cash Basis - A basis <strong>of</strong> accounting in which transactions is recognized only when cash is<br />
received or disbursed.<br />
CCE – Acronym used to refer to the Clear Channel Entertainment Company.<br />
CCCSD – Acronym used to refer to the Contra Costa County Sanitary District.<br />
CCCWP – Acronym used to denote Contra Costa County Water Pollution.<br />
CDBG – Acronym used to denote the Community Development Block Grant.<br />
COG – Acronym used to refer to Community Oriented Government.<br />
COPS - Acronym used to refer to a grant for Citizens Options for Public Safety.<br />
CPI – Acronym used to refer to the Consumer Priced Index.<br />
CSC – Acronym used to denote the Community Services Commission.<br />
CSMFO – Acronym used to denote the California Society <strong>of</strong> Municipal Finance Officers.<br />
Debt Service - The cost <strong>of</strong> paying principal and interest on borrowed money (bonds)<br />
according to a predetermined payment schedule.<br />
Department - The basic organizational unit <strong>of</strong> government which is functionally unique in its<br />
delivery <strong>of</strong> services.<br />
358
GLOSSARY OF TERMS (cont.)<br />
Depreciation – Portion <strong>of</strong> the cost <strong>of</strong> a fixed asset used up each year <strong>of</strong> its useful life.<br />
Disbursement – Payment in cash from the <strong>City</strong> Treasury.<br />
Distinguished Budget Presentation Awards Program - A voluntary awards program<br />
administered by the Government Finance Officers Association to encourage governments<br />
to prepare effective budget documents.<br />
Economic Contingency Reserve – Funds available for Council appropriation to meet<br />
unanticipated needs caused by State or Federal redirection <strong>of</strong> <strong>City</strong> resources, general<br />
economic downturns, or reductions in operating revenues.<br />
Employee (or Fringe) Benefits – Compensation to employees provided in addition to<br />
salary and wages. Benefits include, but are not limited to retirement plan contributions and<br />
health insurance.<br />
Encumbrance – The estimated amount <strong>of</strong> expenditures ultimately to result if what has<br />
been committed is completed.<br />
Entitlements - Payments to which local governmental units are entitled, pursuant to an<br />
allocation formula determined by the agency providing the monies, usually the state or the<br />
federal government.<br />
Expenditure - The payment <strong>of</strong> cash on the transfer <strong>of</strong> property or services for the purpose<br />
<strong>of</strong> acquiring an asset, service, or settling a loss.<br />
Expense - Charges incurred (whether paid immediately or unpaid) for operations,<br />
maintenance, interest, or other charges.<br />
Fiscal Year - A twelve-month period designated as the operating year for accounting and<br />
budgeting purposes in an organization.<br />
Fixed Assets - Assets <strong>of</strong> long-term character that are intended to continue to be held or<br />
used, such as land, buildings, machinery, furniture, and other equipment.<br />
FTE – Refer to the description shown below.<br />
Full-time Equivalent Position (FTE) - A part-time position converted to the decimal<br />
equivalent <strong>of</strong> a full-time position based on 2,080 hours per year.<br />
Function - A group <strong>of</strong> related activities aimed at accomplishing a major service or<br />
regulatory program for which a government is responsible (e.g., public safety).<br />
Fund - A fiscal subdivision <strong>of</strong> the governmental entity financial records including assets,<br />
liabilities and fund balance, held apart for the accounting <strong>of</strong> a specific purpose or activity.<br />
359
GLOSSARY OF TERMS (cont.)<br />
Fund Balance - The excess <strong>of</strong> the assets <strong>of</strong> a fund over its liabilities. Fund balance may<br />
be restricted as to its use or it may be available for any use within the fund specific purpose.<br />
GAAP - Generally Accepted Accounting Principles. Uniform minimum standards for<br />
financial accounting and recording, encompassing the conventions, rules, and procedures<br />
that define accepted accounting principles<br />
GASB – Acronym used to refer to the Governmental Accounting Standards Board.<br />
GFOA – Acronym used to refer to the Government Finance Officers Association.<br />
General Fund – Used to account for all financial resources except for those required to<br />
be accounted for in other funds.<br />
Goal - A statement <strong>of</strong> broad direction, purpose, or intent based on the needs <strong>of</strong> the<br />
community. A goal is general and timeless.<br />
Grants - A contribution by a government or other organization to support a particular<br />
function. Grants may be classified as either operational or capital, depending upon the<br />
grantee or the project.<br />
Indirect Cost - A cost necessary for the functioning <strong>of</strong> the organization as a whole, but<br />
which is not directly assigned to one service.<br />
Interfund Transfers - The movement <strong>of</strong> monies between funds <strong>of</strong> the same governmental<br />
entity.<br />
Intergovernmental Revenue - Funds received from federal, state, and other local<br />
government sources in the form <strong>of</strong> grants, shared revenues, and payments in lieu <strong>of</strong> taxes.<br />
Internal Service Charges - The charges to user departments for services provided by<br />
another department, such as fleet maintenance or information technology.<br />
Lapsing Appropriation - An appropriation made for a certain period <strong>of</strong> time, generally for<br />
the budget year. At the end <strong>of</strong> the specified period, any unexpected or unencumbered<br />
balances lapse or end, unless otherwise provided by law.<br />
LSR - Acronym used to denote the Local Streets and Roads component <strong>of</strong> California<br />
Proposition 1B, the Transportation Bond Act passed in 2006<br />
Materials and Supplies – The expendable materials and operating supplies required<br />
facilitating departmental operations.<br />
MOU – Acronym used to denote <strong>Memo</strong>randum <strong>of</strong> Understanding. This is a contract<br />
between the <strong>City</strong> and employee union.<br />
NPDES – Acronym used to denote the National Pollutant Discharge Elimination System.<br />
360
GLOSSARY OF TERMS (cont.)<br />
OPEB – Acronym used to denote other post employment benefits.<br />
Objective - Something to be accomplished in specific, well-defined, and measurable terms<br />
and that is achievable within a specific time frame.<br />
Operating Expenses - The cost for personnel, materials, and equipment required for a<br />
department to function.<br />
Operating Revenue - Funds that the government receives as income to pay for ongoing<br />
operations. It includes such items as taxes, fees from specific services, interest earnings,<br />
and grant revenues. Operating revenues are used to pay for day-to-day services.<br />
PBB – Acronym used to denote Performance Based Budget.<br />
Performance Based Budget - A budget wherein expenditures are based primarily upon<br />
measurable performance <strong>of</strong> activities and work programs.<br />
Performance Indicators - Specific quantitative and qualitative measures <strong>of</strong> work<br />
performed as an objective <strong>of</strong> specific departments or programs.<br />
Performance Measure - Data collected to determine how effective or efficient a program is<br />
in achieving its objectives.<br />
Personal Services - Expenditures for salaries, wages, and fringe benefits <strong>of</strong> a<br />
government's employees.<br />
Program - A group <strong>of</strong> related activities performed by one or more organizational units for<br />
the purpose <strong>of</strong> accomplishing a function for which the government is responsible.<br />
Program Budget - A budget that allocates money to the functions or activities <strong>of</strong> a<br />
government rather than to specific items <strong>of</strong> cost or to specific departments.<br />
RDA – Acronym used to denote the Redevelopment Agency.<br />
Revenue – Refers to the sources <strong>of</strong> income received to finance the operations <strong>of</strong><br />
government.<br />
RFP – Acronym used to refer to a “Request for Proposal”.<br />
SFRWQCB – Acronym used to refer to the San Francisco Regional Water Quality Control<br />
Board.<br />
361
GLOSSARY OF TERMS (cont.)<br />
Taxes - Compulsory charges levied by a government for the purpose <strong>of</strong> financing services<br />
performed for the common benefit <strong>of</strong> the people. This term does not include specific<br />
charges made against particular persons or property for current or permanent benefit, such<br />
as special assessments.<br />
Transfers In/Out – See Interfund Transfers.<br />
Unencumbered Balance - The amount <strong>of</strong> an appropriation that is neither expended nor<br />
encumbered. It is essentially the amount <strong>of</strong> money still available for future purposes.<br />
Unforecasted Reserve Fund – Funds available for Council appropriation to continue<br />
services if State, Federal, or other grant funding sources are lost, and to <strong>of</strong>fset the costs <strong>of</strong><br />
unanticipated, unfunded governmental mandates.<br />
VLF – Acronym used to refer to the Vehicle License Fees.<br />
362
CITY OF CONCORD<br />
2007-2008 ANNUAL OPERATING BUDGET<br />
VOLUME I<br />
TEN YEAR FINANCIAL PLANS INDEX<br />
Building Maintenance Operations ............................................................................................................. 341<br />
Building Maintenance Replacement ......................................................................................................... 342<br />
Capital Projects Fund................................................................................................................................ 314<br />
<strong>City</strong>wide Street Lighting ............................................................................................................................ 297<br />
Diablo Creek Golf Course ......................................................................................................................... 329<br />
Downtown Landscape Maintenance District............................................................................................. 298<br />
Fleet Maintenance Equipment Replacement............................................................................................ 338<br />
Fleet Maintenance Operations.................................................................................................................. 337<br />
General Fund .............................................................................................................................................. 41<br />
Information Technology Operations.......................................................................................................... 339<br />
Information Technology Replacement ...................................................................................................... 340<br />
Landscape and Lighting Maintenance District No. 3 ................................................................................ 300<br />
Liability Fund ............................................................................................................................................. 335<br />
Pine Hollow Landscape Maintenance District........................................................................................... 299<br />
Post Retirement Healthcare (OPEB) ........................................................................................................ 336<br />
Redevelopment Agency............................................................................................................................ 346<br />
Redevelopment Agency Housing Set-Aside Fund.................................................................................... 296<br />
Sewer Enterprise....................................................................................................................................... 331<br />
State Gas Tax Fund .................................................................................................................................. 294<br />
Storm Water Management........................................................................................................................ 301<br />
Street Lighting Maintenance District ......................................................................................................... 297<br />
Workers’ Compensation............................................................................................................................ 334<br />
363
CITY OF CONCORD<br />
2007-2008 ANNUAL OPERATING BUDGET<br />
VOLUME I<br />
DEPARTMENTAL FUNDING BY SOURCE INDEX<br />
Building, Engineering & Neighborhood Services ........................................................................................ 66<br />
<strong>City</strong> Attorney................................................................................................................................................ 67<br />
<strong>City</strong> Management ........................................................................................................................................ 68<br />
Community & Recreation Services ............................................................................................................. 69<br />
Diablo Creek Golf Course ........................................................................................................................... 77<br />
Finance ....................................................................................................................................................... 70<br />
Human Resources ...................................................................................................................................... 71<br />
Information Technology............................................................................................................................... 72<br />
Planning and Economic Development ........................................................................................................ 73<br />
Police Department....................................................................................................................................... 74<br />
Public Works ............................................................................................................................................... 75<br />
Sewer Enterprise......................................................................................................................................... 78<br />
Storm Water Management.......................................................................................................................... 76<br />
364
CITY OF CONCORD<br />
2007-2008 ANNUAL OPERATING BUDGET<br />
VOLUME I<br />
GENERAL INDEX<br />
Accounting Basis......................................................................................................................................... 59<br />
Administrative Services & <strong>City</strong> Clerk......................................................................................................... 117<br />
Annual Appropriation Limit.......................................................................................................................... 40<br />
Assessed & Estimated Value <strong>of</strong> All Property .............................................................................................. 57<br />
Authorized Full-time Positions by Classification within Department ......................................................... 349<br />
Authorized Part-time Hours by Classification within Department ............................................................. 355<br />
Benefits Administration ............................................................................................................................. 173<br />
Budget Appropriation Transfer Controls ..................................................................................................... 32<br />
Budget Calendar ......................................................................................................................................... 27<br />
Budget & Financial Planning..................................................................................................................... 154<br />
Budget & Fiscal Policies.............................................................................................................................. 36<br />
Budget Message .........................................................................................................................................viii<br />
Budget Preparation Directive ...................................................................................................................... 24<br />
Building, Engineering & Neighborhood Services – Services, Accomplishments, Initiatives....................... 81<br />
Building, Engineering & Neighborhood Services – Administration ............................................................. 86<br />
Building, Engineering & Neighborhood Services – CIP/TIP Engineering Support ..................................... 94<br />
Building Maintenance................................................................................................................................ 284<br />
Building Division.......................................................................................................................................... 95<br />
Business Development ............................................................................................................................. 210<br />
Camp <strong>Concord</strong> .......................................................................................................................................... 132<br />
Capital Project Funds – Definition............................................................................................................. 311<br />
Capital Projects Descriptions .................................................................................................................... 320<br />
Capital Projects Operating and Maintenance Costs ................................................................................. 325<br />
Central Contra Costa Sanitary District ...................................................................................................... 254<br />
Certificates <strong>of</strong> Participation ....................................................................................................................... 307<br />
<strong>City</strong> Attorney – Services, Accomplishments, Initiatives ............................................................................ 101<br />
<strong>City</strong> Attorney.............................................................................................................................................. 104<br />
<strong>City</strong> Council Services ................................................................................................................................ 112<br />
<strong>City</strong> Management – Services, Accomplishments, Initiatives..................................................................... 107<br />
<strong>City</strong> Management ...................................................................................................................................... 114<br />
<strong>City</strong> Organization and Functions Charts ....................................................................................................... 1<br />
<strong>City</strong> Treasury............................................................................................................................................. 158<br />
<strong>City</strong>-wide Street Light District.................................................................................................................... 262<br />
Classification and Compensation.............................................................................................................. 177<br />
Community & Recreation Services- Services, Accomplishments, Initiatives............................................ 125<br />
Community & Recreation Services-Administration ................................................................................... 130<br />
Community Relations ................................................................................................................................ 116<br />
Community Services ................................................................................................................................. 141<br />
Comparative Summary – Full-Time Positions............................................................................................. 14<br />
Construction ................................................................................................................................................ 92<br />
Contributors............................................................................................................................................... 370<br />
Corporate Goals............................................................................................................................................vi<br />
Curbs, Gutters, and Sidewalk Maintenance.............................................................................................. 276<br />
Current Development.................................................................................................................................. 88<br />
Custodial Services .................................................................................................................................... 286<br />
Database Systems and Programming ...................................................................................................... 192<br />
Debt Service Funds – Definition ............................................................................................................... 303<br />
Debt Service Requirements ...................................................................................................................... 304<br />
365
CITY OF CONCORD<br />
2007-2008 ANNUAL OPERATING BUDGET<br />
VOLUME I<br />
GENERAL INDEX<br />
Demographics ............................................................................................................................................. 20<br />
Design ......................................................................................................................................................... 90<br />
Desktop Services ...................................................................................................................................... 189<br />
Diablo Creek Golf Course – Administration .............................................................................................. 143<br />
Diablo Creek Golf Course – Operations ................................................................................................... 144<br />
Diablo Creek Golf Course – Revenues and Expenses............................................................................. 328<br />
Direct and Overlapping Bonded Debt ....................................................................................................... 309<br />
Disbursements .......................................................................................................................................... 152<br />
Drainage Management.............................................................................................................................. 266<br />
Economic Development – Administration ................................................................................................. 208<br />
Elections.................................................................................................................................................... 119<br />
Enterprise Funds – Definition.................................................................................................................... 327<br />
Expenditure Summary by Fund .................................................................................................................. 64<br />
Facility Operations & Programs ................................................................................................................ 134<br />
Fiduciary Funds Definition......................................................................................................................... 343<br />
Finance – Services, Accomplishments, Initiatives .................................................................................... 145<br />
Finance – Administration........................................................................................................................... 149<br />
Finance Miscellaneous Payments ............................................................................................................ 162<br />
Financial Analysis & Reporting ................................................................................................................. 150<br />
Fleet Maintenance Operations.................................................................................................................. 337<br />
Fleet Maintenance Replacement .............................................................................................................. 338<br />
Fleet Management .................................................................................................................................... 270<br />
Franchise Management ............................................................................................................................ 123<br />
Fund Balance Summary by Fund ............................................................................................................... 62<br />
Fund Structure ............................................................................................................................................ 60<br />
General Fund Expenditures by Program – Ten Year ................................................................................. 47<br />
General Fund Expenditure Summary by Program...................................................................................... 43<br />
General Fund Revenues by Source – Ten Year......................................................................................... 51<br />
General Fund Revenues by Source - Graph .............................................................................................. 53<br />
General Fund Reserve Funds..................................................................................................................... 54<br />
Geographic Information Services.............................................................................................................. 194<br />
Glossary <strong>of</strong> Terms..................................................................................................................................... 357<br />
Graffiti Removal ........................................................................................................................................ 288<br />
History <strong>of</strong> <strong>Concord</strong> ...................................................................................................................................... 17<br />
Housing & Community Services Special Revenue Funds ........................................................................ 295<br />
Housing ..................................................................................................................................................... 214<br />
Human Resources – Services, Accomplishments, Initiatives................................................................... 163<br />
Human Resources- Employee Relations.................................................................................................. 167<br />
Information Technology – Services, Accomplishments, Initiatives ........................................................... 179<br />
Information Technology – Administration.................................................................................................. 184<br />
Information Technology – Replacement ................................................................................................... 340<br />
Internal Service Funds – Definition ........................................................................................................... 333<br />
Jurisdictional Comparison........................................................................................................................... 23<br />
366
CITY OF CONCORD<br />
2007-2008 ANNUAL OPERATING BUDGET<br />
VOLUME I<br />
GENERAL INDEX<br />
Landscape Maintenance........................................................................................................................... 282<br />
Lease Management .................................................................................................................................. 290<br />
Legal Debt Margin....................................................................................................................................... 40<br />
Liability Fund ............................................................................................................................................. 335<br />
Map ............................................................................................................................................................. 15<br />
Mission Statement.........................................................................................................................................iv<br />
Multi-Family Housing Inspection Program .................................................................................................. 97<br />
Neighborhood Preservation Program ......................................................................................................... 99<br />
Network Systems ...................................................................................................................................... 185<br />
On the Cover............................................................................................................................................... 18<br />
Operating Budgets – General & Enterprise Funds ..................................................................................... 80<br />
Operating Expenditures Summary by Organization ................................................................................... 65<br />
Organizational Training and Development................................................................................................ 175<br />
Organizational Values................................................................................................................................... v<br />
Parks Services .......................................................................................................................................... 278<br />
Planning .................................................................................................................................................... 206<br />
Planning & Economic Development – Services, Accomplishments, Initiatives ........................................ 197<br />
Planning & Economic Development – Administration............................................................................... 204<br />
Police Department – Office <strong>of</strong> the Chief <strong>of</strong> Police..................................................................................... 223<br />
Police Department – Services, Accomplishments, Initiatives ................................................................... 217<br />
Police Department – Administration Services........................................................................................... 225<br />
Police Department – Field Operations ...................................................................................................... 228<br />
Police Department – Support Operations ................................................................................................. 230<br />
Printing Services ....................................................................................................................................... 121<br />
Program Structure....................................................................................................................................... 59<br />
Public Works – Services, Accomplishments, Initiatives............................................................................ 233<br />
Public Works – Administration .................................................................................................................. 248<br />
Purchasing & Materials Management ....................................................................................................... 156<br />
Recruitment and Selection........................................................................................................................ 169<br />
Redevelopment Agency............................................................................................................................ 345<br />
Redevelopment ......................................................................................................................................... 212<br />
Resolution Adopting Municipal Budget ....................................................................................................... 29<br />
Retirement Fund-<strong>City</strong> <strong>of</strong> <strong>Concord</strong> ............................................................................................................. 344<br />
Revenue Bonds......................................................................................................................................... 306<br />
Revenue Generation ................................................................................................................................. 160<br />
Revenue Summary by Fund ....................................................................................................................... 63<br />
Risk Management ..................................................................................................................................... 171<br />
Senior & Special Recreation Services ...................................................................................................... 139<br />
Sewer Collection Systems ........................................................................................................................ 252<br />
Sewer Enterprise – Revenues & Expenses.............................................................................................. 330<br />
Sewer Enterprise Pump Station ............................................................................................................... 250<br />
Special Assessment Districts Debt ........................................................................................................... 308<br />
Special Revenue Funds – Definition......................................................................................................... 291<br />
Sports & Events ........................................................................................................................................ 136<br />
367
CITY OF CONCORD<br />
2007-2008 ANNUAL OPERATING BUDGET<br />
VOLUME I<br />
GENERAL INDEX<br />
Statistics...................................................................................................................................................... 19<br />
Storm Water Management - Administration.............................................................................................. 264<br />
Street Cleaning ......................................................................................................................................... 268<br />
Street Maintenance ................................................................................................................................... 274<br />
Street Trees, Medians, and Open Space.................................................................................................. 280<br />
Summary <strong>of</strong> Population, General Fund Adopted Budgets & Net Assessed Values................................... 56<br />
Tax Allocation Bonds ................................................................................................................................ 305<br />
Tax Rates Summary ................................................................................................................................... 58<br />
Technology Training.................................................................................................................................. 191<br />
Telecommunications ................................................................................................................................. 187<br />
Traffic Operations...................................................................................................................................... 258<br />
Traffic Signals & Street Lighting................................................................................................................ 260<br />
Transportation – Administration ................................................................................................................ 255<br />
Transportation Planning............................................................................................................................ 256<br />
Transportation Signs & Markings.............................................................................................................. 272<br />
Vision for the Future......................................................................................................................................iv<br />
Youth and Family Services ....................................................................................................................... 137<br />
368
CITY OF CONCORD<br />
2007-2008 ANNUAL OPERATING BUDGET<br />
VOLUME I<br />
GRAPH INDEX<br />
Assessed and Estimated Value <strong>of</strong> all Property........................................................................................... 57<br />
Demographic Statistics ............................................................................................................................... 22<br />
General Fund-Capital Expenditures by Department................................................................................. 323<br />
General Fund-Comparison <strong>of</strong> Expenditures by Department....................................................................... 46<br />
General Fund-Operating & Capital Expenditures by Department............................................................... 42<br />
General Fund Revenue-Comparison <strong>of</strong> Revenue by Source ..................................................................... 53<br />
General Fund Revenue-Comparison <strong>of</strong> Tax Revenue by Source .............................................................. 50<br />
General Fund & Enterprises-Budgeted Capital & Operating Expenditures ................................................ 79<br />
Golf Course-Revenues and Expenses...................................................................................................... 328<br />
Major General Fund Tax Revenue by Type-Actual and Projected ............................................................. 49<br />
Property Tax Levies and Collections ........................................................................................................ 310<br />
Redevelopment Agency-Comparison <strong>of</strong> Operating Revenue to Operating Expense............................... 347<br />
Sewer Enterprise-Revenues and Expenses ............................................................................................. 330<br />
Special Assessment-Billings and Collections ........................................................................................... 308<br />
369
Contributors<br />
The FY 2007-08 Operating Budget and 10-Year Plans would not have been possible without the<br />
encouragement and assistance <strong>of</strong> many people throughout the <strong>City</strong> <strong>of</strong> <strong>Concord</strong>. Following are the names<br />
<strong>of</strong> those who contributed their time and skill to the budget development.<br />
Most <strong>of</strong> the people named here contributed directly to the development <strong>of</strong> the budget by providing<br />
program budget information, answering questions, fact checking, reviewing drafts, or approving the<br />
budget. Others kept computers running, or provided secretarial and administrative assistance.<br />
The list <strong>of</strong> more than 72 contributors proves the wealth <strong>of</strong> knowledge and experience at the <strong>City</strong> <strong>of</strong><br />
<strong>Concord</strong>. To each <strong>of</strong> you the <strong>City</strong> <strong>of</strong> <strong>Concord</strong> gives thanks. We also thank any others who may have<br />
contributed to the FY 2007-08 Operating Budget and 10-Year Plans but whose names were unknown to<br />
us.<br />
Helen Allen<br />
Leslye Asera<br />
Alton Baxley<br />
Helen Bean<br />
Anita Bell-Karno<br />
Mark Boehme<br />
Brad Boyd<br />
Ron Buck<br />
Mario Camorongan<br />
Joan Carrico<br />
Michael Chavez<br />
Lawrence Chiu<br />
Sherry Christian<br />
Avis Connolly<br />
Paul Crain<br />
Cinthya DePaz<br />
Mark Deven<br />
Avais Dinga<br />
Peter Dragovich<br />
Lydia E. Du Borg<br />
Lana Fisher<br />
Jim Forsberg<br />
Charla Freckman<br />
Danea Gemmell<br />
Bruce Good<br />
Trish Hammett<br />
Rebecca Heathcock<br />
Debby Herman<br />
Sandi Hildreth<br />
Amy Hodgett<br />
Laura M. H<strong>of</strong>fmeister<br />
Abul Hossain<br />
Teri House<br />
Lisa Jardine<br />
Qamar Khan<br />
Craig Labadie<br />
370<br />
Mary Rae Lehman<br />
Margaret Lefebvre<br />
Evelyn Leung<br />
David Livingston<br />
Linda Lorenzetti<br />
Raymond Mar<br />
Suzanne McDonald<br />
Mary Miller<br />
John Montagh<br />
Cheryl Owens<br />
Marla Parada<br />
Alex Pascual<br />
Mike Pease<br />
Mark Peterson<br />
Vance Phillips<br />
Ron Puccinelli<br />
Deborah Raines<br />
John Rego<br />
Charles Rickenbacher<br />
Christopher Roke<br />
Cherie Rosenquist<br />
Jeff Roubal<br />
Stuart Roloson<br />
Derek Schweigart<br />
Bill Shinn<br />
Daniel Siri<br />
Cecilia Skuza<br />
Ron Smith<br />
Bruce Stanley<br />
Callie Foster Struggs<br />
Craig Tanner<br />
Michelle Tellez<br />
Steve Voorhies<br />
Thomas Wentling<br />
Marilyn Wilburn<br />
Dee Ziegelman