Chapter 16--Properties of Stars
Chapter 16--Properties of Stars
Chapter 16--Properties of Stars

You also want an ePaper? Increase the reach of your titles
YUMPU automatically turns print PDFs into web optimized ePapers that Google loves.
orbit). In an eclipsing binary, we measure the time between<br />
eclipses. In a spectroscopic binary, we measure the time it<br />
takes the spectral lines to shift back and forth.<br />
Determining the average separation <strong>of</strong> the stars in a<br />
binary system is usually much more difficult. Except in rare<br />
cases in which we can measure the separation directly, we can<br />
calculate the separation only if we know the actual orbital<br />
speeds <strong>of</strong> the stars from their Doppler shifts. Unfortunately,<br />
a Doppler shift tells us only the portion <strong>of</strong> a star’s velocity<br />
that is directly toward us or away from us [Section 6.5].Because<br />
orbiting stars generally do not move directly along<br />
our line <strong>of</strong> sight, their actual velocities can be significantly<br />
greater than those we measure through the Doppler effect.<br />
The exceptions are eclipsing binary stars. Because these<br />
stars orbit in the plane <strong>of</strong> our line <strong>of</strong> sight, their Doppler<br />
shifts can tell us their true orbital velocities.* Eclipsing<br />
binaries are therefore particularly important to the study<br />
<strong>of</strong> stellar masses. As an added bonus, eclipsing binaries<br />
allow us to measure stellar radii directly. Because we know<br />
how fast the stars are moving across our line <strong>of</strong> sight as one<br />
eclipses the other, we can determine their radii by timing<br />
how long each eclipse lasts.<br />
Suppose two orbiting stars are moving in a plane perpendicular<br />
to our line <strong>of</strong> sight. Would the spectral features <strong>of</strong> these stars<br />
appear shifted in any way? Explain.<br />
astronomyplace.com<br />
The Hertzsprung–Russell Diagram Tutorial, Lessons 1–3<br />
<strong>16</strong>.5 The Hertzsprung–Russell<br />
Diagram<br />
During the first decade <strong>of</strong> the twentieth century, a similar<br />
thought occurred independently to astronomers Ejnar Hertzsprung,<br />
working in Denmark, and Henry Norris Russell,<br />
working in the United States at Princeton University: Each<br />
decided to make a graph plotting stellar luminosities on one<br />
axis and spectral types on the other. Such graphs are now<br />
called Hertzsprung–Russell (H–R) diagrams.Soon after<br />
they began making their graphs, Hertzsprung and Russell<br />
uncovered some previously unsuspected patterns in the properties<br />
<strong>of</strong> stars. As we will see shortly, understanding these<br />
patterns and the H–R diagram is central to the study <strong>of</strong> stars.<br />
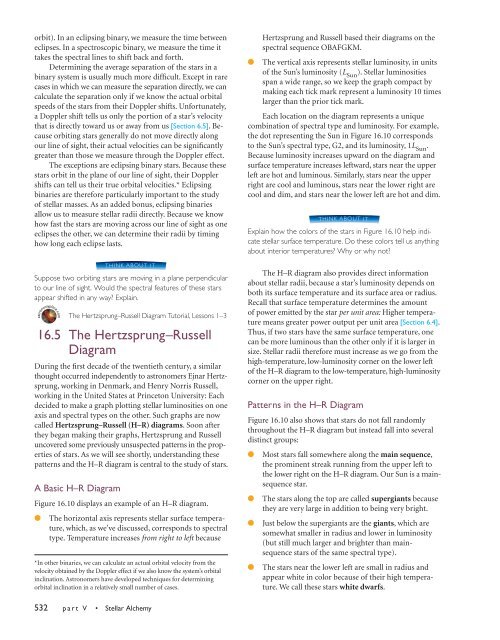
A Basic H–R Diagram<br />
THINK ABOUT IT<br />
Figure <strong>16</strong>.10 displays an example <strong>of</strong> an H–R diagram.<br />
● The horizontal axis represents stellar surface temperature,<br />
which, as we’ve discussed, corresponds to spectral<br />
type. Temperature increases from right to left because<br />
*In other binaries, we can calculate an actual orbital velocity from the<br />
velocity obtained by the Doppler effect if we also know the system’s orbital<br />
inclination. Astronomers have developed techniques for determining<br />
orbital inclination in a relatively small number <strong>of</strong> cases.<br />
532 part V • Stellar Alchemy<br />
Hertzsprung and Russell based their diagrams on the<br />
spectral sequence OBAFGKM.<br />
● The vertical axis represents stellar luminosity, in units<br />
<strong>of</strong> the Sun’s luminosity (LSun ). Stellar luminosities<br />
span a wide range, so we keep the graph compact by<br />
making each tick mark represent a luminosity 10 times<br />
larger than the prior tick mark.<br />
Each location on the diagram represents a unique<br />
combination <strong>of</strong> spectral type and luminosity. For example,<br />
the dot representing the Sun in Figure <strong>16</strong>.10 corresponds<br />
to the Sun’s spectral type, G2, and its luminosity, 1LSun .<br />
Because luminosity increases upward on the diagram and<br />
surface temperature increases leftward, stars near the upper<br />
left are hot and luminous. Similarly, stars near the upper<br />
right are cool and luminous, stars near the lower right are<br />
cool and dim, and stars near the lower left are hot and dim.<br />
THINK ABOUT IT<br />
Explain how the colors <strong>of</strong> the stars in Figure <strong>16</strong>.10 help indicate<br />
stellar surface temperature. Do these colors tell us anything<br />
about interior temperatures? Why or why not?<br />
The H–R diagram also provides direct information<br />
about stellar radii, because a star’s luminosity depends on<br />
both its surface temperature and its surface area or radius.<br />
Recall that surface temperature determines the amount<br />
<strong>of</strong> power emitted by the star per unit area: Higher temperature<br />
means greater power output per unit area [Section 6.4].<br />
Thus, if two stars have the same surface temperature, one<br />
can be more luminous than the other only if it is larger in<br />
size. Stellar radii therefore must increase as we go from the<br />
high-temperature, low-luminosity corner on the lower left<br />
<strong>of</strong> the H–R diagram to the low-temperature, high-luminosity<br />
corner on the upper right.<br />
Patterns in the H–R Diagram<br />
Figure <strong>16</strong>.10 also shows that stars do not fall randomly<br />
throughout the H–R diagram but instead fall into several<br />
distinct groups:<br />
● Most stars fall somewhere along the main sequence,<br />
the prominent streak running from the upper left to<br />
the lower right on the H–R diagram. Our Sun is a mainsequence<br />
star.<br />
● The stars along the top are called supergiants because<br />
they are very large in addition to being very bright.<br />
● Just below the supergiants are the giants,which are<br />
somewhat smaller in radius and lower in luminosity<br />
(but still much larger and brighter than mainsequence<br />
stars <strong>of</strong> the same spectral type).<br />
● The stars near the lower left are small in radius and<br />
appear white in color because <strong>of</strong> their high temperature.<br />
We call these stars white dwarfs.