Accepted Papers - 3.pdf - UNESCO
Accepted Papers - 3.pdf - UNESCO
Accepted Papers - 3.pdf - UNESCO

You also want an ePaper? Increase the reach of your titles
YUMPU automatically turns print PDFs into web optimized ePapers that Google loves.
end of 80’s building of Roghun’s HPS was started<br />
with volume of reservoir more than 13 km 3 and a<br />
number of other HPS with reservoirs.<br />
Arising now in the world ideas practically<br />
synonymously value possible in perspective changes<br />
of climate. It is connected with degradation of<br />
glaciers, drying up of Aral Sea and forming of salt<br />
winds, spreading right up to Pamir’s mountains<br />
cutting off woods, erosion of river banks etc. In this<br />
case the valuation hesitates from moderate –<br />
pessimistic up to apocalyptic.<br />
Unfortunately all these are weakly confirmed<br />
by actual materials. The systematical observations<br />
on glaciers in republic are not carried out since 1986<br />
yet and as it is shown above the point of view about<br />
their sharp restriction are not based enough. There<br />
is not any data on salt wind. The connection of<br />
another analogical factor with climate is not<br />
unambiguous.<br />
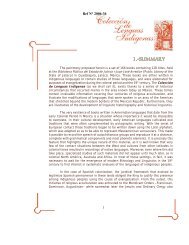
change of temperature, 0 С<br />
scenario 1<br />
scenario 3<br />
1<br />
3<br />
2,5<br />
2<br />
1,5<br />
1<br />
0,5<br />
In these conditions it is necessary use of many<br />
– factor mathematical models for obtaining<br />
objective and reliable valuation of climate changes.<br />
We have for models scenarios of climate change<br />
now developed by west specialists: 1. CCC – EQ;<br />
2. UK – TR; 3. GFDL – model of geophysical hydro<br />
dynamic laboratory of USA; 4. Had CM2 – model<br />
of United Kingdom.<br />
All these are based on accounting of emission<br />
influence of green gases and gives valuation of<br />
climate change on main parameters – temperature<br />
of surrounds and atmosphere precipitation to the<br />
end of 50 – year’s period. Their very big difference<br />
from each other can be noted.<br />
In general view matrix of climate change on all<br />
four scenarios as a whole for republic, but for<br />
difference periods of year is sown in table 1 and<br />
fig. 1.<br />
Matrixes have analogical view for other zones of<br />
Table 1. Matrix of climate change for different scenarios<br />
Scenario Change of temperatures Change of precipitation<br />
year winter summer year winter summer<br />
1 2,6 3,0 2,3 -4,0 1,0 -8,9<br />
2 2,5 2,5 2,5 4,8 2,1 7,6<br />
3 2,0 1,9 2,1 -1,9 2,4 -6,3<br />
4 1,9 1,8 1,9 17,1 16,0 18,2<br />
scenario 2<br />
0<br />
-10 -5 0 5 10 15 20<br />
change of quantity raining, mm/year<br />
Fig. 1 : Diapason of the climate changes on various scenarios<br />
467<br />
scenario 4