Accepted Papers - 3.pdf - UNESCO
Accepted Papers - 3.pdf - UNESCO
Accepted Papers - 3.pdf - UNESCO

Create successful ePaper yourself
Turn your PDF publications into a flip-book with our unique Google optimized e-Paper software.
the determination of specification for the (a) storage<br />
capacity, (b) shape, (c) dimensions (top bottom,<br />
depth, side slope), (d) inlet, and (e) outlet.<br />
The monthly mean pan evaporation data<br />
obtained from the Ranichauri meteorological<br />
observatory was multiplied with a factor 0.7 to get<br />
pond surface area and evaporation (Duggal and<br />
Soni, 1996). The volume of the water evaporated<br />
from the surface of the pond was determined by<br />
multiplying the corrected evaporation with the<br />
average surface area of the pond. 10% of storage<br />
capacity was kept as provisions for the loss in<br />
storage capacity due to siltation.<br />
ii) Irrigation System Based on Very Low<br />
Discharge Spring / Stream<br />
It has been found that low discharge springs<br />
and streams having discharge between 1 to 10 lpm<br />
are very common in hills and they are either<br />
unutilized or grossly under utilized for irrigation<br />
because of a high proportion of application loss due<br />
to low discharge. If the cost of storage tank is low,<br />
this discharge can be stored in tanks and used when<br />
required at a reasonably low cost.<br />
The first and for most components in design<br />
of any irrigation system is the determination of total<br />
irrigation requirement. Since vegetable cultivation<br />
is the most profitable, in the region under irrigation<br />
conditions, only vegetable rotation was considered<br />
for this system. The analysis showed that irrigation<br />
was required during two seasons: (a). autumn<br />
(October to December), and (b). summer (late March<br />
to early June). Since these two irrigation seasons<br />
are preceded by wet season i.e. rainy and winter,<br />
the discharge during this period is surplus and goes<br />
waste. If the water is carried over to deficit season<br />
by storing, the command area can be increased.<br />
RESULTS AND DISCUSSION<br />
Hydrological Analysis<br />
Rainfall : Rainfall data of Ranichauri for the years<br />
1988 to 2002 were analyzed. The maximum annual<br />
rainfall value during the period of study was found<br />
to be 1840 mm in 1998 and the minimum was 719<br />
mm in 2001. The maximum seasonal rainfall during<br />
monsoon season was 1061 mm in 1995 and<br />
minimum 367 in 2001. The highest rainfall was<br />
found in the month of August and lowest rainfall<br />
was in the month of November. The highest value<br />
of weekly rainfall was observed in the 33 th standard<br />
meteorological week and 43 rd had lowest rainfall in<br />
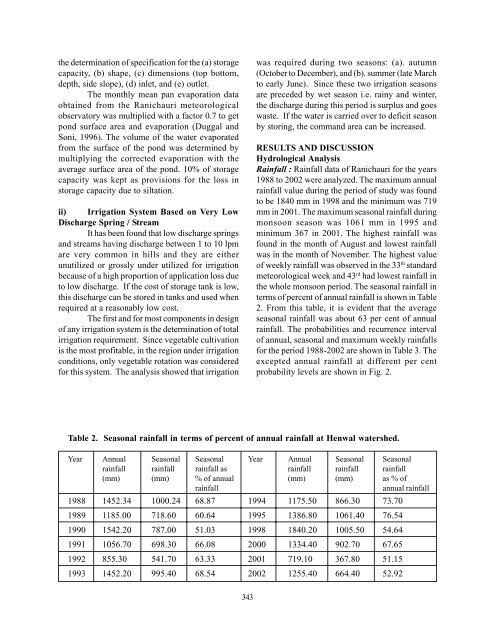
the whole monsoon period. The seasonal rainfall in<br />
terms of percent of annual rainfall is shown in Table<br />
2. From this table, it is evident that the average<br />
seasonal rainfall was about 63 per cent of annual<br />
rainfall. The probabilities and recurrence interval<br />
of annual, seasonal and maximum weekly rainfalls<br />
for the period 1988-2002 are shown in Table 3. The<br />
excepted annual rainfall at different per cent<br />
probability levels are shown in Fig. 2.<br />
Table 2. Seasonal rainfall in terms of percent of annual rainfall at Henwal watershed.<br />
Year Annual Seasonal Seasonal Year Annual Seasonal Seasonal<br />
rainfall rainfall rainfall as rainfall rainfall rainfall<br />
(mm) (mm) % of annual (mm) (mm) as % of<br />
rainfall annual rainfall<br />
1988 1452.34 1000.24 68.87 1994 1175.50 866.30 73.70<br />
1989 1185.00 718.60 60.64 1995 1386.80 1061.40 76.54<br />
1990 1542.20 787.00 51.03 1998 1840.20 1005.50 54.64<br />
1991 1056.70 698.30 66.08 2000 1334.40 902.70 67.65<br />
1992 855.30 541.70 63.33 2001 719.10 367.80 51.15<br />
1993 1452.20 995.40 68.54 2002 1255.40 664.40 52.92<br />
343