Copie de publication index juillet.indd - Blanc Bleu Belge
Copie de publication index juillet.indd - Blanc Bleu Belge
Copie de publication index juillet.indd - Blanc Bleu Belge

You also want an ePaper? Increase the reach of your titles
YUMPU automatically turns print PDFs into web optimized ePapers that Google loves.
Interpretation of the in<strong>de</strong>xes<br />
The breeding values obtained from the genetic evaluation procedure are expressed into the unit measure of<br />
the trait. To facilitate the use of those results, they are converted in a standardised in<strong>de</strong>x with an average of<br />
100 and a standard <strong>de</strong>viation of 10. Their interpretation is the following: an in<strong>de</strong>x value of 100 indicates that<br />
the sire belongs to the average population for this trait. An in<strong>de</strong>x higher than 100 indicates that the animal<br />
is higher than the average population. That does not always mean “better”: it <strong>de</strong>pends on the trait (eg:<br />
<strong>de</strong>fects, mortality…).<br />
The notion of standard <strong>de</strong>viation allows to locate the animal in the population for a particular trait: 68 % of the<br />
evaluated animals have an in<strong>de</strong>x between 90 and 110. And 95 % have an in<strong>de</strong>x between 80 and 120. An in<strong>de</strong>x<br />
higher than 120 indicates that the animal is amongst the 2,5 % best animals of the population for that trait.<br />
The calculated in<strong>de</strong>x in the genetic evaluations is only an estimation of the “true” genetic value of an animal.<br />
That’s why each in<strong>de</strong>x is associated with a precision (<strong>de</strong>termination coefficient or R 2 ), which indicates the<br />
confi<strong>de</strong>nce we can have in the in<strong>de</strong>x.<br />
Remind that, a prediction error (Er Pred) is associated with a given precision (Table below).<br />
R² Er Pred R² Er Pred R² Er Pred<br />
0,50 7,07 0,80 4,47 0,97 1,73<br />
0,60 6,32 0,90 3,16 0,98 1,41<br />
0,70 5,48 0,95 2,24 0,99 1,00<br />
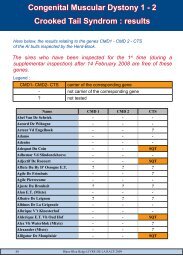
How to read the tables ?<br />
The first table (pedigree) summarizes the name of the sire, the birthdate, his AI station, his father and the grand<br />
mother’s father. The next tables go about zootechnical and functional in<strong>de</strong>xes from the Progeny test (1 st and<br />
2 nd visits). Each line corresponds to a sire. The given information are: the sire’s i<strong>de</strong>ntification, his first visit<br />
in<strong>de</strong>xes, his second visit in<strong>de</strong>xes and their reliability. The last table presents the Linear score in<strong>de</strong>xes.<br />
A sire is present in the list if he has minimum one reliable in<strong>de</strong>x. However, if publishing criteria’s are not<br />
fulfilled for one in<strong>de</strong>x (lack of data), the square is empty.<br />
In the table relating to the linear score, the in<strong>de</strong>xes can be:<br />
- double un<strong>de</strong>rlined, indicating a reliability higher than 90 %, eg : 100<br />
- once un<strong>de</strong>rlined, indicating a reliability between 80 and 90 %, eg : 100<br />
- not un<strong>de</strong>rlined, indicating a reliability lower than 80 %, eg : 100<br />
To assess the sire’s position for each trait separately colour co<strong>de</strong>s are used. Here is their signification:<br />
In<strong>de</strong>x<br />
strongly improver for this trait min. 20 points above / below the average<br />
improver for this trait 10 to 19 points above / below the average<br />
in the average for this trait 0 to 9 points above / below the average<br />
unfavourable for this trait 10 to 19 points above / below the average<br />
strongly unfavourable for this trait min. 20 points above / below the average