National Wetland Atlas: Gujarat - Ministry of Environment and Forests
National Wetland Atlas: Gujarat - Ministry of Environment and Forests
National Wetland Atlas: Gujarat - Ministry of Environment and Forests

You also want an ePaper? Increase the reach of your titles
YUMPU automatically turns print PDFs into web optimized ePapers that Google loves.
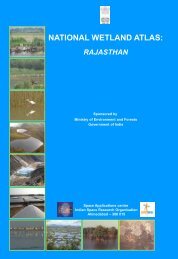
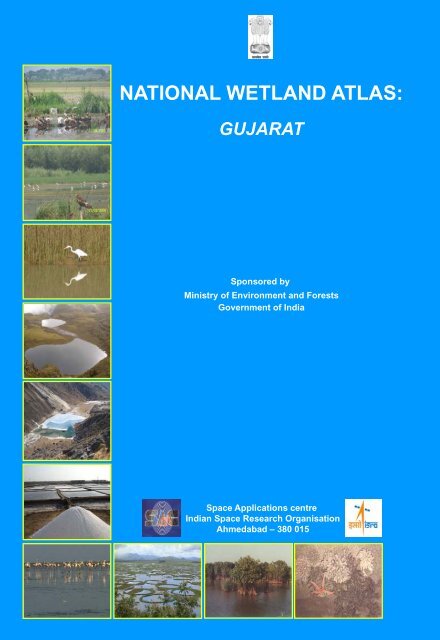
NATIONAL WETLAND ATLAS:<br />
GUJARAT<br />
Sponsored by<br />
<strong>Ministry</strong> <strong>of</strong> <strong>Environment</strong> <strong>and</strong> <strong>Forests</strong><br />
Government <strong>of</strong> India<br />
Space Applications centre<br />
Indian Space Research Organisation<br />
Ahmedabad – 380 015
This publication deals with the updated database <strong>and</strong><br />
status <strong>of</strong> wetl<strong>and</strong>s, compiled in <strong>Atlas</strong> format. Increasing<br />
concern about how our wetl<strong>and</strong>s are being influenced has<br />
led to formulation <strong>of</strong> a project entitled “<strong>National</strong> <strong>Wetl<strong>and</strong></strong><br />
Inventory <strong>and</strong> Assessment (NWIA)” to create an updated<br />
database <strong>of</strong> the wetl<strong>and</strong>s <strong>of</strong> India. The wetl<strong>and</strong>s are<br />
categorised under 19 classes <strong>and</strong> mapped using satellite<br />
remote sensing data from Indian Remote Sensing<br />
Satellite: IRS P6- LISS III sensor. The results are<br />
organised at 1: 50, 000 scales at district, state <strong>and</strong><br />
topographic map sheet (Survey <strong>of</strong> India reference) level<br />
using Geographic Information System (GIS). This<br />
publication is a part <strong>of</strong> this national work <strong>and</strong> deals with<br />
the wetl<strong>and</strong> status <strong>of</strong> a particular State/Union Territory <strong>of</strong><br />
India, through text, statistical tables, satellite images,<br />
maps <strong>and</strong> ground photographs.<br />
The atlas comprises wetl<strong>and</strong> information arranged into<br />
nine sections. How the NWIA project work has been<br />
executed highlighted in the first six sections viz:<br />
Introduction, NWIA project, Study area, Data used,<br />
Methodology, <strong>and</strong> Accuracy. This is the first time that high<br />
resolution digital remote sensing data has been used to<br />
map <strong>and</strong> decipher the status <strong>of</strong> the wetl<strong>and</strong>s at national<br />
scale. The methodology highlights how the four spectral<br />
b<strong>and</strong>s <strong>of</strong> LISS III data (green, red, near infra red <strong>and</strong> short<br />
wave infra red) have been used to derive various indices<br />
<strong>and</strong> decipher information regarding water spread,<br />
turbidity <strong>and</strong> aquatic vegetation. Since, the aim was to<br />
generate a GIS compatible database, details <strong>of</strong> the<br />
st<strong>and</strong>ards <strong>of</strong> database are also highlighted in the<br />
methodology.<br />
The results <strong>and</strong> finding are organised in three sections;<br />
viz: Maps <strong>and</strong> Statistics, Major wetl<strong>and</strong> types, <strong>and</strong><br />
Important <strong>Wetl<strong>and</strong></strong>s <strong>of</strong> the area. The Maps <strong>and</strong> Statistics<br />
are shown for state <strong>and</strong> district level. It gives details <strong>of</strong><br />
what type <strong>of</strong> wetl<strong>and</strong>s exists in the area, how many<br />
numbers in each type, their area estimates in hectare.<br />
Since, the hydrology <strong>of</strong> wetl<strong>and</strong>s are influenced by<br />
monsoon performance, extent <strong>of</strong> water spread <strong>and</strong> their<br />
turbidity (qualitative) in wet <strong>and</strong> dry season (postmonsoon<br />
<strong>and</strong> pre-monsoon period) are also given.<br />
Similarly the status <strong>of</strong> aquatic vegetation (mainly floating<br />
<strong>and</strong> emergent types) in two seasons is also accounted for.<br />
Status <strong>of</strong> small wetl<strong>and</strong>s are also accounted as numbers<br />
<strong>and</strong> depicted in maps as points. <strong>Wetl<strong>and</strong></strong> map also show<br />
important ancillary information like roads/rail, relevant<br />
habitations. False Colour Composite (FCC) <strong>of</strong> the satellite<br />
image used (any one season) is shown along with the<br />
derived wetl<strong>and</strong> map to give a feeling <strong>of</strong> manifestation <strong>of</strong><br />
wetl<strong>and</strong>s in remote sensing data <strong>and</strong> synoptic view <strong>of</strong> the<br />
area. The status <strong>of</strong> some <strong>of</strong> the important wetl<strong>and</strong>s like<br />
Ramsar sites, <strong>National</strong> Parks are shown with recent field<br />
photographs.<br />
For further details contact:<br />
Director,<br />
Space Applications Centre, ISRO,<br />
Ambawadi Vistar (P.O.)<br />
Ahmedabad – 380 015<br />
director@sac.isro.gov.in
<strong>Atlas</strong> SAC/RESA/AFEG/NWIA/ATLAS/21/2010<br />
NATIONAL WETLAND ATLAS<br />
GUJARAT<br />
Sponsored by<br />
<strong>Ministry</strong> <strong>of</strong> <strong>Environment</strong> <strong>and</strong> <strong>Forests</strong>, Government <strong>of</strong> India<br />
As a part <strong>of</strong> the project on <strong>National</strong> <strong>Wetl<strong>and</strong></strong> Inventory <strong>and</strong> Assessment (NWIA)<br />
Space Applications Centre (ISRO), Ahmedabad<br />
<strong>and</strong><br />
Bhaskaracharya Institute for Space Applications <strong>and</strong> Geo-informatics(BISAG), G<strong>and</strong>hinagar<br />
May 2010
First Publication: May 2010, Space Applications Centre (ISRO), Ahmedabad<br />
Copyright: 2010, SAC, ISRO<br />
This publication may be produced in whole or in part <strong>and</strong> in any form for education or non-pr<strong>of</strong>it uses,<br />
without special permission from the copyright holder, provided acknowledgement <strong>of</strong> source is made.<br />
SAC will appreciate a copy <strong>of</strong> any publication which uses this publication as a source.<br />
Citation: <strong>National</strong> <strong>Wetl<strong>and</strong></strong> <strong>Atlas</strong>: <strong>Gujarat</strong>, SAC/RESA/AFEG/NWIA/ATLAS/21/2010 Space Applications Centre<br />
(ISRO), Ahmedabad, India, 198p.<br />
Available from: Space Applications Centre, ISRO, Ahmedabad – 380 015, India<br />
Production: SAC, Ahmedabad <strong>and</strong> BISAG, G<strong>and</strong>hinagar carried out the work, Sponsored by <strong>Ministry</strong> <strong>of</strong> <strong>Environment</strong><br />
<strong>and</strong> <strong>Forests</strong>, Govt. <strong>of</strong> India.
MESSAGE<br />
It gives me great pleasure to introduce this <strong>Atlas</strong>, the latest in a series, prepared by Space Applications<br />
Centre, Ahmedabad in connection with the <strong>National</strong> <strong>Wetl<strong>and</strong></strong> Inventory <strong>and</strong> Assessment Project.<br />
This <strong>Atlas</strong> maps <strong>and</strong> catalogues information on <strong>Wetl<strong>and</strong></strong>s across India using the latest in satellite imaging,<br />
one <strong>of</strong> the first <strong>of</strong> its kind. <strong>Wetl<strong>and</strong></strong>s are areas <strong>of</strong> l<strong>and</strong> critical ecological significance that support a large<br />
variety <strong>of</strong> plant <strong>and</strong> animal species adapted to fluctuating water levels. Their identification <strong>and</strong> protection<br />
becomes very important.<br />
Utility-wise, wetl<strong>and</strong>s directly <strong>and</strong> indirectly support millions <strong>of</strong> people in providing services such as food,<br />
fiber <strong>and</strong> raw materials. They play important roles in storm <strong>and</strong> flood control, in supply <strong>of</strong> clean water, along<br />
with other educational <strong>and</strong> recreational benefits. Despite these benefits, wetl<strong>and</strong>s are the first target <strong>of</strong><br />
human interference <strong>and</strong> are among the most threatened <strong>of</strong> all natural resources. Around 50% <strong>of</strong> the<br />
earth’s wetl<strong>and</strong>s are estimated to already have disappeared worldwide over the last hundred years through<br />
conversion to industrial, agricultural <strong>and</strong> residential purposes. Even in current scenario, when the<br />
ecosystem services provided by wetl<strong>and</strong>s are better understood - degradation <strong>and</strong> conversion <strong>of</strong> wetl<strong>and</strong>s<br />
continues.<br />
Aware <strong>of</strong> their importance, the Government <strong>of</strong> India has formulated several policies <strong>and</strong> plans for the<br />
conservation <strong>and</strong> preservation <strong>of</strong> these crucial ecosystems. Realising the need <strong>of</strong> an updated geospatial<br />
data base <strong>of</strong> these natural resources as the pre-requisite for management <strong>and</strong> conservation planning,<br />
<strong>National</strong> <strong>Wetl<strong>and</strong></strong> Inventory <strong>and</strong> Assessment (NWIA) project was formulated as a joint vision <strong>of</strong> <strong>Ministry</strong> <strong>of</strong><br />
<strong>Environment</strong> & Forestry, Govt. India, <strong>and</strong> Space Applications Centre (ISRO). I am told that the latest<br />
remote sensing data from Indian Remote Sensing satellite (IRS P6) have been used to map the wetl<strong>and</strong>s.<br />
The present atlas is part <strong>of</strong> this project <strong>and</strong> highlights the results <strong>of</strong> the study state in terms <strong>of</strong> statistics <strong>of</strong><br />
various types <strong>of</strong> wetl<strong>and</strong>s, extent <strong>of</strong> water, aquatic vegetation <strong>and</strong> turbidity in pre <strong>and</strong> post monsoon period.<br />
I also note that special efforts are made to provide detailed information <strong>of</strong> important wetl<strong>and</strong>s like Ramsar<br />
sites, <strong>National</strong> Parks etc.<br />
I am certain that this <strong>Atlas</strong> will raise the bar in developing such database <strong>and</strong> will be <strong>of</strong> great use for<br />
researchers, planners, policy makers, <strong>and</strong> also members <strong>of</strong> the general public.
<strong>Wetl<strong>and</strong></strong>s defined as areas <strong>of</strong> l<strong>and</strong> that are either temporarily or permanently covered by water exhibit<br />
enormous diversity according to their genesis, geographical location, water regime <strong>and</strong> chemistry. <strong>Wetl<strong>and</strong></strong>s<br />
are one <strong>of</strong> the most productive ecosystems <strong>and</strong> play crucial role in hydrological cycle. Utility wise, wetl<strong>and</strong>s<br />
directly <strong>and</strong> indirectly support millions <strong>of</strong> people in providing services such as storm <strong>and</strong> flood control, clean<br />
water supply, food, fiber <strong>and</strong> raw materials, scenic beauty, educational <strong>and</strong> recreational benefits. The<br />
Millennium Ecosystem Assessment estimates conservatively that wetl<strong>and</strong>s cover seven percent <strong>of</strong> the earth’s<br />
surface <strong>and</strong> deliver 45% <strong>of</strong> the world’s natural productivity <strong>and</strong> ecosystem services. However, the very<br />
existence <strong>of</strong> these unique resources is under threat due to developmental activities, <strong>and</strong> population pressure.<br />
This calls for a long term planning for preservation <strong>and</strong> conservation <strong>of</strong> these resources. An updated <strong>and</strong><br />
accurate database that will support research <strong>and</strong> decision is the first step towards this. Use <strong>of</strong> advanced<br />
techniques like Satellite remote sensing, Geographic Information System (GIS) is now essential for accurate<br />
<strong>and</strong> timely spatial database <strong>of</strong> large areas. Space Applications Centre (ISRO) took up this challenging task<br />
under the project “NWIA” (<strong>National</strong> <strong>Wetl<strong>and</strong></strong> Inventory <strong>and</strong> Assessment) sponsored by <strong>Ministry</strong> <strong>of</strong><br />
<strong>Environment</strong> & <strong>Forests</strong>. To account for numerous small yet important wetl<strong>and</strong>s found in the country, mapping<br />
at 1:50,000 scales has been taken up. Two date IRS LISS III data acquired during pre <strong>and</strong> post monsoon<br />
season are used for inventory to account for wet <strong>and</strong> dry season hydrology <strong>of</strong> wetl<strong>and</strong>s. The map outputs<br />
include the status <strong>of</strong> water spread, aquatic vegetation <strong>and</strong> turbidity. Ancillary layers like road/rail, habitations<br />
are also created. Very small wetl<strong>and</strong>s below the mappable unit are also identified <strong>and</strong> shown points. The<br />
results are complied as <strong>Atlas</strong>es <strong>of</strong> wetl<strong>and</strong>s for states/Union Territories <strong>of</strong> India. This <strong>Atlas</strong> highlights results<br />
for a particular state/UT <strong>and</strong> hopes to improve our underst<strong>and</strong>ing <strong>of</strong> the dynamics <strong>and</strong> distribution <strong>of</strong> wetl<strong>and</strong>s<br />
<strong>and</strong> their status in the area.<br />
I congratulate the team for bringing out this informative atlas <strong>and</strong> sincerely hope that this will serve as a<br />
useful source <strong>of</strong> information to researchers, planners <strong>and</strong> general public.<br />
January 25, 2010<br />
FOREWORD
ACKNOWLEDGEMENTS<br />
The project “<strong>National</strong> <strong>Wetl<strong>and</strong></strong> Inventory & Assessment (NWIA)” is sponsored by <strong>Ministry</strong> <strong>of</strong> <strong>Environment</strong> & Forestry (MoEF),<br />
Govt. <strong>of</strong> India. We are grateful to Dr. Ranganath R. Navalgund, Director, Space Applications Centre, for his encouragement<br />
to take up this challenging task <strong>and</strong> formulation <strong>of</strong> the project team for execution <strong>of</strong> the project. Earnest thanks are also due<br />
to Dr. Jai Singh Parihar, Dy. Director, Remote Sensing Applications Area, Space Applications Centre, for providing overall<br />
guidance <strong>and</strong> support to the project. The present <strong>Atlas</strong> for the state <strong>of</strong> <strong>Gujarat</strong> is a part <strong>of</strong> the “<strong>National</strong> <strong>Wetl<strong>and</strong></strong> <strong>Atlas</strong>”. We<br />
are thankful to Shri T P Singh, Director, BISAG, G<strong>and</strong>hinagar for the support <strong>and</strong> guidance provided in carrying out the work<br />
for the state <strong>of</strong> <strong>Gujarat</strong>..<br />
This project has benefited from the wisdom <strong>of</strong> many people. It is a pleasure to acknowledge the contributions made by the<br />
wetl<strong>and</strong> experts especially to Pr<strong>of</strong>. C.K. Varshney, Former Dean, School <strong>of</strong> <strong>Environment</strong>al Sciences, Jawaharlal Nehru<br />
University, New Delhi, Pr<strong>of</strong>. A.R. Yousuf, The University <strong>of</strong> Kashmir, Srinagar, Pr<strong>of</strong>. Pradeeep Shrivastava, Head, <strong>Wetl<strong>and</strong></strong><br />
Research Centre, Barakatullah University, Bhopal, Dr. Prikshit Gautam, Director, WWF-India, Dr. S. Narendra Prasad, Salim<br />
Ali Centre for Ornithology <strong>and</strong> Nature, Coimbtore <strong>and</strong> Dr. R.K. Suri, Additional Director, <strong>Ministry</strong> <strong>of</strong> <strong>Environment</strong> <strong>and</strong> <strong>Forests</strong>,<br />
Govt. <strong>of</strong> India, New Delhi, <strong>and</strong> the database experts from ISRO who participated in the peer Review meeting to finalise the<br />
“<strong>Wetl<strong>and</strong></strong> Classification System” followed in this project.<br />
We acknowledge the positive role played by 16 th<br />
SC-B (St<strong>and</strong>ing Committee on Bioresources <strong>and</strong> <strong>Environment</strong>) <strong>of</strong> NNRMS<br />
(<strong>National</strong> Natural Resources Management System) meeting in formulating this project. We are extremely thankful to the<br />
members <strong>of</strong> the” Steering Committee” <strong>of</strong> the project, under the chairmanship <strong>of</strong> Dr E J James, Director – Water Institute,<br />
Karunya University, for their periodical review, critical comments <strong>and</strong> appreciation <strong>of</strong> the efforts by the project team. We are<br />
thankful to SC-B under the chairmanship <strong>of</strong> Secretary, MoEF, for periodic review <strong>of</strong> the progress <strong>of</strong> the project <strong>and</strong> guidance<br />
towards timely completion <strong>of</strong> the work. We acknowledge the valuable contributions made by Dr J K Garg, the then scientist<br />
<strong>of</strong> SAC for his active role in formulation <strong>of</strong> this project, co-authoring the procedure manual document.<br />
We are grateful to Dr G V Subramanyam, Adviser, MoEF, Dr Jag Ram, Director, MoEF for their very active <strong>and</strong> positive role<br />
for implementation <strong>of</strong> the project. We are thankful to Dr Harendra Kharwal, MoEF for his support for budget related issues.<br />
We acknowledge the support received from Dr P S Roy, Dy Director, NRSC <strong>and</strong> Dr S Sudhakar, Head, LRD, NRSC in terms<br />
<strong>of</strong> valuable suggestions <strong>and</strong> providing the geo-referenced image <strong>of</strong> NRC-LU&LC project for use as master image in this<br />
project. We are thankful to the “Technical Review” team <strong>of</strong> SAC for critical comments <strong>and</strong> suggestion to finalise the <strong>Atlas</strong>.<br />
We thank Dr R D Shah, Mr Pragnesh Kumar Vaishnav <strong>and</strong> Ms Yatisha P Vaishnav, Geology Department, M G Science<br />
Institute, Ahmedabad for their support in finalization <strong>of</strong> GIS database. The team members acknowledge the support received<br />
from the staff <strong>of</strong> computer lab, <strong>and</strong> colleagues at SAC <strong>and</strong> BISAG during implementation <strong>of</strong> the project.
Space Applications Centre, ISRO, Ahmedabad<br />
Dr T. S. Singh<br />
Shri J. G. Patel<br />
Shri T. V. R. Murthy<br />
PROJECT TEAM<br />
Project Director: Dr. Sushma Panigrahy<br />
Bhaskaracharya Institute for Space Applications <strong>and</strong> Geo-informatics(BISAG), G<strong>and</strong>hinagar<br />
Shri Vijay Singh<br />
Shri Ajay N. Patel<br />
Shri Khalid Mehmood<br />
Shri Navnit C. Patel<br />
Dr. Mahesh B. Chodvadiya<br />
Shri Apurva P. Dalwadi<br />
Shri Jaydipsingh C. Kathota
1.0 INTRODUCTION<br />
1.1 <strong>Wetl<strong>and</strong></strong>s<br />
1.2 Mapping <strong>and</strong> Geospatial Technique<br />
1.3 <strong>Wetl<strong>and</strong></strong> Inventory <strong>of</strong> India<br />
CONTENTS<br />
2.0 NATIONAL WETLAND INVENTORY AND ASSESSMENT<br />
2.1 <strong>Wetl<strong>and</strong></strong> Classification System<br />
2.2 Spatial framework <strong>and</strong> GIS database contents<br />
3.0 STUDY AREA<br />
3.1 Physiography <strong>and</strong> Surface Drainage<br />
3.2 Geology<br />
3.3 Climate<br />
3.4 Important <strong>Wetl<strong>and</strong></strong>s<br />
4.0 DATA USED<br />
4.1 Remote sensing data<br />
4.2 Ground truth data<br />
4.3 Other data<br />
5.0 METHODOLOGY<br />
5.1 Creation <strong>of</strong> Spatial Framework<br />
5.2 Geo-referencing <strong>of</strong> Satellite Data<br />
5.3 Mapping <strong>of</strong> <strong>Wetl<strong>and</strong></strong>s<br />
5.4 Conversion <strong>of</strong> Raster (indices) into a Vector Layer<br />
5.5 Generation <strong>of</strong> Reference Layers<br />
5.6 Coding <strong>and</strong> Attribute Scheme<br />
5.7 Map Composition <strong>and</strong> Output<br />
6.0 ACCURACY ASSESSMENT<br />
6.1 Data Verification <strong>and</strong> Quality Assurance <strong>of</strong> Output Digital Data Files<br />
7.0 WETLANDS OF GUJARAT: MAPS AND STATISTICS<br />
7.1 DISTRICT-WISE WETLAND MAPS AND STATISTICS<br />
7.1.1 Kachchh<br />
7.1.2 Banas Kantha<br />
7.1.3 Patan<br />
7.1.4 Mahesana<br />
7.1.5 Sabar Kantha<br />
7.1.6 G<strong>and</strong>hinagar<br />
7.1.7 Ahmedabad<br />
7.1.8 Surendranagar<br />
7.1.9 Rajkot<br />
7.1.10 Jamnagar<br />
7.1.11 Porb<strong>and</strong>ar<br />
7.1.12 Junagadh<br />
7.1.13 Amreli<br />
7.1.14 Bhavnagar<br />
7.1.15 An<strong>and</strong><br />
7.1.16 Kheda<br />
7.1.17 Panch Mahals<br />
7.1.18 Dohad<br />
7.1.19 Vadodara<br />
7.1.20 Narmada<br />
7.1.21 Bharuch<br />
7.1.22 Surat<br />
7.1.23 The Dangs<br />
7.1.24 Navsari<br />
7.1.25 Valsad
8.0 MAJOR WETLAND TYPES OF GUJARAT<br />
9.0 IMPORTANT WETLANDS OF GUJARAT<br />
9.1 Nal Sarover<br />
9.2 Thol Lake<br />
9.3 Southern Gulf <strong>of</strong> Kachchh<br />
9.4 Gulf <strong>of</strong> Khambhat<br />
9.5 Jamnagar Mangroves<br />
9.6 Coral Reefs <strong>of</strong> Gulf <strong>of</strong> Kachchh<br />
9.7 Dharoi Reservoir<br />
9.8 Ukai Reservoir<br />
9.9 Kerly Lagoon<br />
REFERENCES<br />
Annexure–I: Definitions <strong>of</strong> wetl<strong>and</strong> categories used in the project.<br />
Annexure–II: Details <strong>of</strong> district information followed in the atlas<br />
List <strong>of</strong> Figures<br />
Figure 1: Spectral Signature <strong>of</strong> various targets<br />
Figure 2: Various l<strong>and</strong> features as they appear in four spectral b<strong>and</strong>s <strong>and</strong> in a typical three<br />
b<strong>and</strong> FCC<br />
Figure 3: Location map<br />
Figure 4: Spatial framework <strong>of</strong> <strong>Gujarat</strong><br />
Figure 5: IRS P6 LISS-III coverage <strong>of</strong> <strong>Gujarat</strong><br />
Figure 6: IRS LISS-III FCC (Post-monsoon <strong>and</strong> Pre-monsoon), Part <strong>of</strong> <strong>Gujarat</strong> state<br />
Figure 7: Flow chart <strong>of</strong> the methodology used<br />
Figure 8: Steps in the extraction <strong>of</strong> wetl<strong>and</strong> components<br />
Figure 9: Various combinations <strong>of</strong> the indices/spectral b<strong>and</strong>s used to identify wetl<strong>and</strong> components<br />
Figure 10: Type-wise wetl<strong>and</strong> distribution in <strong>Gujarat</strong><br />
Figure 11: District-wise wetl<strong>and</strong> distribution<br />
List <strong>of</strong> Tables<br />
Table 1: <strong>Wetl<strong>and</strong></strong> Classification System <strong>and</strong> coding<br />
Table-2: Satellite data used<br />
Table 3: Qualitative turbidity ratings<br />
Table 4: Area estimates <strong>of</strong> wetl<strong>and</strong>s in <strong>Gujarat</strong><br />
Table-5: District-wise wetl<strong>and</strong> area<br />
Table 6: Area estimates <strong>of</strong> wetl<strong>and</strong>s in Kachchh<br />
Table 7: Area estimates <strong>of</strong> wetl<strong>and</strong>s in Banas Kantha<br />
Table 8: Area estimates <strong>of</strong> wetl<strong>and</strong>s in Patan<br />
Table 9: Area estimates <strong>of</strong> wetl<strong>and</strong>s in Mehsana<br />
Table 10: Area estimates <strong>of</strong> wetl<strong>and</strong>s in Sabar Kantha<br />
Table 11: Area estimates <strong>of</strong> wetl<strong>and</strong>s in G<strong>and</strong>hinagar<br />
Table 12: Area estimates <strong>of</strong> wetl<strong>and</strong>s in Ahmedabad<br />
Table 13: Area estimates <strong>of</strong> wetl<strong>and</strong>s in Surendranagar<br />
Table 14: Area estimates <strong>of</strong> wetl<strong>and</strong>s in Rajkot<br />
Table 15: Area estimates <strong>of</strong> wetl<strong>and</strong>s in Jamnagar<br />
Table 16: Area estimates <strong>of</strong> wetl<strong>and</strong>s in Porb<strong>and</strong>ar<br />
Table 17: Area estimates <strong>of</strong> wetl<strong>and</strong>s in Junagadh<br />
Table 18: Area estimates <strong>of</strong> wetl<strong>and</strong>s in Amreli<br />
Table 19: Area estimates <strong>of</strong> wetl<strong>and</strong>s in Bhavnagar<br />
Table 20: Area estimates <strong>of</strong> wetl<strong>and</strong>s in An<strong>and</strong><br />
Table 21: Area estimates <strong>of</strong> wetl<strong>and</strong>s in Kheda<br />
Table 22: Area estimates <strong>of</strong> wetl<strong>and</strong>s in Panch Mahals<br />
Table 23: Area estimates <strong>of</strong> wetl<strong>and</strong>s in Dohad<br />
Table 24: Area estimates <strong>of</strong> wetl<strong>and</strong>s in Vadodara<br />
Table 25: Area estimates <strong>of</strong> wetl<strong>and</strong>s in Narmada<br />
Table 26: Area estimates <strong>of</strong> wetl<strong>and</strong>s in Bharuch<br />
Table 27: Area estimates <strong>of</strong> wetl<strong>and</strong>s in Surat
Table 28: Area estimates <strong>of</strong> wetl<strong>and</strong>s in The Dangs<br />
Table 29: Area estimates <strong>of</strong> wetl<strong>and</strong>s in Navsari<br />
Table 30: Area estimates <strong>of</strong> wetl<strong>and</strong>s in Valsad<br />
List <strong>of</strong> Plates<br />
Plate 1: Major wetl<strong>and</strong> types <strong>of</strong> <strong>Gujarat</strong><br />
Plate-2a, 2b, 2c <strong>and</strong> 2d : Field photographs <strong>and</strong> ground truth data <strong>of</strong> wetl<strong>and</strong> types in <strong>Gujarat</strong><br />
Plate 3 : Nal Sarover<br />
Plate 4 : <strong>Wetl<strong>and</strong></strong> map - 5 km buffer area <strong>of</strong> Nal Sarover<br />
Plate 5 : Nal Sarover as seen on IRS P6 LISS-III image with 5 km buffer area<br />
Plate 6 : Thol Lake<br />
Plate 7 : <strong>Wetl<strong>and</strong></strong> map - 5 km buffer area <strong>of</strong> Thol Lake<br />
Plate 8 : Thol Lake as seen on IRS P6 LISS-III image with 5 km buffer area<br />
Plate 9: Gulf <strong>of</strong> Kachchh<br />
Plate 10: <strong>Wetl<strong>and</strong></strong> map - 5 km buffer area <strong>of</strong> Southern Gulf <strong>of</strong> Kachchh<br />
Plate 11: Gulf <strong>of</strong> Kachchh as seen on IRS P6 LISS-III image with 5 km buffer area<br />
Plate 12: Gulf <strong>of</strong> Khambhat<br />
Plate 13: <strong>Wetl<strong>and</strong></strong> map - 5 km buffer area <strong>of</strong> Gulf <strong>of</strong> Khambhat<br />
Plate 14: Gulf <strong>of</strong> Khambhat as seen on IRS P6 LISS-III image with 5 km buffer area<br />
Plate 15: Jamnagar Mangroves<br />
Plate 16: <strong>Wetl<strong>and</strong></strong> map - 5 km buffer area <strong>of</strong> Jamnagar Mangroves<br />
Plate 17: Jamnagar Mangroves as seen on IRS P6 LISS-III image with 5 km buffer area<br />
Plate 18: Coral Reefs <strong>of</strong> Gulf <strong>of</strong> Kachchh<br />
Plate 19: <strong>Wetl<strong>and</strong></strong> map - 5 km buffer area <strong>of</strong> Coral Reefs <strong>of</strong> Gulf <strong>of</strong> Kachchh<br />
Plate 20: Coral Reefs <strong>of</strong> Gulf <strong>of</strong> Kachchh as seen on IRS P6 LISS-III image with 5 km buffer area<br />
Plate 21 : Dharoi Reservoir<br />
Plate 22: <strong>Wetl<strong>and</strong></strong> map - 5 km buffer area <strong>of</strong> Dharoi Reservoir<br />
Plate 23: Dharoi Reservoir as seen on IRS P6 LISS-III image with 5 km buffer area<br />
Plate 24: Ukai Reservoir<br />
Plate 25: <strong>Wetl<strong>and</strong></strong> map - 5 km buffer area <strong>of</strong> Ukai Reservoir<br />
Plate 26: Ukai Reservoir as seen on IRS P6 LISS-III image with 5 km buffer area<br />
Plate 27: Kerly Lagoon<br />
Plate 28: <strong>Wetl<strong>and</strong></strong> map - 5 km buffer area <strong>of</strong> Kerly Lagoon<br />
Plate 29: Kerly Lagoon as seen on IRS P6 LISS-III image with 5 km buffer area
1.0 INTRODUCTION<br />
It is increasingly realized that the planet earth is facing grave environmental problems with fast depleting<br />
natural resources <strong>and</strong> threatening the very existence <strong>of</strong> most <strong>of</strong> the ecosystems. Serious concerns are voiced<br />
among scientists, planners, sociologists, politicians, <strong>and</strong> economists to conserve <strong>and</strong> preserve the natural<br />
resources <strong>of</strong> the world. One <strong>of</strong> the constraints most frequently faced for decision making is lack <strong>of</strong> scientific<br />
data <strong>of</strong> our natural resources. Often the data are sparse or unauthentic, rarely in the form <strong>of</strong> geospatial<br />
database (map), thus open to challenges. Hence, the current emphasis <strong>of</strong> every country is to have an<br />
appropriate geospatial database <strong>of</strong> natural resources based on unambiguous scientific methods. The wetl<strong>and</strong><br />
atlas <strong>of</strong> <strong>Gujarat</strong>, which is part <strong>of</strong> the <strong>National</strong> <strong>Wetl<strong>and</strong></strong> <strong>Atlas</strong> <strong>of</strong> India, is an attempt in this direction.<br />
1.1 <strong>Wetl<strong>and</strong></strong>s<br />
<strong>Wetl<strong>and</strong></strong>s are one <strong>of</strong> the crucial natural resources. <strong>Wetl<strong>and</strong></strong>s are areas <strong>of</strong> l<strong>and</strong> that are either temporarily or<br />
permanently covered by water. This means that a wetl<strong>and</strong> is neither truly aquatic nor terrestrial; it is possible<br />
that wetl<strong>and</strong>s can be both at the same time depending on seasonal variability. Thus, wetl<strong>and</strong>s exhibit<br />
enormous diversity according to their genesis, geographical location, water regime <strong>and</strong> chemistry, dominant<br />
plants <strong>and</strong> soil or sediment characteristics. Because <strong>of</strong> their transitional nature, the boundaries <strong>of</strong> wetl<strong>and</strong>s<br />
are <strong>of</strong>ten difficult to define. <strong>Wetl<strong>and</strong></strong>s do, however, share a few attributes common to all forms. Of these,<br />
hydrological structure (the dynamics <strong>of</strong> water supply, throughput, storage <strong>and</strong> loss) is most fundamental to<br />
the nature <strong>of</strong> a wetl<strong>and</strong> system. It is the presence <strong>of</strong> water for a significant period <strong>of</strong> time which is principally<br />
responsible for the development <strong>of</strong> a wetl<strong>and</strong>. One <strong>of</strong> the first widely used classifications systems, devised by<br />
Cowardin et al, 1979, was associated to its hydrological, ecological <strong>and</strong> geological aspects, such as: marine<br />
(coastal wetl<strong>and</strong>s including rock shores <strong>and</strong> coral reefs, estuarine (including deltas, tidal marshes, <strong>and</strong><br />
mangrove swamps), lacustarine (lakes), riverine (along rivers <strong>and</strong> streams), palustarine ('marshy'- marshes,<br />
swamps <strong>and</strong> bogs). Given these characteristics, wetl<strong>and</strong>s support a large variety <strong>of</strong> plant <strong>and</strong> animal species<br />
adapted to fluctuating water levels, making the wetl<strong>and</strong>s <strong>of</strong> critical ecological significance. Utility wise,<br />
wetl<strong>and</strong>s directly <strong>and</strong> indirectly support millions <strong>of</strong> people in providing services such as food, fiber <strong>and</strong> raw<br />
materials, storm <strong>and</strong> flood control, clean water supply, scenic beauty <strong>and</strong> educational <strong>and</strong> recreational<br />
benefits. The Millennium Ecosystem Assessment estimates conservatively that wetl<strong>and</strong>s cover seven percent<br />
<strong>of</strong> the earth’s surface <strong>and</strong> deliver 45% <strong>of</strong> the world’s natural productivity <strong>and</strong> ecosystem services <strong>of</strong> which the<br />
benefits are estimated at $20 trillion a year (Source: www.MAweb.org). The Millennium Assessment (MA)<br />
uses the following typology to categorise ecosystem services:<br />
Provisioning services: The resources or products provided by ecosystems, such as food, raw materials<br />
(wood), genetic resources, medicinal resources, ornamental resources (skin, shells, flowers).<br />
Regulating services: Ecosystems maintain the essential ecological processes <strong>and</strong> life support systems, like<br />
gas <strong>and</strong> climate regulation, water supply <strong>and</strong> regulation, waste treatment, pollination, etc.<br />
Cultural <strong>and</strong> Amenity services: Ecosystems are a source <strong>of</strong> inspiration to human culture <strong>and</strong> education<br />
throughout recreation, cultural, artistic, spiritual <strong>and</strong> historic information, Science <strong>and</strong> education.<br />
Supporting services: Ecosystems provide habitat for flora <strong>and</strong> fauna in order to maintain biological <strong>and</strong><br />
genetic diversity.<br />
Despite these benefits, wetl<strong>and</strong>s are the first target <strong>of</strong> human interference <strong>and</strong> are among the most<br />
threatened <strong>of</strong> all natural resources. Around 50% <strong>of</strong> the earth’s wetl<strong>and</strong> area is estimated to already have<br />
disappeared over the last hundred years through conversion to industrial, agricultural <strong>and</strong> residential<br />
developments. Even in current scenario, when the ecosystem services provided by wetl<strong>and</strong>s are better<br />
understood - degradation <strong>and</strong> conversion <strong>of</strong> wetl<strong>and</strong>s continues. This is largely due to the fact that the<br />
‘full value’ <strong>of</strong> ecosystem functions is <strong>of</strong>ten ignored in policy-making, plans <strong>and</strong> corporate evaluations <strong>of</strong><br />
development projects.<br />
1.2 Mapping <strong>and</strong> Geospatial Technique<br />
To conserve <strong>and</strong> manage wetl<strong>and</strong> resources, it is important to have inventory <strong>of</strong> wetl<strong>and</strong>s <strong>and</strong> their<br />
catchments. The ability to store <strong>and</strong> analyse the data is essential. Digital maps are very powerful tools to<br />
achieve this. Maps relate the feature to any given geographical location has a strong visual impact. Thus<br />
maps are essential for monitoring <strong>and</strong> quantifying change over time scale, assist in decision making.<br />
The technique used in the preparation <strong>of</strong> map started with ground survey. The Survey <strong>of</strong> India (SOI)<br />
topographical maps are the earliest true maps <strong>of</strong> India showing various l<strong>and</strong> use/cover classes including<br />
wetl<strong>and</strong>s. Recent years have seen advances in mapping technique to prepare maps with much more<br />
information. Of particular importance is the remote sensing <strong>and</strong> geographic information system (GIS)<br />
1
technique. Remote sensing is now recognised as an essential tool for viewing, analyzing, characterizing, <strong>and</strong><br />
making decisions about l<strong>and</strong>, water <strong>and</strong> atmospheric components.<br />
From a general perspective, remote sensing is the science <strong>of</strong> acquiring <strong>and</strong> analyzing information about<br />
objects or phenomena from a distance (Jensen, 1986; Lilles<strong>and</strong> <strong>and</strong> Keifer, 1987). Today, satellite remote<br />
sensing can be defined as the use <strong>of</strong> satellite borne sensors to observe, measure, <strong>and</strong> record the<br />
electromagnetic radiation (EMR) reflected or emitted by the earth <strong>and</strong> its environment for subsequent analysis<br />
<strong>and</strong> extraction <strong>of</strong> information. EMR sensors includes visible light, near-, mid- <strong>and</strong> far-infrared (thermal),<br />
microwave, <strong>and</strong> long-wave radio energy. The capability <strong>of</strong> multiple sources <strong>of</strong> information is unique to<br />
remote sensing. Of specific advantage is the spectral, temporal, <strong>and</strong> spatial resolution. Spectral resolution<br />
refers to the width or range <strong>of</strong> each spectral b<strong>and</strong> being recorded. Since each target affects different<br />
wavelengths <strong>of</strong> incident energy differently, they are absorbed, reflected or transmitted in different proportions.<br />
Currently, there are many l<strong>and</strong> resource remote sensing satellites that have sensors operating in the green,<br />
red, near infrared <strong>and</strong> short wave Infra red regions <strong>of</strong> the electromagnetic spectrum giving a definite spectral<br />
signature <strong>of</strong> various targets due to difference in radiation absorption <strong>and</strong> reflectance <strong>of</strong> targets. These<br />
sensors are <strong>of</strong> common use for l<strong>and</strong> cover studies, including wetl<strong>and</strong>s. Figure 1 shows typical spectral<br />
signature <strong>of</strong> few targets from green to SWIR region. Converted to image, in a typical false colour composite<br />
(FCC) created using NIR, red <strong>and</strong> green b<strong>and</strong>s assigned as red, green <strong>and</strong> blue colour, the features become<br />
very distinct as shown in Figure 2. In FCC, the vegetation thus appears invariably red (due to high reflection<br />
in NIR from green leaves).<br />
Since the early 1960s, several satellites with suitable sensors have been launched into orbit to observe <strong>and</strong><br />
monitor the earth <strong>and</strong> its environment. Most early satellite sensors acquired data for meteorological purposes.<br />
The advent <strong>of</strong> earth resources satellite sensors (those with a primary objective <strong>of</strong> mapping <strong>and</strong> monitoring<br />
l<strong>and</strong> cover) occurred, when the first L<strong>and</strong>sat satellite was launched in July 1972. Currently, more than a<br />
dozen orbiting satellites <strong>of</strong> various types provide data crucial to improving our knowledge <strong>of</strong> the earth’s<br />
atmosphere, oceans, ice <strong>and</strong> snow, <strong>and</strong> l<strong>and</strong>. Of particular interest to India is the indigenous series <strong>of</strong><br />
satellites called Indian Remote Sensing satellites (IRS-Series). Since the launch <strong>of</strong> the first satellite IRS 1A in<br />
1987, India has now a number <strong>of</strong> satellites providing data in multi-spectral b<strong>and</strong>s with different spatial<br />
resolution. IRS P6/RESOURCESAT 1 is the current generation satellite that provides multi-spectral images in<br />
spatial resolution <strong>of</strong> 5.8 m (LISS IV), 23.5 m (LISS III) <strong>and</strong> 56m (AWiFS). Over the past few decades, Indian<br />
remote sensing data has been successfully used in various fields <strong>of</strong> natural resources (Navalgund et al,<br />
2002).<br />
Development <strong>of</strong> technologies like Geographic Information System (GIS) has enhanced the use <strong>of</strong> RS data to<br />
obtain accurate geospatial database. GIS specialises in h<strong>and</strong>ling related, spatially referenced data, combining<br />
mapped information with other data <strong>and</strong> acts as analytical tool for research <strong>and</strong> decision making. During the<br />
past few decades, technological advances in the field <strong>of</strong> satellite remote sensing (RS) sensors, computerized<br />
mapping techniques, global positioning system (GPS) <strong>and</strong> geographic information system (GIS) has<br />
enhanced the ability to capture more detailed <strong>and</strong> timely information about the natural resources at various<br />
scales catering to local, regional, national <strong>and</strong> global level study.<br />
Figure 1: Spectral Signature <strong>of</strong> various targets<br />
2
GREEN RED<br />
IRS LISS-III FCC<br />
NIR SWIR<br />
Figure 2: Various l<strong>and</strong> features as they appear in four spectral b<strong>and</strong>s <strong>and</strong> in a typical three b<strong>and</strong> FCC<br />
3
1.3 <strong>Wetl<strong>and</strong></strong> Inventory <strong>of</strong> India<br />
India with its large geographical spread supports large <strong>and</strong> diverse wetl<strong>and</strong> classes, some <strong>of</strong> which are<br />
unique. <strong>Wetl<strong>and</strong></strong>s, variously estimated to be occupying 1-5 per cent <strong>of</strong> geographical area <strong>of</strong> the country,<br />
support about a fifth <strong>of</strong> the known biodiversity. Like any other place in the world, there is a looming threat to<br />
the aquatic biodiversity <strong>of</strong> the Indian wetl<strong>and</strong>s as they are <strong>of</strong>ten under a regime <strong>of</strong> unsustainable human<br />
pressures. Sustainable management <strong>of</strong> these assets therefore is highly relevant. Realising this, Govt. <strong>of</strong> India<br />
has initiated many appropriate steps in terms <strong>of</strong> policies, programmes <strong>and</strong> plans for the preservation <strong>and</strong><br />
conservation <strong>of</strong> these ecosystems. India is a signatory to the Ramsar Convention for management <strong>of</strong><br />
wetl<strong>and</strong>, for conserving their biodiversity <strong>and</strong> wise use extending its scope to a wide variety <strong>of</strong> habitats,<br />
including rivers <strong>and</strong> lakes, coastal lagoons, mangroves, peat-l<strong>and</strong>s, coral reefs, <strong>and</strong> numerous human-made<br />
wetl<strong>and</strong>, such as fish <strong>and</strong> shrimp ponds, farm ponds, irrigated agricultural l<strong>and</strong>, salt pans reservoirs, gravel<br />
pits, sewage farms, <strong>and</strong> canals. The <strong>Ministry</strong> <strong>of</strong> <strong>Environment</strong> <strong>and</strong> <strong>Forests</strong> has identified a number <strong>of</strong> wetl<strong>and</strong>s<br />
for conservation <strong>and</strong> management under the <strong>National</strong> <strong>Wetl<strong>and</strong></strong> Conservation Programme <strong>and</strong> some financial<br />
assistance is being provided to State Governments for various conservation activities through approval <strong>of</strong> the<br />
Management Action Plans. The need to have an updated map database <strong>of</strong> wetl<strong>and</strong>s that will support such<br />
actions has long been realized.<br />
Mapping requires a st<strong>and</strong>ard classification system. Though there are many classification systems for<br />
wetl<strong>and</strong>s in the world, the Ramsar classification system is the most preferred one. The 1971 Ramsar<br />
Convention on <strong>Wetl<strong>and</strong></strong>s <strong>of</strong> International Importance especially as Waterfowl Habitat is the oldest<br />
conservation convention. It owes its name to its place <strong>of</strong> adoption in Iran. It came into being due to serious<br />
decline in populations <strong>of</strong> waterfowl (mainly ducks) <strong>and</strong> conservation <strong>of</strong> habitats <strong>of</strong> migratory waterfowl.<br />
Convention provides framework for the conservation <strong>and</strong> ‘wise use’ <strong>of</strong> wetl<strong>and</strong> biomes. Ramsar convention is<br />
the first modern global intergovernmental treaty on conservation <strong>and</strong> wise use <strong>of</strong> natural resources<br />
(www.ramsar.org). Ramsar convention entered into force in 1975. Under the text <strong>of</strong> the Convention (Article<br />
1.1) wetl<strong>and</strong>s are defined as:<br />
“areas <strong>of</strong> marsh, fen, peat-l<strong>and</strong> or water, whether natural or artificial, permanent or temporary, with water that<br />
is static or flowing, fresh, brackish or salt, including areas <strong>of</strong> marine water the depth <strong>of</strong> which at low tide does<br />
not exceed six meters”.<br />
In addition, the Convention (Article 2.1) provides that wetl<strong>and</strong>s:<br />
“may incorporate riparian <strong>and</strong> coastal zones adjacent to the wetl<strong>and</strong>s, <strong>and</strong> isl<strong>and</strong>s or bodies <strong>of</strong> marine water<br />
deeper than six meters at low tide lying within the wetl<strong>and</strong>s”.<br />
The first scientific mapping <strong>of</strong> wetl<strong>and</strong>s <strong>of</strong> India was carried out during1992-93 by Space Applications Centre<br />
(ISRO), Ahmedabad, at the behest <strong>of</strong> the <strong>Ministry</strong> <strong>of</strong> <strong>Environment</strong> <strong>and</strong> <strong>Forests</strong> (MoEF), Govt. <strong>of</strong> India using<br />
remote sensing data from Indian Remote Sensing satellites (IRS-Series). The mapping was done at<br />
1:250,000 scale using IRS 1A LISS-I/II data <strong>of</strong> 1992-93 timeframe under the Nation-wide <strong>Wetl<strong>and</strong></strong> Mapping<br />
Project. Since, no suitable wetl<strong>and</strong> classification existed for comprehensive inventory <strong>of</strong> wetl<strong>and</strong>s in the<br />
country at that time; the project used a classification system based on Ramsar Convention definition <strong>of</strong><br />
wetl<strong>and</strong>s. The classification considers all parts <strong>of</strong> a water mass including its ecotonal area as wetl<strong>and</strong>. In<br />
addition, fish <strong>and</strong> shrimp ponds, saltpans, reservoirs, gravel pits were also included as wetl<strong>and</strong>s. This<br />
inventory put the wetl<strong>and</strong> extent (inl<strong>and</strong> as well as coastal) at about 8.26 million ha (Garg et al, 1998). These<br />
estimates (24 categories) do not include rice/paddy fields, rivers, canals <strong>and</strong> irrigation channels.<br />
Further updating <strong>of</strong> wetl<strong>and</strong> maps <strong>of</strong> India was carried out by SAC using IRS P6/Resourcesat AWiFS data <strong>of</strong><br />
2004-05 at 1:250000 scale. In recent years, a conservation atlas has been brought out by Salim Ali Centre for<br />
Ornithology <strong>and</strong> Natural History (SACON, 2004), which provide basic information required by stakeholders in<br />
both wetl<strong>and</strong> habitat <strong>and</strong> species conservation. Space Applications Centre has carried out many pilot projects<br />
for development <strong>of</strong> GIS based wetl<strong>and</strong> information system (Patel et al, 2003) <strong>and</strong> Lake Information system<br />
(Singh et al, 2003).<br />
4
2.0 NATIONAL WETLAND INVENTORY AND ASSESSMENT (NWIA) PROJECT<br />
Realising the importance <strong>of</strong> many small wetl<strong>and</strong>s that dot the Indian l<strong>and</strong>scape, it has been unanimously felt<br />
that inventory <strong>of</strong> the wetl<strong>and</strong>s at 1:50,000 scale is essential. The task seemed challenging in view <strong>of</strong> the vast<br />
geographic area <strong>of</strong> our country enriched with diverse wetl<strong>and</strong> classes. Space Applications Centre with its<br />
experience in use <strong>of</strong> RS <strong>and</strong> GIS in the field <strong>of</strong> wetl<strong>and</strong> studies, took up this challenging task. This is further<br />
strengthened by the fact that guidelines to create geospatial framework, codification scheme, data base<br />
structure etc. for natural resources survey has already been well established by the initiative <strong>of</strong> ISRO under<br />
various national level mapping projects. With this strength, the <strong>National</strong> <strong>Wetl<strong>and</strong></strong> Inventory <strong>and</strong> Assessment<br />
(NWIA) project was formulated by SAC, which was approved <strong>and</strong> funded by MoEF.<br />
The main objectives <strong>of</strong> the project are:<br />
• To map the wetl<strong>and</strong>s on 1:50000 scale using two date (pre <strong>and</strong> post monsoon) IRS LISS III digital data<br />
following a st<strong>and</strong>ard wetl<strong>and</strong> classification system.<br />
• Integration <strong>of</strong> ancillary theme layers ( road, rail, settlements, drainage, administrative boundaries)<br />
• Creation <strong>of</strong> a seamless database <strong>of</strong> the states <strong>and</strong> country in GIS environment.<br />
• Preparation <strong>of</strong> State-wise wetl<strong>and</strong> atlases.<br />
The project was initiated during 2007. The first task was to have a classification system that can be used by<br />
different types <strong>of</strong> users while amenable to database. An expert/peer group was formed <strong>and</strong> the peer review<br />
was held at SAC on June 2007 where wetl<strong>and</strong> experts <strong>and</strong> database experts participated <strong>and</strong> finalized the<br />
classification system. It was agreed to follow the classification system that has been used for the earlier<br />
project <strong>of</strong> 1:250,000 scale, with slight modification. Modified <strong>National</strong> <strong>Wetl<strong>and</strong></strong> Classification system for<br />
wetl<strong>and</strong> delineation <strong>and</strong> mapping comprise 19 wetl<strong>and</strong> classes which are organized under a Level III<br />
hierarchical system. The definition <strong>of</strong> each wetl<strong>and</strong> class <strong>and</strong> its interpretation method was finalized.<br />
The technical/procedure manual was prepared as the st<strong>and</strong>ard guideline for the project execution across the<br />
country (Garg <strong>and</strong> Patel, 2007). The present atlas is part <strong>of</strong> the national level data base <strong>and</strong> deals with the<br />
state <strong>of</strong> <strong>Gujarat</strong>.<br />
2.1 <strong>Wetl<strong>and</strong></strong> Classification System<br />
In the present project, Modified <strong>National</strong> <strong>Wetl<strong>and</strong></strong> Classification system is used for wetl<strong>and</strong> delineation <strong>and</strong><br />
mapping comprising 19 wetl<strong>and</strong> classes which are organized under a Level III hierarchical system (Table 1).<br />
Level one has two classes: inl<strong>and</strong> <strong>and</strong> coastal, these are further bifurcated into two categories as: natural <strong>and</strong><br />
man-made under which the 19 wetl<strong>and</strong> classes are suitably placed. Two-date data pertaining to pre-monsoon<br />
<strong>and</strong> post-monsoon was used to confirm the classes. <strong>Wetl<strong>and</strong></strong>s put to agriculture use in any <strong>of</strong> the two dates<br />
are not considered as wetl<strong>and</strong> class. Definitions <strong>of</strong> wetl<strong>and</strong> categories used in the project is given in<br />
Annexure-I.<br />
2.2 Spatial Framework <strong>and</strong> GIS Database<br />
The <strong>National</strong> Spatial Framework) (NSF) has been used as the spatial framework to create the database<br />
(Anon. 2005a). The database design <strong>and</strong> creation st<strong>and</strong>ard suggested by NRDB/NNRMS guidelines is<br />
followed. Feature codification scheme for every input element has been worked out keeping in view the<br />
nationwide administrative as well as natural hierarchy (State-district- within the feature class for each <strong>of</strong> the<br />
theme. All data elements are given a unique name, which are self explanatory with short forms.<br />
Following wetl<strong>and</strong> layers are generated for each inl<strong>and</strong> wetl<strong>and</strong>:<br />
<strong>Wetl<strong>and</strong></strong> extent: As wetl<strong>and</strong>s encompass open water, aquatic vegetation (submerged, floating <strong>and</strong><br />
emergent), the wetl<strong>and</strong> boundary should ideally include all these. Satellite image gives a clear signature<br />
<strong>of</strong> the wetl<strong>and</strong> extent from the imprint <strong>of</strong> water spread over the years.<br />
Water spread: There are two layers representing post-monsoon <strong>and</strong> pre-monsoon water spread during<br />
the year <strong>of</strong> data acquisition.<br />
Aquatic vegetation spread: The presence <strong>of</strong> vegetation in wetl<strong>and</strong>s provides information about its<br />
trophic condition. As is known, aquatic vegetation is <strong>of</strong> four types, viz. benthic, submerged, floating<br />
5
<strong>and</strong> emergent. It is possible to delineate last two types <strong>of</strong> vegetation using optical remote sensing data.<br />
A qualitative layer pertaining to presence <strong>of</strong> vegetation is generated for each season (as manifested on<br />
pre-monsoon <strong>and</strong> post-monsoon imagery).<br />
Turbidity <strong>of</strong> open water: A layer pertaining to a qualitative turbidity rating is generated.<br />
Three qualitative turbidity ratings ( low, medium <strong>and</strong> high) is followed for pre- <strong>and</strong> post-monsoon<br />
turbidity <strong>of</strong> lakes, reservoirs, barrages <strong>and</strong> other large wetl<strong>and</strong>s.<br />
Small wetl<strong>and</strong>s (smaller than minimum mappable unit: < 2.25 ha) are mapped as point features.<br />
Base layers like major road network, railway, settlements, <strong>and</strong> surface drainage are created (either from<br />
the current image or taken from other project data base).<br />
Table 1: <strong>Wetl<strong>and</strong></strong> Classification System <strong>and</strong> coding<br />
Wettcode* Level I Level II Level III<br />
1000 Inl<strong>and</strong> <strong>Wetl<strong>and</strong></strong>s<br />
1100 Natural<br />
1101 Lakes<br />
1102 Ox-Bow Lakes/ Cut-Off Me<strong>and</strong>ers<br />
1103 High altitude <strong>Wetl<strong>and</strong></strong>s<br />
1104 Riverine <strong>Wetl<strong>and</strong></strong>s<br />
1105 Waterlogged<br />
1106 River/stream<br />
1200 Man-made<br />
1201 Reservoirs/ Barrages<br />
1202 Tanks/Ponds<br />
1203 Waterlogged<br />
1204 Salt pans<br />
2000 Coastal <strong>Wetl<strong>and</strong></strong>s<br />
2100 Natural<br />
2101 Lagoons<br />
2102 Creeks<br />
2103 S<strong>and</strong>/Beach<br />
2104 Intertidal mud flats<br />
2105 Salt Marsh<br />
2106 Mangroves<br />
2107 Coral Reefs<br />
2200 Man-made<br />
2201 Salt pans<br />
2202 Aquaculture ponds<br />
* <strong>Wetl<strong>and</strong></strong> type code<br />
6
3.0 STUDY AREA<br />
The state <strong>of</strong> <strong>Gujarat</strong> is situated on the west coast <strong>of</strong> India, bounded by the Arabian Sea in the West,<br />
Rajasthan in the North <strong>and</strong> North-East, <strong>and</strong> Madhya Pradesh in the East <strong>and</strong> Maharashtra in the South <strong>and</strong><br />
South East. The state also shares an international border with Pakistan at the north western fringe. It is<br />
situated between 20 o 6' <strong>and</strong> 24 o 7' N latitudes <strong>and</strong> 68 o 10' <strong>and</strong> 74 o<br />
28' E longitudes (Figure - 3).<br />
Total geographic area <strong>of</strong> <strong>Gujarat</strong> state is 1,96,024 km² (6% <strong>of</strong> the total area <strong>of</strong> India). As per the 2001 census<br />
data, the population <strong>of</strong> the state was 50,596,992. The density <strong>of</strong> population is 258 persons per km² <strong>and</strong><br />
literacy rate <strong>of</strong> the state was 69.97%. The total number <strong>of</strong> districts in <strong>Gujarat</strong> is 25. G<strong>and</strong>hinagar, the capital<br />
<strong>of</strong> <strong>Gujarat</strong> is a beautiful planned city. <strong>Gujarat</strong> is one <strong>of</strong> the most prosperous states <strong>of</strong> the country owing to its<br />
booming economy <strong>and</strong> industry. The state provides about 19.8% <strong>of</strong> the country's total industrial output <strong>and</strong> is<br />
the most industrialized state <strong>of</strong> the country.<br />
On the basis <strong>of</strong> geographical features, <strong>Gujarat</strong> is divided into four regions, namely;<br />
i) North <strong>Gujarat</strong> region<br />
ii) South <strong>Gujarat</strong> region<br />
iii) Saurashtra peninsular region, <strong>and</strong><br />
iv) Kachchh region, which is partly desert <strong>and</strong> partly marshl<strong>and</strong>.<br />
Across the state four different climatical conditions exist, namely, extremely arid, arid, semi-arid <strong>and</strong><br />
humid(sub-humid tropical monsoon type). However, a major part <strong>of</strong> the state(14 districts) experience semiarid<br />
climate; only two southern districts <strong>of</strong> Dangs <strong>and</strong> Valsad have humid climate. Three districts – Jamnagar,<br />
Rajkot <strong>and</strong> Surendranagar have semi-arid to arid climate while Kachchh district has extremely arid climate.<br />
<strong>Gujarat</strong> mainl<strong>and</strong> region receives an average annual rainfall <strong>of</strong> 800 to 2000 mm, while Saurashtra has an<br />
average annual rainfall <strong>of</strong> 400 to 800 mm. The average annual rainfall in Kachchh is less than 400 mm. The<br />
incidence <strong>and</strong> distribution <strong>of</strong> rainfall, particularly in Saurashtra <strong>and</strong> Kachchh regions <strong>and</strong> in the northern part<br />
<strong>of</strong> <strong>Gujarat</strong> region, is highly erratic. As a result, these regions are very <strong>of</strong>ten subject to drought. In south<br />
<strong>Gujarat</strong> region, rainfall distribution is more or less uniform, with occasional heavy rainfall. Most <strong>of</strong> the rain (90-<br />
95% <strong>of</strong> the annual total) falls during the period <strong>of</strong> June to September, when the southwest monsoon prevails.<br />
The state has the longest coastline <strong>of</strong> about 1600 km, which is one third <strong>of</strong> the coastal length <strong>of</strong> the country<br />
comprising two gulfs (Gulf <strong>of</strong> Kachchh <strong>and</strong> Gulf <strong>of</strong> Khambhat). The sea-water ingress onto the l<strong>and</strong> due to the<br />
existence <strong>of</strong> highly cavernous <strong>and</strong> permeable limestone in the coastal region.<br />
Water resources in <strong>Gujarat</strong> are concentrated primarily in the southern <strong>and</strong> central part <strong>of</strong> the mainl<strong>and</strong>.<br />
Saurashtra <strong>and</strong> Kachchh in the northern mainl<strong>and</strong>, with exceptionally high irrigation needs, have limited<br />
surface <strong>and</strong> groundwater resources. Groundwater <strong>and</strong> surface water are the two different sources from which<br />
water is utilized for irrigation purposes. These two sources are mainly replenished by rainfall <strong>and</strong> stream<br />
flows.<br />
<strong>Gujarat</strong> is a unique state that has many kinds <strong>of</strong> habitats. These varied l<strong>and</strong>forms include dry deciduous<br />
forests, majestic grassl<strong>and</strong>s, wetl<strong>and</strong>s, marine ecosystems <strong>and</strong> rich moist deciduous forests. These habitats<br />
are home to some extremely rare wildlife. The Asiatic Lion is found only in Gir. The Wild Ass in the Rann <strong>of</strong><br />
Kachchh, the rare great Indian bustard in the bird reserves, the world's only four-horned antelope <strong>and</strong> the<br />
Black Buck are some other valued species protected in <strong>Gujarat</strong>. The dugong <strong>and</strong> the rare boralia species also<br />
find a safe haven here.<br />
Though there are a number <strong>of</strong> rivers <strong>and</strong> streams in the state, a large proportion <strong>of</strong> it retains water for the<br />
brief period <strong>of</strong> a year. Major rivers like the Narmada, the Tapti, the Mahi <strong>and</strong> the Sabarmati play important<br />
role in nurturing the biodiversity <strong>and</strong> people <strong>of</strong> <strong>Gujarat</strong> throughout the year. There are few medium, minor<br />
<strong>and</strong> desert rivers also maintain biodiversity in the state.<br />
The spatial framework <strong>of</strong> <strong>Gujarat</strong> was prepared using 15’ x 15’ grid. The state is covered by 323 Survey <strong>of</strong><br />
India topographic maps on 1:50,000 scale that form the spatial frame work for mapping (Figure 4).<br />
A detail <strong>of</strong> district information followed in the atlas is given in Annexure-II.<br />
7
Figure 3: Location map<br />
Figure 4: Spatial framework <strong>of</strong> <strong>Gujarat</strong><br />
8
4.0 DATA USED<br />
4.1 Remote sensing data<br />
IRS P6 LISS III data was used to map the wetl<strong>and</strong>s. IRS P6 LISS III provide data in 4 spectral b<strong>and</strong>s; green,<br />
red, Near Infra Red (NIR) <strong>and</strong> Short wave Infra Red (SWIR), with 23.5 m spatial resolution <strong>and</strong> 24 day repeat<br />
cycle. The spatial resolution is suitable for 1:50,000 scale mapping. The state <strong>of</strong> <strong>Gujarat</strong> is covered in 22 IRS<br />
LISS III scene (Figure 5). Two date data, one acquired during March <strong>and</strong> another during January were used<br />
to capture the pre-monsoon <strong>and</strong> post-monsoon hydrological variability <strong>of</strong> the wetl<strong>and</strong>s respectively (Table-2).<br />
Figure 6 shows the overview <strong>of</strong> the part <strong>of</strong> <strong>Gujarat</strong> as seen in the LISS III FCC <strong>of</strong> post- monsoon <strong>and</strong> pre-<br />
monsoon data respectively.<br />
4.2 Ground truth data<br />
Remote sensing techniques require certain amount <strong>of</strong> field observation called “ground truth” in order to<br />
convert into meaningful information. Such work involves visiting a number <strong>of</strong> test sites, usually taking the<br />
satellite images. The location <strong>of</strong> the features is recorded using the GPS. The st<strong>and</strong>ard pr<strong>of</strong>orma as per the<br />
NWIA manual was used to record the field data. Field photographs are also taken to record the water quality<br />
(subjective), status <strong>of</strong> aquatic vegetation <strong>and</strong> water spread. All field verification work has been done during<br />
October <strong>and</strong> November 2008.<br />
Figure 5: IRS P6 LISS-III coverage <strong>of</strong> <strong>Gujarat</strong><br />
9
4.3 Other data<br />
Survey <strong>of</strong> India topographical maps (SOI) were used for reference purpose. Lineage data <strong>of</strong> <strong>National</strong> <strong>Wetl<strong>and</strong></strong><br />
Maps at 1:250,000 scale was used for reference.<br />
Sr. No. Sensor Path-Row<br />
Table-2: Satellite data used<br />
Date <strong>of</strong> acquisition<br />
Post-monsoon Pre-monsoon<br />
1 LISS-III 89-55 Oct 23, 2006 May 3, 2007<br />
2 LISS-III 89-56 Oct 23, 2006 May 3, 2007<br />
3 LISS-III 90-55 Oct 28, 2006 May 8, 2007<br />
4 LISS-III 90-56 Oct 28, 2006 Apr 14, 2007<br />
5 LISS-III 90-57 Oct 28, 2006 Apr 14, 2007<br />
6 LISS-III 91-55 Nov 26, 2006 May 13, 2007<br />
7 LISS-III 91-56 Nov 26, 2006 May 13, 2007<br />
8 LISS-III 91-57 Nov 26, 2006 Apr 19, 2007<br />
9 LISS-III 92-55 Oct 14, 2006 May 18, 2007<br />
10 LISS-III 92-56 Oct 14, 2006 May 18, 2007<br />
11 LISS-III 92-57 Oct 14, 2006 Apr 24, 2007<br />
12 LISS-III 92-58 Oct 14, 2006 Apr 24, 2007<br />
13 LISS-III 93-55 Oct 19, 2006 May 23, 2007<br />
14 LISS-III 93-56 Oct 19, 2006 May 23, 2007<br />
15 LISS-III 93-57 Oct 19, 2006 May 23, 2007<br />
16 LISS-III 94-55 Oct 24, 2006 May 4, 2007<br />
17 LISS-III 94-56 Oct 24, 2006 May 4, 2007<br />
18 LISS-III 95-57 Dec 16, 2006 Apr 15, 2007<br />
19 LISS-III 95-58 Dec 16, 2006 Apr 15, 2007<br />
20 LISS-III 95-56 Oct 5, 2006 May 9, 2007<br />
21 LISS-III 93-54 Oct19, 2006 May 23, 2007<br />
22 LISS-III 94-57 Nov 17, 2006 May 4, 2007<br />
10
Post-monsoon : 2006<br />
Pre-monsoon : 2007<br />
Figure 6: IRS LISS-III FCC (Post-monsoon <strong>and</strong> Pre-monsoon), Part <strong>of</strong> <strong>Gujarat</strong> state<br />
11
5.0 METHODOLOGY<br />
The methodology to create the state level atlas <strong>of</strong> wetl<strong>and</strong>s is adhered to NWIA technical guidelines <strong>and</strong><br />
procedure manual (Garg <strong>and</strong> Patel, 2007). The overview <strong>of</strong> the steps used is shown in Figure 7. Salient<br />
features <strong>of</strong> methodology adopted are<br />
• Generation <strong>of</strong> spatial framework in GIS environment for database creation <strong>and</strong> organisation.<br />
• Geo-referencing <strong>of</strong> satellite data<br />
• Identification <strong>of</strong> wetl<strong>and</strong> classes as per the classification system given in NWIA Manual <strong>and</strong> mapping <strong>of</strong><br />
the classes using a knowledge based digital classification <strong>and</strong> onscreen interpretation<br />
• Generation <strong>of</strong> base layers (rail, road network, settlements, drainage, administrative boundaries) from<br />
satellite image <strong>and</strong> ancillary data.<br />
• Mosaicing/edge matching to create district <strong>and</strong> state level database.<br />
• Coding <strong>of</strong> the wetl<strong>and</strong>s following the st<strong>and</strong>ard classification system <strong>and</strong> codification as per NWIA<br />
manual.<br />
• Preparation <strong>of</strong> map compositions <strong>and</strong> generation <strong>of</strong> statistics<br />
• Outputs on A3 size prints <strong>and</strong> charts for atlas.<br />
Work was carried out using ERDAS Imagine, Arc/Info <strong>and</strong> Arcgis s<strong>of</strong>twares.<br />
5.1 Creation <strong>of</strong> Spatial Framework<br />
This is the most important task as the state forms a part <strong>of</strong> the national frame work <strong>and</strong> covered in multiple<br />
map sheets. To create NWIA database, NNRMS/NRDB st<strong>and</strong>ards is followed <strong>and</strong> four corners <strong>of</strong> the<br />
1:50,000 (15’ x 15’) grid is taken as the tics or registration points to create each map taking master grid as the<br />
reference. Spatial framework details are given in NWIA manual (Patel <strong>and</strong> Garg, 2007). The spatial<br />
framework for <strong>Gujarat</strong> state is shown in Figure 4.<br />
5.2 Geo-referencing <strong>of</strong> Satellite Data<br />
In this step the raw satellite images were converted to specific map projection using geometric correction.<br />
This is done using archive geometrically corrected LISS III data (ISRO-NRC-l<strong>and</strong> use / l<strong>and</strong> cover project).<br />
St<strong>and</strong>ard image processing s<strong>of</strong>tware was used for geo-referencing. First one date data was registered with<br />
the archive image. The second date data was then registered with the first date data.<br />
5.3 Mapping <strong>of</strong> <strong>Wetl<strong>and</strong></strong>s<br />
The delineation <strong>of</strong> wetl<strong>and</strong>s through image analysis forms the foundation for deriving all wetl<strong>and</strong> classes <strong>and</strong><br />
results. Consequently, a great deal <strong>of</strong> emphasis has been placed on the quality <strong>of</strong> the image Interpretation. In<br />
the present study, the mapping <strong>of</strong> wetl<strong>and</strong>s was done following digital classification <strong>and</strong> onscreen visual<br />
interpretation. <strong>Wetl<strong>and</strong></strong>s were identified based on vegetation, visible hydrology <strong>and</strong> geography. There are<br />
various methods for extraction <strong>of</strong> water information from remote sensing imagery, which according to the<br />
number <strong>of</strong> b<strong>and</strong>s used, are generally divided into two categories, i.e. Single-b<strong>and</strong> <strong>and</strong> multi-b<strong>and</strong> methods.<br />
Single-b<strong>and</strong> method usually involves choosing a b<strong>and</strong> from multi-spectral image to distinguish water from<br />
l<strong>and</strong> by subjective threshold values. It may lead to over- or under-estimation <strong>of</strong> open water area. Multi-b<strong>and</strong><br />
method takes advantage <strong>of</strong> reflective differences <strong>of</strong> each b<strong>and</strong>.<br />
In this project, five indices known in literature that enhances various wetl<strong>and</strong> characteristics were used<br />
(McFeetres, 1986; Xu Hanqiu, 2006; Lacaux et al, 2007; Townshend <strong>and</strong> Justice, 1986; Tucker <strong>and</strong> Sellers,<br />
1986) as given below:<br />
i) Normalised Difference Water Index (NDWI) = (Green-NIR) / (Green + NIR)<br />
ii) Modified Normalised Difference Water Index (MNDWI) = (Green-MIR) / (Green + MIR)<br />
iii) Normalised Difference Vegetation Index (NDVI) = (NIR - Red) / (NIR + Red)<br />
iv) Normalised Difference Pond Index (NDPI) = (MIR – Green / MIR + Green)<br />
v) Normalised Difference Turbidity Index (NDTI) = (Red – Green) / (Red + Green)<br />
12
Spatial frame work<br />
Admin. Boundaries<br />
(State, District)<br />
Morphometric<br />
(<strong>Wetl<strong>and</strong></strong> extent)<br />
Quality Check<br />
Physical<br />
(<strong>Wetl<strong>and</strong></strong> type)<br />
Figure 7: Flow chart <strong>of</strong> the methodology used<br />
The indices were generated using st<strong>and</strong>ard image processing s<strong>of</strong>tware, stacked as layers (Figure 8). Various<br />
combinations <strong>of</strong> the indices/spectral b<strong>and</strong>s were used to identify the wetl<strong>and</strong> features as shown in Figure 9.<br />
The following indices were used for various layer extractions:<br />
• Extraction <strong>of</strong> wetl<strong>and</strong> extent :<br />
MNDWI, NDPI <strong>and</strong> NDVI image was used to extract the wetl<strong>and</strong> boundary through suitable hierarchical<br />
thresholds.<br />
• Extraction <strong>of</strong> open water :<br />
MNDWI was used with in the wetl<strong>and</strong> mask to delineate the water <strong>and</strong> no-water areas.<br />
• Extraction <strong>of</strong> wetl<strong>and</strong> vegetation :<br />
NDPI <strong>and</strong> NDVI image was used to generate the vegetation <strong>and</strong> no-vegetation areas within a wetl<strong>and</strong><br />
using a suitable threshold.<br />
• Turbidity information extraction :<br />
MNDWI image was used to generate qualitative turbidity level (high, moderate <strong>and</strong> low) based on<br />
following steps:<br />
a) Conversion <strong>of</strong> post- <strong>and</strong> pre-monsoon water spread polygons into Area <strong>of</strong> Interest (AoI).<br />
b) Grouping <strong>of</strong> all AoIs excluding all non-wetl<strong>and</strong> areas into a single entity.<br />
c) Generate a signature statistics like minimum, maximum, mean <strong>and</strong> st<strong>and</strong>ard deviations.<br />
d) Generate a raster turbidity image through a model for AoI only with conditional categorisation.<br />
e) Convert the raster into vector <strong>and</strong> update the attributes or edit the water spread layer (copied as<br />
turbidity layer) in polygon mode so as to retain all the attributes.<br />
f) Assign turbidity classes as per the table 3.<br />
IRS P6 LISS III<br />
(pre- <strong>and</strong> post-monsoon data)<br />
Geo-referenced images<br />
On-screen interpretation/<br />
Digital analysis<br />
Biological<br />
(<strong>Wetl<strong>and</strong></strong> vegetation)<br />
GIS DATABASE<br />
(<strong>Wetl<strong>and</strong></strong> layers, Base layers)<br />
NWIA Database Organisation<br />
(District, State, Country)<br />
Analysis<br />
<strong>Atlas</strong>es/Report<br />
Legacy data<br />
SOI topographic maps<br />
Ground truth<br />
Base layers<br />
(Road, Settlement, drainage)<br />
Accuracy Assessment/<br />
Quality Check<br />
13
Table 3: Qualitative turbidity ratings<br />
Sr. No. Qualitative Turbidity Conditional criteria Hue on False Colour Composite (FCC)<br />
1. Low > +1σ Dark blue/blackish<br />
2. Moderate > -1σ to
G R NIR<br />
G R SWIR<br />
Nalsarovar,<br />
IRS LISS III data, 10 October 2006<br />
MNDWI NDPI NDVI<br />
Useful for wetl<strong>and</strong> boundary extraction/delineation<br />
NDWI NDVI NDPI<br />
Useful for wetl<strong>and</strong> vegetation & open water features<br />
MNDWI MNDVI NDTI<br />
Low<br />
Open water<br />
Vegetation<br />
Useful for qualitative turbidity delineation<br />
Figure 9: Various combinations <strong>of</strong> the indices/spectral b<strong>and</strong>s used to identify wetl<strong>and</strong> components<br />
15
6.0 ACCURACY ASSESSMENT<br />
A comprehensive accuracy assessment protocol has been followed for determining the quality <strong>of</strong> information<br />
derived from remotely sensed data. Accuracy assessment involves determination <strong>of</strong> thematic (classification)<br />
as well as location accuracy. In addition, GIS database(s) contents have been also evaluated for accuracy.<br />
To ensure the reliability <strong>of</strong> wetl<strong>and</strong> status data, the project adhered to established quality assurance <strong>and</strong><br />
quality control measures for data collection, analysis, verification <strong>and</strong> reporting.<br />
This study used well established, time-tested, fully documented data collection conventions. It employed<br />
skilled <strong>and</strong> trained personnel for image interpretation, processing <strong>and</strong> digital database creation. All interpreted<br />
imagery was reviewed by technical expert team for accuracy <strong>and</strong> code. The reviewing analyst adhered to all<br />
st<strong>and</strong>ards, quality requirements <strong>and</strong> technical specifications <strong>and</strong> reviewed 100 percent <strong>of</strong> the work. The<br />
various stages <strong>of</strong> quality check include:<br />
1. Image-Image Geo-referencing/Data generation<br />
2. Reference layer preparation using NWIA post monsoon <strong>and</strong> pre-monsoon LISS-III data.<br />
3. <strong>Wetl<strong>and</strong></strong> mapping using visual/digital interpretation techniques.<br />
4. Geo-data base creation <strong>and</strong> organization<br />
5. Output products.<br />
6.1 Data verification <strong>and</strong> quality assurance <strong>of</strong> output digital data files<br />
All digital data files were subjected to rigorous quality control inspections. Digital data verification included<br />
quality control checks that addressed the geospatial correctness, digital integrity <strong>and</strong> some cartographic<br />
aspects <strong>of</strong> the data. Implementation <strong>of</strong> quality checks ensured that the data conformed to the specified<br />
criteria, thus achieving the project objectives. There were tremendous advantages in using newer<br />
technologies to store <strong>and</strong> analyze the geographic data. The geospatial analysis capability built into this study<br />
provided a complete digital database to better assist analysis <strong>of</strong> wetl<strong>and</strong> change information. All digital data<br />
files were subjected to rigorous quality control inspections. Automated checking modules incorporated in the<br />
geographic information system (Arc/GIS) were used to correct digital artifacts including polygon topology.<br />
Additional customized data inspections were made to ensure that the changes indicated at the image<br />
interpretation stage were properly executed.<br />
16
MAPS AND STATISTICS<br />
17
7.0 WETLANDS OF GUJARAT: MAPS AND STATISTICS<br />
Area estimates <strong>of</strong> various wetl<strong>and</strong> categories for <strong>Gujarat</strong> have been carried out using GIS layers <strong>of</strong> wetl<strong>and</strong><br />
boundary, water-spread, aquatic vegetation <strong>and</strong> turbidity. Total 14183 wetl<strong>and</strong>s have been mapped at<br />
1:50,000 scale in the state. In addition, 9708 small wetl<strong>and</strong>s (< 2.25 ha) have also been identified. Total<br />
wetl<strong>and</strong> area estimated is 3474950 ha (Table 4), which accounts for about 17.56 % <strong>of</strong> geographical area <strong>of</strong><br />
the state. The major wetl<strong>and</strong> types include Intertidal mud flats (2260365 ha), River/Stream (275877 ha),<br />
Reservoirs/Barrages (248979 ha), Creeks (149898 ha) <strong>and</strong> Salt Marsh (144268 ha). The coastal wetl<strong>and</strong>s<br />
dominate in the state. Some <strong>of</strong> the unique wetl<strong>and</strong>s like corals <strong>and</strong> mangroves are found in <strong>Gujarat</strong> state.<br />
Graphical distribution <strong>of</strong> wetl<strong>and</strong> type is shown in Figure 10.<br />
The water spread <strong>of</strong> wetl<strong>and</strong>s is low during pre monsoon, particularly; it is significant in case <strong>of</strong> Inl<strong>and</strong><br />
wetl<strong>and</strong>s indicating rain fed nature <strong>of</strong> the wetl<strong>and</strong>s. Area under aquatic vegetation is slightly more in premonsoon<br />
season (205159 ha) than in post monsoon (152318 ha). Turbidity <strong>of</strong> water is in general high in both<br />
the seasons.<br />
Table 4: Area estimates <strong>of</strong> wetl<strong>and</strong>s in <strong>Gujarat</strong><br />
Area in ha<br />
Sr.<br />
No.<br />
Wettcode <strong>Wetl<strong>and</strong></strong> Category<br />
Number<br />
<strong>of</strong><br />
<strong>Wetl<strong>and</strong></strong>s<br />
Total<br />
<strong>Wetl<strong>and</strong></strong><br />
Area<br />
% <strong>of</strong><br />
wetl<strong>and</strong><br />
area<br />
Postmonsoon<br />
Area<br />
Open Water<br />
Premonsoon<br />
Area<br />
1100 Inl<strong>and</strong> <strong>Wetl<strong>and</strong></strong>s - Natural<br />
1 1101 Lakes/Ponds 40 23550 0.68 8507 1873<br />
2 1102 Ox-bow lakes/ Cut-<strong>of</strong>f me<strong>and</strong>ers 1 6 0.00 6 0<br />
3 1105 Waterlogged 278 20660 0.59 11081 2406<br />
4 1106 River/Stream 1039 275877 7.94 86467 47983<br />
1200 Inl<strong>and</strong> <strong>Wetl<strong>and</strong></strong>s -Man-made<br />
5 1201 Reservoirs/Barrages 1214 248979 7.16 233209 98187<br />
6 1202 Tanks/Ponds 8818 73873 2.13 59621 14387<br />
7 1203 Waterlogged 34 13951 0.40 9382 167<br />
8 1204 Salt pans 9 1295 0.04 1143 46<br />
Total - Inl<strong>and</strong> 11433 658191 18.94 409416 165049<br />
2100 Coastal <strong>Wetl<strong>and</strong></strong>s - Natural<br />
9 2101 Lagoons 32 22289 0.64 15228 9882<br />
10 2102 Creeks 170 149898 4.31 149252 149660<br />
11 2103 S<strong>and</strong>/Beach 66 6508 0.19 - -<br />
12 2104 Intertidal mud flats 1066 2260365 65.05 513166 352494<br />
13 2105 Salt Marsh 318 144268 4.15 - -<br />
14 2106 Mangroves 746 90475 2.60 - -<br />
15 2107 Coral Reefs 50 33547 0.97 - -<br />
2200 Coastal <strong>Wetl<strong>and</strong></strong>s - Man-made<br />
16 2201 Salt pans 209 90878 2.62 57809 49914<br />
17 2202 Aquaculture ponds 93 8823 0.25 5884 5482<br />
Total - Coastal 2750 2807051 80.78 741339 567432<br />
Sub-Total 14183 3465242 99.72 1150755 732481<br />
<strong>Wetl<strong>and</strong></strong>s (
Figure 10: Type-wise wetl<strong>and</strong> distribution in <strong>Gujarat</strong><br />
7.1 DISTRICT-WISE WETLAND MAPS AND STATISTICS<br />
The state has 25 districts. The geographic area varied from 45652 sq. km (Kachchh) to 649 sq. km<br />
(G<strong>and</strong>hinagar). The wetl<strong>and</strong> area in each district as per cent <strong>of</strong> total state wetl<strong>and</strong> area ranged from 0.13%<br />
(The Dangs) to 67.94 % (Kachchh). The wetl<strong>and</strong> area in the districts as per cent <strong>of</strong> geographic area varied<br />
from 1.93% (Mehsana) to 51.72 % (Kachchh). Kachchh, Jamnagar, Bharuch, Bhavnagar <strong>and</strong> Surat are<br />
wetl<strong>and</strong> rich districts mainly due to coastal wetl<strong>and</strong>s. Coral is one <strong>of</strong> the special wetl<strong>and</strong> types found only in<br />
the district <strong>of</strong> Jamnagar lying in the Gulf <strong>of</strong> Kachchh. The area occupied by Coral is around 33,547 ha,<br />
scattered over 50 sites. Mangrove is another special wetl<strong>and</strong> type found in 13 districts, covering an area <strong>of</strong><br />
90475 ha. However, maximum mangrove area is observed in Kachchh district having 50197 ha, followed by<br />
Jamnagar district with 18537 ha. Salt marsh is observed in 15 districts. Maximum area under this is observed<br />
in Bhavnagar district (25374 ha), followed by Ahmedabad district (22858 ha). There are 8818 Tanks/pond<br />
(man made) distributed through out the state covering an area <strong>of</strong> 73,873 ha. Maximum number are observed<br />
in the Kachchh district (1438 with 14449 ha area), followed by Surendranagar district (719 with 7941 ha area).<br />
Least number <strong>of</strong> Tanks is observed in the district <strong>of</strong> Dangs (only 3). Patan, Surendranagar <strong>and</strong> Ahmedabad<br />
districts are rich in natural Lakes/pond with 9, 8 <strong>and</strong> 7 numbers each out <strong>of</strong> the total 40 mapped in the state.<br />
District-wise wetl<strong>and</strong> area estimates is given in Table-5 <strong>and</strong> graphical distribution <strong>of</strong> wetl<strong>and</strong>s is shown in<br />
Figure - 11.<br />
<strong>Wetl<strong>and</strong></strong> statistics followed by wetl<strong>and</strong> map <strong>and</strong> corresponding satellite data for each district is given to have<br />
a fairly good idea about the distribution pattern <strong>and</strong> density <strong>of</strong> wetl<strong>and</strong>s in the district.<br />
20
Sr.<br />
No.<br />
District<br />
Geographic<br />
Area<br />
Table-5:District-wise wetl<strong>and</strong> area<br />
<strong>Wetl<strong>and</strong></strong><br />
Area<br />
(sq. km) (ha)<br />
% <strong>of</strong> total wetl<strong>and</strong><br />
area<br />
% <strong>of</strong> district<br />
geographic area<br />
1 Kachchh 45652 2360909 67.94 51.72<br />
2 Banaskantha 12703 43491 1.25 3.42<br />
3 Patan 5738 34268 0.99 5.97<br />
4 Mehsana 4386 8462 0.24 1.93<br />
5 Sabarkantha 7390 42653 1.23 5.77<br />
6 G<strong>and</strong>hinagar 649 4263 0.12 6.57<br />
7 Ahmadabad 8707 63303 1.82 7.27<br />
8 Surendranagar 10489 52896 1.52 5.04<br />
9 Rajkot 11203 55820 1.61 4.98<br />
10 Jamnagar 14125 198657 5.72 14.06<br />
11 Porb<strong>and</strong>ar 2294 22199 0.64 9.68<br />
12 Junagadh 8839 30563 0.88 3.46<br />
13 Amreli 6760 28505 0.82 4.22<br />
14 Bhavnagar 11155 85895 2.47 7.7<br />
15 An<strong>and</strong> 2942 67570 1.94 22.97<br />
16 Kheda 4215 14415 0.41 3.42<br />
17 Panch Mahals 5219 38049 1.09 7.29<br />
18 Dohad 3642 15092 0.43 4.14<br />
19 Vadodara 7794 35553 1.02 4.56<br />
20 Narmada 2749 22501 0.65 8.19<br />
21 Bharuch 6524 112453 3.24 17.24<br />
22 Surat 7657 86062 2.48 11.24<br />
23 The Dangs 1764 4368 0.13 2.48<br />
24 Navsari 2211 23888 0.69 10.8<br />
25 Valsad 3034 23116 0.67 7.62<br />
TOTAL 197841 3474951 100 14.06<br />
21
Figure 11: District-wise wetl<strong>and</strong> distribution<br />
22
7.1.1 Kachchh<br />
Kachchh district is surrounded by the Gulf <strong>of</strong> Kachchh <strong>and</strong> the Arabian Sea in south <strong>and</strong> west, while northern<br />
<strong>and</strong> eastern parts are surrounded by the Great <strong>and</strong> Small Rann (seasonal wetl<strong>and</strong>s) <strong>of</strong> Kachchh. When there<br />
were not many dams built on its rivers, the Rann <strong>of</strong> Kachchh remained wetl<strong>and</strong>s for a large part <strong>of</strong> the year.<br />
Bhuj is the district head quarters <strong>of</strong> Kachchh district. The district covers an area <strong>of</strong> 45, 652 sq. km with total<br />
population <strong>of</strong> 15, 26,321 according to 2001 census.<br />
Kachchh district has the largest share <strong>of</strong> wetl<strong>and</strong>s in the state <strong>of</strong> <strong>Gujarat</strong>. Total 4659 wetl<strong>and</strong>s are mapped<br />
including 1304 small wetl<strong>and</strong>s (< 2.25 ha) with 2360909 ha area. Inl<strong>and</strong> wetl<strong>and</strong>s contribute 3.5% <strong>of</strong> the total<br />
wetl<strong>and</strong> area <strong>and</strong> coastal wetl<strong>and</strong>s contribute 96.5% <strong>of</strong> the total wetl<strong>and</strong> area. Major wetl<strong>and</strong> category found<br />
in the district is Inter-tidal mud flats, creeks, mangroves <strong>and</strong> Salt pans. Details <strong>of</strong> area estimates <strong>of</strong> wetl<strong>and</strong>s<br />
in Kachchh district is shown in Table-6. The wetl<strong>and</strong> area is high due to inter tidal mud flats <strong>of</strong> little rann <strong>of</strong><br />
Kachchh <strong>and</strong> great rann <strong>of</strong> Kachchh area. The area is generally flooded between May <strong>and</strong> October when sea<br />
water, driven by high winds <strong>and</strong> tides from the Arabian Sea <strong>and</strong> monsoon run-<strong>of</strong>f from the hills <strong>of</strong> <strong>Gujarat</strong> <strong>and</strong><br />
Rajasthan, mix together over the plains. For the remainder <strong>of</strong> the year, the Rann is a vast expanse <strong>of</strong> sunbaked<br />
mud <strong>and</strong> s<strong>and</strong> with halite <strong>and</strong> gypsum efflorescences.<br />
Area under aquatic vegetation in post-monsoon is about 59132 ha <strong>and</strong> slightly high during pre monsoon<br />
(60381 ha). Open water spread <strong>of</strong> the wetl<strong>and</strong>s is significantly higher in post monsoon (709817 ha) than<br />
during pre monsoon (499905 ha), indicating the rainfall dependence <strong>of</strong> the wetl<strong>and</strong>s in the district. Most <strong>of</strong> the<br />
open water area is under high turbidity during both seasons.<br />
Table 6: Area estimates <strong>of</strong> wetl<strong>and</strong>s in Kachchh<br />
Area in ha<br />
Sr.<br />
No.<br />
Wettcode <strong>Wetl<strong>and</strong></strong> Category<br />
Number<br />
<strong>of</strong><br />
<strong>Wetl<strong>and</strong></strong>s<br />
Total<br />
<strong>Wetl<strong>and</strong></strong><br />
Area<br />
% <strong>of</strong><br />
wetl<strong>and</strong><br />
area<br />
Open Water<br />
Postmonsoon<br />
Area<br />
Premonsoon<br />
Area<br />
1100 Inl<strong>and</strong> <strong>Wetl<strong>and</strong></strong>s - Natural<br />
1 1101 Lakes/Ponds 3 203 0.01 204 -<br />
2 1105 Waterlogged 38 4188 0.18 2956 96<br />
3 1106 River/Stream 224 20322 0.86 1924 1497<br />
1200 Inl<strong>and</strong> <strong>Wetl<strong>and</strong></strong>s -Man-made<br />
4 1201 Reservoirs/Barrages 259 29995 1.27 25338 4860<br />
5 1202 Tanks/Ponds 1438 14449 0.61 12311 1675<br />
6 1203 Waterlogged 10 12281 0.52 8620 -<br />
Total - Inl<strong>and</strong> 1972 81438 3.45 51353 8128<br />
2100 Coastal <strong>Wetl<strong>and</strong></strong>s - Natural<br />
7 2101 Lagoons 5 3838 0.16 2601 2204<br />
8 2102 Creeks 95 120751 5.11 120754 120694<br />
9 2103 S<strong>and</strong>/Beach 18 1927 0.08 - -<br />
10 2104 Intertidal mud flats 653 2044824 86.61 513166 352494<br />
11 2105 Salt Marsh 55 16895 0.72 - -<br />
12 2106 Mangroves 459 50197 2.13 - -<br />
2200 Coastal <strong>Wetl<strong>and</strong></strong>s - Man-made<br />
13 2201 Salt pans 97 34819 1.47 18564 13043<br />
14 2202 Aquaculture ponds 1 4916 0.21 3379 3342<br />
Total - Coastal 1383 2278167 96.50 658464 491777<br />
Sub-Total 3355 2359605 99.94 709817 499905<br />
<strong>Wetl<strong>and</strong></strong>s (
7.1.2 Banaskantha<br />
Banaskantha is located in the northeast <strong>of</strong> the state. The district gets its name from the West Banas River<br />
which runs through the valley between Mount Abu <strong>and</strong> Aravalli Range, entering into the plains <strong>of</strong> <strong>Gujarat</strong> in<br />
this region <strong>and</strong> flowing towards the Rann <strong>of</strong> Kachchh. The district is bounded by Rajasthan in the north,<br />
Sabarkantha district in east, Kachchh in west <strong>and</strong> Patan <strong>and</strong> Mehsana district in the south. The administrative<br />
headquarters is at Palanpur, the main town <strong>of</strong> the district. Banaskantha covers an area <strong>of</strong> 10,757 sq. km with<br />
a total population <strong>of</strong> 25,02,843 according to 2001 census. In the year 2000, Banashkantha was divided into<br />
two districts, one is Banashkantha <strong>and</strong> the other is Patan district.<br />
Total 1477 wetl<strong>and</strong>s are mapped including 454 small wetl<strong>and</strong>s (< 2.25 ha) with 43491 ha area. Major<br />
wetl<strong>and</strong> category <strong>of</strong> the district is Rivers/streams, Reservoirs, Mud flats, <strong>and</strong> Salt marsh. <strong>Wetl<strong>and</strong></strong>s are more<br />
concentrated in the western <strong>and</strong> eastern part <strong>of</strong> the district. Details <strong>of</strong> area estimates <strong>of</strong> wetl<strong>and</strong>s in<br />
Banaskantha district is shown in Table-7.<br />
Area under aquatic vegetation in post-monsoon is about 1255 ha <strong>and</strong> increased significantly during pre<br />
monsoon (5040 ha). Open water spread <strong>of</strong> the wetl<strong>and</strong>s is significantly higher in post monsoon (17718 ha)<br />
than during pre monsoon (4684 ha), indicating the rainfall dependence <strong>of</strong> the wetl<strong>and</strong>s in the district. Most <strong>of</strong><br />
the open water area is under low turbidity during both seasons.<br />
Sr.<br />
No.<br />
Wettcode <strong>Wetl<strong>and</strong></strong> Category<br />
Table 7: Area estimates <strong>of</strong> wetl<strong>and</strong>s in Banaskantha<br />
Number<br />
<strong>of</strong><br />
<strong>Wetl<strong>and</strong></strong>s<br />
Total<br />
<strong>Wetl<strong>and</strong></strong><br />
Area<br />
% <strong>of</strong><br />
wetl<strong>and</strong><br />
area<br />
Area in ha<br />
Open Water<br />
Postmonsoon<br />
Area<br />
Premonsoon<br />
Area<br />
1100 Inl<strong>and</strong> <strong>Wetl<strong>and</strong></strong>s - Natural<br />
1 1101 Lakes/Ponds 3 330 0.76 224 5<br />
2 1105 Waterlogged 10 840 1.93 430 33<br />
3 1106 River/Stream 49 14806 34.04 2050 161<br />
1200 Inl<strong>and</strong> <strong>Wetl<strong>and</strong></strong>s -Man-made<br />
4 1201 Reservoirs/Barrages 23 10784 24.80 10599 4115<br />
5 1202 Tanks/Ponds 327 3876 8.91 3309 331<br />
6 1204 Salt pans 4 826 1.90 826 39<br />
Total - Inl<strong>and</strong> 416 31462 72.34 17438 4684<br />
2100 Coastal <strong>Wetl<strong>and</strong></strong>s - Natural<br />
7 2104 Intertidal mud flats 25 7023 16.15 - -<br />
8 2105 Salt Marsh 9 3703 8.51 - -<br />
2200 Coastal <strong>Wetl<strong>and</strong></strong>s - Man-made<br />
9 2201 Salt pans 4 280 0.64 280 -<br />
Total - Coastal 38 11006 25.31 280 -<br />
Sub-Total 454 42468 97.65 17718 4684<br />
<strong>Wetl<strong>and</strong></strong>s (
7.1.3 Patan<br />
Patan district is located in the northern part <strong>of</strong> the state with its head quarters at Patan town. The district<br />
covers an area <strong>of</strong> 5730 sq. km with total population <strong>of</strong> 11, 81,941. The district is surrounded by Banas Kantha<br />
district in the north <strong>and</strong> northeast, Mehsan in its south <strong>and</strong> southeast <strong>and</strong> Kachchh <strong>and</strong> Little Rann <strong>of</strong><br />
Kachchh in the east.<br />
Total 1037 wetl<strong>and</strong>s are mapped including 416 small wetl<strong>and</strong>s (< 2.25 ha) with 34268 ha area. Major<br />
wetl<strong>and</strong> category <strong>of</strong> the district is Mud flats, Rivers/streams, Reservoirs <strong>and</strong> Tanks/ponds. <strong>Wetl<strong>and</strong></strong>s are<br />
more concentrated in the western part <strong>of</strong> the district. Details <strong>of</strong> area estimates <strong>of</strong> wetl<strong>and</strong>s in Patan district is<br />
shown in Table-8.<br />
Area under aquatic vegetation in post-monsoon is about 2973 ha <strong>and</strong> slightly less during pre monsoon (1280<br />
ha). Open water spread <strong>of</strong> the wetl<strong>and</strong>s is significantly higher in post monsoon (11595 ha) than during pre<br />
monsoon (2593 ha). Turbidity <strong>of</strong> water is low to moderate in both the seasons.<br />
Sr.<br />
No.<br />
Wettcode <strong>Wetl<strong>and</strong></strong> Category<br />
Table 8: Area estimates <strong>of</strong> wetl<strong>and</strong>s in Patan<br />
Number<br />
<strong>of</strong><br />
<strong>Wetl<strong>and</strong></strong>s<br />
Total<br />
<strong>Wetl<strong>and</strong></strong><br />
Area<br />
% <strong>of</strong><br />
wetl<strong>and</strong><br />
area<br />
Area in ha<br />
Open Water<br />
Postmonsoon<br />
Area<br />
Premonsoon<br />
Area<br />
1100 Inl<strong>and</strong> <strong>Wetl<strong>and</strong></strong>s - Natural<br />
1 1101 Lakes/Ponds 9 1725 5.03 587 4<br />
2 1105 Waterlogged 19 1947 5.68 1766 113<br />
3 1106 River/Stream 31 9430 27.52 1657 255<br />
1200 Inl<strong>and</strong> <strong>Wetl<strong>and</strong></strong>s -Man-made<br />
4 1201 Reservoirs/Barrages 25 3922 11.45 3670 1403<br />
5 1202 Tanks/Ponds 484 5035 14.69 3621 818<br />
6 1204 Salt pans 2 294 0.86 294 -<br />
Total - Inl<strong>and</strong> 570 22353 65.23 11595 2593<br />
2100 Coastal <strong>Wetl<strong>and</strong></strong>s - Natural<br />
7 2104 Intertidal mud flats 34 11004 32.11 - -<br />
8 2105 Salt Marsh 2 392 1.14 - -<br />
2200 Coastal <strong>Wetl<strong>and</strong></strong>s - Man-made<br />
9 2201 Salt pans 15 103 0.30 - -<br />
Total - Coastal 51 11499 33.56 - -<br />
Sub-Total 621 33852 98.79 11595 2593<br />
<strong>Wetl<strong>and</strong></strong>s (
7.1.4 Mehsana<br />
Mehsana is an administrative district <strong>of</strong> <strong>Gujarat</strong> with its head quarters located at Mehsana city. The district is<br />
bounded by Banaskantha district in the north, Patan <strong>and</strong> Surendranagar districts in the west, G<strong>and</strong>hinagar<br />
<strong>and</strong> Ahmedabad districts in south <strong>and</strong> Sabarkantha district in the east. The total area covered by the district is<br />
4, 384 sq. km with total population <strong>of</strong> 18,37,696.<br />
Total 987 wetl<strong>and</strong>s are mapped including 521 small wetl<strong>and</strong>s (< 2.25 ha) with 8462 ha area. Major wetl<strong>and</strong><br />
category <strong>of</strong> the district is Rivers/ streams, Tanks/ponds, <strong>and</strong> Reservoirs. Thol Sanctuary is located in<br />
southern part <strong>of</strong> the district. Thol lake in the centre <strong>of</strong> the sanctuary which is the main attraction apart from<br />
birds <strong>and</strong> trees. Details <strong>of</strong> area estimates <strong>of</strong> wetl<strong>and</strong>s in Mehsana district is shown in Table-9.<br />
Area under aquatic vegetation in post-monsoon is about 677 ha <strong>and</strong> high during pre monsoon (1867 ha).<br />
Open water spread <strong>of</strong> the wetl<strong>and</strong>s is higher in post monsoon (4395 ha) than during pre monsoon (1702 ha).<br />
The turbidity <strong>of</strong> water is in general low to moderate in both the sesons.<br />
Sr.<br />
No.<br />
Wettcode <strong>Wetl<strong>and</strong></strong> Category<br />
Table 9: Area estimates <strong>of</strong> wetl<strong>and</strong>s in Mehsana<br />
Number<br />
<strong>of</strong><br />
<strong>Wetl<strong>and</strong></strong>s<br />
Total<br />
<strong>Wetl<strong>and</strong></strong><br />
Area<br />
% <strong>of</strong><br />
wetl<strong>and</strong><br />
area<br />
Area in ha<br />
Open Water<br />
Postmonsoon<br />
Area<br />
Premonsoon<br />
Area<br />
1100 Inl<strong>and</strong> <strong>Wetl<strong>and</strong></strong>s - Natural<br />
1 1101 Lakes/Ponds 2 513 6.06 513 32<br />
2 1105 Waterlogged 7 126 1.49 85 11<br />
3 1106 River/Stream 15 3799 44.89 933 503<br />
1200 Inl<strong>and</strong> <strong>Wetl<strong>and</strong></strong>s -Man-made<br />
4 1201 Reservoirs/Barrages 4 895 10.58 894 644<br />
5 1202 Tanks/Ponds 430 2412 28.50 1940 512<br />
6 1203 Waterlogged 8 196 2.32 30 -<br />
Sub-Total 466 7941 93.84 4395 1702<br />
<strong>Wetl<strong>and</strong></strong>s (
7.1.5 Sabarkantha<br />
Sabarkantha is a district <strong>of</strong> <strong>Gujarat</strong> in the northeastern part <strong>of</strong> the state. The district head quarters are located<br />
at Himmatnagar which is 80 kms from Ahmedabad. The district is bounded by Rajasthan to the northeast,<br />
Banaskantha <strong>and</strong> Mehsana districts to the west, G<strong>and</strong>hinagar <strong>and</strong> Kheda districts to the south <strong>and</strong><br />
Panchmahal district to the east. Sabarkantha covers an area <strong>of</strong> 7,390 sq. km with total population <strong>of</strong> 20,<br />
83,416 according to 2001 census.<br />
Total 1260 wetl<strong>and</strong>s are mapped including 548 small wetl<strong>and</strong>s (< 2.25 ha) with 42653 ha area. Major<br />
wetl<strong>and</strong> category <strong>of</strong> the district is Reservoirs, Rivers/streams, <strong>and</strong> Tanks/ponds. District has large number <strong>of</strong><br />
small reservoirs. Details <strong>of</strong> area estimates <strong>of</strong> wetl<strong>and</strong>s in Sabarkantha district is shown in Table-10.<br />
Area under aquatic vegetation in post-monsoon is about 1759 ha <strong>and</strong> high during pre monsoon (10775 ha).<br />
Open water spread <strong>of</strong> the wetl<strong>and</strong>s is significantly higher in post monsoon (29976 ha) than during pre<br />
monsoon (12632 ha). Most <strong>of</strong> the open water area is under low turbidity during both seasons.<br />
Sr.<br />
No.<br />
Wettcode <strong>Wetl<strong>and</strong></strong> Category<br />
Table 10: Area estimates <strong>of</strong> wetl<strong>and</strong>s in Sabarkantha<br />
Number<br />
<strong>of</strong><br />
<strong>Wetl<strong>and</strong></strong>s<br />
Total<br />
<strong>Wetl<strong>and</strong></strong><br />
Area<br />
% <strong>of</strong><br />
wetl<strong>and</strong><br />
area<br />
Area in ha<br />
Open Water<br />
Postmonsoon<br />
Area<br />
Premonsoon<br />
Area<br />
1100 Inl<strong>and</strong> <strong>Wetl<strong>and</strong></strong>s - Natural<br />
1 1101 Lakes/Ponds 2 229 0.54 229 89<br />
2 1105 Waterlogged 10 230 0.54 125 6<br />
3 1106 River/Stream 36 16057 37.65 5687 1235<br />
1200 Inl<strong>and</strong> <strong>Wetl<strong>and</strong></strong>s -Man-made<br />
4 1201 Reservoirs/Barrages 62 20002 46.89 19626 10488<br />
5 1202 Tanks/Ponds 600 5035 11.80 4128 775<br />
6 1203 Waterlogged 2 552 1.29 181 39<br />
Sub-Total 712 42105 98.72 29976 12632<br />
<strong>Wetl<strong>and</strong></strong>s (
7.1.6 G<strong>and</strong>hinagar<br />
G<strong>and</strong>hinagar is an administrative district <strong>of</strong> <strong>Gujarat</strong> with its headquarters in G<strong>and</strong>hinagar city, the state<br />
capital. It covers an area <strong>of</strong> 2163 square kilometers with a total population <strong>of</strong> 13,34,455 according to 2001<br />
census. The district includes four taluks - G<strong>and</strong>hinagar, Kalol, Dehgam <strong>and</strong> Mansa - <strong>and</strong> 216 villages.<br />
G<strong>and</strong>hinagar is bounded by the districts <strong>of</strong> Sabarkantha to the northeast, Kheda to the southeast,<br />
Ahmedabad to the southwest, <strong>and</strong> Mehsana to the northwest.<br />
Total 327 wetl<strong>and</strong>s are mapped including 185 small wetl<strong>and</strong>s (< 2.25 ha) with 4263 ha area. Major wetl<strong>and</strong><br />
category <strong>of</strong> the district is Rivers/ streams, <strong>and</strong> Tanks/ponds. Details <strong>of</strong> area estimates <strong>of</strong> wetl<strong>and</strong>s in<br />
G<strong>and</strong>hinagar district is shown in Table-11.<br />
Area under aquatic vegetation in post-monsoon is about 118 ha <strong>and</strong> slightly high during pre monsoon (140<br />
ha). Open water spread <strong>of</strong> the wetl<strong>and</strong>s is significantly higher in post monsoon (1973 ha) than during pre<br />
monsoon (360 ha). The turbidity <strong>of</strong> water is mainly low during post monsoon <strong>and</strong> moderate during pre<br />
monsoon.<br />
Sr.<br />
No.<br />
Wettcode <strong>Wetl<strong>and</strong></strong> Category<br />
Table 11: Area estimates <strong>of</strong> wetl<strong>and</strong>s in G<strong>and</strong>hinagar<br />
Number<br />
<strong>of</strong><br />
<strong>Wetl<strong>and</strong></strong>s<br />
Total<br />
<strong>Wetl<strong>and</strong></strong><br />
Area<br />
% <strong>of</strong><br />
wetl<strong>and</strong><br />
area<br />
Area in ha<br />
Open Water<br />
Postmonsoon<br />
Area<br />
Premonsoon<br />
Area<br />
1100 Inl<strong>and</strong> <strong>Wetl<strong>and</strong></strong>s - Natural<br />
1 1101 Lakes/Ponds 4 13 0.30 13 -<br />
2 1105 Waterlogged 2 94 2.21 94 42<br />
3 1106 River/Stream 4 3431 80.48 1444 182<br />
1200 Inl<strong>and</strong> <strong>Wetl<strong>and</strong></strong>s -Man-made<br />
4 1202 Tanks/Ponds 132 540 12.67 422 136<br />
Sub-Total 142 4078 95.66 1973 360<br />
<strong>Wetl<strong>and</strong></strong>s (
7.1.7 Ahmedabad<br />
Ahmedabad is located in Central <strong>Gujarat</strong>. The district is bound by Mehsana <strong>and</strong> G<strong>and</strong>hinagar districts in the<br />
north, Sabarkantha district in the north-east <strong>and</strong> Kheda district <strong>and</strong> Gulf <strong>of</strong> Khambhat in the south. The<br />
western side <strong>of</strong> the district is bordered by Bhavnagar <strong>and</strong> Surendranagar district. Ahmedabad city is its district<br />
headquarters <strong>and</strong> was also the state’s capital from May 1960 to May 1970, before it was shifted to the new<br />
township at G<strong>and</strong>hinagar. Ahmedabad is the largest city in <strong>Gujarat</strong>. Total geographic area <strong>of</strong> Ahmedabad is<br />
8086.81 km². As per the 2001 census data, the population <strong>of</strong> the district was 58,16,519.<br />
Total 1255 wetl<strong>and</strong>s are mapped including 568 small wetl<strong>and</strong>s (< 2.25 ha) with 63303 ha area. Inl<strong>and</strong><br />
wetl<strong>and</strong>s contribute 40 % <strong>of</strong> the total wetl<strong>and</strong> area <strong>and</strong> coastal wetl<strong>and</strong>s contribute 60% <strong>of</strong> the total wetl<strong>and</strong><br />
area. Major wetl<strong>and</strong> categories <strong>of</strong> the district are Salt marsh, Rivers/ streams, Inter-tidal mud flats,<br />
Lakes/ponds <strong>and</strong> mangroves. <strong>Wetl<strong>and</strong></strong>s are more concentrated in the southern part <strong>of</strong> the district. Part <strong>of</strong> Nal<br />
Sarovar is located in the district which is a famous bird sanctuary. Details <strong>of</strong> area estimates <strong>of</strong> wetl<strong>and</strong>s in<br />
Ahmedabad district is shown in Table-12.<br />
Area under aquatic vegetation in post-monsoon is about 11204 ha <strong>and</strong> slightly less during pre-monsoon<br />
(7200 ha). Open water spread <strong>of</strong> the wetl<strong>and</strong>s is significantly higher in post monsoon (11363 ha) than during<br />
pre monsoon (5836 ha).<br />
Sr.<br />
No.<br />
Wettcode <strong>Wetl<strong>and</strong></strong> Category<br />
Table 12: Area estimates <strong>of</strong> wetl<strong>and</strong>s in Ahmedabad<br />
Number<br />
<strong>of</strong><br />
<strong>Wetl<strong>and</strong></strong>s<br />
Total<br />
<strong>Wetl<strong>and</strong></strong><br />
Area<br />
% <strong>of</strong><br />
wetl<strong>and</strong><br />
area<br />
Area in ha<br />
Open Water<br />
Postmonsoon<br />
Area<br />
Premonsoon<br />
Area<br />
1100 Inl<strong>and</strong> <strong>Wetl<strong>and</strong></strong>s - Natural<br />
1 1101 Lakes/Ponds 7 7551 11.93 2455 268<br />
2 1105 Waterlogged 24 1045 1.65 353 130<br />
3 1106 River/Stream 30 11310 17.87 3377 2620<br />
1200 Inl<strong>and</strong> <strong>Wetl<strong>and</strong></strong>s -Man-made<br />
4 1201 Reservoirs/Barrages 10 966 1.53 752 62<br />
5 1202 Tanks/Ponds 544 3589 5.67 2546 959<br />
6 1203 Waterlogged 4 323 0.51 95 14<br />
Total - Inl<strong>and</strong> 619 24784 39.15 9578 4053<br />
2100 Coastal <strong>Wetl<strong>and</strong></strong>s - Natural<br />
7 2102 Creeks 5 1785 2.82 1785 1783<br />
8 2104 Intertidal mud flats 21 9368 14.80 - -<br />
9 2105 Salt Marsh 24 22858 36.11 - -<br />
10 2106 Mangroves 18 3940 6.22 - -<br />
Total - Coastal 68 37951 59.95 1785 1783<br />
Sub-Total 687 62735 99.10 11363 5836<br />
<strong>Wetl<strong>and</strong></strong>s (
7.1.8 Surendranagar<br />
Surendranagar is an administrative district <strong>of</strong> <strong>Gujarat</strong> with its head quarters located at the same city <strong>of</strong><br />
Surendranagar. The district occupies an area <strong>of</strong> 10,489 sq. km with total population <strong>of</strong> 14, 10,680 according<br />
to 2001 census. Surendranagar is famous for its cotton production <strong>and</strong> salt supply. A group <strong>of</strong> big companies<br />
have their industries at Surendranagar city. There are some worth visiting sites situated in <strong>and</strong> around the<br />
district like Wild Ass Sanctuary <strong>and</strong> Nal sarovar Bird Sanctuary.<br />
Total 1460 wetl<strong>and</strong>s are mapped including 450 small wetl<strong>and</strong>s (< 2.25 ha) with 52896 ha area. Major<br />
wetl<strong>and</strong> categories <strong>of</strong> the district are Rivers/ streams, Reservoirs, Lakes <strong>and</strong> Tanks/ponds. Part <strong>of</strong> Nal<br />
Sarovar is located in the district which is a famous bird sanctuary. Details <strong>of</strong> area estimates <strong>of</strong> wetl<strong>and</strong>s in<br />
Surendranagar district is shown in Table-13.<br />
Area under aquatic vegetation in post-monsoon is about 14377 ha. Open water spread <strong>of</strong> the wetl<strong>and</strong>s is<br />
significantly higher in post monsoon (18406 ha) than during pre monsoon (4424 ha), indicating the rainfall<br />
dependence <strong>of</strong> the wetl<strong>and</strong>s in the district. Major portion <strong>of</strong> the open water area is under low turbidity during<br />
both seasons.<br />
Sr.<br />
No.<br />
Table 13: Area estimates <strong>of</strong> wetl<strong>and</strong>s in Surendranagar<br />
Wettcode <strong>Wetl<strong>and</strong></strong> Category<br />
Number<br />
<strong>of</strong><br />
<strong>Wetl<strong>and</strong></strong>s<br />
Total<br />
<strong>Wetl<strong>and</strong></strong><br />
Area<br />
% <strong>of</strong><br />
wetl<strong>and</strong><br />
area<br />
Area in ha<br />
Open Water<br />
Postmonsoon<br />
Area<br />
Premonsoon<br />
Area<br />
1100 Inl<strong>and</strong> <strong>Wetl<strong>and</strong></strong>s - Natural<br />
1 1101 Lakes/Ponds 8 8815 16.66 1422 197<br />
2 1105 Waterlogged 43 4264 8.06 1207 206<br />
3 1106 River/Stream 108 12462 23.56 1496 372<br />
1200 Inl<strong>and</strong> <strong>Wetl<strong>and</strong></strong>s -Man-made<br />
4 1201 Reservoirs/Barrages 100 10047 18.99 8931 1467<br />
5 1202 Tanks/Ponds 719 7941 15.01 5150 1020<br />
6 1203 Waterlogged 3 251 0.47 200 11<br />
Total - Inl<strong>and</strong> 981 43780 82.77 18406 3273<br />
2100 Coastal <strong>Wetl<strong>and</strong></strong>s - Natural<br />
7 2104 Intertidal mud flats 29 8666 16.38 - -<br />
Total - Coastal 29 8666 16.38 - -<br />
Sub-Total 1010 52446 99.15 18406 3273<br />
<strong>Wetl<strong>and</strong></strong>s (
7.1.9 Rajkot<br />
Rajkot is one <strong>of</strong> the most advanced districts <strong>of</strong> <strong>Gujarat</strong> owing to its large industries. The administrative head<br />
quarters are located at Rajkot city. The district is surrounded by Kachchh in the north, Surendranagar,<br />
Bhavnagar in the east, Amreli, Junagadh in the south <strong>and</strong> Jamnagar in the west.<br />
Total 1398 wetl<strong>and</strong>s are mapped including 475 small wetl<strong>and</strong>s (< 2.25 ha) with 55820 ha area. Inl<strong>and</strong><br />
wetl<strong>and</strong>s contribute 83.7 % <strong>of</strong> the total wetl<strong>and</strong> area <strong>and</strong> coastal wetl<strong>and</strong>s contribute 16.3 % <strong>of</strong> the total<br />
wetl<strong>and</strong> area. Major wetl<strong>and</strong> categories <strong>of</strong> the district are Reservoirs, Rivers/streams, Salt pans <strong>and</strong><br />
Tanks/ponds. District has 180 small <strong>and</strong> 14 medium size reservoirs. Details <strong>of</strong> area estimates <strong>of</strong> wetl<strong>and</strong>s in<br />
Rajkot district is shown in Table-14.<br />
Area under aquatic vegetation in post-monsoon is about 2708 ha <strong>and</strong> high during pre-monsoon (10485 ha).<br />
Open water spread <strong>of</strong> the wetl<strong>and</strong>s is significantly higher in post monsoon (31722 ha) than during pre<br />
monsoon (11087 ha), indicating the rainfall dependence <strong>of</strong> the wetl<strong>and</strong>s in the district. Major portion <strong>of</strong> the<br />
open water area is under low turbidity during both seasons.<br />
Sr.<br />
No.<br />
Wettcode <strong>Wetl<strong>and</strong></strong> Category<br />
Table 14: Area estimates <strong>of</strong> wetl<strong>and</strong>s in Rajkot<br />
Number<br />
<strong>of</strong><br />
<strong>Wetl<strong>and</strong></strong>s<br />
Total<br />
<strong>Wetl<strong>and</strong></strong><br />
Area<br />
% <strong>of</strong><br />
wetl<strong>and</strong><br />
area<br />
Area in ha<br />
Open Water<br />
Postmonsoon<br />
Area<br />
Premonsoon<br />
Area<br />
1100 Inl<strong>and</strong> <strong>Wetl<strong>and</strong></strong>s - Natural<br />
1 1101 Lakes/Ponds 1 143 0.26 83 -<br />
2 1105 Waterlogged 9 634 1.14 477 75<br />
3 1106 River/Stream 193 19441 34.83 5448 3473<br />
1200 Inl<strong>and</strong> <strong>Wetl<strong>and</strong></strong>s -Man-made<br />
4 1201 Reservoirs/Barrages 204 22838 40.91 21187 6733<br />
5 1202 Tanks/Ponds 426 3190 5.71 3057 312<br />
Total - Inl<strong>and</strong> 833 46246 82.85 30252 10593<br />
2100 Coastal <strong>Wetl<strong>and</strong></strong>s - Natural<br />
6 2102 Creeks 2 308 0.55 308 308<br />
7 2104 Intertidal mud flats 29 2117 3.79 - -<br />
8 2105 Salt Marsh 32 2475 4.43 - -<br />
9 2106 Mangroves 12 733 1.31 - -<br />
2200 Coastal <strong>Wetl<strong>and</strong></strong>s - Man-made<br />
10 2201 Salt pans 15 3466 6.21 1162 186<br />
Total - Coastal 90 9099 16.30 1470 494<br />
Sub-Total 923 55345 99.15 31722 11087<br />
<strong>Wetl<strong>and</strong></strong>s (
7.1.10 Jamnagar<br />
Jamnagar is one <strong>of</strong> the most industrialized districts <strong>of</strong> <strong>Gujarat</strong> with its head quarter located at Jamnagar city.<br />
The district covers an area <strong>of</strong> 14,125 sq. km with total population <strong>of</strong> 19,04,278 according to the 2001 census.<br />
Jamnagar is one <strong>of</strong> the main tourist centre <strong>of</strong> the state.<br />
Total 2079 wetl<strong>and</strong>s are mapped including 736 small wetl<strong>and</strong>s (< 2.25 ha) with 198657 ha area. Inl<strong>and</strong><br />
wetl<strong>and</strong>s contributes 20 % <strong>of</strong> the total wetl<strong>and</strong> area <strong>and</strong> coastal wetl<strong>and</strong>s contributes 80% <strong>of</strong> the total wetl<strong>and</strong><br />
area. Major wetl<strong>and</strong> categories <strong>of</strong> the district are Inter-tidal mud flats, Coral reefs, Mangroves, Reservoirs <strong>and</strong><br />
Salt marsh. District is famous for Marine <strong>National</strong> Park <strong>and</strong> Marine sanctuary located in Southern part <strong>of</strong><br />
Gulf <strong>of</strong> Kachchh. Details <strong>of</strong> area estimates <strong>of</strong> wetl<strong>and</strong>s in Jamnagar district is shown in Table-15.<br />
Area under aquatic vegetation in post-monsoon is about 21003 ha <strong>and</strong> slightly high during pre monsoon<br />
(23887 ha). Open water spread <strong>of</strong> the wetl<strong>and</strong>s is significantly higher in post monsoon (47008 ha) than<br />
during pre monsoon (27837 ha). Major portion <strong>of</strong> the open water area is under low to moderate turbidity<br />
during both seasons.<br />
Sr.<br />
No.<br />
Wettcode <strong>Wetl<strong>and</strong></strong> Category<br />
Table 15: Area estimates <strong>of</strong> wetl<strong>and</strong>s in Jamnagar<br />
Number<br />
<strong>of</strong><br />
<strong>Wetl<strong>and</strong></strong>s<br />
Total<br />
<strong>Wetl<strong>and</strong></strong><br />
Area<br />
% <strong>of</strong><br />
wetl<strong>and</strong><br />
area<br />
Area in ha<br />
Open Water<br />
Postmonsoon<br />
Area<br />
Premonsoon<br />
Area<br />
1100 Inl<strong>and</strong> <strong>Wetl<strong>and</strong></strong>s - Natural<br />
1 1101 Lakes/Ponds 1 595 0.30 595 173<br />
2 1105 Waterlogged 46 1329 0.67 996 246<br />
3 1106 River/Stream 209 15625 7.87 3278 2313<br />
1200 Inl<strong>and</strong> <strong>Wetl<strong>and</strong></strong>s -Man-made<br />
4 1201 Reservoirs/Barrages 209 18516 9.32 17202 5476<br />
5 1202 Tanks/Ponds 379 2536 1.28 2422 398<br />
Total - Inl<strong>and</strong> 844 38601 19.43 24493 8606<br />
2100 Coastal <strong>Wetl<strong>and</strong></strong>s - Natural<br />
6 2101 Lagoons 10 2979 1.50 2310 1439<br />
7 2102 Creeks 40 3141 1.58 3137 3134<br />
8 2103 S<strong>and</strong>/Beach 12 1079 0.54 - -<br />
9 2104 Intertidal mud flats 176 63830 32.13 - -<br />
10 2105 Salt Marsh 73 18316 9.22 - -<br />
11 2106 Mangroves 116 18537 9.33 - -<br />
12 2107 Coral Reefs 50 33547 16.89 - -<br />
2200 Coastal <strong>Wetl<strong>and</strong></strong>s - Man-made<br />
13 2201 Salt pans 20 17494 8.81 16671 14323<br />
14 2202 Aquaculture ponds 2 397 0.20 397 335<br />
Total - Coastal 499 159320 80.20 22515 19231<br />
Sub-Total 1343 197921 99.63 47008 27837<br />
<strong>Wetl<strong>and</strong></strong>s (
7.1.11 Porb<strong>and</strong>ar<br />
Porb<strong>and</strong>ar is an administrative district <strong>of</strong> <strong>Gujarat</strong> located in the western part <strong>of</strong> the state with its head quarters<br />
located at Porb<strong>and</strong>ar town. The district covers an area <strong>of</strong> 2298 sq. km with total population 5, 36, 854 square<br />
kilometers. Porb<strong>and</strong>ar was carved out <strong>of</strong> Junagadh district. There are some worth visiting wetl<strong>and</strong> sites in <strong>and</strong><br />
around Porb<strong>and</strong>ar.<br />
Total 226 wetl<strong>and</strong>s are mapped including 95 small wetl<strong>and</strong>s (< 2.25 ha) with 22199 ha area. Inl<strong>and</strong> wetl<strong>and</strong>s<br />
contribute 27.3% <strong>of</strong> the total wetl<strong>and</strong> area <strong>and</strong> coastal wetl<strong>and</strong>s contribute 72.7% <strong>of</strong> the total wetl<strong>and</strong> area.<br />
Major wetl<strong>and</strong> categories <strong>of</strong> the district are Lagoons, Rivers/ streams, Reservoirs <strong>and</strong> S<strong>and</strong>/beach. Details <strong>of</strong><br />
area estimates <strong>of</strong> wetl<strong>and</strong>s in Porb<strong>and</strong>ar district is shown in Table-16.<br />
Area under aquatic vegetation in post-monsoon is about 5451 ha. Open water spread <strong>of</strong> the wetl<strong>and</strong>s is<br />
significantly higher in post monsoon (13390 ha) than during pre monsoon (7376 ha). Major portion <strong>of</strong> the<br />
open water area is under low turbidity during both seasons.<br />
Sr.<br />
No.<br />
Wettcode <strong>Wetl<strong>and</strong></strong> Category<br />
Table 16: Area estimates <strong>of</strong> wetl<strong>and</strong>s in Porb<strong>and</strong>ar<br />
Number<br />
<strong>of</strong><br />
<strong>Wetl<strong>and</strong></strong>s<br />
Total<br />
<strong>Wetl<strong>and</strong></strong><br />
Area<br />
% <strong>of</strong><br />
wetl<strong>and</strong><br />
area<br />
Postmonsoon<br />
Area<br />
Open Water<br />
Area in ha<br />
Premonsoon<br />
Area<br />
1100 Inl<strong>and</strong> <strong>Wetl<strong>and</strong></strong>s - Natural<br />
1 1105 Waterlogged 1 472 2.13 196 -<br />
2 1106 River/Stream 29 2700 12.16 780 535<br />
1200 Inl<strong>and</strong> <strong>Wetl<strong>and</strong></strong>s -Man-made<br />
3 1201 Reservoirs/Barrages 18 4556 20.52 3771 1652<br />
4 1202 Tanks/Ponds 70 468 2.11 468 107<br />
Total - Inl<strong>and</strong> 118 8196 36.92 5215 2294<br />
2100 Coastal <strong>Wetl<strong>and</strong></strong>s - Natural<br />
5 2101 Lagoons 8 11780 53.07 7647 4692<br />
6 2103 S<strong>and</strong>/Beach 3 1524 6.87 - -<br />
7 2105 Salt Marsh 1 76 0.34 - -<br />
2200 Coastal <strong>Wetl<strong>and</strong></strong>s - Man-made<br />
8 2201 Salt pans 1 528 2.38 528 390<br />
Total - Coastal 13 13908 62.65 8175 5082<br />
Sub-Total 131 22104 99.57 13390 7376<br />
<strong>Wetl<strong>and</strong></strong>s (
7.1.12 Junagadh<br />
The district <strong>of</strong> Junagadh is located in the western part <strong>of</strong> <strong>Gujarat</strong> with its head quarters at Junagadh town.<br />
The district is bordered by Rajkot in the North, Porb<strong>and</strong>ar in the North-West, Amreli in the East <strong>and</strong> Arabian<br />
Sea bordering in South <strong>and</strong> West. The district covers an area <strong>of</strong> 8846 sq. km with total population <strong>of</strong><br />
24,48,427 according to 2001 census. Gir <strong>National</strong> Park is located in the district. Junagadh is one <strong>of</strong> the main<br />
tourist centre <strong>of</strong> the state.<br />
Total 626 wetl<strong>and</strong>s are mapped including 279 small wetl<strong>and</strong>s (< 2.25 ha) with 30563 ha area. Inl<strong>and</strong><br />
wetl<strong>and</strong>s contribute 70% <strong>of</strong> the total wetl<strong>and</strong> area <strong>and</strong> coastal wetl<strong>and</strong>s contribute 30% <strong>of</strong> the total wetl<strong>and</strong><br />
area. Major wetl<strong>and</strong> categories <strong>of</strong> the district are Rivers/streams, Reservoirs Inter-tidal mud flats, Salt pans<br />
<strong>and</strong> Lagoons. District has 48 small/medium size reservoirs. Details <strong>of</strong> area estimates <strong>of</strong> wetl<strong>and</strong>s in<br />
Junagadh district is shown in Table-17.<br />
Area under aquatic vegetation in post-monsoon is about 3121 ha <strong>and</strong> slightly high during pre monsoon (4687<br />
ha). Open water spread <strong>of</strong> the wetl<strong>and</strong>s is significantly higher in post monsoon (13622 ha) than during pre<br />
monsoon (6119 ha), indicating the rainfall dependence <strong>of</strong> the wetl<strong>and</strong>s in the district.<br />
Sr.<br />
No.<br />
Wettcode <strong>Wetl<strong>and</strong></strong> Category<br />
Table 17: Area estimates <strong>of</strong> wetl<strong>and</strong>s in Junagadh<br />
Number<br />
<strong>of</strong><br />
<strong>Wetl<strong>and</strong></strong>s<br />
Total<br />
<strong>Wetl<strong>and</strong></strong><br />
Area<br />
% <strong>of</strong><br />
wetl<strong>and</strong><br />
area<br />
Area in ha<br />
Open Water<br />
Postmonsoon<br />
Area<br />
Premonsoon<br />
Area<br />
1100 Inl<strong>and</strong> <strong>Wetl<strong>and</strong></strong>s - Natural<br />
1 1106 River/Stream 62 9996 32.71 1367 721<br />
1200 Inl<strong>and</strong> <strong>Wetl<strong>and</strong></strong>s -Man-made<br />
2 1201 Reservoirs/Barrages 48 9729 31.83 7416 2559<br />
3 1202 Tanks/Ponds 155 1272 4.16 1242 315<br />
4 1203 Waterlogged 1 184 0.60 184 65<br />
Total - Inl<strong>and</strong> 266 21181 69.30 10209 3660<br />
2100 Coastal <strong>Wetl<strong>and</strong></strong>s - Natural<br />
5 2101 Lagoons 5 2061 6.74 1534 1122<br />
6 2102 Creeks 4 46 0.15 46 46<br />
7 2103 S<strong>and</strong>/Beach 16 1242 4.06 - -<br />
8 2104 Intertidal mud flats 19 2062 6.75 - -<br />
9 2105 Salt Marsh 22 1608 5.26 - -<br />
10 2106 Mangroves 11 251 0.82 - -<br />
2200 Coastal <strong>Wetl<strong>and</strong></strong>s - Man-made<br />
11 2201 Salt pans 4 1833 6.00 1833 1291<br />
Total - Coastal 81 9103 29.78 3413 2459<br />
Sub-Total 347 30284 99.09 13622 6119<br />
<strong>Wetl<strong>and</strong></strong>s (
333<br />
71
7.1.13 Amreli<br />
Amreli is located near the Gulf <strong>of</strong> Khambhat in Arabian Sea. The district is bounded by Bhavnagar in the East,<br />
Junagadh in the West, Rajkot in the North <strong>and</strong> Arabian Sea in the South. The district head quarter is located<br />
at the same town <strong>of</strong> Amreli. Total geographic area <strong>of</strong> Amreli is 7381.17 km². As per the 2001 census data,<br />
the population <strong>of</strong> the district was 13,93,295. The density <strong>of</strong> population was 188 persons per km² <strong>and</strong> literacy<br />
rate <strong>of</strong> the district was 67.72%. Amreli is also important from tourism point <strong>of</strong> view. Part <strong>of</strong> the Gir <strong>National</strong><br />
Park is located in this district.<br />
Total 516 wetl<strong>and</strong>s are mapped including 149 small wetl<strong>and</strong>s (< 2.25 ha) with 28505 ha area. Inl<strong>and</strong><br />
wetl<strong>and</strong>s contribute 64.5% <strong>of</strong> the total wetl<strong>and</strong> area <strong>and</strong> coastal wetl<strong>and</strong>s contribute 35.5% <strong>of</strong> the total<br />
wetl<strong>and</strong> area. Major wetl<strong>and</strong> categories <strong>of</strong> the district are Rivers/streams, Reservoirs, Salt pans, <strong>and</strong> Intertidal<br />
mud flats. Details <strong>of</strong> area estimates <strong>of</strong> wetl<strong>and</strong>s in Amreli district is shown in Table-18.<br />
Area under aquatic vegetation in post-monsoon is about 761 ha <strong>and</strong> high during pre monsoon (2105 ha).<br />
Open water spread <strong>of</strong> the wetl<strong>and</strong>s is significantly higher in post monsoon (11349 ha) than during pre<br />
monsoon (4649 ha).<br />
Sr.<br />
No.<br />
Wettcode <strong>Wetl<strong>and</strong></strong> Category<br />
Table 18: Area estimates <strong>of</strong> wetl<strong>and</strong>s in Amreli<br />
Number<br />
<strong>of</strong><br />
<strong>Wetl<strong>and</strong></strong>s<br />
Total<br />
<strong>Wetl<strong>and</strong></strong><br />
Area<br />
% <strong>of</strong><br />
wetl<strong>and</strong><br />
area<br />
Area in ha<br />
Open Water<br />
Postmonsoon<br />
Area<br />
Premonsoon<br />
Area<br />
1100 Inl<strong>and</strong> <strong>Wetl<strong>and</strong></strong>s - Natural<br />
1 1101 Lakes/Ponds 2 266 0.93 266 55<br />
2 1105 Waterlogged 1 204 0.72 - -<br />
3 1106 River/Stream 100 11226 39.38 2208 150<br />
1200 Inl<strong>and</strong> <strong>Wetl<strong>and</strong></strong>s -Man-made<br />
4 1201 Reservoirs/Barrages 66 5169 18.13 4775 838<br />
5 1202 Tanks/Ponds 141 1362 4.78 1150 202<br />
Total - Inl<strong>and</strong> 310 18227 63.94 8399 1245<br />
2100 Coastal <strong>Wetl<strong>and</strong></strong>s - Natural<br />
6 2102 Creeks 1 139 0.49 139 139<br />
7 2103 S<strong>and</strong>/Beach 3 118 0.41 - -<br />
8 2104 Intertidal mud flats 21 1807 6.34 - -<br />
9 2105 Salt Marsh 22 3331 11.69 - -<br />
10 2106 Mangroves 2 55 0.19 - -<br />
2200 Coastal <strong>Wetl<strong>and</strong></strong>s - Man-made<br />
11 2201 Salt pans 7 4354 15.27 2486 2940<br />
12 2202 Aquaculture ponds 1 325 1.14 325 325<br />
Total - Coastal 57 10129 35.53 2950 3404<br />
Sub-Total 367 28356 99.48 11349 4649<br />
<strong>Wetl<strong>and</strong></strong>s (
7.1.14 Bhavnagar<br />
Bhavnagar is a peninsular district <strong>of</strong> Western <strong>Gujarat</strong> bordered by Ahmedabad <strong>and</strong> Surendranagar districts in<br />
the North, the Gulf <strong>of</strong> Cambay in the East <strong>and</strong> South, <strong>and</strong> Amreli <strong>and</strong> Rajkot districts in the West. Bhavnagar<br />
city is its administrative headquarters. The district covers an area <strong>of</strong> 9,981 sq. km with total population <strong>of</strong><br />
24,69,264 according to 2001 census.<br />
Total 724 wetl<strong>and</strong>s are mapped including 202 small wetl<strong>and</strong>s (< 2.25 ha) with 85895 ha area. Inl<strong>and</strong><br />
wetl<strong>and</strong>s contribute 39% <strong>of</strong> the total wetl<strong>and</strong> area <strong>and</strong> coastal wetl<strong>and</strong>s contribute 61% <strong>of</strong> the total wetl<strong>and</strong><br />
area. Major wetl<strong>and</strong> categories <strong>of</strong> the district are Salt marsh, Reservoirs, Rivers/ streams, Salt pans <strong>and</strong> Intertidal<br />
mud flats. Details <strong>of</strong> area estimates <strong>of</strong> wetl<strong>and</strong>s in Bhavnagar district is shown in Table-19.<br />
Area under aquatic vegetation in post-monsoon is about 2919 ha <strong>and</strong> high during pre monsoon (13009 ha).<br />
Open water spread <strong>of</strong> the wetl<strong>and</strong>s is significantly higher in post monsoon (34588 ha) than during pre<br />
monsoon (17515 ha).<br />
Sr.<br />
No.<br />
Wettcode <strong>Wetl<strong>and</strong></strong> Category<br />
Table 19: Area estimates <strong>of</strong> wetl<strong>and</strong>s in Bhavnagar<br />
Number<br />
<strong>of</strong><br />
<strong>Wetl<strong>and</strong></strong>s<br />
Total<br />
<strong>Wetl<strong>and</strong></strong><br />
Area<br />
% <strong>of</strong><br />
wetl<strong>and</strong><br />
area<br />
Area in ha<br />
Open Water<br />
Postmonsoon<br />
Area<br />
Premonsoon<br />
Area<br />
1100 Inl<strong>and</strong> <strong>Wetl<strong>and</strong></strong>s - Natural<br />
1 1105 Waterlogged 2 234 0.27 - -<br />
2 1106 River/Stream 103 14238 16.58 3526 856<br />
1200 Inl<strong>and</strong> <strong>Wetl<strong>and</strong></strong>s -Man-made<br />
3 1201 Reservoirs/Barrages 73 16664 19.40 15612 2501<br />
4 1202 Tanks/Ponds 205 1818 2.12 1455 250<br />
Total - Inl<strong>and</strong> 383 32954 38.37 20593 3607<br />
2100 Coastal <strong>Wetl<strong>and</strong></strong>s - Natural<br />
5 2101 Lagoons 7 989 1.15 672 131<br />
6 2102 Creeks 13 1708 1.99 1709 1708<br />
7 2103 S<strong>and</strong>/Beach 11 352 0.41 - -<br />
8 2104 Intertidal mud flats 30 9704 11.30 - -<br />
9 2105 Salt Marsh 44 25374 29.54 - -<br />
10 2106 Mangroves 16 1058 1.23 - -<br />
2200 Coastal <strong>Wetl<strong>and</strong></strong>s - Man-made<br />
11 2201 Salt pans 18 13554 15.78 11614 12069<br />
Total - Coastal 139 52739 61.40 13995 13908<br />
Sub-Total 522 85693 99.76 34588 17515<br />
<strong>Wetl<strong>and</strong></strong>s (
7.1.15 An<strong>and</strong><br />
The district <strong>of</strong> An<strong>and</strong> is one <strong>of</strong> the 25 administrative districts <strong>of</strong> <strong>Gujarat</strong> which was carved out <strong>of</strong> the Kheda<br />
district in 1997. An<strong>and</strong> town is its district head quarters <strong>and</strong> is the major town. An<strong>and</strong> is bounded by Kheda to<br />
the north, Vadodara to the east, Ahmedabad to the west, <strong>and</strong> the Gulf <strong>of</strong> Cambay to the south. The total area<br />
covered by the district is 2941 sq. km <strong>and</strong> population is 18,56,712 according to 2001 census.<br />
Total 713 wetl<strong>and</strong>s are mapped including 306 small wetl<strong>and</strong>s (< 2.25 ha) with 67570 ha area. Inl<strong>and</strong><br />
wetl<strong>and</strong>s contribute 13% <strong>of</strong> the total wetl<strong>and</strong> area <strong>and</strong> coastal wetl<strong>and</strong>s contribute 87% <strong>of</strong> the total wetl<strong>and</strong><br />
area. Major wetl<strong>and</strong> categories <strong>of</strong> the district are Inter-tidal mud flats, mangroves, creeks, <strong>and</strong> Rivers/<br />
streams. Details <strong>of</strong> area estimates <strong>of</strong> wetl<strong>and</strong>s in An<strong>and</strong> district is shown in Table-20.<br />
Area under aquatic vegetation in post-monsoon is about 2149 ha <strong>and</strong> slightly high during pre monsoon (2092<br />
ha). Open water spread during post-monsoon is about 13765 ha <strong>and</strong> 13657 ha during pre-monsoon.<br />
Sr.<br />
No.<br />
Wettcode <strong>Wetl<strong>and</strong></strong> Category<br />
Table 20: Area estimates <strong>of</strong> wetl<strong>and</strong>s in An<strong>and</strong><br />
Number<br />
<strong>of</strong><br />
<strong>Wetl<strong>and</strong></strong>s<br />
Total<br />
<strong>Wetl<strong>and</strong></strong><br />
Area<br />
% <strong>of</strong><br />
wetl<strong>and</strong><br />
area<br />
Area in ha<br />
Open Water<br />
Postmonsoon<br />
Area<br />
Premonsoon<br />
Area<br />
1100 Inl<strong>and</strong> <strong>Wetl<strong>and</strong></strong>s - Natural<br />
1 1101 Lakes/Ponds 2 23 0.03 - -<br />
2 1105 Waterlogged 6 634 0.94 109 389<br />
3 1106 River/Stream 16 6081 9.00 2640 2628<br />
1200 Inl<strong>and</strong> <strong>Wetl<strong>and</strong></strong>s -Man-made<br />
4 1201 Reservoirs/Barrages 1 52 0.08 52 -<br />
5 1202 Tanks/Ponds 311 1730 2.56 1177 528<br />
6 1203 Waterlogged 1 35 0.05 35 -<br />
Total - Inl<strong>and</strong> 337 8555 12.66 4013 3545<br />
2100 Coastal <strong>Wetl<strong>and</strong></strong>s - Natural<br />
7 2101 Lagoons 1 294 0.44 294 294<br />
8 2102 Creeks 8 9395 13.90 9395 9395<br />
9 2104 Intertidal mud flats 33 36340 53.78 - -<br />
10 2105 Salt Marsh 19 11210 16.59 - -<br />
11 2106 Mangroves 7 1047 1.55 - -<br />
2200 Coastal <strong>Wetl<strong>and</strong></strong>s - Man-made<br />
12 2201 Salt pans 2 423 0.63 63 423<br />
Total - Coastal 70 58709 86.89 9752 10112<br />
Sub-Total 407 67264 99.55 13765 13657<br />
<strong>Wetl<strong>and</strong></strong>s (
7.1.16 Kheda<br />
The district <strong>of</strong> Kheda covers an area <strong>of</strong> 4,219 sq. km with total population <strong>of</strong> 20,24,216 according to 2001<br />
census. Kheda city is the administrative headquarters <strong>of</strong> the district. The district has over 600 villages. It has<br />
common borders with G<strong>and</strong>hinagar <strong>and</strong> Sabarkantha in the north, Panchmahal in the east, Ahmedabad in the<br />
west, <strong>and</strong> An<strong>and</strong> <strong>and</strong> Vadodara in the south. An<strong>and</strong> district was carved out <strong>of</strong> Kheda district in 1997.<br />
Total 858 wetl<strong>and</strong>s are mapped including 385 small wetl<strong>and</strong>s (< 2.25 ha) with 14415 ha area. Major wetl<strong>and</strong><br />
category <strong>of</strong> the district are Rivers/ streams, Tanks/ponds, waterlogged <strong>and</strong> Reservoirs. Details <strong>of</strong> area<br />
estimates <strong>of</strong> wetl<strong>and</strong>s in Kheda district is shown in Table-21.<br />
Area under aquatic vegetation in post-monsoon is about 2447 ha <strong>and</strong> slightly high during pre-monsoon<br />
(3387 ha). Open water spread <strong>of</strong> the wetl<strong>and</strong>s is much higher in post-monsoon (8076 ha) than pre-monsoon<br />
(3252 ha),<br />
Sr.<br />
No.<br />
Wettcode <strong>Wetl<strong>and</strong></strong> Category<br />
Table 21: Area estimates <strong>of</strong> wetl<strong>and</strong>s in Kheda<br />
Number<br />
<strong>of</strong><br />
<strong>Wetl<strong>and</strong></strong>s<br />
Total<br />
<strong>Wetl<strong>and</strong></strong><br />
Area<br />
% <strong>of</strong><br />
wetl<strong>and</strong><br />
area<br />
Area in ha<br />
Open Water<br />
Postmonsoon<br />
Area<br />
Premonsoon<br />
Area<br />
1100 Inl<strong>and</strong> <strong>Wetl<strong>and</strong></strong>s - Natural<br />
1 1101 Lakes/Ponds 2 260 1.80 104 34<br />
2 1105 Waterlogged 20 1843 12.79 601 503<br />
3 1106 River/Stream 11 7855 54.49 4348 1837<br />
1200 Inl<strong>and</strong> <strong>Wetl<strong>and</strong></strong>s -Man-made<br />
4 1201 Reservoirs/Barrages 9 988 6.85 780 151<br />
5 1202 Tanks/Ponds 431 3084 21.39 2243 727<br />
Sub-Total 473 14030 97.33 8076 3252<br />
<strong>Wetl<strong>and</strong></strong>s (
7.1.17 Panchmahal<br />
Panchmahal (or Panch Mahal) is a district <strong>of</strong> <strong>Gujarat</strong> located in the eastern part <strong>of</strong> the state. The district<br />
occupies an area <strong>of</strong> 5220 sq. km with total population <strong>of</strong> 20, 24,883. The district head quarters are located at<br />
Godhra town. Champaner, a UNESCO World Heritage site is located in this district.<br />
Total 1081 wetl<strong>and</strong>s are mapped including 332 small wetl<strong>and</strong>s (< 2.25 ha) with 38049 ha area. Major<br />
wetl<strong>and</strong> categories <strong>of</strong> the district are Reservoirs, Rivers/ streams <strong>and</strong> Tanks/ponds. Kadana <strong>and</strong> Panam<br />
reservoirs are important wetl<strong>and</strong>s <strong>of</strong> the district. Details <strong>of</strong> area estimates <strong>of</strong> wetl<strong>and</strong>s in P<strong>and</strong>chmahal district<br />
is shown in Table-22.<br />
Area under aquatic vegetation in post-monsoon is about 2583 ha <strong>and</strong> high during pre monsoon (8066 ha).<br />
Open water spread <strong>of</strong> the wetl<strong>and</strong>s is higher in post monsoon (27663 ha) than during pre monsoon (17834<br />
ha). Major part <strong>of</strong> the open water area is under low turbidity during both the seasons.<br />
Sr.<br />
No.<br />
Wettcode <strong>Wetl<strong>and</strong></strong> Category<br />
Table 22: Area estimates <strong>of</strong> wetl<strong>and</strong>s in Panchmahal<br />
Number<br />
<strong>of</strong><br />
<strong>Wetl<strong>and</strong></strong>s<br />
Total<br />
<strong>Wetl<strong>and</strong></strong><br />
Area<br />
% <strong>of</strong><br />
wetl<strong>and</strong><br />
area<br />
Area in ha<br />
Open Water<br />
Postmonsoon<br />
Area<br />
Premonsoon<br />
Area<br />
1100 Inl<strong>and</strong> <strong>Wetl<strong>and</strong></strong>s - Natural<br />
1 1101 Lakes/Ponds 1 123 0.32 123 -<br />
2 1105 Waterlogged 28 719 1.89 395 180<br />
3 1106 River/Stream 45 12437 32.69 4964 3215<br />
1200 Inl<strong>and</strong> <strong>Wetl<strong>and</strong></strong>s -Man-made<br />
4 1201 Reservoirs/Barrages 63 19561 51.41 18529 13095<br />
5 1202 Tanks/Ponds 608 4779 12.56 3646 1314<br />
6 1203 Waterlogged 4 98 0.26 6 30<br />
Sub-Total 749 37717 99.13 27663 17834<br />
<strong>Wetl<strong>and</strong></strong>s (
7.1.18 Dohad<br />
Dahod, also known as Dohad is a district <strong>of</strong> <strong>Gujarat</strong> bounded by Panchmahal in the west, Vadodara in the<br />
south, Jhabua district <strong>of</strong> Madhya Pradesh in the east, <strong>and</strong> Banswara district <strong>of</strong> Rajasthan in the north. Dahod<br />
covers an area <strong>of</strong> 3,646 sq. km with total population 16,35,374 according to 2001 census. The population <strong>of</strong><br />
the district is mostly rural, <strong>and</strong> majority <strong>of</strong> the residents are Adivasis, mostly Bhils. The town Dahod is the<br />
administrative head quarters.<br />
Total 678 wetl<strong>and</strong>s are mapped including 207 small wetl<strong>and</strong>s (< 2.25 ha) with 15092 ha area. Major wetl<strong>and</strong><br />
categories <strong>of</strong> the district are Rivers/streams, Reservoirs <strong>and</strong> Tanks/ponds. <strong>Wetl<strong>and</strong></strong>s are more concentrated<br />
in the eastern part <strong>of</strong> the district. Details <strong>of</strong> area estimates <strong>of</strong> wetl<strong>and</strong>s in Dohad district is shown in Table-23.<br />
Area under aquatic vegetation in post-monsoon is about 222 ha <strong>and</strong> slightly high during pre-monsoon<br />
(3833 ha). Open water spread <strong>of</strong> the wetl<strong>and</strong>s is higher in post-monsoon (9770 ha) than during pre-monsoon<br />
(4153 ha).<br />
Sr.<br />
No.<br />
Wettcode <strong>Wetl<strong>and</strong></strong> Category<br />
Table 23: Area estimates <strong>of</strong> wetl<strong>and</strong>s in Dohad<br />
Number<br />
<strong>of</strong><br />
<strong>Wetl<strong>and</strong></strong>s<br />
Total<br />
<strong>Wetl<strong>and</strong></strong><br />
Area<br />
% <strong>of</strong><br />
wetl<strong>and</strong><br />
area<br />
Area in ha<br />
Open Water<br />
Postmonsoon<br />
Area<br />
Premonsoon<br />
Area<br />
1100 Inl<strong>and</strong> <strong>Wetl<strong>and</strong></strong>s - Natural<br />
1 1105 Waterlogged 3 173 1.15 165 32<br />
2 1106 River/Stream 42 6136 40.66 1243 488<br />
1200 Inl<strong>and</strong> <strong>Wetl<strong>and</strong></strong>s -Man-made<br />
3 1201 Reservoirs/Barrages 46 4787 31.72 4706 1961<br />
4 1202 Tanks/Ponds 380 3789 25.11 3656 1672<br />
Sub-Total 471 14885 98.63 9770 4153<br />
<strong>Wetl<strong>and</strong></strong>s (
7.1.19 Vadodara<br />
Vadodara is located in the eastern part <strong>of</strong> the state with its headquarters at Vadodara city. The district covers<br />
an area <strong>of</strong> 7,549 sq. km with total population <strong>of</strong> 36,39,775 according to 2001 census. The district is bordered<br />
by Panchmahal <strong>and</strong> Dahod districts to the north, An<strong>and</strong> <strong>and</strong> Kheda districts to the west, Bharuch <strong>and</strong><br />
Narmada districts to the south, <strong>and</strong> the state <strong>of</strong> Madhya Pradesh to the east.<br />
Total 1101 wetl<strong>and</strong>s are mapped including 537 small wetl<strong>and</strong>s (< 2.25 ha) with 35553 ha area. Inl<strong>and</strong><br />
wetl<strong>and</strong>s contribute 98% <strong>of</strong> the total wetl<strong>and</strong> area <strong>and</strong> coastal wetl<strong>and</strong>s contribute 2% <strong>of</strong> the total wetl<strong>and</strong><br />
area. Major wetl<strong>and</strong> categories <strong>of</strong> the district are Rivers/streams, Reservoirs, Tank/ponds <strong>and</strong> Lakes/ponds.<br />
Details <strong>of</strong> area estimates <strong>of</strong> wetl<strong>and</strong>s in Vadodara district is shown in Table-24.<br />
Area under aquatic vegetation in post-monsoon is about 2172 ha <strong>and</strong> higher during pre-monsoon (4968 ha).<br />
Open water spread <strong>of</strong> the wetl<strong>and</strong>s is significantly high in post-monsoon (18528 ha) than during pre-monsoon<br />
(9592 ha). Major part <strong>of</strong> the open water area is under low turbidity during both the seasons.<br />
Sr.<br />
No.<br />
Wettcode <strong>Wetl<strong>and</strong></strong> Category<br />
Table 24: Area estimates <strong>of</strong> wetl<strong>and</strong>s in Vadodara<br />
Number<br />
<strong>of</strong><br />
<strong>Wetl<strong>and</strong></strong>s<br />
Total<br />
<strong>Wetl<strong>and</strong></strong><br />
Area<br />
% <strong>of</strong><br />
wetl<strong>and</strong><br />
area<br />
Area in ha<br />
Open Water<br />
Postmonsoon<br />
Area<br />
Premonsoon<br />
Area<br />
1100 Inl<strong>and</strong> <strong>Wetl<strong>and</strong></strong>s - Natural<br />
1 1101 Lakes/Ponds 2 2270 6.38 1198 917<br />
2 1105 Waterlogged 12 1320 3.71 1003 256<br />
3 1106 River/Stream 26 22332 62.81 8683 4023<br />
1200 Inl<strong>and</strong> <strong>Wetl<strong>and</strong></strong>s -Man-made<br />
4 1201 Reservoirs/Barrages 6 5257 14.79 5257 3549<br />
5 1202 Tanks/Ponds 511 3129 8.80 2356 839<br />
6 1203 Waterlogged 1 31 0.09 31 8<br />
Total - Inl<strong>and</strong> 558 34339 96.59 18528 9592<br />
2100 Coastal <strong>Wetl<strong>and</strong></strong>s - Natural<br />
7 2104 Intertidal mud flats 5 668 1.88 - -<br />
8 2106 Mangroves 1 9 0.03 - -<br />
Total - Coastal 6 677 1.90 - -<br />
Sub-Total 564 35016 98.49 18528 9592<br />
<strong>Wetl<strong>and</strong></strong>s (
100
101
7.1.20 Narmada<br />
Narmada is one <strong>of</strong> the 25 administrative districts <strong>of</strong> <strong>Gujarat</strong> with its head quarters located at Rajpipla. The<br />
district occupies an area <strong>of</strong> 2,749 square kilometers with a population <strong>of</strong> 514,404 according to 2001 census. It<br />
is one <strong>of</strong> the backward districts in <strong>Gujarat</strong>.<br />
Total 83 wetl<strong>and</strong>s are mapped including 32 small wetl<strong>and</strong>s (< 2.25 ha) with 22501 ha area. Major wetl<strong>and</strong><br />
categories <strong>of</strong> the district are Reservoirs <strong>and</strong> Rivers/streams. Sardar Sarover Dam on the river Narmada is<br />
located in the district. Details <strong>of</strong> area estimates <strong>of</strong> wetl<strong>and</strong>s in Narmada district is shown in Table-25.<br />
Area under aquatic vegetation in pre-monsoon is about 4636 ha. Open water spread <strong>of</strong> the wetl<strong>and</strong>s is<br />
higher in post-monsoon (18012 ha) than during pre monsoon (11633 ha). Major part <strong>of</strong> the open water area is<br />
under low turbidity during both the seasons.<br />
Sr.<br />
No.<br />
Wettcode <strong>Wetl<strong>and</strong></strong> Category<br />
Table 25: Area estimates <strong>of</strong> wetl<strong>and</strong>s in Narmada<br />
Number<br />
<strong>of</strong><br />
<strong>Wetl<strong>and</strong></strong>s<br />
Total<br />
<strong>Wetl<strong>and</strong></strong><br />
Area<br />
% <strong>of</strong><br />
wetl<strong>and</strong><br />
area<br />
Area in ha<br />
Open Water<br />
Postmonsoon<br />
Area<br />
Premonsoon<br />
Area<br />
1100 Inl<strong>and</strong> <strong>Wetl<strong>and</strong></strong>s - Natural<br />
1 1106 River/Stream 28 7259 32.26 2807 1803<br />
1200 Inl<strong>and</strong> <strong>Wetl<strong>and</strong></strong>s -Man-made<br />
2 1201 Reservoirs/Barrages 9 15022 66.76 15022 9721<br />
3 1202 Tanks/Ponds 14 188 0.84 183 109<br />
Total - Inl<strong>and</strong> 51 22469 99.86 18012 11633<br />
Sub-Total 51 22469 99.86 18012 11633<br />
<strong>Wetl<strong>and</strong></strong>s (
103
104
105
7.1.21 Bharuch<br />
Bharuch is an administrative district <strong>of</strong> <strong>Gujarat</strong> located in the southern portion <strong>of</strong> the state. There are 7 taluks<br />
in the district <strong>and</strong> the district head quarter is located at Bharuch town. The district covers an area <strong>of</strong> 6527 sq.<br />
km with total population <strong>of</strong> 13,70,104 according to 2001 census.<br />
Total 884 wetl<strong>and</strong>s are mapped including 407 small wetl<strong>and</strong>s (< 2.25 ha) with 112453 ha area. Inl<strong>and</strong><br />
wetl<strong>and</strong>s contribute 17.5% <strong>of</strong> the total wetl<strong>and</strong> area <strong>and</strong> coastal wetl<strong>and</strong>s contributes 82.5% <strong>of</strong> the total<br />
wetl<strong>and</strong> area. Major wetl<strong>and</strong> categories <strong>of</strong> the district are Inter-tidal mud flats, Salt marsh, Rivers/streams,<br />
Salt pans <strong>and</strong> Mangroves. Details <strong>of</strong> area estimates <strong>of</strong> wetl<strong>and</strong>s in Bharuch district is shown in Table-26.<br />
Area under aquatic vegetation in post-monsoon is about 9237 ha <strong>and</strong> slightly high during pre-monsoon (9854<br />
ha). Open water spread <strong>of</strong> the wetl<strong>and</strong>s is higher in post-monsoon (23102 ha) than during pre-monsoon<br />
(20805 ha).<br />
Sr.<br />
No.<br />
Wettcode <strong>Wetl<strong>and</strong></strong> Category<br />
Table 26: Area estimates <strong>of</strong> wetl<strong>and</strong>s in Bharuch<br />
Number<br />
<strong>of</strong><br />
<strong>Wetl<strong>and</strong></strong>s<br />
Total<br />
<strong>Wetl<strong>and</strong></strong><br />
Area<br />
% <strong>of</strong><br />
wetl<strong>and</strong><br />
area<br />
Area in ha<br />
Open Water<br />
Postmonsoon<br />
Area<br />
Premonsoon<br />
Area<br />
1100 Inl<strong>and</strong> <strong>Wetl<strong>and</strong></strong>s - Natural<br />
1 1101 Lakes/Ponds 1 254 0.23 254 -<br />
2 1106 River/Stream 28 16246 14.45 7513 6340<br />
1200 Inl<strong>and</strong> <strong>Wetl<strong>and</strong></strong>s -Man-made<br />
3 1201 Reservoirs/Barrages 12 729 0.65 729 368<br />
4 1202 Tanks/Ponds 291 1908 1.70 1733 714<br />
5 1204 Salt pans 1 152 0.14 - -<br />
Total - Inl<strong>and</strong> 333 19289 17.15 10229 7422<br />
2100 Coastal <strong>Wetl<strong>and</strong></strong>s - Natural<br />
6 2102 Creeks 9 8604 7.65 8604 8604<br />
7 2104 Intertidal mud flats 63 40690 36.18 - -<br />
8 2105 Salt Marsh 42 21982 19.55 - -<br />
9 2106 Mangroves 26 9073 8.07 - -<br />
2200 Coastal <strong>Wetl<strong>and</strong></strong>s - Man-made<br />
10 2201 Salt pans 33 12017 10.69 4238 4755<br />
11 2202 Aquaculture ponds 4 391 0.35 31 24<br />
Total - Coastal 144 92757 82.49 12873 13383<br />
Sub-Total 477 112046 99.64 23102 20805<br />
<strong>Wetl<strong>and</strong></strong>s (
107
108
109
7.1.22 Surat<br />
Surat is an administrative district <strong>of</strong> <strong>Gujarat</strong> with Surat city as its head quarter town. It is the second most<br />
industrialized <strong>and</strong> advanced district <strong>of</strong> <strong>Gujarat</strong> after Ahmedabad. The district covers an area <strong>of</strong> 7,657 sq. km<br />
with total population <strong>of</strong> 49, 96,391 according to 2001 census. Surat is bordered by the districts <strong>of</strong> Bharuch<br />
<strong>and</strong> Narmada in the north, Navsari <strong>and</strong> Dang in the south <strong>and</strong> the Gulf <strong>of</strong> Khambat in the west.<br />
Total 595 wetl<strong>and</strong>s are mapped including 267 small wetl<strong>and</strong>s (< 2.25 ha) with 86062 ha area. Inl<strong>and</strong><br />
wetl<strong>and</strong>s contribute 70% <strong>of</strong> the total wetl<strong>and</strong> area <strong>and</strong> coastal wetl<strong>and</strong>s contribute 30% <strong>of</strong> the total wetl<strong>and</strong><br />
area. Major wetl<strong>and</strong> categories <strong>of</strong> the district are Reservoirs, Rivers/streams, Inter-tidal mud flats, Salt marsh<br />
<strong>and</strong> mangroves. Details <strong>of</strong> area estimates <strong>of</strong> wetl<strong>and</strong>s in Surat district is shown in Table-27.<br />
Area under aquatic vegetation in post-monsoon is about 3727 ha <strong>and</strong> significantly high during pre-monsoon<br />
(15886 ha). Open water spread <strong>of</strong> the wetl<strong>and</strong>s is higher in post-monsoon (58091 ha) than during premonsoon<br />
(37398 ha). Major part <strong>of</strong> the open water area is under low turbidity during both the seasons.<br />
Sr.<br />
No.<br />
Wettcode <strong>Wetl<strong>and</strong></strong> Category<br />
Table 27: Area estimates <strong>of</strong> wetl<strong>and</strong>s in Surat<br />
Number<br />
<strong>of</strong><br />
<strong>Wetl<strong>and</strong></strong>s<br />
Total<br />
<strong>Wetl<strong>and</strong></strong><br />
Area<br />
% <strong>of</strong><br />
wetl<strong>and</strong><br />
area<br />
Area in ha<br />
Open Water<br />
Postmonsoon<br />
Area<br />
Premonsoon<br />
Area<br />
1100 Inl<strong>and</strong> <strong>Wetl<strong>and</strong></strong>s - Natural<br />
1 1101 Lakes/Ponds 2 237 0.28 237 99<br />
2 1106 River/Stream 39 16210 18.84 10953 7266<br />
1200 Inl<strong>and</strong> <strong>Wetl<strong>and</strong></strong>s -Man-made<br />
3 1201 Reservoirs/Barrages 7 42095 48.91 42098 25306<br />
4 1202 Tanks/Ponds 147 1142 1.33 1070 524<br />
Total - Inl<strong>and</strong> 195 59684 69.35 54358 33195<br />
2100 Coastal <strong>Wetl<strong>and</strong></strong>s - Natural<br />
5 2102 Creeks 7 2866 3.33 2261 2812<br />
6 2103 S<strong>and</strong>/Beach 1 102 0.12 - -<br />
7 2104 Intertidal mud flats 34 11769 13.68 - -<br />
8 2105 Salt Marsh 19 4923 5.72 - -<br />
9 2106 Mangroves 39 3655 4.25 - -<br />
2200 Coastal <strong>Wetl<strong>and</strong></strong>s - Man-made<br />
10 2201 Salt pans 7 1617 1.88 364 491<br />
11 2202 Aquaculture ponds 26 1179 1.37 1108 900<br />
Total - Coastal 133 26111 30.34 3733 4203<br />
Sub-Total 328 85795 99.69 58091 37398<br />
<strong>Wetl<strong>and</strong></strong>s (
111
112
113
7.1.23 The Dangs<br />
Dang (also known as The Dangs) is one <strong>of</strong> the 25 administrative districts <strong>of</strong> <strong>Gujarat</strong> in India. The district<br />
headquarter is located at Ahwa. The district occupies an area <strong>of</strong> 1764 square kilometres <strong>and</strong> has a population<br />
<strong>of</strong> 1,86,712 according to 2001 census. Dang is entirely a rural district.<br />
Total 46 wetl<strong>and</strong>s are mapped including 22 small wetl<strong>and</strong>s (< 2.25 ha) with 4368 ha area. Major wetl<strong>and</strong><br />
category <strong>of</strong> the district is Rivers/ streams. Details <strong>of</strong> area estimates <strong>of</strong> wetl<strong>and</strong>s in the district is shown in<br />
Table-28.<br />
Sr.<br />
No.<br />
Wettcode <strong>Wetl<strong>and</strong></strong> Category<br />
Table 28: Area estimates <strong>of</strong> wetl<strong>and</strong>s in The Dangs<br />
Number<br />
<strong>of</strong><br />
<strong>Wetl<strong>and</strong></strong>s<br />
Total<br />
<strong>Wetl<strong>and</strong></strong><br />
Area<br />
% <strong>of</strong><br />
wetl<strong>and</strong><br />
area<br />
Area in ha<br />
Open Water<br />
Postmonsoon<br />
Area<br />
Premonsoon<br />
Area<br />
1100 Inl<strong>and</strong> <strong>Wetl<strong>and</strong></strong>s - Natural<br />
1 1106 River/Stream 16 4305 98.56 675 968<br />
1200 Inl<strong>and</strong> <strong>Wetl<strong>and</strong></strong>s -Man-made<br />
2 1201 Reservoirs/Barrages 5 28 0.64 29 24<br />
3 1202 Tanks/Ponds 3 13 0.30 13 13<br />
Sub-Total 24 4346 99.50 717 1005<br />
<strong>Wetl<strong>and</strong></strong>s (
115
116
117
7.1.24 Navsari<br />
Navsari is located in southern part <strong>of</strong> <strong>Gujarat</strong>. Navsari city is the head quarter <strong>of</strong> the district. The district<br />
covers an area <strong>of</strong> 2,211 sq. km. Navsari is bordered by the districts <strong>of</strong> Surat in the north, Dangs in the East,<br />
Valsad district in the south <strong>and</strong> the Gulf <strong>of</strong> Khambat in the west.<br />
Total 382 wetl<strong>and</strong>s are mapped including 142 small wetl<strong>and</strong>s (< 2.25 ha) with 23888 ha area. Inl<strong>and</strong><br />
wetl<strong>and</strong>s contribute 25.5% <strong>of</strong> the total wetl<strong>and</strong> area <strong>and</strong> coastal wetl<strong>and</strong>s contribute 74.5% <strong>of</strong> the total<br />
wetl<strong>and</strong> area. Major wetl<strong>and</strong> categories <strong>of</strong> the district are Salt Marsh, Inter-tidal mud flats, Rivers/streams <strong>and</strong><br />
Mangroves. Details <strong>of</strong> area estimates <strong>of</strong> wetl<strong>and</strong>s in Navsari district is shown in Table-29.<br />
Area under aquatic vegetation in pre-monsoon is about 1725 ha. Open water spread <strong>of</strong> the wetl<strong>and</strong>s is<br />
higher in post-monsoon (6439 ha) than during pre-monsoon (4848 ha).<br />
Sr.<br />
No.<br />
Wettcode <strong>Wetl<strong>and</strong></strong> Category<br />
Table 29: Area estimates <strong>of</strong> wetl<strong>and</strong>s in Navsari<br />
Number<br />
<strong>of</strong><br />
<strong>Wetl<strong>and</strong></strong>s<br />
Total<br />
<strong>Wetl<strong>and</strong></strong><br />
Area<br />
% <strong>of</strong><br />
wetl<strong>and</strong><br />
area<br />
Area in ha<br />
Open Water<br />
Postmonsoon<br />
Area<br />
Premonsoon<br />
Area<br />
1100 Inl<strong>and</strong> <strong>Wetl<strong>and</strong></strong>s - Natural<br />
1 1105 Waterlogged 3 155 0.65 6 -<br />
2 1106 River/Stream 20 4854 20.32 3719 2858<br />
1200 Inl<strong>and</strong> <strong>Wetl<strong>and</strong></strong>s -Man-made<br />
3 1201 Reservoirs/Barrages 4 623 2.61 608 352<br />
4 1202 Tanks/Ponds 65 306 1.28 172 88<br />
5 1204 Salt pans 1 16 0.07 16 -<br />
Total - Inl<strong>and</strong> 93 5954 24.92 4521 3298<br />
2100 Coastal <strong>Wetl<strong>and</strong></strong>s - Natural<br />
6 2101 Lagoons 1 348 1.46 170 -<br />
7 2102 Creeks 4 1151 4.82 1112 1033<br />
8 2103 S<strong>and</strong>/Beach 3 49 0.21 - -<br />
9 2104 Intertidal mud flats 32 5732 24.00 - -<br />
10 2105 Salt Marsh 22 7562 31.66 - -<br />
11 2106 Mangroves 44 1574 6.59 - -<br />
2200 Coastal <strong>Wetl<strong>and</strong></strong>s - Man-made<br />
12 2201 Salt pans 2 6 0.03 6 3<br />
13 2202 Aquaculture ponds 39 1370 5.74 630 514<br />
Total - Coastal 147 17792 74.48 1918 1550<br />
Sub-Total 240 23746 99.41 6439 4848<br />
<strong>Wetl<strong>and</strong></strong>s (
119
120
121
7.1.25 Valsad<br />
Valsad is the southernmost district <strong>of</strong> <strong>Gujarat</strong> with its head quarters located at Valsad town. The district is<br />
surrounded by Navsari district in north, Dang in the east, Maharashtra state in south <strong>and</strong> Arabian Sea on the<br />
west coast. Valsad district covers an area <strong>of</strong> 3,035 sq. km with total population <strong>of</strong> 14,10,680 according to<br />
2001 census. There are five taluks in Valsad district – Valsad, Pardi, Umargam, Kaparada <strong>and</strong> Dharampur.<br />
Total 294 wetl<strong>and</strong>s are mapped including 120 small wetl<strong>and</strong>s (< 2.25 ha) with 23116 ha area. Inl<strong>and</strong><br />
wetl<strong>and</strong>s contributes 59.25% <strong>of</strong> the total wetl<strong>and</strong> area <strong>and</strong> coastal wetl<strong>and</strong>s contributes 40.25% <strong>of</strong> the total<br />
wetl<strong>and</strong> area. Major wetl<strong>and</strong> categories <strong>of</strong> the district are Rivers/ streams, Reservoirs, Inter-tidal mud flats,<br />
<strong>and</strong> Salt marsh. Details <strong>of</strong> area estimates <strong>of</strong> wetl<strong>and</strong>s in Valsad district is shown in Table-30.<br />
Area under aquatic vegetation in pre-monsoon is about 3552 ha. Open water spread <strong>of</strong> the wetl<strong>and</strong>s is<br />
higher in post monsoon (9670 ha) than during pre monsoon (2736 ha).<br />
Sr.<br />
No.<br />
Wettcode <strong>Wetl<strong>and</strong></strong> Category<br />
Table 30: Area estimates <strong>of</strong> wetl<strong>and</strong>s in Valsad<br />
Number<br />
<strong>of</strong><br />
<strong>Wetl<strong>and</strong></strong>s<br />
Total<br />
<strong>Wetl<strong>and</strong></strong><br />
Area<br />
% <strong>of</strong><br />
wetl<strong>and</strong><br />
area<br />
Area in ha<br />
Open Water<br />
Postmonsoon<br />
Area<br />
Premonsoon<br />
Area<br />
1100 Inl<strong>and</strong> <strong>Wetl<strong>and</strong></strong>s - Natural<br />
1 1102 Ox-bow lakes/ Cut-<strong>of</strong>f me<strong>and</strong>ers 1 6 0.03 6 -<br />
2 1105 Waterlogged 8 209 0.90 117 88<br />
3 1106 River/Stream 19 7319 31.66 3747 1684<br />
1200 Inl<strong>and</strong> <strong>Wetl<strong>and</strong></strong>s -Man-made<br />
4 1201 Reservoirs/Barrages 10 5754 24.89 5626 862<br />
5 1202 Tanks/Ponds 63 282 1.22 151 49<br />
6 1204 Salt pans 2 7 0.03 7 7<br />
Total - Inl<strong>and</strong> 103 13577 58.73 9654 2690<br />
2100 Coastal <strong>Wetl<strong>and</strong></strong>s - Natural<br />
7 2102 Creeks 1 4 0.02 2 4<br />
8 2103 S<strong>and</strong>/Beach 3 115 0.50 - -<br />
9 2104 Intertidal mud flats 17 4762 20.60 - -<br />
10 2105 Salt Marsh 10 3563 15.41 - -<br />
11 2106 Mangroves 16 346 1.50 - -<br />
2200 Coastal <strong>Wetl<strong>and</strong></strong>s - Man-made<br />
12 2201 Salt pans 4 384 1.66 - -<br />
13 2202 Aquaculture ponds 20 245 1.06 14 42<br />
Total - Coastal 71 9419 40.75 16 46<br />
Sub-Total 174 22996 99.48 9670 2736<br />
<strong>Wetl<strong>and</strong></strong>s (
123
124
125
126
MAJOR WETLAND TYPES<br />
127
128
8.0 MAJOR WETLAND TYPES OF GUJARAT<br />
Major wetl<strong>and</strong> types observed in the state are Salt Marsh, Mangroves, River/Stream, Intertidal Mudflats,<br />
Creeks, Salt pans, Lakes/Ponds, Natural Waterlogged area, Tanks/Ponds, Coral reefs, Lagoons <strong>and</strong><br />
Reservoirs. Details are given in Plates1a-1d. Ground truth data was collected for selected wetl<strong>and</strong> sites. The<br />
st<strong>and</strong>ard pr<strong>of</strong>orma was used to record the field data. Field photographs are also taken to record the water<br />
quality (subjective), status <strong>of</strong> aquatic vegetation <strong>and</strong> water spread. The location <strong>of</strong> the features was recorded<br />
using GPS. Field photographs <strong>of</strong> different wetl<strong>and</strong> types are shown in Plates 2a-2c.<br />
A<br />
B<br />
C<br />
A<br />
B<br />
Part <strong>of</strong> Gulf <strong>of</strong> Khambhat<br />
(IRS-P6 LISS-III FCC, October 19, 2006)<br />
C<br />
Salt Marsh<br />
Mangroves<br />
River/Stream<br />
A<br />
B<br />
Plate – 1a: Major wetl<strong>and</strong> types <strong>of</strong> <strong>Gujarat</strong><br />
Part <strong>of</strong> Gulf <strong>of</strong> Khambhat<br />
(IRS-P6 LISS-III FCC, May 23, 2007)<br />
C<br />
129
A<br />
B<br />
C<br />
C<br />
A<br />
B<br />
Coastal part <strong>of</strong> Kuchchh <strong>and</strong> Jamnagar districts<br />
(IRS-P6 LISS-III FCC, November 26, 2006)<br />
Intertidal Mud flats<br />
Creeks<br />
Salt pans<br />
C<br />
Plate – 1b: Major wetl<strong>and</strong> types <strong>of</strong> <strong>Gujarat</strong><br />
A<br />
B<br />
Coastal part <strong>of</strong> Kuchchh <strong>and</strong> Jamnagar districts<br />
(IRS-P6 LISS-III FCC, May 13, 2007)<br />
130
A<br />
B<br />
C<br />
C<br />
B<br />
A<br />
Nal Sarovar <strong>and</strong> surrounding area<br />
(IRS-P6 LISS-III FCC, November 26, 2006)<br />
Lakes/Ponds<br />
Waterlogged Area (Natural)<br />
Tanks/Ponds<br />
Plate – 1c: Major wetl<strong>and</strong> types <strong>of</strong> <strong>Gujarat</strong><br />
C<br />
B<br />
A<br />
Nal Sarovar <strong>and</strong> surrounding area<br />
(MNDWI NDPI NDVI from LISS-III data)<br />
131
A<br />
B<br />
C<br />
B<br />
A<br />
Coastal part <strong>of</strong> Jamnagar district<br />
(IRS-P6 LISS-III FCC, October 28, 2006)<br />
C<br />
Coral reefs<br />
Lagoon<br />
B<br />
Reservoir<br />
Plate – 1d: Major wetl<strong>and</strong> types <strong>of</strong> <strong>Gujarat</strong><br />
A<br />
Coastal part <strong>of</strong> Jamnagar district<br />
(MNDWI NDPI NDVI from LISS-III data)<br />
C<br />
132
Sr. No Description Field Photograph<br />
1<br />
2<br />
3<br />
4<br />
<strong>Wetl<strong>and</strong></strong> Type: Lakes/Ponds<br />
(Thol Lake)<br />
Location:<br />
Latitude : 23º 08' 17" N<br />
Longitude : 72º 23' 36" E<br />
Aquatic vegetation: Present<br />
(Emergent)<br />
Turbidity: Low<br />
<strong>Wetl<strong>and</strong></strong> Type: Tanks/Ponds<br />
Location:<br />
Latitude : 23º 35' 01" N<br />
Longitude : 72º 08' 10" E<br />
Aquatic vegetation: Present<br />
Turbidity: Low<br />
<strong>Wetl<strong>and</strong></strong> Type: Reservoir/Barrages<br />
(Willington Dam)<br />
Location:<br />
Latitude : 21º 33' 58" N<br />
Longitude : 70º 30' 59" E<br />
Aquatic vegetation: Not Present<br />
Turbidity: Low<br />
<strong>Wetl<strong>and</strong></strong> Type: Lakes/Ponds<br />
(Khijadiya Bird Sanctuary)<br />
Location:<br />
Latitude : 22º 30' 59" N<br />
Longitude : 70º 10' 18" E<br />
Turbidity: Low<br />
Plate 2a: Field photographs <strong>and</strong> ground truth data <strong>of</strong> different wetl<strong>and</strong> types in <strong>Gujarat</strong><br />
133
Sr. No Description Field Photograph<br />
5<br />
6<br />
7<br />
8<br />
<strong>Wetl<strong>and</strong></strong> Type: Salt pans<br />
Location:<br />
Latitude : 20º 38' 12" N<br />
Longitude : 72º 53' 45" E<br />
Aquatic vegetation: NA<br />
Turbidity: Moderate<br />
<strong>Wetl<strong>and</strong></strong> Type: Salt Marsh<br />
Location:<br />
Latitude : 22º 06' 47" N<br />
Longitude : 72º 15' 08" E<br />
Aquatic vegetation: Absent<br />
Turbidity: NA<br />
<strong>Wetl<strong>and</strong></strong> Type: Intertidal Mud flat<br />
Location:<br />
Latitude : 21º 37' 06" N<br />
Longitude : 72º 44' 14" E<br />
Aquatic vegetation: Absent<br />
Turbidity: NA<br />
<strong>Wetl<strong>and</strong></strong> Type: S<strong>and</strong>/Beach<br />
(Madhavpur Beach)<br />
Location:<br />
Latitude : 21º 14' 41" N<br />
Longitude : 69º 57' 56" E<br />
Aquatic vegetation: Absent<br />
Turbidity: NA<br />
Plate 2b: Field photographs <strong>and</strong> ground truth data <strong>of</strong> different wetl<strong>and</strong> types in <strong>Gujarat</strong><br />
134
Sr. No Description Field Photograph<br />
9<br />
10<br />
11<br />
12<br />
<strong>Wetl<strong>and</strong></strong> Type: Mangroves<br />
Location:<br />
Latitude : 21º 40' 11" N<br />
Longitude : 72º 17' 04" E<br />
Turbidity: NA<br />
<strong>Wetl<strong>and</strong></strong> Type: Creek<br />
Location:<br />
Latitude : 21º 39' 01" N<br />
Longitude : 69º 36' 25" E<br />
Turbidity: Moderate<br />
<strong>Wetl<strong>and</strong></strong> Type: Aquaculture Pond<br />
Location:<br />
Latitude : 20º 46' 29" N<br />
Longitude : 72º 51' 51" E<br />
Aquatic vegetation: Absent<br />
Turbidity: Moderate<br />
<strong>Wetl<strong>and</strong></strong> Type: Reservoir<br />
Location:<br />
Latitude : 21º 49' 59" N<br />
Longitude : 73º 45' 01" E<br />
Aquatic vegetation: Nil<br />
Turbidity: Low<br />
Plate 2c: Field photographs <strong>and</strong> ground truth data <strong>of</strong> different wetl<strong>and</strong> types in <strong>Gujarat</strong><br />
135
136
IMPORTANT WETLANDS OF GUJARAT<br />
137
138
9.0 IMPORTANT WETLANDS OF GUJARAT<br />
Various types <strong>of</strong> sanctuaries <strong>and</strong> parks like bird, wildlife, marine, <strong>and</strong> education have been notified in <strong>Gujarat</strong><br />
state. The four national parks occupy 479.67 sq.km. <strong>and</strong> twenty two sanctuaries occupy 16440.91 sq. km.<br />
Reservoirs/dams, rivers/streams, tanks/ponds, water logged areas <strong>and</strong> lowl<strong>and</strong>s like Bhal area are typical<br />
inl<strong>and</strong> wetl<strong>and</strong>s. Different types <strong>of</strong> inl<strong>and</strong> wetl<strong>and</strong>s exist in the state include freshwater lake (locally called<br />
'Sarovar'), village pond/tank ('Gam Talav'), reservoirs, marshes, <strong>and</strong> rivers/streams. There are also some<br />
small wetl<strong>and</strong>s like ab<strong>and</strong>oned quarries <strong>and</strong> cooling ponds.<br />
Of the various wetl<strong>and</strong> types mentioned above, Tanks/ponds dominate the rural l<strong>and</strong>scape <strong>of</strong> <strong>Gujarat</strong>. The<br />
rural <strong>Gujarat</strong> is dotted with numerous natural, semi-natural <strong>and</strong> man-made ponds <strong>of</strong> varied shapes, size <strong>and</strong><br />
depth. Though many <strong>of</strong> them are seasonal, they play an important role <strong>of</strong> providing habitat to numerous<br />
resident <strong>and</strong> migratory waterfowl. The growth <strong>of</strong> trees at several inl<strong>and</strong> wetl<strong>and</strong>s provides roosting <strong>and</strong>/or<br />
nesting site to the resident waterfowl like egrets, herons, cormorants, storks, ibises <strong>and</strong> spoonbills. Several<br />
ponds in rural <strong>and</strong> sub-urban areas provide breeding site for the endangered Indian Sarus Crane. Many<br />
tanks/ponds are rich in social-economically important aquatic plants like Typha, Nymphaea, Nelumbo <strong>and</strong><br />
Traphy.<br />
Apart from the ponds, the state harbours a large number <strong>of</strong> reservoirs, which are primarily meant for irrigation<br />
purpose. There are several reservoirs in Saurashtra <strong>and</strong> Kachchh. Some <strong>of</strong> them are: Lalpari, Nyari, Aji, Veri,<br />
Sardhan, Alangsagar, Hargovind, Ramdhan, Muli, <strong>and</strong> Bhadar in saurashtra; <strong>and</strong> Hamirsar, Bhimasar,<br />
Sinnari, Dewisar, Rudramata, Ningher, Topansar, <strong>and</strong> Vijaysagar. Dantiwada, Sipu, Kadana, Panam, Dharoi,<br />
Sardar Sarovar, Ukai, Vasna barrage <strong>and</strong> Ajwa reservoir in <strong>Gujarat</strong> mainl<strong>and</strong> region are some <strong>of</strong> the<br />
important reservoirs. These reservoirs are considered to be the prime sources <strong>of</strong> water for irrigation <strong>and</strong><br />
drinking across the state.<br />
There are 2751 coastal wetl<strong>and</strong>s occupying a total area <strong>of</strong> 28093 sq. Km. area. There are 302 man-made<br />
coastal wetl<strong>and</strong>s (mainly salt pans) covering an area <strong>of</strong> 997 sq. Km. This is bound to increase with the<br />
expansion <strong>of</strong> the salt industry. There are few natural lakes in the state having the total area <strong>of</strong> 23550 ha. Nal<br />
Sarovar, one <strong>of</strong> the largest lakes <strong>of</strong> the country in Surendranagar <strong>and</strong> Ahmedabad district is supporting large<br />
number <strong>of</strong> waterfowl <strong>and</strong> aquatic plants. The lake is the life-supporting system for a large number <strong>of</strong> local<br />
people. Thol Lake in Mehsana district is well known for their high diversity <strong>and</strong> population <strong>of</strong> the wintering<br />
waterfowl.<br />
Extensive field work was carried out for these wetl<strong>and</strong> areas. <strong>Wetl<strong>and</strong></strong> maps have been prepared for 5km<br />
buffer area <strong>of</strong> each wetl<strong>and</strong> sites. Details <strong>of</strong> the wetl<strong>and</strong>s <strong>and</strong> wetl<strong>and</strong> maps <strong>of</strong> 5 km buffer area are shown in<br />
plates 4 to 29.<br />
139
9.1 Nal Sarover<br />
Name Nal Sarover<br />
Location 22 o 40’ 21” to 22 o 52’ 00” N Latitude <strong>and</strong> 71 o 58’ 55” to 72 o 06’ 43” E Longitude<br />
Area 14673 ha<br />
<strong>Wetl<strong>and</strong></strong> Type Lake/Pond<br />
Dry, tropical monsoon climate, with rainfall from the southwest monsoon concentrated in July,<br />
Climate<br />
August <strong>and</strong> September. Average annual rainfall is about 400 mm<br />
Description Nal Sarovar represents a typical wetl<strong>and</strong>, an ideal bird sanctuary, <strong>and</strong> also a notified wetl<strong>and</strong><br />
declared by the <strong>Ministry</strong> <strong>of</strong> <strong>Environment</strong> <strong>and</strong> <strong>Forests</strong>, Govt. <strong>of</strong> India. The lake is a shallow, natural<br />
lake. Geologically it is a shallow basin which was once a part <strong>of</strong> the sea during the Miocene period<br />
<strong>of</strong> the Quaternary era. The soil is medium black. The average depth is 3 meters in the monsoon<br />
while in pre-monsoon it becomes very shallow (< 100 cm). A large part <strong>of</strong> the lake dry up during<br />
summer. The water spread changes seasonally depending on rainfall <strong>and</strong> the consequent climatic<br />
conditions. The larger part <strong>of</strong> the lake has other vegetation on fringes which provides shelter for<br />
migratory birds.<br />
Hydrophytes include species <strong>of</strong> Chara, Potamogeton, Najas, Vallisneria, Nymphaea,<br />
Vegetation Limnanthemum, Lemna, Wolfia, <strong>and</strong> Hydrilla. Major part <strong>of</strong> the lake is characterised by a rich<br />
growth <strong>of</strong> Xanthium strumarium, Solarnum surattense, <strong>and</strong> Tephrosia purpurea. The semi-aquatic<br />
<strong>and</strong> marsh-l<strong>and</strong> zones hold Ammania bacciferu, A. multiflora, Bergia sp., Alternanthera sessilesis,<br />
Cyperus sp,Scirpus sp., Polygonum plebeium, <strong>and</strong> Marsilea aegyptiaca. Surrounding agricultural<br />
l<strong>and</strong> supports crops <strong>of</strong> cotton, cereals, pulses <strong>and</strong> groundnuts. The few trees in the region include<br />
Prosopis juliflora, P.spicigera, Salvadora persica, S. oleoides, <strong>and</strong> Acacia nilotica among others.<br />
Fauna<br />
Nal Sarovar is an important winter habitat for thous<strong>and</strong>s <strong>of</strong> migratory birds like Flamingos, Pelicans,<br />
cranes, ducks, spoonbill, herons etc., from Siberia, Central Asia <strong>and</strong> Europe.<br />
Turbidity Low<br />
Post monsoon data (2006) Pre monsoon data (2007) Indices (MNDWI NDPI NDVI)<br />
Post monsoon data (2006)<br />
Plate 3: Nal Sarover<br />
140
Plate 4: <strong>Wetl<strong>and</strong></strong> map - 5 km buffer area <strong>of</strong> Nal Sarover<br />
141
142
Plate 5: IRS LISS III FCC - 5 km buffer area <strong>of</strong> Nal Sarover<br />
143
9.2 Thol Lake<br />
Name Thol Lake<br />
Location<br />
Area 379 ha<br />
23 o 07’ 55” to 23 o 08’ 51” N Latitude <strong>and</strong><br />
72 o 23’ 35” to 72 o 25’ 19” E Longitude<br />
<strong>Wetl<strong>and</strong></strong> Type Lake/Pond<br />
Average annual rainfall : 250 mm<br />
Climate<br />
Average annual temperature range from a maximum <strong>of</strong> 44 o C <strong>and</strong> a minimum <strong>of</strong> 6 o C.<br />
Thol sanctuary is located 40 kms northwest <strong>of</strong> Ahmedabad, in Mehsana district. Major part <strong>of</strong> the<br />
Description lake is under open water. There are small marshes at the edges <strong>and</strong> some scrub forest on the side<br />
<strong>of</strong> the embarkments. The sanctuary is covered with lush green trees making it extremely peaceful.<br />
There are Thol Lake,<br />
Thol Lake is well known for wintering Great White Pelicans, Famingos, a variety <strong>of</strong> waterfowl<br />
Fauna<br />
including Mallards <strong>and</strong> good numbers <strong>of</strong> Greylag Geese, Sarus Cranes, the odd Spotted<br />
Flycathcher <strong>and</strong> waders which include Eurasian Curlews.<br />
Turbidity Low-Moderate<br />
Post monsoon data (2006) Pre monsoon data (2007) Indices image<br />
Post monsoon data (2006)<br />
Plate 6: Thol Lake<br />
144
Plate 7: <strong>Wetl<strong>and</strong></strong> map - 5 km buffer area <strong>of</strong> Thol Lake<br />
145
146
Plate 8: IRS LISS III FCC - 5 km buffer area <strong>of</strong> Thol Lake<br />
147
9.3 Southern Gulf <strong>of</strong> Kachchh<br />
Name Southern Gulf <strong>of</strong> Kachchh<br />
Location<br />
22 o 17’ 23” to 22 o 42’ 15” N Latitude <strong>and</strong><br />
69 o 00’ 11” to 70 o 12’ 40” E Longitude<br />
Area <strong>Wetl<strong>and</strong></strong> area : 99535 ha<br />
<strong>Wetl<strong>and</strong></strong> Type Intertidal mud flats, mangroves, creeks, coral reefs, salt marsh <strong>and</strong> salt pans etc.,<br />
Average annual rainfall <strong>of</strong> about 300 mm concentrated in July <strong>and</strong> August.<br />
Climate<br />
The mean maximum temperature is 40 o c, <strong>and</strong> the minimum 7 o c.<br />
The Gulf <strong>of</strong> Kutch is a large inlet <strong>of</strong> the Arabian Sea about 60 km wide at its widest <strong>and</strong> tapering<br />
Description northeastwards for 170 km. The Marine <strong>National</strong> Park <strong>and</strong> Marine Sanctuary are situated along the<br />
southern shore <strong>of</strong> the Gulf from Okha eastwards to the vicinity <strong>of</strong> Khijadia. The <strong>National</strong> Park <strong>and</strong><br />
Marine Sanctuary include 42 isl<strong>and</strong>s <strong>and</strong> a complex <strong>of</strong> fringing reefs backed by mud <strong>and</strong> s<strong>and</strong> flats,<br />
coastal salt marsh <strong>and</strong> mangrove forest. The towns <strong>of</strong> Okha, Salaya, Vadinar, Sikka <strong>and</strong> Jamnagar<br />
have developed along the southern edge <strong>of</strong> the Gulf <strong>and</strong> exert considerable influence over these<br />
wetl<strong>and</strong>s. The major isl<strong>and</strong>s (from west to east) are Beyt, Chusnas, Bhaidar, Nora, Ajad, Chauk,<br />
Dhanibet, Karumbhar, Goos Reef, Moouada, Pirotan, Jindra <strong>and</strong> Chhad. The Gulf is famous for its<br />
coral formations <strong>and</strong> mangrove forest.<br />
Large numbers <strong>of</strong> hard (Scleractinavian) <strong>and</strong> s<strong>of</strong>t (Alcyonarian) corals have been recorded, along<br />
Fauna<br />
with more than 100 species <strong>of</strong> fishes <strong>and</strong> prawn have been recorded. Major species are Sponges,<br />
Corals, Jelly fish, Sea horse, Octopus, Oyster, Pearl oyster, Starfish, Lobster, Dolphin, Dugon, <strong>and</strong><br />
Waterfowls.<br />
Post monsoon data (2006) Pre monsoon data (2007)<br />
Plate 9: Southern Gulf <strong>of</strong> Kachchh<br />
148
Plate 10: <strong>Wetl<strong>and</strong></strong> map - 5 km buffer area <strong>of</strong> Southern Gulf <strong>of</strong> Kachchh<br />
149
150
Plate 11: IRS LISS III FCC - 5 km buffer area <strong>of</strong> Southern Gulf <strong>of</strong> Kachchh<br />
151
9.4 Gulf <strong>of</strong> Khambhat<br />
Name Gulf <strong>of</strong> Khambhat<br />
Location<br />
21 o 38’ 31” to 22 o 22’ 02” N Latitude <strong>and</strong><br />
72 o 10’ 57” to 72 o 41’ 17” E Longitude<br />
Area <strong>Wetl<strong>and</strong></strong> area : 185365 ha<br />
<strong>Wetl<strong>and</strong></strong> Type Intertidal mud flats, mangroves, creeks, Salt marsh <strong>and</strong> salt pans etc.<br />
Climate Average annual rainfall <strong>of</strong> about 800 mm.<br />
An extensive area <strong>of</strong> estuarine habitats around the periphery <strong>of</strong> the Gulf <strong>of</strong> Khambhat. The wetl<strong>and</strong><br />
Description area is located from the region <strong>of</strong> Talaja on the west coast to the head <strong>of</strong> the Gulf at Khambhat, <strong>and</strong><br />
south on the east coast for about 200 km to Valsad, The Tapi, Narmada, Mahi, Sabarmati <strong>and</strong><br />
several other rivers have deposited alluvium over large areas as the marine recession has united<br />
Saurashtra with the mainl<strong>and</strong> <strong>of</strong> <strong>Gujarat</strong>. The area supports large numbers <strong>and</strong> types <strong>of</strong> mangrove<br />
vegetation.<br />
The coastal marshes <strong>and</strong> mudflats provide feeding areas for large numbers <strong>of</strong> herons, egrets,<br />
storks, <strong>and</strong> ibises which breed in groves <strong>of</strong> trees. The New Port <strong>of</strong> Bhavnagar harbors one <strong>of</strong> the<br />
Fauna<br />
largest colonies <strong>of</strong> Egretta gularis in the world. Other common breeding species include Nycticorax<br />
nycticorax, Ardeola grayii, Bubulcus ibis, Egretta garzetta, E. alba, Mycteria leucocephala,<br />
Threskiornis melanocephalus, Pseudibis papillosa, <strong>and</strong> Platalea leucorodia.<br />
Post monsoon data (2006) Pre monsoon data (2007)<br />
Plate 12: Gulf <strong>of</strong> Khambhat<br />
152
Plate 13: <strong>Wetl<strong>and</strong></strong> map - 5 km buffer area <strong>of</strong> Gulf <strong>of</strong> Khambhat<br />
153
154
Plate 14: IRS LISS III FCC - 5 km buffer area <strong>of</strong> Gulf <strong>of</strong> Khambhat<br />
155
9.5 Jamnagar Mangroves<br />
Name Jamnagar Mangroves<br />
Location<br />
22 o 28’ 42” to 22 o 37’ 12” N Latitude <strong>and</strong><br />
69 o 49’ 40” to 70 o 02’ 46” E Longitude<br />
Area Mangrove area : 6415 ha (total wetl<strong>and</strong> area : 19918 ha)<br />
<strong>Wetl<strong>and</strong></strong> Type Mangroves, coral reefs, inter-tidal mudflats <strong>and</strong> salt marsh<br />
Average annual rainfall : 300 mm<br />
Climate<br />
The mean maximum temperature is 40 o C, <strong>and</strong> the minimum <strong>of</strong> 7 o C.<br />
This is cluster <strong>of</strong> four isl<strong>and</strong>s <strong>and</strong> a complex <strong>of</strong> fringing reefs backed by mud flats, mangrove forest<br />
Description <strong>and</strong> coastal salt marsh. Site is located at North-West from Jamnagar city. This area contains some<br />
<strong>of</strong> the best mangrove forests on the west coast <strong>of</strong> India. The principal species are avicennia alba,<br />
Rhizophora mucronata <strong>and</strong> Ceriops tagal.<br />
Fauna This wetl<strong>and</strong> site supports large number <strong>of</strong> birds, fishes, reptiles <strong>and</strong> mammals.<br />
Post monsoon data (2006) Pre monsoon data (2007)<br />
Plate 15: Jamnagar Mangroves<br />
156
Plate 16: <strong>Wetl<strong>and</strong></strong> map - 5 km buffer area <strong>of</strong> Jamnagar Mangroves<br />
157
158
Plate 17: IRS LISS III FCC - 5 km buffer area <strong>of</strong> Jamnagar Mangroves<br />
159
9.6 Coral Reefs <strong>of</strong> Gulf <strong>of</strong> Kachchh<br />
Name Coral Reefs <strong>of</strong> Gulf <strong>of</strong> Kachchh<br />
Location<br />
22 o 22’ 14” to 22 o 29’ 53” N Latitude <strong>and</strong><br />
69 o 32’ 34” to 69 o 43’ 52” E Longitude<br />
Area <strong>Wetl<strong>and</strong></strong> area 14495 ha (coral reefs : 2698 ha)<br />
<strong>Wetl<strong>and</strong></strong> Type Coral Reefs, Inter-tidal mudflats, mangroves etc.<br />
Average annual rainfall : 300 mm<br />
Climate<br />
The mean maximum temperature is 40 o C, <strong>and</strong> the minimum <strong>of</strong> 7 o C.<br />
<strong>Wetl<strong>and</strong></strong> site is located in southern part <strong>of</strong> Gulf <strong>of</strong> Kachchh at Karumbhar <strong>and</strong> surrounding Isl<strong>and</strong>s..<br />
Description This site is famous for its coral formations which are now the only living reefs between the Arabian<br />
Gulf <strong>and</strong> Laccadives. The reefs are generally restricted to areas exposed to strong tidal currents,<br />
<strong>and</strong> living reefs are confined to the northern <strong>and</strong> western sides <strong>of</strong> the isl<strong>and</strong>s where the currents are<br />
strongest.<br />
Post-monsoon data (2006) Pre-monsoon data (2007)<br />
Plate 18: Coral Reefs <strong>of</strong> Gulf <strong>of</strong> Kachchh<br />
160
Plate 19: <strong>Wetl<strong>and</strong></strong> map - 5 km buffer area <strong>of</strong> Coral Reefs <strong>of</strong> Gulf <strong>of</strong> Kachchh<br />
161
162
Plate 20: IRS LISS III FCC - 5 km buffer area <strong>of</strong> Coral Reefs <strong>of</strong> Gulf <strong>of</strong> Kachchh<br />
163
9.7 Dharoi Reservoir<br />
Name Dharoi Reservoir<br />
Location<br />
Area 10053 ha<br />
23 o 59’ 08” to 24 o 04’ 39” N Latitude <strong>and</strong><br />
72 o 48’ 43” to 72 o 59’ 55” E Longitude<br />
<strong>Wetl<strong>and</strong></strong> Type Reservoir<br />
Semi-arid climate with average annual rainfall <strong>of</strong> 300 mm<br />
Climate<br />
Mean maximum temperature is 40 o c, <strong>and</strong> the minimum 7 o c.<br />
Description Located at Dharoi in Sabarkantha district. The Dharoi Dam was built for supplying drinking water to<br />
urban area such as Ahmedabad that is located 85 km away. The Dam was constructed across the<br />
Sabarmati River in 1973. The Dam is also one <strong>of</strong> the tourist spots in the state.<br />
Turbidity Low to Moderate<br />
Post monsoon data (2006)<br />
Pre monsoon data (2007)<br />
Plate 21: Dharoi Reservoir<br />
164
Plate 22: <strong>Wetl<strong>and</strong></strong> map - 5 km buffer area <strong>of</strong> Dharoi Reservoir<br />
165
166
Plate 23: IRS LISS III FCC - 5 km buffer area <strong>of</strong> Dharoi Resevoir<br />
167
9.8 Ukai Reservoir<br />
Name Ukai Reservoir<br />
Location<br />
Area 49401 ha<br />
21 o 10’ 06” to 21 o 31’ 53” N Latitude <strong>and</strong><br />
73 o 35’ 15” to 74 o 08’ 41” E Longitude<br />
<strong>Wetl<strong>and</strong></strong> Type Reservoir<br />
Average annual rainfall <strong>of</strong> about 900 mm concentrated in July <strong>and</strong> August.<br />
Climate<br />
The mean maximum temperature is 40 o c, <strong>and</strong> the minimum 10 o c.<br />
Ukai Dam near Surat is known as a mega project in the state. Ukai is constructed on the river Tapi.<br />
Description It is major irrigation scheme <strong>of</strong> South <strong>Gujarat</strong>. The reservoir is also providing water for domestic <strong>and</strong><br />
industrial usage in Surat <strong>and</strong> surrounding area.<br />
Turbidity Low<br />
Post monsoon data (2006)<br />
Pre monsoon data (2007)<br />
Plate 24: Ukai Reservoir<br />
168
Plate 25: <strong>Wetl<strong>and</strong></strong> map - 5 km buffer area <strong>of</strong> Ukai Reservoir<br />
169
170
Plate 26: IRS LISS III FCC - 5 km buffer area <strong>of</strong> Ukai Reservoir<br />
171
9.9 Kerly Lagoon<br />
Name Kerly Lagoon<br />
Location<br />
21 o 31’ 56” to 21 o 41’ 37” N Latitude <strong>and</strong><br />
69 o 32’ 25” to 69 o 50’ 39” E Longitude<br />
Located at South-East part <strong>of</strong> Porb<strong>and</strong>ar city<br />
Area<br />
9670 ha<br />
<strong>Wetl<strong>and</strong></strong> Type<br />
Climate<br />
Description<br />
Lagoon<br />
Turbidity Moderate to High<br />
Average annual rainfall <strong>of</strong> about 400 mm concentrated in July - September.<br />
The mean maximum temperature is 39 o c, <strong>and</strong> the minimum 12 o c.<br />
This lagoon is located at south-east <strong>of</strong> Porb<strong>and</strong>er city is basically a mudflat inundated during<br />
monsoon season. It is a very shallow in nature <strong>and</strong> the extent <strong>of</strong> water spread is governed by the<br />
high tides. The saline water enters through western part <strong>of</strong> the lagoon <strong>and</strong> the connectivity is<br />
segmented during pre-monsoon season due to extraction <strong>of</strong> salt through saltpans. Fresh water<br />
enters through river/streams in the north-eastern part <strong>of</strong> the lagoon <strong>and</strong> species composition is<br />
mainly fresh water type. It attract large number <strong>of</strong> migratory birds mainly flamingoes due to rich<br />
phytoplankton population.<br />
Post monsoon data (2006)<br />
Pre monsoon data (2007)<br />
Plate 27: Kerly Lagoon<br />
172
Plate 28: <strong>Wetl<strong>and</strong></strong> map - 5 km buffer area <strong>of</strong> Kerly Lagoon<br />
173
174
Plate 29: IRS LISS III FCC - 5 km buffer area <strong>of</strong> Kerly Lagoon<br />
175
176
SOI MAP SHEET-WISE WETLAND MAPS<br />
(Selected)<br />
177
178
179
180
181
182
183
184
185
186
187
188
189
190
191
192
REFERENCES<br />
1. Anon. 2005, NNRMS St<strong>and</strong>ards. A <strong>National</strong> St<strong>and</strong>ards for EO images, thematic & cartographic<br />
maps, GIS databases <strong>and</strong> spatial outputs. ISRO:NNRMS: TR:112:2005. A Committee Report:<br />
<strong>National</strong> Natural Resources Management System, Bangalore<br />
2. Anon. 1993. Directory <strong>of</strong> Indian <strong>Wetl<strong>and</strong></strong>s, 1993. WWF India, New Delhi <strong>and</strong> AWB Kuala Limpur,<br />
xvi+264pp., 32 maps.<br />
3. Clark, John R. (1977). Coastal Ecosystem Management, A Wiley Interscience Publication, John<br />
Wiley & Sons, New York,.<br />
4. Cowardin, L.M., Carter, V., Golet, E.C. <strong>and</strong> La Roe (1979). Classification <strong>of</strong> wetl<strong>and</strong>s <strong>and</strong> deep water<br />
habitats. USFWS/085-79/31, Office <strong>of</strong> the Biological Services, U.S. Fish <strong>and</strong> Wildlife Service,<br />
Washington, D.C.<br />
5. Encyclopaedic Directory <strong>of</strong> <strong>Environment</strong> (1988). (Ed. By G.R. Chatwal, D.K. P<strong>and</strong>ey, <strong>and</strong> K.K.<br />
N<strong>and</strong>a). Vol. I-IV, Anmol Publications, New Delhi.<br />
6. Garg, J.K., Singh, T.S. <strong>and</strong> Murthy, T.V.R. (1998). <strong>Wetl<strong>and</strong></strong>s <strong>of</strong> India. Project Report:<br />
RSAM/sac/resa/pr/01/98, June 1998, 240 p. Space Applications Centre, Ahmedabad,<br />
7. Garg J.K. <strong>and</strong> Patel J. G., 2007. <strong>National</strong> <strong>Wetl<strong>and</strong></strong> Inventory <strong>and</strong> Assessment, Technical Guidelines<br />
<strong>and</strong> Procedure Manual, Technical Report, SAC/EOAM/AFEG/NWIA/TR/01/2007, June 2007, Space<br />
Applications Centre, Ahmedabad,<br />
8. Glossary <strong>of</strong> Geology (1974). (Ed. By Margarate G., Robbert, M. Jr. <strong>and</strong> Wolf, C.L), American<br />
Geological Institute, Washington, D.C..<br />
9. Jensen, J.R. (1986). Introductory Digital Image Processing: A Remote Sensing Perspective, Prentice<br />
Hall, Englewoods Cliff, NJ.<br />
10. Lacaux, J.P., Tourre, Y.M., Vignolles, C., Ndione, J.A. <strong>and</strong> Lafaye, M. 2007. Classification <strong>of</strong> ponds<br />
from high-spatial resolution remote sensing: Application to Rift valley fever epidemics in Senegal.<br />
Remote Sensing <strong>of</strong> <strong>Environment</strong>, 106, pp. 66-74<br />
11. Lilles<strong>and</strong>, T.M. <strong>and</strong> Keifer, R.W. 1987. Remote Sensing <strong>and</strong> Image Interpretation. John Wliey <strong>and</strong><br />
Sons, New York.<br />
12. Manorama Yearbook 2007<br />
13. McGraw - Hill Encyclopaedia <strong>of</strong> <strong>Environment</strong>al Science (1974). (Ed. Sybil P. Parkar), McGraw-Hill<br />
Book Company, New York.<br />
14. McFeeters, S.K. 1996. The use <strong>of</strong> Normalised Difference Water Index (NDWI) in the delineation <strong>of</strong><br />
open water features. International Journal <strong>of</strong> remote Sensing, 7, pp. 1425-1432.<br />
15. Millennium Ecosystem Assessment. 2005, Ecosystems <strong>and</strong> Human Well-being: A Framework for<br />
Assessment, http://www.MAweb.org<br />
16. Mitsch, William J. <strong>and</strong> Gosselink, James G. (1986). <strong>Wetl<strong>and</strong></strong>s, Van Nostr<strong>and</strong> Reinhold Company,<br />
New York.<br />
17. Navalgund, R.R., Nayak, S.R., Sudarshana, R., Nagaraja, R. <strong>and</strong> Ravindran, S. 2002. Proceedings<br />
<strong>of</strong> the ISPRS Commission VII. Symposium on Resource <strong>and</strong> <strong>Environment</strong>al Monitoring, IAPRS &<br />
SIS, Vol.35, Part-7, NRSA, Hyderabad.<br />
18. Patel J.G., Singh T.S., Garg J.K. et al, <strong>Wetl<strong>and</strong></strong> Information System, West Bengal,<br />
SAC/RSAM/RESA/FLPG/WIS/01/2003, A Technical report: Space Applications Centre, Ahmedabad<br />
19. Ramsar Convention (2007). www.ramsar.org<br />
20. Reid, George K <strong>and</strong> Wood, Richard D. (1976). Ecology <strong>of</strong> Inl<strong>and</strong> Waters <strong>and</strong> Estuaries. D. Van<br />
Nostr<strong>and</strong> Company, New York.<br />
21. SACON, 2004, Inl<strong>and</strong> <strong>Wetl<strong>and</strong></strong>s <strong>of</strong> India : Conservation <strong>Atlas</strong>. Coimbatore, Salim Ali Centre for<br />
Ornithology <strong>and</strong> Natural History, 2004, ISBN 81-902136-1-X. ,Vedams eBooks (P) Ltd. Vardhaman<br />
Charve Plaza IV, Building # 9, K.P Block, Pitampura,<br />
22. Singh T.S., Patel J.G., Garg J.K. et al. Loktak Lake Resources Information System (LRIS),<br />
SAC/RSAM/RESIPA/FLPG/WIS/02/2003, A Technical report: Space Applications Centre,<br />
Ahmedabad<br />
23. Townshend, J.R., <strong>and</strong> Justice, C.O. 1986. Analysis <strong>of</strong> dynamics <strong>of</strong> African vegetation using the<br />
Normalised difference Vegetation Index. International Journal <strong>of</strong> Remote Sensing, 7, pp. 1435-1445.<br />
24. Tucker, C.J. <strong>and</strong> Sellers, P.J. 1986. Satellite remote sensing <strong>of</strong> primary productivity. International<br />
Journal <strong>of</strong> Remote Sensing, 7, pp. 1395-1416.<br />
25. Xu Hanqiu, 2006. Modification <strong>of</strong> normalised difference water index (NDWI) to enhance open water<br />
features in remotely sensed imagery. International Journal <strong>of</strong> Remote Sensing, 7, pp. 3025-3033.<br />
193
194
Annexure I<br />
Definitions <strong>of</strong> wetl<strong>and</strong> categories used in the project<br />
For ease <strong>of</strong> underst<strong>and</strong>ing, definitions <strong>of</strong> wetl<strong>and</strong> categories <strong>and</strong> their typical appearance on satellite imagery is given<br />
below:<br />
<strong>Wetl<strong>and</strong></strong><br />
Definition <strong>and</strong> description<br />
type code<br />
1000 Inl<strong>and</strong> <strong>Wetl<strong>and</strong></strong>s<br />
1100 Natural<br />
1101 Lakes: Larger bodies <strong>of</strong> st<strong>and</strong>ing water occupying distinct basins (Reid et al, 1976). These wetl<strong>and</strong>s<br />
occur in natural depressions <strong>and</strong> normally fed by streams/rivers. On satellite images lakes appear in<br />
different hues <strong>of</strong> blue interspersed with pink (aquatic vegetation), isl<strong>and</strong>s (white if unvegetated, red in<br />
case <strong>of</strong> terrestrial vegetation). Vegetation if scattered make texture rough.<br />
1102 Ox-bow lakes/ Cut <strong>of</strong>f me<strong>and</strong>ers: A me<strong>and</strong>ering stream may erode the outside shores <strong>of</strong> its broad<br />
bends, <strong>and</strong> in time the loops may become cut-<strong>of</strong>f, leaving basins. The resulting shallow crescentshaped<br />
lakes are called oxbow lakes (Reid et al, 1976). On the satellite image Ox-bow lakes occur<br />
near the rivers in plain areas. Some part <strong>of</strong> the lake normally has aquatic vegetation (red/pink in<br />
colour) during pre-monsoon season.<br />
1103 High Altitude lakes: These lakes occur in the Himalayan region. L<strong>and</strong>scapes around high lakes are<br />
characterized by hilly topography. Otherwise they resemble lakes in the plain areas. For keeping<br />
uniformity in the delineation <strong>of</strong> these lakes contour line <strong>of</strong> 3000 m above msl will be taken as<br />
reference <strong>and</strong> all lakes above this contour line will be classified as high altitude lakes.<br />
1104 Riverine <strong>Wetl<strong>and</strong></strong>s: Along the major rivers, especially in plains water accumulates leading to<br />
formation <strong>of</strong> marshes <strong>and</strong> swamp. Swamps are ‘<strong>Wetl<strong>and</strong></strong> dominated by trees or shrubs’ (U.S.<br />
Definition). In Europe, a forested fen (a peat accumulating wetl<strong>and</strong> that has no significant inflows or<br />
outflows <strong>and</strong> supports acidophilic mosses, particularly Sphagnum) could be called a swamp. In some<br />
areas reed grass - dominated wetl<strong>and</strong>s are also called swamps). (Mitsch <strong>and</strong> Gosselink, 1986).<br />
Marsh: A frequently or continually inundated wetl<strong>and</strong> characterised by emergent herbaceous<br />
vegetation adapted to saturated soil conditions. In European terminology a marsh has a mineral soil<br />
substrate <strong>and</strong> does not accumulate peat (Mitsch <strong>and</strong> Gosselink, 1986). Tone is grey blue <strong>and</strong> texture<br />
is smooth.<br />
Comment: Using satellite data it is difficult to differentiate between swamp <strong>and</strong> marsh. Hence, both<br />
have been clubbed together.<br />
1105 Waterlogged: Said <strong>of</strong> an area in which water st<strong>and</strong>s near, at, or above the l<strong>and</strong> surface, so that the<br />
roots <strong>of</strong> all plants except hydrophytes are drowned <strong>and</strong> the plants die (Margarate et al, 1974). Floods<br />
or unlined canal seepage <strong>and</strong> other irrigation network may cause waterlogging. Spectrally, during the<br />
period when surface water exists, waterlogged areas appear more or less similar to lakes/ponds.<br />
However, during dry season large or all parts <strong>of</strong> such areas dry up <strong>and</strong> give the appearance <strong>of</strong><br />
mud/salt flats (grey bluish).<br />
1106 River/stream: Rivers are linear water features <strong>of</strong> the l<strong>and</strong>scape. Rivers that are wider than the<br />
mapping unit will be mapped as polygons. Its importance arises from the fact that many stretches <strong>of</strong><br />
the rivers in Indo-Gangetic Plains <strong>and</strong> peninsular India are declared important national <strong>and</strong><br />
international wetl<strong>and</strong>s (Ex. The river Ganga between Brajghat <strong>and</strong> Garh Mukteshwar, is a Ramsar site,<br />
Ranganthattu on the Cavery river is a bird sanctuary etc.). Wherever, rivers are wide <strong>and</strong> features like<br />
s<strong>and</strong> bars etc. are visible, they will be mapped.<br />
1200 Man-made<br />
1201<br />
Reservoir: A pond or lake built for the storage <strong>of</strong> water, usually by the construction <strong>of</strong> a dam across a<br />
river (Margarate et al, 1974). On RS images, reservoirs have irregular boundary behind a prominent<br />
dyke. <strong>Wetl<strong>and</strong></strong> boundary in case <strong>of</strong> reservoir incorporates water, aquatic vegetation <strong>and</strong> footprint <strong>of</strong><br />
water as well. In the accompanying images aquatic vegetation in the reservoir is seen in bright pink<br />
tone. Tone is dark blue in deep reservoirs while it is ink blue in case <strong>of</strong> shallow reservoirs or reservoirs<br />
with high silt load. These will be annotated as Reservoirs/Dam.<br />
Barrage: Dykes are constructed in the plain areas over rivers for creating Irrigation/water facilities.<br />
Such water storage areas develop into wetl<strong>and</strong>s (Harike Barrage on Satluj – a Ramsar site, Okhla<br />
barrage on the Yamuna etc. – a bird sanctuary). Water appears in dark blue tone with a smooth<br />
texture. Aquatic vegetation appears in pink colour, which is scattered, or contiguous depending on the<br />
density. Reservoirs formed by barrages will be annotated as reservoir/barrage.<br />
195
1202 Tanks/Ponds: A term used in Ceylon <strong>and</strong> the drier parts <strong>of</strong> Peninsular India for an artificial pond, pool<br />
or lake formed by building a mud wall across the valley <strong>of</strong> a small stream to retain the monsoon<br />
(Margarate et al, 1974). Ponds Generally, suggest a small, quiet body <strong>of</strong> st<strong>and</strong>ing water, usually<br />
shallow enough to permit the growth <strong>of</strong> rooted plants from one shore to another (Reid et al, 1976).<br />
Tanks appear in light blue colour showing bottom reflectance.<br />
In this category Industrial ponds/mining pools mainly comprising Ab<strong>and</strong>oned Quarries are also<br />
included (Quarry is defined as "An open or surface working or excavation for the extraction <strong>of</strong> stone,<br />
ore, coal, gravel or minerals." In such pits water accumulate (McGraw Hill Encyclopaedia <strong>of</strong><br />
<strong>Environment</strong>al Sciences, 1974), Ash pond/Cooling pond (The water body created for discharging<br />
effluents in industry, especially in thermal power plants (Encyclopaedic Directory <strong>of</strong> <strong>Environment</strong>,<br />
1988) <strong>and</strong> Cooling pond: An artificial lake used for the natural cooling <strong>of</strong> condenser-cooling water<br />
serving a conventional power station (Encyclopaedic Directory <strong>of</strong> <strong>Environment</strong>, 1988). These ponds<br />
can be <strong>of</strong> any shape <strong>and</strong> size. Texture is rough <strong>and</strong> tonal appearance light (quarry) to blue shade<br />
(cooling pond).<br />
1203 Waterlogged : Man-made activities like canals cause waterlogging in adjacent areas due to seepage<br />
especially when canals are unlined. Such areas can be identified on the images along canal network.<br />
Tonal appearance is in various hues <strong>of</strong> blue. Sometimes, such waterlogged areas dry up <strong>and</strong> leave<br />
white scars on the l<strong>and</strong>. Texture is smooth.<br />
1204 Salt pans: Inl<strong>and</strong> salt pans in India occur in Rajasthan (Sambhar lake). These are shallow rectangular<br />
man-made depressions in which saline water is accumulated for drying in the sun for making salt.<br />
2000 Coastal <strong>Wetl<strong>and</strong></strong>s<br />
2100 Natural<br />
2101 Lagoons/Backwaters: Such coastal bodies <strong>of</strong> water, partly separated from the sea by barrier<br />
beaches or bass <strong>of</strong> marine origin, are more properly termed lagoons. As a rule, lagoons are elongate<br />
<strong>and</strong> lie parallel to the shoreline. They are usually characteristic <strong>of</strong>, but not restricted to, shores <strong>of</strong><br />
emergence. Lagoons are generally shallower <strong>and</strong> more saline than typical estuaries (Reid et al, 1976).<br />
Backwater: A creek, arm <strong>of</strong> the sea or series <strong>of</strong> connected lagoons, usually parallel to the coast,<br />
separated from the sea by a narrow strip <strong>of</strong> l<strong>and</strong> but communicating with it through barred outlets<br />
(Margarate et al, 1974).<br />
2102 Creek: A notable physiographic feature <strong>of</strong> salt marshes, especially low marshes. These creeks<br />
develop as do rivers "with minor irregularities sooner or later causing the water to be deflected into<br />
definite channels" (Mitsch <strong>and</strong> Gosselink, 1986). Creeks will be delineated, however, their area will<br />
not be estimated.<br />
2103 S<strong>and</strong>/Beach: Beach is an unvegetated part <strong>of</strong> the shoreline formed <strong>of</strong> loose material, usually s<strong>and</strong><br />
that extends from the upper berm (a ridge or ridges on the backshore <strong>of</strong> the beach, formed by the<br />
deposit <strong>of</strong> material by wave action, that marks the upper limit <strong>of</strong> ordinary high tides <strong>and</strong> wave wash to<br />
low water mark(Clark,1977).Beach comprising rocky material is called rocky beach.<br />
2104 Intertidal mudflats: Most unvegetated areas that are alternately exposed <strong>and</strong> inundated by the<br />
falling <strong>and</strong> rising <strong>of</strong> the tide. They may be mudflats or s<strong>and</strong> flats depending on the coarseness <strong>of</strong> the<br />
material <strong>of</strong> which they are made (Clark, 1977).<br />
2105 Salt Marsh: Natural or semi-natural halophytic grassl<strong>and</strong> <strong>and</strong> dwarf brushwood on the alluvial<br />
sediments bordering saline water bodies whose water level fluctuates either tidally or non- tidally<br />
(Mitsch <strong>and</strong> Gosselink, 1986). Salt marshes look in grey blue shade when wet.<br />
2106 Mangroves: The mangrove swamp is an association <strong>of</strong> halophytic trees, shrubs, <strong>and</strong> other plants<br />
growing in brackish to saline tidal waters <strong>of</strong> tropical <strong>and</strong> sub-tropical coastlines (Mitsch <strong>and</strong> Gosselink,<br />
1986). On the satellite images mangroves occur in red colour if in contiguous patch. When mangrove<br />
associations are scattered or are degraded then instead <strong>of</strong> red colour, brick red colour may be seen.<br />
2107 Coral reefs: Consolidated living colonies <strong>of</strong> microscopic organisms found in warm tropical waters. The<br />
term coral reef, or organic reef is applied to the rock- like reefs built-up <strong>of</strong> living things, principally<br />
corals. They consist <strong>of</strong> accumulations <strong>of</strong> calcareous deposits <strong>of</strong> corals <strong>and</strong> corraline algae with the<br />
intervening space connected with s<strong>and</strong>, which consists largely <strong>of</strong> shells <strong>of</strong> foraminefera. Present reefs<br />
are living associations growing on this accumulation <strong>of</strong> past (Clark, 1977). Reefs appear in light blue<br />
shade.<br />
2200 Man-made<br />
2201 Salt pans: An undrained usually small <strong>and</strong> shallow rectangular, man-made depression or hollow in<br />
which saline water accumulates <strong>and</strong> evaporates leaving a salt deposit (Margarate et al, 1974). Salt<br />
pans are square or rectangular in shape. When water is there appearance is blue while salt is formed<br />
tone is white.<br />
2202 Aquaculture ponds: Aquaculture is defined as "The breeding <strong>and</strong> rearing <strong>of</strong> fresh-water or marine<br />
fish in captivity. Fish farming or ranching". The water bodies used for the above are called aquaculture<br />
ponds (Encyclopaedic Directory <strong>of</strong> <strong>Environment</strong>, 1988). Aquaculture ponds are geometrical in shape<br />
usually square or rectangular. Tone is blue.<br />
196
Annexure – II<br />
Details <strong>of</strong> District information followed in the atlas<br />
Source: Survey <strong>of</strong> India (Surveyed in 2004 <strong>and</strong> published in 2005)<br />
197
198
Space Applications Centre (SAC) is one <strong>of</strong> the major<br />
centres <strong>of</strong> the Indian Space Research Organisation<br />
(ISRO). It is a unique centre dealing with a wide variety <strong>of</strong><br />
disciplines comprising design <strong>and</strong> development <strong>of</strong><br />
payloads, societal applications, capacity building <strong>and</strong><br />
space sciences, thereby creating a synergy <strong>of</strong><br />
technology, science <strong>and</strong> applications. The Centre is<br />
responsible for the development, realisation <strong>and</strong><br />
qualification <strong>of</strong> communication, navigation, earth &<br />
planetary observation, meteorological payloads <strong>and</strong><br />
related data processing <strong>and</strong> ground systems. Several<br />
national level application programmes in the area <strong>of</strong><br />
natural resources, weather <strong>and</strong> environmental studies,<br />
disaster monitoring/mitigation, etc are also carried out. It<br />
is playing an important role in harnessing space<br />
technology for a wide variety <strong>of</strong> applications for societal<br />
benefits.<br />
SAC is a host institution for the training programmes<br />
related to Satellite Communication, Satellite Meteorology<br />
<strong>and</strong> global change under the Centre for Space Science &<br />
Technology Education in Asia <strong>and</strong> the Pacific (CSSTEAP)<br />
affiliated to the United Nations (UN).<br />
http://www.isro.org
Space Applications centre<br />
Indian Space Research Organisation<br />
Ahmedabad – 380 015