towards improved death receptor targeted therapy for ... - TI Pharma
towards improved death receptor targeted therapy for ... - TI Pharma towards improved death receptor targeted therapy for ... - TI Pharma
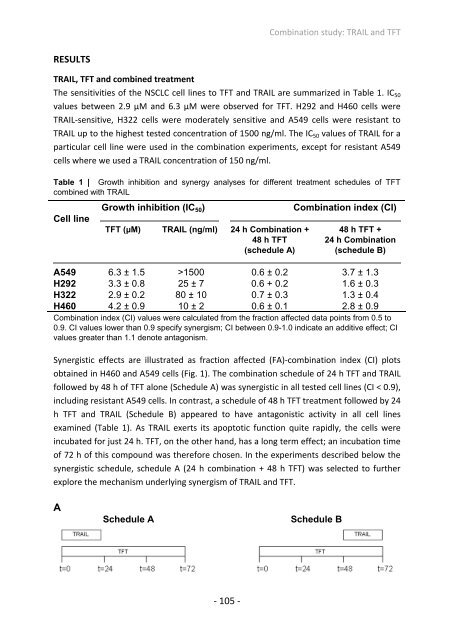
RESULTS Combination study: TRAIL and TFT TRAIL, TFT and combined treatment The sensitivities of the NSCLC cell lines to TFT and TRAIL are summarized in Table 1. IC50 values between 2.9 µM and 6.3 µM were observed for TFT. H292 and H460 cells were TRAIL‐sensitive, H322 cells were moderately sensitive and A549 cells were resistant to TRAIL up to the highest tested concentration of 1500 ng/ml. The IC50 values of TRAIL for a particular cell line were used in the combination experiments, except for resistant A549 cells where we used a TRAIL concentration of 150 ng/ml. Table 1 | Growth inhibition and synergy analyses for different treatment schedules of TFT combined with TRAIL Cell line Growth inhibition (IC50) Combination index (CI) TFT (µM) TRAIL (ng/ml) 24 h Combination + 48 h TFT (schedule A) 48 h TFT + 24 h Combination (schedule B) A549 6.3 ± 1.5 >1500 0.6 ± 0.2 3.7 ± 1.3 H292 3.3 ± 0.8 25 ± 7 0.6 + 0.2 1.6 ± 0.3 H322 2.9 ± 0.2 80 ± 10 0.7 ± 0.3 1.3 ± 0.4 H460 4.2 ± 0.9 10 ± 2 0.6 ± 0.1 2.8 ± 0.9 Combination index (CI) values were calculated from the fraction affected data points from 0.5 to 0.9. CI values lower than 0.9 specify synergism; CI between 0.9-1.0 indicate an additive effect; CI values greater than 1.1 denote antagonism. Synergistic effects are illustrated as fraction affected (FA)‐combination index (CI) plots obtained in H460 and A549 cells (Fig. 1). The combination schedule of 24 h TFT and TRAIL followed by 48 h of TFT alone (Schedule A) was synergistic in all tested cell lines (CI < 0.9), including resistant A549 cells. In contrast, a schedule of 48 h TFT treatment followed by 24 h TFT and TRAIL (Schedule B) appeared to have antagonistic activity in all cell lines examined (Table 1). As TRAIL exerts its apoptotic function quite rapidly, the cells were incubated for just 24 h. TFT, on the other hand, has a long term effect; an incubation time of 72 h of this compound was therefore chosen. In the experiments described below the synergistic schedule, schedule A (24 h combination + 48 h TFT) was selected to further explore the mechanism underlying synergism of TRAIL and TFT. A Schedule A Schedule B ‐ 105 ‐
Chapter 6 B H460 A549 Figure 1. Representative FA‐CI plot of combined TFT and TRAIL treatment in H460 and A549 cells using two different exposure schedules as indicated. (A) Cells were exposed to increasing concentrations of TFT for 72 h including 24 h exposure to a fixed IC50 concentration of TRAIL. TRAIL was added either the first 24 h, or the last 24 h in the presence of TFT and cytotoxicity was determined by MTT assays. (B) An average CI was calculated for data‐points with FA higher than 0.5. Effects on cell cycle progression The effects on cell cycle distribution were analyzed in time‐course experiments using flowcytometry on PI‐stained cells (Fig. 2A). In both H460 and A549 cells, 24 h exposure to TFT alone induced the accumulation of cells in the S‐phase while longer treatment, up to 72 h, was accompanied by an increase of cells in G2/M and a decrease in G1. This effect was most prominent in A549 cells. At the same time a strong rise in the percentage (up to around 35%) of death (sub‐G1) cells was found for both cell lines. TRAIL alone mildly affected the cell cycle distribution of H460 cells with a small increase of cells in G1. This pattern was more pronounced in A549 cells. When TRAIL was combined with TFT, in H460 cells an increase in G2/M cells was seen although lower than found in TFT‐treated cells. In A549 cells, the cell cycle profile after combined treatment resembled more that of TFT‐ treated cells, with increased S‐phase after 24 h followed by a pronounced accumulation of G2/M cells. In addition, only a very small percentage of A549 cells was detected in the S‐ phase after 48 and 72 h of combined treatment. Next, the treatments were examined for affecting the cell cycle regulatory proteins Chk1, Chk2, and Cdc25c. Chk1 and Chk2 are known to become phosphorylated after DNA damage resulting amongst others in inactivation of Cdc25c phosphatase by stimulating its proteasome‐dependent degradation leading to G2/M and G1/S phase arrest [22]. TFT treatment induced strong Chk2 phosphorylation in a time‐dependent manner, which correlated with a decrease in Cdc25c levels and G2/M arrest (Fig. 2A). Total Cdc25c levels decreased after 48 and 72 h treatment with TFT and even more rapidly after combination treatment reflecting its Chk‐induced phosphorylation‐dependent degradation. In H460 ‐ 106 ‐
- Page 55 and 56: Chapter 3 induced apoptosis in H460
- Page 57 and 58: Chapter 3 Reference List 1. Jemal A
- Page 59 and 60: Chapter 3 40. Domina AM, Vrana JA,
- Page 61 and 62: Chapter 4 ABSTRACT Tumor necrosis f
- Page 63 and 64: Chapter 4 role in the activation of
- Page 65 and 66: Chapter 4 the tip with a diameter o
- Page 67 and 68: Chapter 4 RESULTS TRAIL induces a s
- Page 69 and 70: Chapter 4 vehicle control or with 5
- Page 71 and 72: Chapter 4 Non‐canonical TRAIL res
- Page 73 and 74: Chapter 4 A549‐shRIP1 cells clear
- Page 75 and 76: Chapter 4 Figure 7. Inhibition of S
- Page 77 and 78: Chapter 4 DISCUSSION The TRAIL rece
- Page 79 and 80: Chapter 4 Src‐independent mechani
- Page 81 and 82: Chapter 4 variants. Cell Death Dis
- Page 83 and 84: Chapter 4 ‐ 82 ‐
- Page 85 and 86: Chapter 5 ABSTRACT TRAIL is an inte
- Page 87 and 88: Chapter 5 targets and subsequent pr
- Page 89 and 90: Chapter 5 RESULTS Synergistic activ
- Page 91 and 92: Chapter 5 ng/ml TRAIL (Fig. 3B). Ap
- Page 93 and 94: Chapter 5 by sub‐G1 levels in the
- Page 95 and 96: Chapter 5 DISCUSSION In the present
- Page 97 and 98: Chapter 5 Reference List 1. Jemal A
- Page 99 and 100: Chapter 5 ‐ 98 ‐
- Page 101 and 102: Chapter 6 ABSTRACT TRAIL is a tumor
- Page 103 and 104: Chapter 6 various stress stimuli [1
- Page 105: Chapter 6 Subsequently, the membran
- Page 109 and 110: Chapter 6 TRAIL‐dependent cell de
- Page 111 and 112: Chapter 6 B H460 A549 C Figure 4 (c
- Page 113 and 114: Chapter 6 Figure 5 (continued). Mec
- Page 115 and 116: Chapter 6 regulation and checkpoint
- Page 117 and 118: Chapter 6 mechanism of immune evasi
- Page 119 and 120: Chapter 7 ABSTRACT Thymidine phosph
- Page 121 and 122: Chapter 7 Figure 1. Schematic overv
- Page 123 and 124: Chapter 7 that was measured before
- Page 125 and 126: Chapter 7 RESULTS TdR conversion to
- Page 127 and 128: Chapter 7 dR is secreted from the c
- Page 129 and 130: Chapter 7 Figure 4. Accumulation of
- Page 131 and 132: Chapter 7 angiogenic properties. Ho
- Page 133 and 134: Chapter 7 activity of enzymes. Natu
- Page 135 and 136: Chapter 7 ‐ 134 ‐
- Page 137 and 138: Chapter 8 SUMMARIZING DISCUSSION AN
- Page 139 and 140: Chapter 8 Recently, various differe
- Page 141 and 142: Chapter 8 in phase II clinical tria
- Page 143 and 144: Chapter 8 Reference List 1. Herbst
- Page 145 and 146: Chapter 8 ‐ 144 ‐
- Page 147 and 148: Chapter 9 NEDERLANDSE SAMENVATTING
- Page 149 and 150: Chapter 9 waargenomen. Het gebruik
- Page 151 and 152: Chapter 9 CONCLUSIE Het activeren v
- Page 153 and 154: zelfs na werktijden (lees 23:45) ko
- Page 155 and 156: Verder wil ik ook dr. Eric Ronken b
RESULTS<br />
Combination study: TRAIL and TFT<br />
TRAIL, TFT and combined treatment<br />
The sensitivities of the NSCLC cell lines to TFT and TRAIL are summarized in Table 1. IC50<br />
values between 2.9 µM and 6.3 µM were observed <strong>for</strong> TFT. H292 and H460 cells were<br />
TRAIL‐sensitive, H322 cells were moderately sensitive and A549 cells were resistant to<br />
TRAIL up to the highest tested concentration of 1500 ng/ml. The IC50 values of TRAIL <strong>for</strong> a<br />
particular cell line were used in the combination experiments, except <strong>for</strong> resistant A549<br />
cells where we used a TRAIL concentration of 150 ng/ml.<br />
Table 1 | Growth inhibition and synergy analyses <strong>for</strong> different treatment schedules of TFT<br />
combined with TRAIL<br />
Cell line<br />
Growth inhibition (IC50) Combination index (CI)<br />
TFT (µM) TRAIL (ng/ml) 24 h Combination +<br />
48 h TFT<br />
(schedule A)<br />
48 h TFT +<br />
24 h Combination<br />
(schedule B)<br />
A549 6.3 ± 1.5 >1500 0.6 ± 0.2 3.7 ± 1.3<br />
H292 3.3 ± 0.8 25 ± 7 0.6 + 0.2 1.6 ± 0.3<br />
H322 2.9 ± 0.2 80 ± 10 0.7 ± 0.3 1.3 ± 0.4<br />
H460 4.2 ± 0.9 10 ± 2 0.6 ± 0.1 2.8 ± 0.9<br />
Combination index (CI) values were calculated from the fraction affected data points from 0.5 to<br />
0.9. CI values lower than 0.9 specify synergism; CI between 0.9-1.0 indicate an additive effect; CI<br />
values greater than 1.1 denote antagonism.<br />
Synergistic effects are illustrated as fraction affected (FA)‐combination index (CI) plots<br />
obtained in H460 and A549 cells (Fig. 1). The combination schedule of 24 h TFT and TRAIL<br />
followed by 48 h of TFT alone (Schedule A) was synergistic in all tested cell lines (CI < 0.9),<br />
including resistant A549 cells. In contrast, a schedule of 48 h TFT treatment followed by 24<br />
h TFT and TRAIL (Schedule B) appeared to have antagonistic activity in all cell lines<br />
examined (Table 1). As TRAIL exerts its apoptotic function quite rapidly, the cells were<br />
incubated <strong>for</strong> just 24 h. TFT, on the other hand, has a long term effect; an incubation time<br />
of 72 h of this compound was there<strong>for</strong>e chosen. In the experiments described below the<br />
synergistic schedule, schedule A (24 h combination + 48 h TFT) was selected to further<br />
explore the mechanism underlying synergism of TRAIL and TFT.<br />
A<br />
Schedule A Schedule B<br />
‐ 105 ‐


