Using SPSS Statistics Syntax - University of Massachusetts Amherst
Using SPSS Statistics Syntax - University of Massachusetts Amherst
Using SPSS Statistics Syntax - University of Massachusetts Amherst
Create successful ePaper yourself
Turn your PDF publications into a flip-book with our unique Google optimized e-Paper software.
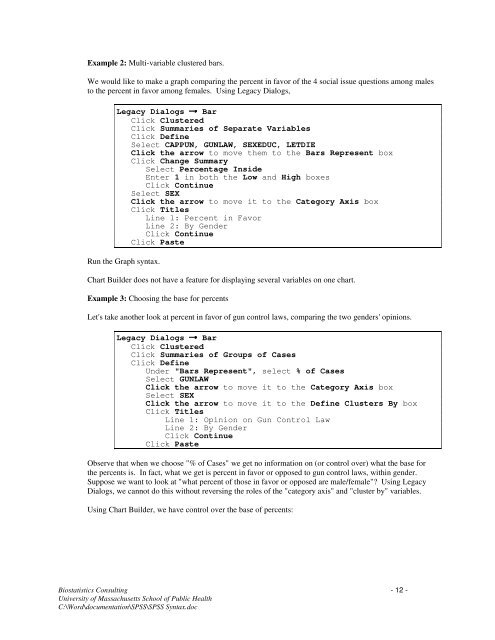
Example 2: Multi-variable clustered bars.<br />
We would like to make a graph comparing the percent in favor <strong>of</strong> the 4 social issue questions among males<br />
to the percent in favor among females. <strong>Using</strong> Legacy Dialogs,<br />
Legacy Dialogs Bar<br />
Click Clustered<br />
Click Summaries <strong>of</strong> Separate Variables<br />
Click Define<br />
Select CAPPUN, GUNLAW, SEXEDUC, LETDIE<br />
Click the arrow to move them to the Bars Represent box<br />
Click Change Summary<br />
Select Percentage Inside<br />
Enter 1 in both the Low and High boxes<br />
Click Continue<br />
Select SEX<br />
Click the arrow to move it to the Category Axis box<br />
Click Titles<br />
Line 1: Percent in Favor<br />
Line 2: By Gender<br />
Click Continue<br />
→<br />
Click Paste<br />
Run the Graph syntax.<br />
Chart Builder does not have a feature for displaying several variables on one chart.<br />
Example 3: Choosing the base for percents<br />
Let's take another look at percent in favor <strong>of</strong> gun control laws, comparing the two genders' opinions.<br />
Legacy Dialogs Bar<br />
Click Clustered<br />
Click Summaries <strong>of</strong> Groups <strong>of</strong> Cases<br />
Click Define<br />
Under "Bars Represent", select % <strong>of</strong> Cases<br />
Select GUNLAW<br />
Click the arrow to move it to the Category Axis box<br />
Select SEX<br />
Click the arrow to move it to the Define Clusters By box<br />
Click Titles<br />
Line 1: Opinion on Gun Control Law<br />
Line 2: By Gender<br />
Click Continue<br />
Click Paste<br />
→<br />
Observe that when we choose "% <strong>of</strong> Cases" we get no information on (or control over) what the base for<br />
the percents is. In fact, what we get is percent in favor or opposed to gun control laws, within gender.<br />
Suppose we want to look at "what percent <strong>of</strong> those in favor or opposed are male/female"? <strong>Using</strong> Legacy<br />
Dialogs, we cannot do this without reversing the roles <strong>of</strong> the "category axis" and "cluster by" variables.<br />
<strong>Using</strong> Chart Builder, we have control over the base <strong>of</strong> percents:<br />
Biostatistics Consulting - 12 -<br />
<strong>University</strong> <strong>of</strong> <strong>Massachusetts</strong> School <strong>of</strong> Public Health<br />
C:\Word\documentation\<strong>SPSS</strong>\<strong>SPSS</strong> <strong>Syntax</strong>.doc


